Evaluating the Quality of Higher Education Instructor-Constructed Multiple-Choice Tests: Impact on Student Grades
 Gavin T. L. Brown
 Hasan H. A. Abdulnabi
- 1The University of Auckland, Auckland, New Zealand
- 2AMA International University (Bahrain), Salmabad, Bahrain
Multiple-choice questions (MCQs) are commonly used in higher education assessment tasks because they can be easily and accurately scored, while giving good coverage of instructional content in a short time. However, studies that have evaluated the quality of MCQs used in higher education assessments have found many flawed items, resulting in misleading insights about student performance and contaminating important decisions. Thus, MCQs need to be evaluated statistically to ensure high-quality items are used as the basis of inference. This study evaluated the quality of 100 instructor-written MCQs used in an undergraduate midterm test (50 items) and final exam (50 items), making up 50% of the course grade, using the responses of 372 students enrolled in one first-year undergraduate general education course. Item difficulty, discrimination, and chance properties were determined using classical test theory and item response theory (IRT) statistical item analysis models. The two-parameter logistic (2PL) model consistently had the best fit to the data. The impact on overall course grades between the original raw score model and the IRT 2PL model showed 70% of students would receive the same grade (i.e., D to A), but only one-third would get the same mark using the standard augmented grade scale (i.e., A+ to D−). The analyses show that higher education institutions need to ensure MCQs are evaluated before student grading decisions are made.
Multiple-choice questions (MCQs) are one of the most commonly used assessment methods in higher education (DiBattista and Kurzawa, 2011; Bailey et al., 2012). However, its use varies by discipline (e.g., high use is seen in medical education) and jurisdiction (e.g., perhaps less so in the United Kingdom). MCQs are used because, in a short period of time, a broad range of course material can be efficiently assessed and accurately scored (DiBattista and Kurzawa, 2011; Nedeau-Cayo et al., 2013). However, the quality of the instructor-written MCQs used in higher education assessments is questionable and potentially results in misleading evidence of student achievement (Masters et al., 2001; Brady, 2005; Downing, 2005; Stagnaro-Green and Downing, 2006; Tarrant et al., 2006). This is an understandable situation since few academics have had formal education in assessment theory or the principles of MCQ item writing.
Evaluation of MCQ quality can be conducted through professional judgment processes relative to “best practice” conventions and advice (Haladyna, 2004). Four major foci have been identified: (1) content guidelines, (2) style and format, (3) writing the stem, and (4) writing options (Haladyna and Rodriguez, 2013). Implementation of these guidelines can and should be conducted automatically “in-house” by academics within each department or discipline, prior to deployment of the test or examination. The second approach for determining quality is the application of statistical item analysis procedures to determine the characteristics of items and use those statistics to decide if an item can be properly included in the determination of test-taker performance (Downing, 2006; Malau-Aduli and Zimitat, 2012).
Items which are (a) inappropriately difficult or easy, (b) too easy to guess at, or (c) do not discriminate positively between high and low performing learners will lead to inappropriate decisions about student ability and consequent decisions (e.g., pass-fail, graduation, access to scholarship, etc.). Furthermore, such items will also give inappropriate feedback to students and instructors. In both cases, the problem lies in poorly constructed items, rather than necessarily poorly delivered teaching or poor learning habits and strategies.
Statistical tools exist to evaluate item quality and are used extensively in high-stakes testing programs in international K-12 test systems, in national K-12 testing programs, and in high-stakes university admission testing. Unfortunately, the same cannot be said for higher education course assessments, especially those relying on MCQs. This is problematic since grades are awarded, in part, on the basis of performance on MCQ testing and, if little or no quality assurance is carried out, then invalid conclusions about student performance will be drawn. Hence, the lack of quality assurance processes, such as statistical item analysis or item evaluation, raises doubt as to the validity and legitimacy of scores, grades, and ultimately certificates and degrees. Thus, the goal of this study was to examine two operational MCQ-based tests within one course, using multiple statistical models, to determine (1) the quality of items and (2) possible implications for grading decisions. It is worth noting that, while this study involves MCQ items, the same issues and challenges exist for any dichotomously scored test question formats such as True-False, Mix-and-Match, and so on. The statistical problems are very similar, although the item quality indicators would be different.
Assessment in Higher Education
Assessments in higher education serve a wide range of functions, including formative (e.g., how and what to improve on) and summative (e.g., pass-fail decisions, entry to restricted programs, scholarships, graduation, etc.) (Yorke, 2009; Schaughency et al., 2012). Tested performance using MCQs is normally transformed into grades (e.g., A to D or E) which are meant represent the quality of students’ performance and level of achievement (Yorke, 2009). Grades are signals of achievement and show students their areas of strength and weakness and can inform instructors about the success of their teaching (Joughin, 2009; Yorke, 2009; Brown, 2010; Walvoord and Anderson, 2011). Obviously, the quality of assessment matters so that inferences and decisions by students and instructors, as well as external stakeholders (e.g., employers), can be made on a robust basis (Grainger et al., 2008).
Quality of MCQs in Higher Education
Despite the existence of guidelines for writing MCQs (Haladyna, 2004; Brady, 2005; Burton, 2005; Downing and Yudkowsky, 2009), studies have found many bad items and violations of recommended guidelines. Tarrant et al. (2006) evaluated 2,770 MCQs used over a five-year period from 2001 to 2005 and concluded that nearly half (46%) of the items were bad because they violated item-writing guidelines. Similar outcomes in higher education assessments are reported across different disciplines (Ellsworth et al., 1990; Hansen and Dexter, 1997; Masters et al., 2001; Downing, 2005). Poorly written MCQs can negatively impact students’ performance and achievement (Downing, 2005; Tarrant et al., 2006; Clifton and Schriner, 2010).
There is also concern that MCQs do not assess higher order thinking and focus too much on recall of knowledge (Downing, 2005; Tarrant et al., 2006; Walsh and Seldomridge, 2006; Popham, 2011; Malau-Aduli and Zimitat, 2012). Additionally, creating good MCQs is time-consuming and it is particularly difficult to create good distractors, especially for higher order thinking objectives (Fellenz, 2004; Clifton and Schriner, 2010). It has been proposed that poor item writing, rather than an inherent characteristic of MCQs, accounts for their tendency to assess lower order cognitive skills (Downing, 2005; Downing and Yudkowsky, 2009; Malau-Aduli and Zimitat, 2012). Fortunately, training in MCQ item writing has produced significantly higher quality MCQs (Jozefowicz et al., 2002).
Since MCQs contribute to course grades, a high score on an easy test may artificially inflate student grades. Likewise, the reverse occurs if the test was overly difficult resulting in artificially depressed grades. The problem of ensuring that item and test difficulty aligns with appropriate standards is complicated, especially if item difficulty is caused by poor writing. Without quality assurance and standard setting processes that take into account the difficulty of the test relative to the grade criteria, raw scores on a test have little meaning. Hence, MCQ tests and examinations need to be evaluated for the quality of the item writing and the statistical properties of the contributing items. Then, standards need to be derived for each test, using one of many methods available (Cizek, 2001), which map the test scores onto grade descriptors. While item quality and standard setting are complex human processes, the analysis of item properties is a more technically demanding statistical process.
Statistical Approaches to MCQ Item Quality
Two major classes of statistical methods can be applied to MCQs. These are known as classical test theory (CTT) and item response theory (IRT). The former examines tests as entities, while the latter evaluates items in and of themselves.
Classical Test Theory
The CTT approach determines item characteristics from the available observed data (Reynolds et al., 2009). CTT assumes that the total number of items answered correctly indicates the examinee’s level of ability or knowledge (de Ayala, 2009; Schaughency et al., 2012). In other words, students who get a higher proportion of items correct know more than those with a lower percentage correct. Most commonly, letter grades are associated with ranges of percentage correct (e.g., B = 70 to 79%) or a pass-score can be set at a proportion correct (e.g., 60%).
Classical test theory specifies that the score achieved by an individual examinee is equal to the sum of their theoretical true ability and the unobserved error component in the test. The proportion of candidates getting an item right (p) determines the difficulty of each item; items that are too easy (p > 0.80) or too hard (p < 0.20) are frequently rejected from a test as not providing useful information about candidate ability. Ideally, all items in a test discriminate positively between those who know most and those who know least. This is determined by examining the point-biserial correlation (rpb), which is the correlation of the item to the total after the item has been removed from the total. In many testing situations, items which do not have a significantly positive value (rpb > 0.20) are rejected, though any positive value indicates a tendency for higher scoring candidates to get individual items correct more than the lower scoring candidates (Ebel and Frisbie, 1991).
Another quality indicator of MCQ is the efficiency of the wrong answer distractors. Distractors that get selected infrequently (e.g., <5% of test-takers choose it) are so implausible that they seem to attract only candidates randomly guessing (Haladyna and Downing, 1993). Options with low selection rates have been found in up to nearly half of all items (Haladyna and Downing, 1993), between 30 and 40% of all items (Tarrant et al., 2009), and as many as 75% (Hingorjo and Jaleel, 2012). Hence, identification of such options and their subsequent replacement or deletion could improve item quality.
Test quality is accepted, generally, if the estimate of reliability (e.g., Cronbach’s alpha) is sufficient for the decisions being made. For example, for research purposes α > 0.70 is considered sufficient because the shared covariance of the items accounts for about 50% of the test score. However, in a high-stakes certification examination (e.g., Advanced Placement tests at the end of high school in the USA), very high reliability estimates (α > 0.90) are expected. Given the mean, standard deviation, and reliability estimate of a test, it is possible to calculate a standard error of measurement, which is the range of scores that each candidate would most likely get the next time they sat the exact same test (Harvill, 1991). The SEM indicates the number of marks a score could vary by chance, without any substantive change in the student’s ability and should be used in making decisions about quality or change. Thus, the CTT approach provides sufficient statistics to evaluate items for difficulty and discrimination.
However, in CTT examinee ability is “sample dependent” meaning that if the test is hard, the students will seem to be low achievers and vice versa (Hambleton et al., 1993). Similarly, items have difficulty values totally dependent on the ability of the sampled test takers, and so a change in their ability will change the item difficulty. This means that items will have very different characteristics depending on who attempted them and what other questions were present.
Item Response Theory
Because a test is a sample of a domain of interest, the real focus of interest in assessment is the learner’s ability in the domain, independent of the set of items presented in a test. Hence, a modern class of statistics (i.e., IRT) has arisen which permits items to be given different difficulties, discrimination, and guessing characteristics independent of the test in which they are presented (Hambleton et al., 1993; Embretson and Reise, 2000; Borsboom, 2005). IRT predicts the likelihood that an examinee with a specific ability level will correctly answer a specific item by defining the examinee’s ability in relation to the item characteristics (Embretson and Reise, 2000). This means that a person’s total score or ability can be estimated using a probabilistic formula based on the dual properties of the item and the test-taker’s performance (Hambleton and Jones, 1993).
All IRT models propose that the probability of answering an item has an S or ogive shape in which the probability of answering correctly increases probabilistically as the ability of the test-taker increases. The formula uses the natural log of the odds that an item is answered correctly over answered incorrectly. The S-shape of the item plot (i.e., probability of answering correctly on the vertical axis versus item difficulty and person ability on the horizontal axis) creates two asymptotes so that the probability approaches, but never reaches, certainty (p = 1.00 versus p = 0.00) even as ability reaches positive or negative infinity (Giblin, 1972). This shows that there is always the possibility for very low-ability students to answer an item correctly by chance, and vice versa. Since MCQs have multiple wrong answers, it is possible for a high-ability student to be misled and similarly, because the right answer is available, it is possible for a low-ability student to randomly select it.
The difficulty of an item is the point when the probability of answering the item correctly equals 50%. The ability of a person is defined as the difficulty of items for which the person has a probability of answering correctly at the 50% correct rate (Embretson and Reise, 2000). Unlike CTT, answering more questions correctly does not increase the overall ability estimate unless the items are hard. In other words, in IRT the person’s score goes up, not by answering a higher proportion of questions correctly, but by answering much harder questions. If the difficulty of items does not align well with the test takers’ ability (e.g., too many easy or very hard questions relative to performance) then the accuracy of the estimated score decreases.
Within IRT there are three major models with increasing complexity (Hambleton et al., 1993; Embretson and Reise, 2000; Osterlind and Wang, 2012).
One-Parameter Logistic Model (1PL) or Rasch Model
This approach assumes that all items have statistically equivalent discrimination and only differ in terms of their difficulty (Bond and Fox, 2007). The probability of guessing is assumed to be equal and very close to zero when ability is very low. Items are deemed to fit the Rasch model if the Chi-square (χ2) index is statistically not significant (Bond and Fox, 2007). Only items that are statistically equivalent to each other in terms of their slope and lower asymptotes are retained by the model. This can inadvertently mean that items with very strong positive discrimination could be rejected, simply because they differ too much from the model (Houts et al., 2016). It is important to note here that the Rasch model approach prioritizes the model which requires all items to conform to the assumptions and be statistically equivalent to each other. This stands in contrast to the data-centric approach of IRT, which may use the same 1PL model as Rasch, but allows parameters to be freely estimated without constraining them to fit the a priori model. While some have argued that the imposition of the Rasch model assumptions is necessary to achieve “measurement” (Bond and Fox, 2007), the data analysis in this study is neutral as to the philosophic assumptions associated with Rasch modeling.
The Rasch or 1PL model has been used to analyze the quality of multiple-choice items with mixed results. Some studies showed that the Rasch model fitted most items (Athanasou and Lamprianou, 2004) while others have found that the Rasch model did not fit most multiple-choice items (Divgi, 1986; Leeson and Fletcher, 2003), most likely because of the overly restrictive requirement that all items have zero guessing and equal discrimination (Drasgow and Parsons, 1983; van de Vijver, 1986). Hence, there are doubts as to the sufficiency of the Rasch model for MCQ items where the possibility of guessing exists.
Two-Parameter Logistic Model (2PL)
The 2PL model includes item discrimination and item difficulty as factors that determine the item and test-taker characteristics (Hambleton et al., 1993; Embretson and Reise, 2000; Thissen and Orlando, 2001). Items that have greater discriminatory power have steeper slopes at the 50% probability point. This means that only a small change in ability will produce a large change in probability of answering correctly. Highly discriminating items are useful, as in CTT, in differentiating between examinees of different ability, especially when distinctions relative to a cutoff score or grade boundary are required (Thissen and Orlando, 2001; Osterlind and Wang, 2012). The advantage of 2PL over Rasch is that items do not have to have equal discrimination rates. Nonetheless, negative discrimination values, as in CTT, provide misleading information about the domain of interest, necessitating the removal of such items.
Like the 1PL model, the 2PL model does not account for the possibility of correctly answering the item by chance or guessing. The logic here is that if items are well-written, the probability of guessing should be less than the raw chance of randomly picking the right answer from a set of options. For example, a 4-option item could be answered correctly one in four times. If the chance value for such an item is actually 17%, then the effect of chance can be ignored. The 2PL model has been found to fit the data from well-designed MCQ reading comprehension items better than the Rasch model (Leeson and Fletcher, 2003).
Three-Parameter Logistic Model (3PL)
The 3PL model extends IRT by including a parameter that represents the possibility of low ability examinees answering an item correctly due to chance (Crocker and Algina, 1986; Hambleton et al., 1993; Embretson and Reise, 2000; Osterlind and Wang, 2012). MCQ items rarely have a lower asymptote at zero because even very weak students can answer items correctly by random processes. Assuming all items are completely independent of each other, the chance of getting any 4-option MCQ correct should be 25%. Unsurprisingly, if items are poorly written or if test-takers exercise very little effort (Wise and Smith, 2016), the probability of guessing correctly could be much higher. Thus, items which have chance values greater than the random rate of guessing are normally removed before score determination. Studies of MCQs with the 3PL model have found it to fit well most of items in a test (Leeson and Fletcher, 2003; Bergan, 2010; Adedoyin and Mokobi, 2013).
Sample Size
Given the complexity of the IRT models, it is not surprising that large sample sizes (i.e., N ≥ 500) are considered necessary (Hambleton and Jones, 1993). This is in contrast to the smaller sizes (i.e., N ≥ 200) permitted by the simpler approach of CTT. Claims that Rasch or 1PL models will estimate accurately with N < 100 (Boone et al., 2014) have been found to be unreliable (Houts et al., 2016). Research into real-data, as opposed to simulated data, with smaller sample sizes has suggested that N < 200 is infeasible (Sireci, 1992), but that N ≥ 300 can provide reasonably accurate parameter estimation provided a test has ≥ 30 items (Akour and AL-Omari, 2013).
Thus, the challenge in operational testing of classes with teacher-made tests, where N < 500 is commonplace, remains whether IRT techniques can be legitimately used to evaluate test items. In addition, few operational testing programs in higher education recycle items into future final examinations because institutional regulations require that exams be exposed to future students. This transparency practice means that, once used, there is little opportunity to collect new data with the self-same items. Hence, in this naturalistic study, the accuracy of estimation, given the available sample sizes, has to be taken somewhat cautiously. Ideally, the results would be tested on a second independent sample for corroboration purposes, but this was beyond scope of the study.
Methods
Design
This study is a secondary data analysis of the course assessment data used to evaluate student learning in an introductory education course. The course was assessed with a mixture of two 50-item MCQ tests and essay examinations scored by course instructors and/or tutors. The course followed the university scoring system to convert percentage scores to grades against criterial descriptions for grades. Grades were A = excellent (80–100%); B = good (65–79%), C = satisfactory (50–64%), and D = unsatisfactory (0–49%). The minimum pass (C−) requires a score of at least 50%.
Participants
The participants in this study were students enrolled in one general education undergraduate course at a large research-intensive university in New Zealand. The course was an introductory educational psychology course on learning theory and offered as either a general education course (i.e., a course provided for students studying other disciplines outside the Faculty of Arts) or a normal elective course (i.e., for students from the Faculty of Arts). General education courses in this study are first-year courses taken by students from outside the faculty hosting the course to broaden their education.
Of the 380 students for whom data were available, 276 were enrolled in the general education course, while 104 were enrolled as Arts normal elective students. Only 375 of 395 students did the midterm test, and 377 took the final examination, resulting in 372 students who received a final grade. This size of sample is sufficient for CTT analysis and is close to the recommended threshold for IRT. Unfortunately, as is the case in real-world testing programs, it is not possible to administer the items again to increase the sample size. Hence, if the IRT results are poor quality, this may be partly attributable to the relatively low sample size.
No specific demographic characteristics of the students (i.e., their gender; age, or ethnic group) were available. These operational data were released for secondary analysis without identifying information for the purpose of evaluating the test item writing.
Instruments
The course consisted of three assessments (i.e., midterm-test worth 25%, essay assignment worth 25%, and final exam worth 50%).
Midterm Test
The midterm test was 2-h long and was administered in week 6 of the course, covering material related to the course content presented in the first five 2-h lectures. The test had 50 four-option MCQs, drafted by the main course lecturer, and vetted for quality by the course coordinator and the faculty examination manager against accepted best-practice conventions for writing multiple-choice items. The midterm-test items covered content related to seven topics: that is (1) cognitive processing (6 items), (2) forgetting (8 items), (3) general learning theory (5 items), (4) memory (8 items), (5) meta-cognition (10 items), (6) retrieval (7 items), and (7) schema (6 items). The test was administered on paper under invigilation.
Final Exam
The final exam had 50 four-option MCQs constructed by three of the course lecturers and were checked against best-practice recommendations by the course co-ordinator and faculty examination administrator. The final exam excluded topics covered in the midterm-test and covered five topics, each with 10 items, taught after the midterm test. These were (1) motivation, (2) approaches to learning, (3) problem solving, (4) social structure, and (5) behaviorism or observational learning. The exam was administered on paper under invigilation. The MCQs were worth half of the total exam score (i.e., 25% of the total course score) with three essay questions making up the balance of marks.
Analyses
Analysis of a test presumes that items are unidimensional, which may not be the case when a test covers multiple topic areas. Dimensionality was checked with confirmatory factor analysis of a single factor with 50 items using the weighted least square estimator with robust standard errors and mean- and variance-adjusted χ2 test statistic (Finney and DiStefano, 2006) in Mplus version 7.4 (Muthén and Muthén, 1998–2015) to account for the dichotomous nature of the items. Current standards suggest that models do not need to be rejected if the root mean square error of approximation (RMSEA) is <0.08, the weighted root-mean-square residual (WRMR) is close to 1.00, and the comparative fit index (CFI) is >0.90 (Yu, 2002; Fan and Sivo, 2007). Cronbach’s alpha estimates of internal reliability were conducted before and after removal of misfitting items to establish further evidence of total test score coherence. Psychometric analysis of the items was conducted using each statistical model. Once misfitting items were identified, student scores were recalculated, and the impact on students’ grades and pass/fail rates was explored.
IRT Analyses
All IRT analyses were conducted with the “ltm” package in R which also reports model fit (Rizopoulos, 2006). This package produces a variety of comparable fit indices including log likelihood, BIC, and AIC values. Differences of AIC > 10 indicate that the model with the smaller AIC has superior fit to the data; likewise, all models included by 95% confidence interval set (indicated by the sum of Akaike weights Σwi ≥ 0.95) are plausible equally well-fitting models (Burnham and Anderson, 2004).
Classical Test Theory
Items with p-values equal to either 1 or 0 (i.e., 1 = 100% of the students answered the item correctly, 0 = 0% of the students answered the item correctly) were discarded. Items with point biserial correlation (rpb) values below 0.19 were discarded. All values were determined through SPSS version 21.
IRT 1PL Model
Each item’s fit statistic values were found using the chi-square (χ2) index of probability that the item data fit the Rasch model (Raykov and Marcoulides, 2006). Only items with statistically non-significant chi-square values (i.e., p ≥ 0.05) were retained.
IRT 2PL Model
Items with discrimination values lower than 0.19 were rejected.
IRT 3PL Model
Because all MCQs had four options, items with chance >0.25 were rejected.
Grade Effect
After removing misfitting items, each student’s score was generated using the revised set of items. The scores were transformed from raw percentage (CTT) or logit value (IRT) to match the original raw score mean and standard deviation for the midterm and examination separately. This was done because a standard setting exercise in which course lecturers set grade cut scores based on the revised set of items was not feasible. After transformation, the scores were added to the essay-based course and exam scores to generate a course total score. Based on this value, the number of students being awarded each grade (A to D) and pass–fail (A to C versus D) was determined.
Results
Given that the tests covered multiple topics, each was examined for unidimensionality. Model fit for a single factor was mixed for the midterm test (χ2 = 4213.62, df = 1175, χ2/df = 3.586, p = 0.06; RMSEA = 0.083; CFI = 0.934; WRMR = 2.394) and good for the final exam (χ2 = 1309.05, df = 1175, χ2/df = 1.114, p = 0.29; RMSEA = 0.017; CFI = 0.936; WRMR = 0.982). This suggested that examining all items as contributors to a single latent ability measure was plausible. The mixed result for the midterm test suggests that inspection of item psychometric properties might reveal causes of relatively weak fit for unidimensionality.
Item Analysis
Table 1 shows the psychometric properties of the midterm test and final exam items according to the statistical model used. Highlighted values indicate items which failed to meet analytic standards for each approach.
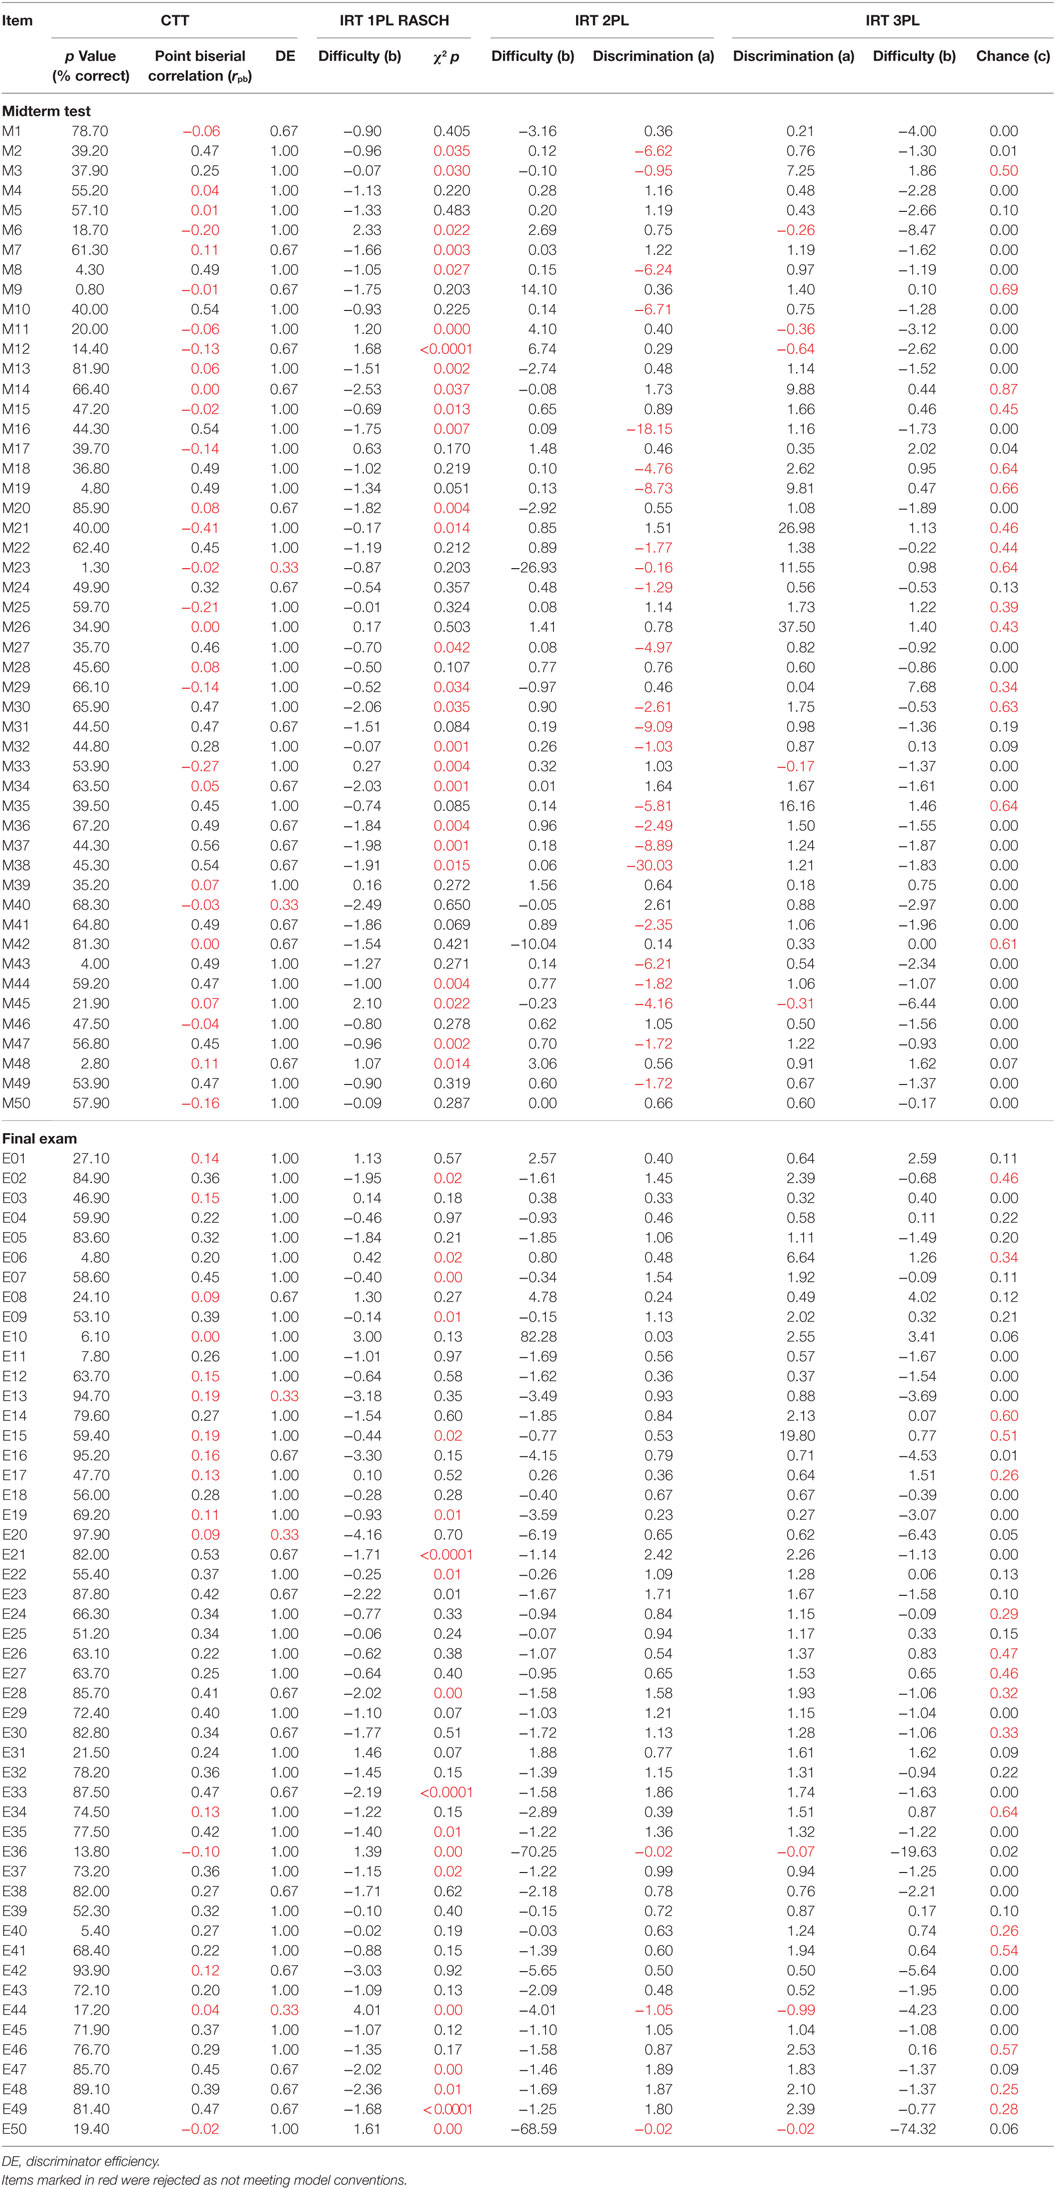
Table 1. Item psychometric characteristics by statistical model and test.
In the midterm test, the CTT model rejected 28 items, the IRT 1PL model rejected 26 items rejected, the IRT 2PL rejected 24 items, and the IRT 3PL rejected just 20 items. It was noteworthy that in terms of distractor efficiency, 66% of items had all distractors with >5% selection, 15 items (30%) had only one distractor with a low selection rate, and just two (4%) had two bad distractors. In total, just one item (M45) was identified as misfitting by all four methods, indicating that the different approaches lead to quite different decisions about item quality. Model fit statistics indicated that the 2PL model had best fit (AIC = 17653.32, Σwi = 1.00) compared to the 3PL (AIC = 19052.00) and Rasch (AIC = 1962.39) models. The item characteristic curves for the IRT 2PL show that despite its superior fit to the data many items clearly have inverse discrimination slopes or very flat trajectories with very high intercepts at logit −4.00 (Figure 1).

Figure 1. Mid-Term Test IRT 2PL Item Characteristic Curves.
In the final exam, many fewer items were identified as misfitting. The CTT model rejected 14 items for low discrimination and distractor efficiency indicated 70% of items had no low selection options, 12 items (24%) had one low selection distractors, and three items (6%) had two low selection options. The IRT 1PL model rejected 19 items, IRT 2PL just three items, and 19 by the IRT 3PL. Two items (E36 and E44) were rejected by all four methods. This suggests that the quality of items written for the final exam was probably better than that for the midterm test or else that the alignment of the items to the student ability was greater. The IRT 3PL retained the most items in the midterm test, while the 2PL kept the most in the final exam. However, as per the midterm test, the IRT 2PL had the best fit (AIC = 18546.93, Σwi = 1.00) compared to the 3PL (AIC = 18578.89) and Rasch (AIC = 18889.88) models. The item characteristic curves for the IRT 2PL show that, in accordance with its superior fit to the data, few items have inverse discrimination slopes or very high intercepts at logit −4.00 (Figure 2).
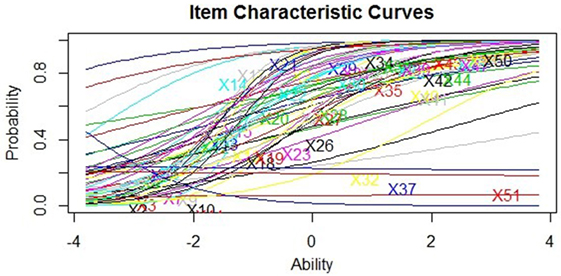
Figure 2. Final Exam IRT 2PL Item Characteristic Curves.
Therefore, it seems that using the 2PL model as the basis of analyzing these two MCQ tests is the most robust approach and the Rasch method is the least effective IRT method. Nevertheless, in the context of classroom assessment, there may be a legitimate goal in including very easy or very difficult items (e.g., motivating sense of learning or establishing learning needs). These very easy or difficult items might have poor item discrimination statistics but may still be useful to ensure an adequate sample of the constructs of interest.
Test Analysis
After removing the misfitting items, the test statistics for each analysis were obtained (Table 2). Except for the Rasch analysis, the reliability of both tests, after removing misfitting items, reached reasonably acceptable levels of internal consistency (i.e., α > 0.70) for all models. In both tests, the CTT and IRT 2PL methods produced the highest internal estimates of consistency among items. It is worth noting that the total score for a test that assesses many different topics (e.g., the midterm test), on which the standard error of measurement depends, is likely to have a lower correlation between the total and any single content-focused item. Nonetheless, a heterogeneous item pool in terms of content may still be necessary to sample the intended domain of the test. Hence, it may be unwise to place too many eggs in the basket of high internal estimates of reliability when evaluating a test aiming to cover multiple topic areas. However, this seems not to be a problem in this instance, if either the CTT or IRT 2PL models are used to remove poor fitting items, and less so if the IRT 2PL approach is used because it retained a greater number of items than the CTT approach.
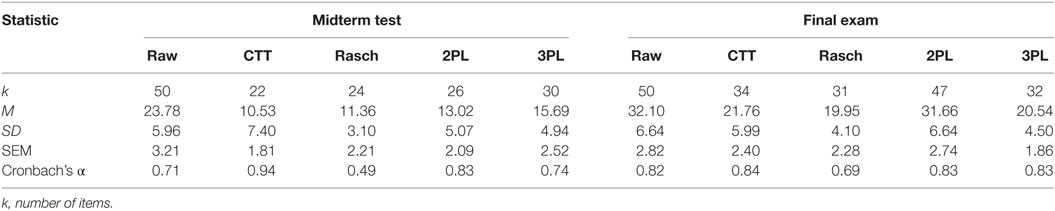
Table 2. Midterm test and final exam statistics by statistical model.
Grade Impact
After removal of misfitting items, the grade distribution for the midterm and final examinations and the cumulative effect of the model changes on total course grade were determined for the IRT 2PL model only (Table 3). Interrater agreement using Fleiss’ (Fleiss, 1971) generalized kappa (κ) was conducted to evaluate the chance-corrected measure of agreement between the two rating systems, each of which independently classified the participants into one of a set of 11 (A to D−) mutually exclusive and exhaustive grade categories. King (2004) software reported an overall κ = 0.25 (95% CI = 0.23–0.28), much below the minimum standard of κ > 0.40 to indicate that the observed agreement is greater than might occur by chance (Stemler, 2004). Interestingly, the kappa value per grade category was similarly low, except for the “D−” grade.
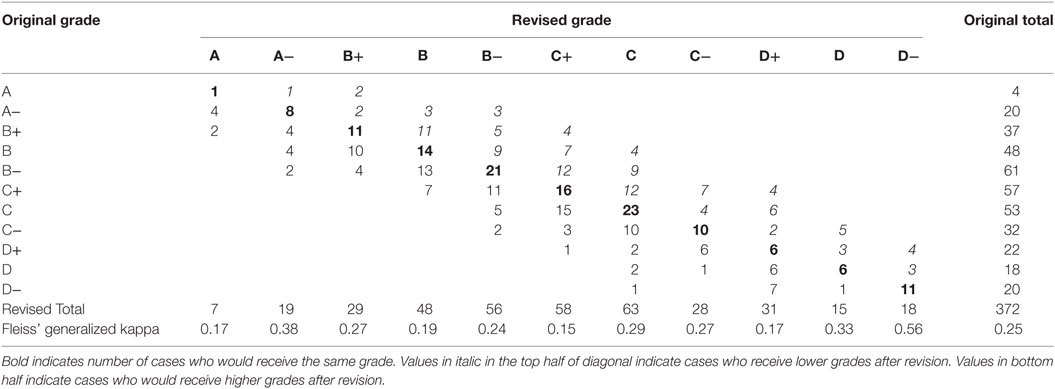
Table 3. Revised and Original Grade Distributions.
However, when aggregated into the four main grade categories (A to D), the proportion agreement was 70%, giving κ = 0.55, a somewhat more convincing indication that grade similarity was beyond chance. Grade results changed for nearly two-thirds of the 372 participants, equally split between increase (n = 123) and decrease (n = 123). The total number of “A” grades increased trivially from 24 to 26; “B” grades fell from 146 to 133; the number of “C” grades increased from 142 to 149; and the number of fail grades increased from 60 to 64. Hence, it could be argued that using the 2PL IRT approach would not make the course look any worse in terms of grade distribution because there were two more “A”s and only four more fails.
Discussion
This study showed that the instructor-constructed MCQs used in this higher education course were problematic, much more so in the midterm test than the final examination. The inclusion of poor quality items had a small but critical impact on students’ overall course grades, especially in terms of pass/fail decisions. Using a statistical model approach to removing items with unacceptable characteristics made a difference to course performance in a way that benefited a small number of students and overall made the course appear equally successful as the official raw score approach.
Given that MCQs have the possibility of guessing, it seems logically appropriate to analyze items with a statistical model capable of detecting the effect of chance performance. This is a feature only of the IRT 3PL statistical model. However, the current study has shown that the IRT 2PL model had superior fit to the overall data, indicating that this analysis can be sufficient to detect items with low or reverse discrimination, leading to appropriate calculation of person ability, and ultimately an appropriate grade score. It may be that the pseudo-chance guessing parameter cannot be accurately estimated with N < 1,000, and so the IRT 2PL may fit better simply because of the relatively low N in this operational test. Further evaluation of model fit in large enrollment classes (e.g., N > 1,000) could be conducted with operational MCQ tests in many large universities. Nonetheless, given the superior fit of the IRT 2PL model to the data, it may be that our logical preference for the IRT 3PL is misplaced empirically and greater emphasis should be put on using the simpler statistical model.
In contrast, the IRT 1PL model did the worst job, especially in the midterm test, when perhaps item writing quality was weaker than the final examination. The strict assumptions of the Rasch model seem to be unrealistic for use with MCQs (and quite possibly all dichotomously scored knowledge questions) and so this analysis reiterates previous findings. It may be that when items are written better or when students make greater effort, both of which are possible explanations for the better properties of the items in the final examination, the IRT 2PL model may be sufficient (Crocker and Algina, 1986).
Given the much simpler statistical manipulations involved in calculating a CTT score relative to any of the IRT models, it may be tempting to conclude that it is sufficiently robust. However, to illustrate the additional benefit of using an IRT approach over the CTT method, consider two students (i.e., AUID153 and AUID332) who both answered correctly 15 of 34 items on the CTT revised final exam for a percentage score of 44%. This is considered an unsatisfactory grade showing a lack of knowledge and understanding of the topic. However, after adjusting student scores based on the relative difficulty of items using the IRT 2PL method, student AUID153 would get four points more moving their total grade to “C” (i.e., satisfactory), while student AUID332 would get 0.6 points less resulting in grade “D−” (i.e., extremely poor). This suggests that insofar as the MCQ items were concerned, student AUID332 answered fewer hard items correctly relative to AUID153. Thus, treating items of different difficulty as if they had the same information about the quality of performance would in these two cases generate different conclusions. Nonetheless, since half the course grade depended on performance on essay-type questions, this small change in test score was not sufficient to change total grade.
At the same time, using a test with many fewer items may also be misleading, since the abbreviated test is likely to cover a much smaller part of the intended curriculum. Thus, while the statistical analysis might lead to a more credible score, it may do so at the cost of valid inferences about competence across the full range of examination objectives. Given the power of the IRT 2PL model to adjust scores based on the relative difficulty of items, a case could be made for retaining poor quality items to ensure content coverage. However, it is our position that having fewer items would lead to more defensible decision making than retaining poor quality items that generate misleading information. Fewer items with trusted information can result in more robust decisions than poorly constructed items. In terms of a purely formative assessment that does not contribute to summative grading, maximizing content coverage may be useful, but when coursework and class quizzes or tests contribute to final total grades, we are of the opinion that making that overall judgment based on high-quality information is more likely to lead to public credibility.
Not using an IRT approach to score calculation potentially has a negative impact on instructors. For example, initial raw scores showed that 217 of 375 students had failed the midterm test, whereas, if IRT 2PL had been used, only 144 students would have failed, a nearly 20% decline in the fail rate. Since a high proportion of failing grades can be interpreted as poor teaching quality (Brown, 2010), the raw test information in this situation may have led instructors to invest time and resources to changing teaching strategies, which may not have been needed or could have been spent in a more productive way. Thus, not conducting item analysis and removing poorly performing items could lead to misleading feedback to both students and lecturers.
Alternatively, the poor characteristics of the midterm test items may suggest a different explanation. If a test is too difficult, it is understandable many students would guess. Difficulty for the students may arise from poorly written items, but also from poor instruction. However, this was not the first time the course had been run and the course content and sequences followed those set by previous administrations of the course. The only difference to previous administrations of the course was a different teacher for the first five lectures and, thus, a different item writer for the midterm test. Hence, it seems unlikely that the present study has identified a need to revise the course. Rather it seems more likely that there was a greater need for item analysis of the MCQ midterm test before scores were finalized.
The overwhelming conclusion is that item statistical analysis is a necessary adjunct to judgment-based evaluation of item quality in MCQ testing in higher education. The quality of decisions can be defended when the statistical analysis eliminates misleading items. However, this requires that, before any scores are released to students or record systems, some sort of psychometric analysis of item characteristics is conducted. Since most higher education teachers would have little training in these procedures, it seems that the development of automated analysis systems would be a useful support for academics. An automated system would indicate that certain items do not meet statistical conventions, with an opportunity for the academic to approve deletion. Once poorly fitting items are deleted, the system would recalculate scores for students. By displaying the items from easiest to hardest, the system could then ask the instructor, using the logic of bookmark standard setting (Mitzel et al., 2001), to indicate where boundaries for each grade level should be established. Having done this, the system would then transform IRT logit scores into appropriate institutional values reflecting the grade boundary decisions made by the academic. For example, a score of −0.15 might be judged to be the minimum passing mark of 50%. Then actual grades could be stored in student management systems and disseminated to students. This approach takes advantage of computer technology to calculate scores while placing responsibility for grade boundaries in the hands of the content experts teaching a course (Pitoniak and Morgan, 2012).
Future Research
This last possibility identifies a clear weakness in this study. No expert based judgment of the revised test items was conducted to determine appropriate cut scores for grades. Instead, the distributions were transformed to match the raw score distribution, which had not been subjected to a standard setting process. Another challenge to conducting IRT analysis is the availability of open-source software suitable for these analyses. While SPSS has developed routines for 1PL and 2PL analysis, the base product is not free. Likewise, Mplus, which only provides 2PL analyses, is not free. The ICL (Hanson, 2002) and PARAM (Rudner, 2012) applications are free and can run IRT 3PL analyses, but are not widely used. The free “ltm” package (Rizopoulos, 2006) in R overcomes these challenges. While very similar conclusions about which items to keep or reject would be reached across the various applications, there were more than trivial differences in the difficulty and discrimination parameters, for example, between ICL and PARAM. Hence, analysts would be greatly aided by studies which can establish equivalences between open source applications and gold-standard applications. Perhaps, with greater acceptance and use, appropriate packages (e.g., “ltm” or “mirt”) in the open source R software will be able to resolve these equivalence and access problems.
Another limitation in this study is the relatively small sample size (i.e., 372 students) and the effect it may have on estimating the pseudochance parameter in the IRT 3PL model. However, small sample size is a normal case in higher education and it may be relatively uncommon to have courses with at least 1,000 students. Nonetheless, future studies to further establish the robustness of IRT applications for realistically small sample sizes are needed.
The generalizability of this study is limited because only one course and only two MCQ tests in one year have been analyzed. Nonetheless, the current study is consistent with other studies that have evaluated the quality of multiple-choice items in higher education assessments. Thus, further studies into the quality of MCQ testing, especially evaluating training programs designed to improve instructor item writing skill, are needed. Evidence from publishers is needed about the qualities of items in text-book related item banks which can be used in formal assessments.
Conclusion
This research is necessary within each and every institution that uses MCQs because, while the threat cumulatively may not be large, it seems highly likely that specific exams or tests will not meet normal requirements. The credibility of assessment is necessary, especially if there is a tendency to be litigious about grading or testing (Brookhart, 2010). Any lack of quality assurance process at the course or department level poses a significant reputational risk to the institution.
This study has shown that use of IRT item analysis has a potential beneficial impact on overall course grades and number of students passing. It also suggests that more informative feedback to students and instructors might be generated by giving grades derived from item difficulty. This study provides a warning for the different stakeholders concerned with the quality of higher education assessment practices and suggests that more commitment and effort is needed in quality assurance in order to meet professional obligations.
Ethics Statement
This research involves secondary analysis of anonymized datasets. No ethics risks were involved.
Author Contributions
GB obtained data, supervised analysis, drafted, and revised the manuscript; took responsibility for reanalysis of data using ltm package and Mplus. HA drafted literature review, conducted statistical analyses, and drafted the discussion. This work began as MA thesis awarded to HA and supervised by GB.
Conflict of Interest Statement
The authors declare that the research was conducted in the absence of any commercial or financial relationships that could be construed as a potential conflict of interest.
The reviewers, JW and YL, and handling editor declared their shared affiliation, and the handling editor states that the process nevertheless met the standards of a fair and objective review.
References
Adedoyin, O., and Mokobi, T. (2013). Using IRT psychometric analysis in examining the quality of junior certificate mathematics multiple choice examination test items. Int. J. Asian Soc. Sci. 3, 992–1011.
Akour, M., and AL-Omari, H. (2013). Empirical investigation of the stability of IRT item-parameters estimation. Int. Online J. Educ. Sci. 5, 291–301.
Athanasou, J. A., and Lamprianou, I. (2004). Reading in one’s ethnic language: a study of Greek-Australian high school students. Aust. J. Educ. Dev. Psychol. 4, 86–96.
Bailey, P. H., Mossey, S., Moroso, S., Cloutier, J. D., and Love, A. (2012). Implications of multiple-choice testing in nursing education. Nurse Educ. Today 32, e40–e44. doi: 10.1016/j.nedt.2011.09.011
Bergan, J. (2010). Assessing the Relative Fit of Alternative Item Response Theory. Tucson, Arizona: Assessment Technology Incorporated.
Bond, T. G., and Fox, C. M. (2007). Applying the Rasch Model: Fundamental Measurement in the Human Sciences, 2nd Edn. Mahwah, NJ: Lawrence Erlbaum Associates Publishers.
Boone, W. J., Staver, J. R., and Yale, M. S. (2014). Rasch Analysis in the Human Sciences. Dordrecht, NL: Springer Science.
Borsboom, D. (2005). Measuring the Mind Conceptual Issues in Contemporary Psychometrics. Cambridge, UK: Cambridge University Press.
Brady, A. (2005). Assessment of learning with multiple-choice questions. Nurse Educ. Pract. 5, 238–242. doi:10.1016/j.nepr.2004.12.005
Brookhart, S. M. (2010). Legal Context of Grading. Available at: https://www.education.com/reference/article/legal-context-grading
Brown, G. T. L. (2010). The validity of examination essays in higher education: issues and responses. High. Educ. Q. 64, 276–291. doi:10.1111/j.1468-2273.2010.00460.x
Burnham, K. P., and Anderson, D. R. (2004). Multimodel inference: understanding AIC and BIC in model selection. Sociol. Methods Res. 33, 261–304. doi:10.1177/0049124104268644
Burton, R. F. (2005). Multiple-choice and true/false tests: myths and misapprehensions. Assess. Eval. High. Educ. 30, 65–72. doi:10.1080/0260293042003243904
Cizek, G. J. (ed.) (2001). Setting Performance Standards: Concepts, Methods, and Perspectives. Mahwah, NJ: Lawrence Erlbaum Associates.
Clifton, S. L., and Schriner, C. L. (2010). Assessing the quality of multiple-choice test items. Nurse Educ. 35, 12–16. doi:10.1097/NNE.0b013e3181c41fa3
Crocker, L., and Algina, J. (1986). Introduction to Classical and Modern Test Theory. New York: Holt, Rinehart and Winston.
de Ayala, R. J. D. (2009). The Theory and Practice of Item Response Theory. New York: The Guilford Press.
DiBattista, D., and Kurzawa, L. (2011). Examination of the quality of multiple-choice items on classroom tests. Can. J. Scholarsh. Teach. Learn. 2. doi:10.5206/cjsotl-rcacea.2011.2.4
Divgi, D. R. (1986). Does the Rasch model really work for multiple choice items? Not if you look closely. J. Educ. Meas. 23, 283–298. doi:10.1111/j.1745-3984.1986.tb00251.x
Downing, S. M. (2005). The effects of violating standard item-writing principles on tests and students: the consequences of using flawed test items on achievement examinations in medical education. Adv. Health Sci. Educ. 10, 133–143. doi:10.1007/s10459-004-4019-5
Downing, S. M. (2006). “Twelve steps for effective test development,” in Handbook of Test Development, eds S. M. H. Downing and M. Thomas (Mahwah, NJ: Lawrence Erlbaum Associates), 3–25.
Downing, S. M., and Yudkowsky, R. (2009). Assessment in Health Professions Education. New York, NY: Routledge.
Drasgow, F., and Parsons, C. K. (1983). Application of unidimensional item response theory models to multidimensional data. Appl. Psychol. Meas. 7, 189–199. doi:10.1177/014662168300700207
Ebel, R. L., and Frisbie, D. A. (1991). Essentials of Educational Measurement, 5th Edn. Englewood Cliffs, NJ: Prentice Hall.
Ellsworth, R. A., Dunnell, P., and Duell, O. K. (1990). Multiple-choice test items: what are textbook authors telling teachers? J. Educ. Res. 83, 289–293. doi:10.1080/00220671.1990.10885972
Embretson, S., and Reise, S. (2000). Item Response Theory for Psychologists. Mahwah, NJ: Lawrence Erlbaum Associates.
Fan, X., and Sivo, S. A. (2007). Sensitivity of fit indices to model misspecification and model types. Multivar. Behav. Res. 42, 509–529. doi:10.1080/00273170701382864
Fellenz, M. R. (2004). Using assessment to support higher level learning: the multiple choice item development assignment. Assess. Eval. High. Educ. 29, 703–719. doi:10.1080/0260293042000227245
Finney, S. J., and DiStefano, C. (2006). “Non-normal and categorical data in structural equation modeling,” in Structural Equation Modeling: A Second Course, eds G. R. Hancock and R. D. Mueller (Greenwich, CT: Information Age Publishing), 269–314.
Fleiss, J. L. (1971). Measuring nominal scale agreement among many raters. Psychol. Bull. 76, 378–382. doi:10.1037/h0031619
Grainger, P., Purnell, K., and Zipf, R. (2008). Judging quality through substantive conversations between markers. Assess. Eval. High. Educ. 33, 133–142. doi:10.1080/02602930601125681
Haladyna, T. (2004). Developing and Validating Multiple-Choice Test Items. Mahwah, New Jersey: Lawrence Erlbaum Associates.
Haladyna, T. M., and Downing, S. M. (1993). How many options is enough for a multiple-choice test item? Educ. Psychol. Meas. 53, 999–1010. doi:10.1177/0013164493053004013
Haladyna, T. M., and Rodriguez, M. C. (2013). Developing and Validating Test Items. New York: Routledge Taylor & Francis Group.
Hambleton, R., Swaminathan, H., and Rogers, H. (1993). Fundamentals of Item Response Theory. California: SAGE.
Hambleton, R. K., and Jones, R. W. (1993). Comparison of classical test theory and item response theory and their applications to test development. Educ. Meas. Issues Pract. 12, 38–47. doi:10.1111/j.1745-3992.1993.tb00543.x
Hansen, J. D., and Dexter, L. (1997). Quality multiple-choice test questions: item-writing guidelines and an analysis of auditing test banks. J. Educ. Bus. 73, 94–97. doi:10.1080/08832329709601623
Hanson, B. A. (2002). ICL: IRT Command Language (Version 0.020301) [Computer Software]. Available at: http://www.b-a-h.com/software/irt/icl
Harvill, L. M. (1991). Standard error of measurement. Educational Measurement: Issues & Practice. 10, 33–41. doi:10.1111/j.1745-3992.1991.tb00195.x
Hingorjo, M. R., and Jaleel, F. (2012). Analysis of one-best MCQs: the difficulty index, discrimination index and distractor efficiency. J. Pak. Med. Assoc. 62, 142–147.
Houts, C. R., Edwards, M. C., Wirth, R. J., and Deal, L. S. (2016). A review of empirical research related to the use of small quantitative samples in clinical outcome scale development. Qual. Life Res. 25, 2685–2691. doi:10.1007/s11136-016-1364-9
Joughin, G. (2009). “Assessment, learning and judgment in higher education: a critical review,” in Assessment, Learning and Judgment in Higher Education, ed. G. Joughin (Dordrecht, Netherlands: Springer), 1–15.
Jozefowicz, R. F., Koeppen, B. M., Case, S., Galbraith, R., Swanson, D., and Glew, R. H. (2002). The quality of in-house medical school examinations. Acad. Med. 77, 156–161. doi:10.1097/00001888-200202000-00016
King, J. E. (2004). “Software solutions for obtaining a kappa-type statistic for use with multiple raters,” in Paper Presented at the Annual Meeting of the Southwest Educational Research Association (Dallas, TX), 5–7.
Leeson, H., and Fletcher, R. (2003). “An investigation of fit: comparison of 1-, 2-, 3-parameter IRT models to project asTTle data,” in Paper Presented at the Joint NZARE/AARE Conference (Auckland, New Zealand).
Malau-Aduli, B. S., and Zimitat, C. (2012). Peer review improves the quality of MCQ examinations. Assess. Eval. High. Educ. 37, 919–931. doi:10.1080/02602938.2011.586991
Masters, J. C., Hulsmeyer, B. S., Pike, M. E., Leichty, K., Miller, M. T., and Verst, A. L. (2001). Assessment of multiple-choice questions in selected test banks accompanying text books used in nursing education. J. Nurs. Educ. 40, 25–32. doi:10.3928/0148-4834-20010101-07
Mitzel, H. C., Lewis, D. M., Patz, R. J., and Green, D. R. (2001). “The bookmark procedure: psychological perspectives,” in Setting Performance Standards: Concepts, Methods, and Perspectives, ed. G. J. Cizek (Mahwah, NJ: Erlbaum), 249–281.
Muthén, L. K., and Muthén, B. O. (1998–2015). Mplus User’s Guide, 7th Edn. Los Angeles, CA: Muthén & Muthén.
Nedeau-Cayo, R., Laughlin, D., Rus, L., and Hall, J. (2013). Assessment of item-writing flaws in multiple-choice questions. J. Nurs. Prof. Dev. 29, 52–57. doi:10.1097/NND.0b013e318286c2f1
Osterlind, S., and Wang, Z. (2012). “Item response theory in measurement, assessment, and evaluation for higher education,” in Handbook on Measurement, Assessment, and Evaluation in Higher Education, eds C. Secolsky and D. Denison (New York, NY: Routledge), 150–160.
Pitoniak, M. J., and Morgan, D. L. (2012). “Setting and validating cut scores for tests,” in Handbook on Measurement, Assessment, and Evaluation in Higher Education, eds C. Secolsky and D. B. Denison (New York: Routledge), 343–366.
Raykov, T., and Marcoulides, G. (2006). A First Course in Structural Equation Modeling. Mahwah, NJ: Lawrence Erlbaum Association.
Reynolds, C. R., Livingston, R. B., and Wilson, V. (2009). Measurement and Assessment in Education. Upper Saddle River, NJ: Pearson Merrill.
Rizopoulos, D. (2006). ltm: an R package for latent variable modeling and item response analysis. J. Stat. Softw. 17, 1–25. doi:10.18637/jss.v017.i05
Rudner, L. M. (2012). PARAM Calibration Software Logistic IRT Model (Version 0.93) [Computer Software]. Available at: http://echo.edres.org:8080/irt/param
Schaughency, E., Smith, J. K., van der Meer, J., Berg, D., Secolsky, C., and Denison, D. B. (eds) (2012). “Classical test theory and higher education: five questions,” in Handbook on Measurement, Assessment, and Evaluation in Higher Education (London: Routledge), 117–131.
Sireci, S. G. (1992). “The utility of IRT in small-sample testing applications,” in Paper Presented at the Annual Meeting of the American Psychological Association (Washington, DC).
Stagnaro-Green, A. S., and Downing, S. M. (2006). Use of flawed multiple-choice items by the New England Journal of Medicine for continuing medical education. Med. Teach. 28, 566–568. doi:10.1080/01421590600711153
Stemler, S. E. (2004). A comparison of consensus, consistency, and measurement approaches to estimating interrater reliability. Practical Assessment, Research & Evaluation, 9. Available at: http://tinyurl.com/m7grwph
Tarrant, M., Knierim, A., Hayes, S. K., and Ware, J. (2006). The frequency of item writing flaws in multiple-choice questions used in high stakes nursing assessments. Nurs. Educ. Pract. 6, 354–363. doi:10.1016/j.nepr.2006.07.002
Tarrant, M., Ware, J., and Mohammed, A. M. (2009). An assessment of functioning and non-functioning distractors in multiple-choice questions: a descriptive analysis. BMC Med. Educ. 9:40. doi:10.1186/1472-6920-9-40
Thissen, D., and Orlando, M. (2001). “Item response theory for items scored in two categories,” in Test Scoring, eds D. Thissen and H. Wainer (Mahwah, NJ: Lawrence Erlbaum Associates), 73–136.
van de Vijver, F. J. (1986). The robustness of Rasch estimates. Appl. Psychol. Meas. 10, 45–57. doi:10.1177/014662168601000104
Walsh, C. M., and Seldomridge, L. A. (2006). Critical thinking: back to square two. J. Nurs. Educ. 45, 212–219.
Walvoord, B. E., and Anderson, V. J. (2011). Effective Grading: A Tool for Learning and Assessment in College. San Francisco: Wiley.
Wise, S. L., and Smith, L. F. (2016). “The validity of assessment when students don’t give good effort,” in Handbook of Human and Social Conditions in Assessment, eds G. T. L. Brown and L. R. Harris (New York: Routledge), 204–220.
Yorke, M. (2009). “Faulty signals? Inadequacies of grading systems and a possible response,” in Assessment, Learning and Judgement in Higher Education, ed. G. Joughin (London, UK: Springer), 1–20.
Keywords: multiple-choice test, item response theory (IRT), classical test theory, item evaluation, higher education research, teacher-made tests, psychometric evaluation
Citation: Brown GTL and Abdulnabi HHA (2017) Evaluating the Quality of Higher Education Instructor-Constructed Multiple-Choice Tests: Impact on Student Grades. Front. Educ. 2:24. doi: 10.3389/feduc.2017.00024
Received: 28 January 2017; Accepted: 17 May 2017;
Published: 02 June 2017
Edited by:
Amery D. Wu, University of British Columbia, CanadaReviewed by:
Junli (Julie) Wei, University of British Columbia, CanadaYan Liu, University of British Columbia, Canada
Copyright: © 2017 Brown and Abdulnabi. This is an open-access article distributed under the terms of the Creative Commons Attribution License (CC BY). The use, distribution or reproduction in other forums is permitted, provided the original author(s) or licensor are credited and that the original publication in this journal is cited, in accordance with accepted academic practice. No use, distribution or reproduction is permitted which does not comply with these terms.
*Correspondence: Gavin T. L. Brown, gt.brown@auckland.ac.nz