Is Difference in Measurement Outcome between Groups Differential Responding, Bias or Disparity? A Methodology for Detecting Bias and Impact from an Attributional Stance
 Amery D. Wu
 Yan Liu
 Jake E. Stone
- Department of Education and Counselling Psychology and Special Education, The University of British Columbia, Vancouver, BC, Canada
Measurement bias is a crucial concern for test fairness. Impact (true group difference in the measured scores) is of the ultimate interest in many scientific inquiries. This paper revisits and refines the definitions for bias and impact and articulates a conceptual framework that decouples them from differential item functioning. The conditions for showing bias and impact are articulated and a methodology for empirically detecting them is proposed. The framework and methodology hinges on attributing bias and impact to the studied groups by way of matching on balance scores (e.g., propensity scores estimated by the confounding covariates). A real data demonstration comparing two test-language groups on the mathematics items of TIMSS is provided as a proof of concept and guide for application. In closing, we draw readers’ attention to some caveats as well as suggestions for adopting this conceptual framework and methodology.
The terms differential item functioning (DIF), impact, and bias often emerge in discourse concerning learning inequity and test fairness. For example, we often encounter such phrases as: “Male students perform better than female students in math,” “This math test question is biased against female students,” or “That math test question functions differently for male and female students.” Although discourse often continues as though there is a consensus about the meaning of these terms, these concepts are often understood quite differently by various interest groups, groups such as validity theorists, test developers, test-takers, psychometricians, testing professionals, and test users.
The purposes of this research project are twofold. The first is to introduce a conceptual framework for investigating bias and impact and decouple these from the technique of DIF. For communication ease, we will refer to the interrelated triplet as DBI (DIF, bias, and impact). Based on the proposed conceptual framework, the second purpose is to further propose a methodology for empirically detecting bias and impact.
The paper is organized as follows. It begins with a brief background of the literature regarding DBI. We then lay out the premises involved for refining the definitions of the DBI. Next, we provide our refined definitions of DBI with an eye on pointing out the connections and distinctions among them. In the fourth section, we propose a methodology for balancing confounding covariates when investigating impact and bias. We also show in what way DIF is related and unrelated to them. This methodology hinges on (but not entirely based on) Rubin’s Causal Model (e.g., Rosenbaum and Rubin, 1983; Rubin, 1997, 2006). We then provide a demonstration with TIMSS mathematics that serves as a proof of concept for the conceptual framework and an application for the proposed methodology. In closing, we discuss some caveats for adopting the proposed conceptualization and methodology.
Background for Bias, DIF, and Impact
Differential Item Functioning
Differential item functioning investigates the unequal probability of a given response between groups of equally capable individuals. Originally called “item bias” research (e.g., Cleary and Hilton, 1968; Scheuneman, 1975), DIF became associated with test fairness, a moral imperative for both developers and test users. The focus of DIF originally was on the possibility that different groups of examinees (focal group vs. the reference group) may react differently to the same test question. Historically, there was a period of time when the concept of DIF was considered synonymous with bias (e.g., Berk, 1982; Millsap and Everson, 1993) and the choice of the term was only a matter of preference. To some extent, this remains the case to this day. Some still directly equate DIF with bias, automatically considering an item as biased if flagged as DIF. This interpretation is, in particular, prevalent among practitioners and applied researchers (e.g., Marotta et al., 2015).
In the preface of their edited book titled Differential Item Functioning, Holland and Wainer (1993) pointed out that “The history of this subject (items that function differently for different groups of examinees) is littered with unfortunate, incomplete, and misleading terminology and vocabulary, which has led to ambiguous expositions and imprecise thinking.” They made clear the need to distinguish the term DIF from bias. “We prefer the more neutral terms, differential item performance or differential item functioning (i.e., [DIF]), to item bias since in many examples of items that exhibit [DIF], the term “bias” does not accurately describe the situation [bias]” (p. 1).
Zumbo (1999) (p. 12) maintained that “DIF is a necessary condition but not a sufficient condition for item bias.” If an item is flagged as DIF, follow-up steps, such as expert review, are needed to judge whether an item is indeed biased by looking into the contents and formats that may affect the success of answering an item correctly. In practice, it is sometimes the case that an item was flagged as DIF but the expert review was unable to find reasons for the presence of DIF (Engelhard et al., 1990; Song et al., 2015).
While DIF items may or may not be evidence for bias, to our knowledge, it has not been argued that an item could be biased even when DIF is absent. This phenomenon counters the statement that DIF is a necessary condition for bias. We suggest that this phenomenon is possible and provide our argument for its existence later in the Section “Conceptual Procedures for the Proposed Methodology.”
To date, a variety of statistical procedures are available for assessing DIF, e.g., Mantel–Haenszel procedure (Holland and Thayer, 1988), item response theory based methods (Lord, 1980; Raju, 1988; Thissen et al., 1993), and logistic regression (Swaminathan and Rogers, 1990; Zumbo, 1999). Because of its relatively clear definition and the readily available methods, literature on DIF is widespread. Gender and ethnic DIF have become standard analyses in many testing programs to address political and legal requirements.
Bias
Studies of bias were first undertaken in the 1960s (e.g., Cardall and Coffman, 1964; Cleary and Hilton, 1968), preceding and anticipating the works on DIF. Earlier bias studies considered whether the predictive validity of a test (with an external criterion) differed among groups (Linn and Werts, 1971; Thorndike, 1971; Boehm, 1972; Humphreys, 1973; Linn, 1973; Hunter and Schmidt, 1976; Darlington, 1978). For example, Cleary (1968) defined a test as unbiased only if the regression lines for groups were identical.
Beginning in the late 1970s and early 1980s, bias studies were developed to compare internal characteristics of a test to accumulate evidence for construct validity between groups (e.g., see review in Jensen, 1976, 1980). Techniques for detecting bias internal to the test included comparing the internal consistency reliability, rank order of item difficulty, item correlation with total score, loadings of the general factor on the items, and relative selection of distractors.
During the 1980s and early 1990s, methods for bias detection focused on item-level difference in item responses. DIF gradually became the standard gate-keeping technique for signaling bias in some characteristic of a test item or testing situation; specifically, characteristics that are not relevant to the test purpose (see review in Camilli and Shepard, 1994; Zumbo, 1999, 2007).1
While the analytical methods were being developed, bias was also investigated through judgment-based expert review. Procedures for bias review were suggested for the testing cycle (Berk, 1982; Hambleton and Rodgers, 1995).
Impact
Traditionally, impact is defined as the true group difference in item performance. Although this definition is semantically simple, it is the least readily comprehensible within the DBI triplet. This is because this definition demands further clarification, in particular, as to what “true” group difference means. At this point, examples may be helpful to get a better sense of what an impact study intends to discover. Hence, by way of example, educators would desire to see that there is no impact between male and female students’ performance on science test items. The presence of impact would indicate that there is a gender disparity in the academic achievement. As a contrasting example, with a goal to validate the items of an English language test, we would desire to see an impact between English-first speakers and novice English-learners.
Impact is perhaps of the ultimate interest to educational researchers because it points to learning gaps and achievement disparities. Statistically Impact was research by groups’ difference in the measurement outcome. For example, Millsap and Everson (1993) (p. 298) stated “Impact refers to group differences in measured performance on tests or items.” For another example, Holland and Thayer (1988) (p. 130) stated that “For example, comparing the proportion of reference and focal group members who give correct answers to a given item is a measure of the item’s impact on the focal group relative to the reference group.” Despite the straightforward definition and its seemingly simple computation, early development led to few empirical reports on impact. This was probably because the simple and straightforward definition of impact is insufficient and incomplete for the following two unresolved contentions. First, for earlier works, item impact is the group difference irrespective of the presence of DIF and bias. Later, scholars held that item impact could not be studied if DIF and/or Bias were present (e.g., Holland and Thayer, 1988; Ackerman, 1992; Shealy and Stout, 1993; Beller, 2014). Second, the difference in item performance may not be “true” if the difference is computed between observed groups. This is because an observed group difference in performance may be confounded with individuals’ characteristics (say, test motivation) that may be irrelevant to the construct that an item intends to measure (say, math ability). Such irrelevant difference may confound the group comparison. Correspondingly, Ackerman (1992) refined the concept of impact as a “between-group difference in test performance caused by a between-group difference on a valid skill (e.g., the difference between the proportion correct caused by the group on a valid item)” (p. 69). Following Ackerman, impact should not be studied if an item is already detected as DIF or biased.
A few studies have proposed methods for distinguishing impact from bias through a form of measurement invariance (e.g., Thissen et al., 1986; Kok, 1988; Mellenbergh, 1989; Ackerman, 1992; Shealy and Stout, 1993; Beller, 2014). Most of these studies were based on a multidimensional latent variable approach. This approach attempts to control additional latent variables identified as the nuisance (unwanted) latent variable while studying the group difference in the first latent variable (the true ability). These nuisance abilities are seen as the source of invalidity (bias) that can undermine the group comparison in the true ability (impact). Unfortunately, the development of these multidimensional methods did not facilitate empirical studies of item impact. This is probably because these methods did not address the challenges of confounding effects inherent in the observational/comparative research design for studying true group difference. Thus, the authors of this paper believe that a more clearly articulated and empirically researchable definition of impact is needed.
In summary, although the conceptual distinctions among DIF, bias, and impact have been pointed out from time to time, they are largely left unattended. Also, as yet, there is no systematic and integrated method to detect bias and impact and decouple them both from DIF and from each other. This is perhaps largely because the two concepts of bias and impact are poorly defined and the two concepts of DIF and bias are not clearly distinguished, thus less amenable to empirical research. Consequently, these uncertainties have led to long-standing confusions in discourse about DBI. It is this frustration that motivates the current work.
The Proposed Conceptual Framework for Bias and Impact
Premises for Refining the Definitions
It is necessary that we synthesize our reflections on the literature. These reflections serve as our premises for proposing the refined definitions and methodology for bias and impact. All these premises will be shown in more detail later in the paper.
1. Although closely interconnected, DIF, bias, and impact denote distinct concepts. Clear definitions for bias and impact are needed to distinguish them from DIF as well as from each other so that methods for detecting and disentangling them can follow feasibly.
2. The definitions and consequent methods for DBI will all be provided at the item level. (Nonetheless, they can be easily extended to the option level of multiple-choice test items or to the subscale/domain level of a test.)
3. DBI should be considered only in the context of group comparisons. Hence, findings are specific to the groups being compared. We take the term groups to mean the symbolic aggregation of individuals among whom the researchers intend to compare. The groups can be individuals considered together because of individuals’ inherent demographic characteristic (e.g., sex and ethnicity), individuals’ self-selective aggregation (e.g., private or public school) or researchers formed/manipulated groups (e.g., experimental groups).
4. Following from the second and third premises, DBI does not simply investigate the characteristics of an item as traditionally viewed. Rather, as we will explain shortly, DBI investigates the characteristics both of an item and of the individuals within each group. The traditional terminologies of “item” impact, “item” bias, or differential “item” functioning can disguise this nature. For this reason, hereafter, we avoid the word “item” when referring to DBI.
5. Impact addresses the issue of group differences in the response outcome (i.e., the item scores or proportion of correct answer). In contrast, DIF and bias deal with the issue of group differences in item responding/answering that can invalidate the group comparison for impact (despite that DIF and bias are also investigated through the response outcome). We will explain this point in more detail later.
6. DIF and bias compare groups of individuals sharing an equal amount of the measured construct (e.g., two groups that are equally good at math). In contrast, impact should be studied without controlling for group differences in the measured construct.
7. Both bias and impact imply an intention to make an attributional claim such that bias and impact are “truly attributable” to the compared groups. Namely, the groups are the reason for impact or bias. Hence, as we shall elaborate shortly, potential threats to the intended attributional inference must be considered.
Revisiting and Refining the Definitions
Based on the above seven premises, we revisit and refine the definitions of DIF, bias, and impact with an eye to explicate the connections and distinctions among them. We will then propose a methodology that detects bias and impact.
Differential Item Functioning
Differential item functioning literature has developed a strong consensus on the meaning of DIF, hence there is no need to refine or re-define DIF. However, the definition is often stated differently in different fields to fit into specific testing, measurement, and assessment contexts (e.g., educational achievement, cognition-based tests, or self-report psychological assessment). We paraphrase these definitions in a more flexible and general tone. DIF is manifest when an item response differs among groups who possess an equal level of the construct that an item intends to measure. Consider an example in which the test items measure students’ math ability (the measured construct). Two groups of individuals using different language versions of the test are compared (e.g., English vs. French, selected by the test-takers). DIF is considered present if a response difference is observed between the two groups who are equally capable in math.
Two features are highlighted for the DIF definition. First, a DIF investigation compares groups who have equal levels of the measured construct, i.e., the level of the measured construct is being controlled in order to detect differential responding/answering. Second, DIF does not intend to establish an attributional claim that differential responding is attributable to the groups. DIF simply investigates whether there is a response difference between the groups with equal levels of the measured construct. Hence, traditional DIF techniques are not in themselves concerned with threats to validity for making an attributional claim that differential responding is attributable to the group composition. This will be self-evident in our upcoming discussion of bias.
Bias
It is biased to compare response outcomes among groups if the observed response difference is attributable to the groups that are equal in the measured construct. In other words, bias is a situation where the group composition is the reason for DIF. Consider the previous example of comparing two test-language groups answering math test questions. One can say that the group comparison on the math item scores is biased if test language is found to be the reason for the two groups to respond to the item differently. In this example, the group composition, e.g., the language of the test is the reason for the groups to respond differently.
Three features are highlighted for our definition of bias. First, if bias is detected, it is the group comparison about the response outcome (item scores) that will be biased. Neither the item nor the group on its own is biased (as people may suggest both in research literature or day to day communications). Second, as in the case of DIF, a bias investigation compares groups who have equal levels of the measured construct. That is, we need to compare equally capable individuals in order to examine whether the groups respond differently to an item. If we compared groups of individuals who had different ability levels (i.e., different math ability) and found that there was a difference in the response outcome, the groups’ difference in the response outcome could reflect the groups’ true difference in ability rather than differential responding. Hence, the levels of the measured construct need to be controlled in order to detect differential responding. Third, because this definition implies an intention to make an attributional claim (i.e., showing that the differential responding can be truly attributed to the composition of the groups), factors that may confound such an attributional claim must be considered.
Impact
Impact is the difference in the item response that is attributable to the group’s difference in the measured construct based on an unbiased group comparison. This is our revision of the unclear “true group difference” definition left vague in the literature.
Four features are highlighted for our definition of impact. First, it is the group that has an impact on the item response (attribution of the response difference to the group composition), rather than items having an impact (as sometimes appears in the literature or day to day communications). Second, there is no need to compare groups of individuals who have equal levels of the measured construct. This is because it is the unequal levels of the construct (if such inequality exists) attributable to the groups that is the very subject of an impact study. Third, an unbiased group comparison is a prerequisite for an impact investigation because the true group difference can not be investigated if the comparison is biased against a certain group. Fourth, as in the case of bias, impact implies an intention to make an attributional claim. Factors that may confound such an attributional claim must be considered.
Attributional Stance for Bias and Impact
Attribution Rather Than Causality
Hunter and Schmidt (1976), p. 1,053 argued that, “… the attempt to define fair [test] use without recourse to substantive and causal [italic added] analysis is doomed to failure.” We agree with the statement. Without a reasoning and analysis that warrant a statement akin to causality, it is impossible to make distinction within the triplet of DBI when it comes to the observed difference between groups.
The gold standard for establishing a strong and conclusive causal claim is a randomized experiment. The validity of a causal claim is built on the belief that that randomization equalizes any pre-existing group differences; thus, the groups differ only in the treatment. If a difference is observed between groups (beyond chance), it must be the treatment that causes the difference (effect).
Bias and impact, however, are mostly, if not always, researched through an observational study. The groups are not formed by the experimenter via random assignment and the grouping is not manipulatable (or not even changeable or selectable). The groups to be compared are simply data characteristics recorded by the researcher (e.g., language, sex, or ethnicity). Each group is a code of the characteristic (e.g., male or female). It is far-fetched to argue a causal inference merely based on the coding scheme for the data. For this reason, we take an “attributional” view for conceptualizing our methodology for bias and impact. That is, group composition is the reason for the observed differential responding and for the observed score difference. This stance is taken in order to broaden out from the very restricted causal view that is tied to a very specific type of research design: manipulation and randomization.
Confounders
Observed groups may differ in many pre-existing characteristics prior to testing. These pre-existing differences may influence groups’ item responding and subsequently have an influence on the response outcome. The term confounder refers to the irrelevant and unwanted pre-existing individual characteristics that covary with both the groups and the test outcome. Say that an attribution is to be assigned to groups (G, test language) for the outcome of item scores (Y). A confounder X (e.g., test motivation) is an unwanted or irrelevant characteristic that invalidates the claim that “Y is attributable to G.” Statistical attribution of Y to G will be obfuscated by the confounder X. If a reasonable attribution of Y to G is to be established, the confounding of X need to be removed.
By way of example, consider a researcher whose focus is solely on how different test languages (G: French vs. English) affect groups’ item responding as well as on whether the groups truly differ in the item response outcome (Y) in a math test. Test motivation (X) pre-exists in both groups, but at different levels (grouping is correlated with test motivation). Say that test motivation is also found to covary with the test outcome but is considered irrelevant to the group comparison for theoretical or utilitarian reasons. In this case, pre-existing differences in test motivation can obfuscate the attribution of the differences in the math item scores to the test language. That is, it is possible that test motivation (rather than test language) is the reason for the groups to perform differently. In this case, the pre-existing group difference in test motivation confounds the attribution of the differences in item performance to the groups. If a reasonable attribution of test outcome variation is to be assigned to test language, the confounding effect of test motivation needs to be removed.
Matching on Balance Scores to Remove Confounding
We adopt the method of balance scores matching for use with our attributional approach for studying bias and impact. The method of balance scores, originated under Rubin’s Causal Model (Rosenbaum and Rubin, 1983; Rubin, 1997, 2006), is a well-established method for equalizing the pre-existing differences in X between observed groups formed without randomization. A balance score, e, is a composite score estimated for the groups of individuals by a set of j covariates Xj (variables that covary with the outcome). It is a multivariate summary of the unwanted pre-existing characteristics Xj of the individuals in each group. To equalize the confounding of Xj between the groups, individuals in one group are matched with the individuals in the other group by their balance scores. That is, the distributions of the e scores are made to be as equal as possible in the exercise of matching the two groups of individuals. As a result, G is independent of Xj, given e. The statistical meaning of the balanced score and matching will be explained in more detail later.
What Makes a Confounder?
It is important to realize that, under the attributional view for bias and impact as we defined them, not all pre-existing differences that covary with Y should automatically be considered as a confounder Xj that needs to be equalized. Only those characteristics that are justified as irrelevant or unwanted to the group composition (G) and the construct measured by the item scores (Y) should be considered as confounders. In our example, test motivation was given as a confounder because this characteristic is associated with both test-language and math outcome but considered as irrelevant to the group composition and the math ability and hence needs to be equalized for the groups.
Note that Rubin’s original causal model was proposed under the experimental presumption of causality (a cause is a treatment or condition that is manipulatable). Under this presumption, the selection of covariates Xj is entirely geared to balance the groups in all pre-existing differences as if that could be achieved by random assignment. In contrast, our framework for bias and impact attest that if a characteristic Xj is justified as an essential or substantive aspect of the group composition and of the measured construct, it should not be treated as a confounder and equalized for the groups, even if it covaries with G and Y. For example, if individuals’ literacy level is considered a part of the construct of math ability, even when it is found to be associated with both test-language groups and math performance, it should not be treated as a confounder and equalized when attributing math scores to the test-language groups. On the contrary, if literacy level is considered as unwanted and irrelevant to the construct of math ability then it should be treated as a confounder.
It is important to emphasize that that researchers must clearly articulate what characteristics should be considered as substantive or essential to the group composition and the measured construct and what characteristics should be considered as confounders to the attribution. What counts as the essential nature of the group and construct is a judgment call. This judgment is used to determine what the group composition and the construct should encompass. This will demand a clear justification of the researcher’s perspective. As such, the judgment call is best considered as part of a broader substantive validity argument and is thus beyond the purpose and scope of this article.
To summarize, our attributional stance on the investigation of bias and impact works to accommodate the infeasibility or lack of group randomization for investigating bias and impact that, by definition, entail a form of causal claim. The validity for making an attributional claim depends on the extent to which the unwanted confounding is removed by balancing the unwanted covariate distributions between the groups. In the following, we explicate the conditions and conceptual procedures for showing bias and impact under this attributional stance. We will then propose our analytical procedures for detecting them afterward.
Conceptual Procedures for the Proposed Methodology
Conditions for Showing Group Comparison Is Biased
DIF Is Not a Sufficient Condition for Bias
There are a wide range of reasons for groups’ differential responding detected by DIF. DIF on its own is insufficient to say that group composition indeed is the reason for the individuals responding differently. This is because differences in the confounders are not considered in a traditional DIF study. A positive DIF result is not a sufficient condition to say the group comparison for the outcome is biased (i.e., differential item responding is attributable to the group composition). Two conditions must be satisfied to claim that a group comparison about the item outcome is biased: (1) the confounders are held equal while studying DIF and (2) DIF is found. Returning to our earlier example, only under the conditions that (1) test motivation is held equal between the test-language groups and (2) equally capable students from the groups turn out to have unequal probability of answering an item correctly, can we say that group comparison about the response outcome is biased.
Following this logic, a bias study can be regarded as an act of DIF attribution. Note that the concept of and method for finding causes or reasons for DIF statistically is a recent endeavor in relatively early development (Lee and Geisinger, 2014; Liu et al., 2016). However, the question of how to directly link DIF to bias has never been clearly articulated before this paper. Herein, we attest that when DIF is attributable to group composition, the group comparison about the item scores will be biased because the group composition is indeed the reason for the groups to respond to an item differentially. Our discussion so far explains why a DIF item may turn out to be unbiased after the two groups are balanced on the covariates. These corollary echoes the historical statement that DIF is not a sufficient condition for bias.
DIF Is Not a Necessary Condition for Bias (Presence of Hidden Comparison Bias)
The very same issue of covariate inequality triggered our thinking on a hardly discussed possibility. That is, it is possible that DIF is not found but comparing the item scores between groups is biased, a scenario we referred to earlier as hidden comparison bias. This is because the groups being compared with or without covariates being balanced, in essence, are different groups. For DIF, the groups are comprised of originally observed individuals; whereas for bias, the groups are covariate-equalized individuals. It is possible that differential responding is found between covariate-balanced groups (bias), but not between the originally observed groups (non-DIF). This possibility refutes the historical belief that DIF is a necessary condition for bias.
Conditions for Showing Groups Having an Impact
Unbiased Comparison Is a Necessary Condition for Studying Impact
When a group comparison about the item scores is biased, impact can not be studied because the true difference is obfuscated by groups’ differential responding (measurement bias). In contrast, for items where the group comparison is found not biased, group impact can be examined further.
Covariate-Balanced Groups Is a Condition for Studying Impact
Impact should not be determined based on the raw observed group difference in the response outcome. The covariates can confound the attribution of difference in the response outcome to the groups. Hence, it would be premature to suggest that English test-language group’s math is poorer than that of the French test-language group simply based on lower raw item scores of the English group. One needs to account for the covariates’ confounding effect (e.g., test motivation) on the attribution of response outcome difference to the groups. That is, covariate distributions need to be balanced between groups before estimating the groups’ difference in the response outcome. If the covariate-balanced groups differ in the outcome, then the group has an impact on the item—one group truly performs better than the other.
Summary
Below are conceptual procedures summarized from the conditions for attributing bias and impact, respectively, to the group composition.
Bias Detection
1. Balance the covariate distributions between the groups.
2. Detect DIF between covariate-balanced groups (detecting bias).
Impact Detection
1. Balance the covariate distributions between the groups.
2. Check if the group comparison is unbiased.
3. Detect group difference between covariate-balanced groups (impact), if and only if the group comparison is unbiased.
Figure 1 integrates the separate steps for bias and impact into a single set of steps for studying both bias and impact. This flowchart also explains the conclusions one can make based on the result of each step (in shade).
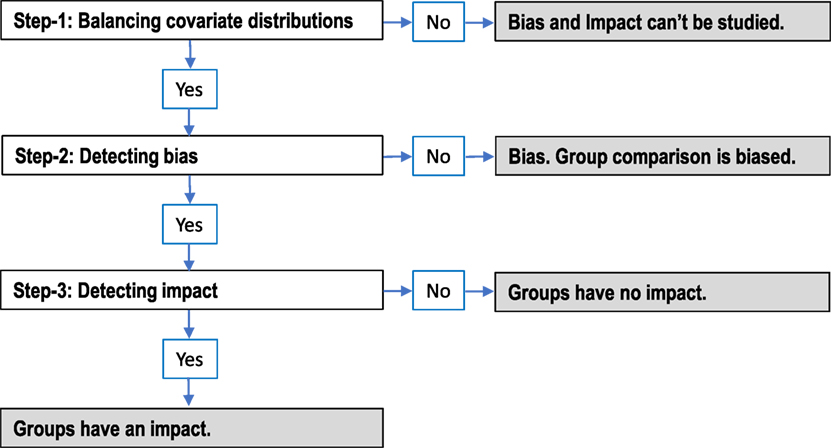
Figure 1. Conceptual steps for detecting bias and impact.
Analytical Procedures for the Proposed Methodology
Figure 1 entails a set of sequentially related steps for decisions about (1) covariates balancing (2) bias (DIF attribution), and (3) impact (true response differences). For each, a variety of statistical techniques are available. Methods for balancing the distributions of confounding covariates, for example, include propensity score matching/stratification, Mahalanobis distance matching/stratification, or covariance adjustment in regression. Likewise, many statistical techniques are available for detecting differential responding, such as IRT-based approach, logistic regression, and Mantel–Haenszel approach. Meanwhile, response difference can be investigated by t-test, ANOVA, odds ratio, Chi-square test, regression, etc. Our proposed methodology does not prescribe particular statistical techniques. The choice of the statistical technique for each step depends on the researchers’ discretion and preference.
In the next section, we will demonstrate the proposed methodology using the statistical technique of our choice—logistic regression and propensity score matching. We chose logistic regression because of its flexibility in handling all three steps of balancing covariates, detecting bias, and detecting impact and handling them in a very integrated and systematic manner. In order to keep this article reasonably brief, we will not give detailed accounts of how to use logistic regression for balancing confounding covariates and detecting bias and impact. This also helps to focus the paper on the conceptualization of methodology rather than the statistical techniques. Readers should refer to the literature for logistic regression (Menard, 1995; Hosmer and Lemeshow, 2000) for DIF (Swaminathan and Rogers, 1990; Zumbo, 1999), and for propensity score matching (Dehejia and Wahba, 2002; Liu et al., 2016).
Our analytical procedures based on logistic regression are specified as follows.
Step-1: Balancing Confounding Covariate Distributions
Three sub-steps are involved in balancing the covariate distributions.
Selecting Covariates Xj
The Xj is a vector of j variables that are related to the item response and the grouping variable but considered as irrelevant to the construct an item intends to measure and irrelevant to the group comparison about the item scores. As we have stressed earlier, the selection of covariates is crucial because the covariates will have major effects on how the confounding will be removed.
Estimating the Balance Scores Using Logistic Regression
The balance score e for an individual is estimated as
where the grouping variable G is predicted by a set of the confounding covariates Xj. The fitted logits (hence the estimated probabilities) is the multivariate summary of the j covariates for each individual and is referred to as the propensity score by the convention of Rubin’s Causal Model. The propensity score is a type of balance score; that is, the scores can be used to balance the covariate distributions between the groups.
Matching on the Propensity Scores
Individuals from one group are matched with individuals from the other group who have the same (or very similar) propensity scores. The purpose is to create two new groups, denoted as G′, of which the confounding covariate distributions will be the same (or very similar). In doing so, the covariates differences between the two matched groups G′, hence the confounding, are removed or minimized. Simply put, G′ is independent of the covariates given the propensity scores e, i.e., If the covariate distributions are balanced between the matched groups, the histogram of the propensity scores of the two matched groups G′ should look very similar.
Step-2: Detecting Bias (Attribution of DIF to Groups)
Once the groups G′ is successfully created by propensity scores matching, the next step is to detect bias; that is, to show whether DIF can be attributed to the group composition. Bias is tested by the statistical significance of b2 and b3 of the logistic regression given as
where Yi denotes the scores of item i, and T denotes the rest total scores (summing the scores over the items of a scale/test excluding the score of the item being studied). The rest total scores serve as the proxy for individuals’ levels of the measured construct. The rest total scores are standardized and controlled for detecting differential responding. The grouping variable G′ examines the uniform bias, a scenario where the groups’ influence on logit is modeled as a constant shift as indicated by a significant estimate of b2 for G′.
The interaction term of T*G′ in Eq. 2 examines the existence of non-uniform bias, a scenario where the group G’s influence on the logit (i.e., b2) is moderated (depending on) individuals’ ability T. The presence of the moderated group influence is indicated by a significant estimate of b3 for T*G. The estimation of logistic regression of Eq. 2 is based on the likelihood function of the discordant matched pairs of G′.2 If uniform or non-uniform bias is detected, we can conclude that over and above the construct that an item intends to measure (math ability), group composition (test language) is still responsible for individuals’ differences in item scores. That is, the group composition is the reason for the groups to respond to the item differently. Hence, any group comparisons about the response outcome will be biased.
Step-3: Detecting Impact
This step detects the true group difference in the response outcome. The detection is carried out only on the items where the group comparison has been shown to be unbiased in Step-2. Impact is tested between propensity-scores-matched groups G′ by the logistic regression model given as
The estimation of logistic regression of Eq. 3 is based on the likelihood function of the discordant matched pairs of G′ (see footnote 2). A statistically significant b1 for the term G′ indicates that the groups have an impact on item i because the probability of correctly answering the item correctly is different between the two covariate-balanced groups. Hence, the group composition is shown to be the reason for the difference in the response outcome. Thus, we can conclude that there is a true difference between the groups.
Real Data Demonstration for the Methodology
The demonstration serves as a proof of concept and guides the application for the proposed methodology. We do not attempt to infer that the findings have any substantive meaning beyond our demonstration purposes. For the sake of this demonstration, suppose that the research purpose was to investigate whether there was a true difference in math ability between two test-language groups. Thus, the construct of research interest in this case is math ability.
The demonstration dataset consists of 822 Grade-8 high school students in Canada who wrote booklet one of the TIMSS 2007 mathematics test. The mean age was 14 (SD = 0.49) and 54% were girls. The groups being compared were students taking the English version (the reference group codes as 0, NE = 541) and the French version (the focal group coded as 1, NF = 281) of the test. This demonstration investigated the 25 items that were dichotomously scored. All analyses were conducted in the statistical packages in R 3.13. the R codes for all the analyses can be found in Liu et al. (2016).
We first ran the traditional DIF, which was not needed for detecting bias or impact. However, we purposefully present the results because they could be informative when compared with those of bias. The traditional DIF analyses were tested by logistic regression in Eq. 2 except that the comparison was between the originally observed groups (G). A statistically significant regression coefficient of b2 for G or b3 for T*G indicates presence of DIF. The results are reported under the heading of “DIF” in Table 1. Out of the 25 items studied, seven group comparisons showed DIF. The following are the results of the 3-steps approach to bias and impact.
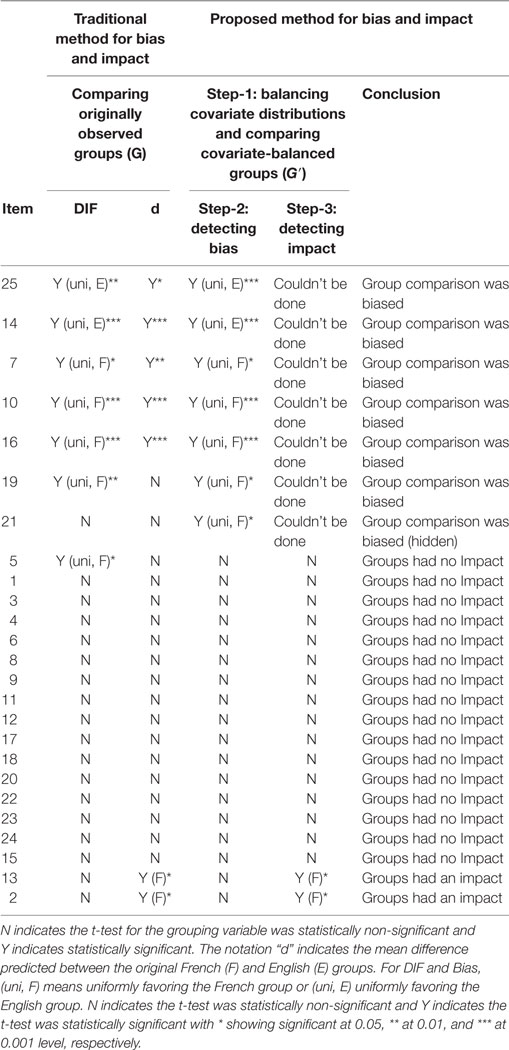
Table 1. Results of group comparison for bias, and impact (DIF results for reference).
Step-1: Balancing Covariate Distributions
Selecting Covariates
Nine of the variables in the background survey of TIMSS were chosen as covariates to estimate the propensity scores. These covariates were the number of books at home, use of calculator, parents’ education, availability of computer, time on math homework, positive affect to mathematics, valuing mathematics, self-confidence in math, and perception about school safety. Note that we naively considered them as irrelevant to the construct of math ability simply for this demonstrative purpose without a grounded substantive support. Nonetheless, to provide an example for the argumentation for the selection of covariates, we provide a feasible reasoning for including the covariate of “time on math homework” as a confounder. To find out whether there was a true group difference in math ability, based on the TIMSS scores, we covariate out the influence of “time on math homework,” which we believed was irrelevant to the construct of “pure” math ability and needed to be removed from the comparison. Had our purpose been to compare group difference in math “achievement,” we would not have removed influence of “time on math homework.” We would consider “time on math homework” an essential part of the construct of math achievement and retain it while studying the group difference in math achievement. The distinction (in our demonstrative example) between defining the construct as ability vs. achievement is the key reason for the inclusion and exclusion of the covariate of “time on math homework.”
Estimating the Propensity Scores
Using the glm2 package in R, the group membership of test language (G) was predicted by the nine covariates (Xj) following Eq. 1. The fitted probabilities of group membership were used in the next step as the individuals’ balance scores on which the groups were matched to balance the covariate distributions. The two histograms on the left of Figure 2 show the distributions of the propensity scores for the two groups before matching. The distributions appear fairly different for the two groups. This indicates that the groups were fairly different in the nine confounding covariates (summarized by the multivariate composite of propensity scores).
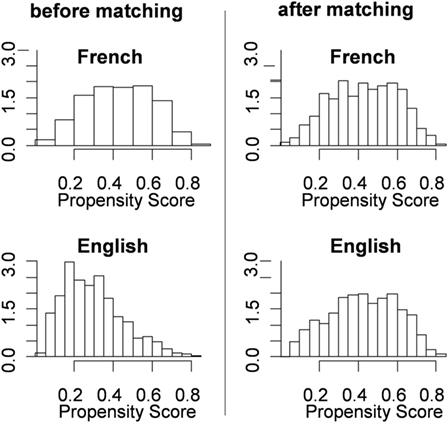
Figure 2. Propensity scores distributions of the two groups before and after matching. The y-axis shows the (expected) frequencies for different propensity scores.
Matching on the Propensity Scores
We matched the groups by the method of Optimal Full Matching (with a combination of matching one-to-multiple and multiple-to-one) using the package MatchIt in R (Ho et al., 2011). Simply put, this method matched each student in the French group to one or more students in the English group who had very similar propensity scores. Likewise, each student in the English group was matched to one or more students in the French group who had very similar propensity scores. Before matching, the mean of the propensity scores for the English (reference) group was 0.296 and for the French (focal) group was 0.430, with a difference of 0.134. After matching, the mean of the English group was adjusted to 0.388 with a difference from the French Group reduced to only 0.043. The two histograms on the right of Figure 2 show the propensity distributions of the two groups after matching. The disparity between the two distributions diminished vastly after matching. The distributions look fairly similar indicating that the differences in the covariates were virtually balanced.
Step-2: Detecting Bias
Results of bias were obtained from fitting Eq. 2. A statistically significant regression coefficient of b2 for G′ or b3 for T*G′ indicates the presence of bias. Table 1 reports the results under the heading of “Step-2: Detecting bias.” Seven group comparisons were detected as biased. Among the seven, six of them were detected as DIF by the traditional DIF method (comparing G). Nonetheless, group comparison of Item 5 that was detected as DIF was not found to be biased. This finding shows that although DIF was found for Item 5, after the confounding was removed, group comparison was found to be not biased. Hence, test language was not found to be a reason for differential responding to Item 5.
Also worth attention is the finding of hidden comparison bias from Item 21. This item was found to be biased but not detected as DIF by the traditional DIF method (comparing G). This finding shows that test language was the reason for the groups to respond differently to Item 21. However, DIF was unable to detect this bias because DIF compared the originally observed groups (G) without removing the confounding effects.
Step-3: Detecting Impact
The true group difference was detected using logistic regression in Eq. 3 comparing the two groups (G′) that were matched by the propensity scores. A statistically significant regression coefficient b1 of the G′ variable indicates that the group had different probability of answering the item correctly. Note that impact was tested only for the 18 items of which group comparison was not found to be biased in Step-2. Table 1 reports the results under the heading of “Step-3: Detecting impact.” Test-language groups had an impact on Item 2 and 13 (shown in the last two rows under the heading of Step-3). The results suggest that there was a performance disparity between the groups and the disparity was attributable to the test-language groups. Test-language groups were found to have no impact on the rest of 16 items. The groups performed equally well and showed no disparity on these 16 items.
Table 1 also reports the raw group difference estimated by a logistic regression same as Eq. 3 except that the groups were originally observed groups (G). This report is not necessary for our method for studying impact but is provided to compare group difference before and after matching on the confounding covariates. Without balancing the covariate distributions, it was found that seven groups comparisons showed statistically significant difference. After groups are matched (and biased comparisons were excluded from the impact study), only two items (Item 2 and 13) were detected to have a true difference.
Summary of the Results
The last column of Table 1 reports the conclusion of bias and impact for each item. Table 2 demonstrates the summary of the test-level results as well as the direction and interpretation for bias and impact.
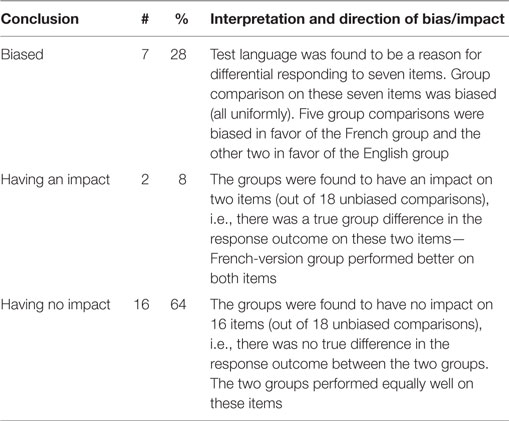
Table 2. Summary of test-level results of group comparison for studying bias and impact.
Discussion
This paper reviewed and refined the definition of DIF, bias, and impact in the context of group comparison at the item level. Based on our refined definitions and attributional stance, the conceptual and analytical procedures were proposed for bias and impact. A real data demonstration with logistic regression provided a proof of concept and guide for application.
Our conceptual framework, methodology, and demonstration show that it is insufficient to study bias and impact without taking the confounders into account. With the proposed methodology, attribution of bias and impact to the groups is achievable based on the observed group difference without randomization. Especially, we articulated and demonstrated why DIF is neither a necessary nor a sufficient condition for bias. Our attributional DIF approach better showcases the existence of bias. Moreover, we show that a raw item-score difference between original observed groups is not sufficient to document a true disparity. Group’s impact, as we define and investigate it, better showcases the true disparity.
In the following, we draw readers’ attention to some important caveats and suggestions for applying this methodology.
Our proposed method entails researchers’ judgments in deciding what pre-existing differences should be considered as confounders and controlled when attempting to show bias and impact are attributable to the groups. The legitimacy of these judgments has a pivotal implication on the validity of the results and their interpretation. On the one hand, omitting important covariates may overlook the possible confounding that can invalidate the attributional claim. Researchers must have this consideration in mind at the design stage so that important covariates are collected. Without the information on these important covariates, the proposed methodology for bias and impact will be not feasible. On the other hand, removing characteristics that are an essential and substantive part of the construct can also invalidate the conclusion for bias and impact. This is because it will lessen the validity of the comparison if a meaningful characteristic is removed from the measured construct (throwing out the baby with the bath water, so to speak).
As a distinct issue, we recognize that the term bias has a generic meaning and can be discussed in different research or practical contexts, e.g., where the question of bias asked is not necessarily an attributional one (e.g., misuse of the test scores). Herein, we have discussed the concepts and methods for detecting bias in the very particular stance of attributing bias and impact to the groups. We maintain our definition of bias holds within this conceptual framework and make no claims as to its relevance beyond this framework. Moreover, our method for detecting bias neither negates nor replaces the need for judgment-based approaches to investigating bias. Subject experts’ reviews on items found to be biased helps to gain more insight on the reasons for bias. Furthermore, it would be informative to conduct a review comparing conventional DIF method vs. our bias procedures in terms of how well they pick up the potential content biases.
Although studying bias is integral to the pursuit of validity evidence for measurement, our framework presumes that the items are quality measures of the construct they intend to measure. If the items are invalid measures of the construct, detection of bias and impact is in vain. For this reason, presumable validity of the items is a prerequisite for our methodology and is a paramount concern, albeit beyond the scope of this paper. It is important that our method be used on items that are shown to be, at least, a quality measure of the targeted construct.
We stress that our methodology was presented as an illustration of the conceptual procedures rather than a prescription for the statistical procedures. It is at the researchers’ discretion and hence responsibility to choose the statistical technique for each analytical step that are appropriate for their data.
Although our data example was demonstrated with a cognitive test of math ability, the proposed methodology can be applied to measures of social-psychological constructs based on self-report of inclination, attitude, valuing, tendency while controlling for social desirability, for instance, as one of the possible cofounders. In closing, we believe that the proposed conceptual framework serves to systematically disentangle the confusions relating to bias, DIF, and impact. With a clear conceptual framework in place and feasible methodology that follows the framework, we hope to facilitate more empirical investigations on biases in comparison and, ultimately, group disparities in the response outcomes.
Author Contributions
AW: leading author who originated the idea and took major role for the completion of this paper. YL: the person who developed the propensity score DIF method and executed the data analysis for demonstration. JS: key person in assisting the conceptualization of the major concepts and methodology of this paper. DZ: assisted in the data analysis and writing of this paper. BZ: assisted in the writing and review of this paper.
Conflict of Interest Statement
The authors declare that the research was conducted in the absence of any commercial or financial relationships that could be construed as a potential conflict of interest.
The reviewer, TS, and handling editor declared their shared affiliation, and the handling editor states that the process nevertheless met the standards of a fair and objective review.
Footnotes
- ^Test-score bias was also examined at the test level via multi-group confirmatory factor analysis. Bias is discussed in the context of equivalence in the measurement model relating the latent variables with the observed items scores. Increasing levels of measurement invariance labelled as configural, weak, strong, and strict invariance investigate the augmented equivalence in the configure, intercepts, slopes, and residual variances of the measurement model (Cheung and Rensvold, 1999; Meredith, 1993; Vandenberg and Lance, 2000). Failing to show strong invariance between groups is regarded as evidence for measurement bias.
- ^For case–control studies, as in the current case where the two groups of participants were matched, the conditional likelihood estimation is used (often referred to as conditional logistic regression). Estimation of conditional logistic regression is based on the likelihood function of only the discordant pairs (matched cases that have different outcomes). The concordant pairs are disregarded because they cannot provide any information for likelihood estimation.
References
Ackerman, T. A. (1992). A didactic explanation of item bias, item impact, and item validity from a multidimensional perspective. J. Educ. Meas. 29, 67–91. doi: 10.1111/j.1745-3984.1992.tb00368.x
Beller, M. (2014). “Test bias detection,” in Wiley StatsRef: Statistics Reference Online. doi:10.1002/9781118445112.stat06399
Berk, R. A. (ed.) (1982). Handbook of Methods for Detecting Test Bias. Baltimore, MD: The Johns Hopkins University Press.
Boehm, V. R. (1972). Negro-white differences in validity of employment and training selection procedures. J. Appl. Psychol. 56, 33–39. doi:10.1037/h0032130
Camilli, G., and Shepard, L. A. (1994). Methods for Identifying Biased Test Items. Thousand Oaks, CA: SAGE.
Cardall, C., and Coffman, W. E. (1964). A Method for Comparing the Performance of Different Groups on the Items in a Test. Princeton, NJ: Educational Testing Service. Research Bulletin RB-64-61.
Cheung, G. W., and Rensvold, R. B. (1999). Testing factorial invariance across groups: a reconceptualization and proposed new method. J. Manage. 25, 1–27. doi:10.1177/014920639902500101
Cleary, T. A. (1968). Test bias: prediction of grades of Negro and white students in integrated colleges. J. Educ. Meas. 5, 115–124. doi:10.1111/j.1745-3984.1968.tb00613.x
Cleary, T. A., and Hilton, T. L. (1968). An investigation of item bias. Educ. Psychol. Meas. 28, 61–75. doi:10.1177/001316446802800106
Darlington, R. B. (1978). Cultural test bias: comment on Hunter and Schmidt. Psychol. Bull. 85, 673–674. doi:10.1037/0033-2909.85.4.673
Dehejia, R. H., and Wahba, S. (2002). Propensity score-matching methods for nonexperimental causal studies. Rev. Econ. Stat. 84, 151–161. doi:10.1162/003465302317331982
Engelhard, G. Jr., Hansche, L., and Rutledge, K. E. (1990). Accuracy of bias review judges in identifying differential item functioning on teacher certification tests. Appl. Meas. Educ. 3, 347–360. doi:10.1207/s15324818ame0304_4
Hambleton, R., and Rodgers, J. (1995). Item bias review. Pract. Assess. Res. Eval. 4. Available at: http://PAREonline.net/getvn.asp?v=4&n=6
Ho, D. E., Imai, K., King, G., and Stuart, E. A. (2011). MatchIt: Nonparametric Preprocessing for Parametric Causal Inference. R Package Documentation. Available at: http://r.iq.harvard.edu/docs/matchit/2.4-20/matchit.pdf
Holland, P. W., and Thayer, D. T. (1988). “Differential item performance and the Mantel-Haenszel procedure,” in Test Validity, eds H. Wainer and H. I. Braun (Hillsdale, NJ: Erlbaum), 129–145.
Hosmer, D. W., and Lemeshow, S. (2000). Applied Logistic Regression Analysis, 5th Edn. New York: Wiley.
Humphreys, L. G. (1973). Statistical definitions of test validity for minority groups. J. Appl. Psychol. 58, 1–4. doi:10.1037/h0035199
Hunter, J. E., and Schmidt, F. L. (1976). Critical analysis of the statistical and ethical implications of various definitions of test bias. Psychol. Bull. 83, 1053–1071. doi:10.1037/0033-2909.83.6.1053
Kok, F. (1988). “Item bias and test multidimensionality,” in Latent Trait and Latent Class Models, eds R. Langeheine and J. Rost (New York: Plenum), 263–274.
Lee, H., and Geisinger, K. F. (2014). The effect of propensity scores on DIF analysis: inference on the potential cause of DIF. Int. J. Test. 14, 313–338. doi:10.1080/15305058.2014.922567
Linn, R. L. (1973). Fair test use in selection. Rev. Educ. Res. 43, 139–161. doi:10.3102/00346543043002139
Linn, R. L., and Werts, C. E. (1971). Considerations for studies of test bias. J. Educ. Meas. 8, 1–4. doi:10.1111/j.1745-3984.1971.tb00898.x
Liu, Y., Zumbo, B. D., Gustafson, P., Huang, Y., Kroc, E., and Wu, A. D. (2016). Investigating causal DIF via propensity score methods. Pract. Assess. Res. Eval. 21. Available at: http://pareonline.net/getvn.asp?v=21&n=13
Lord, F. M. (1980). Applications of Item Response Theory to Practical Testing Problems. Hillsdale NJ: Erlbaum.
Marotta, L., Tramonte, L., and Willms, J. D. (2015). Equivalence of testing instruments in Canada: studying item bias in a cross-cultural assessment for preschoolers. Can. J. Educ. 38, 1–23. doi:10.2307/canajeducrevucan.38.2.13
Mellenbergh, G. J. (1989). Item bias and item response theory. Int. J. Educ. Res. 13, 127–143. doi:10.1016/0883-0355(89)90002-5
Meredith, W. (1993). Measurement invariance, factor analysis and factorial invariance. Psychometrika 58, 525–543. doi:10.1007/BF02294825
Millsap, R. E., and Everson, H. T. (1993). Methodology review: statistical approaches for assessing measurement bias. Appl. Psychol. Meas. 17, 297–334. doi:10.1177/014662169301700401
Raju, N. S. (1988). The area between two item characteristic curves. Psychometrika 53, 495–502. doi:10.1007/BF02294403
Rosenbaum, P. R., and Rubin, D. B. (1983). The central role of the propensity score in observational studies for causal effects. Biometrika 70, 41–55. doi:10.1093/biomet/70.1.41
Rubin, D. B. (1997). Estimating causal effects from large data sets using propensity scores. Ann. Intern. Med. 127, 757–763. doi:10.7326/0003-4819-127-8_Part_2-199710151-00064
Scheuneman, J. D. (1975). A new method of assessing bias in test items. Paper Presented at the Annual Meeting of the American Educational Research Association, Washington, DC (ERIC Document Reproduction Service No. ED 106359).
Shealy, R., and Stout, W. (1993). A model-based standardization approach that separates true bias/DIF from group ability differences and detects test bias/DTF as well as item bias/DIF. Psychometrika 58, 159–194. doi:10.1007/BF02294572
Song, X., Cheng, L., and Klinger, D. (2015). DIF investigations across groups of gender and academic background in a large-scale high-stakes language test. Pap. Lang. Test. Assess. 4, 97–124.
Swaminathan, H., and Rogers, H. J. (1990). Detecting differential item functioning using logistic regression procedures. J. Educ. Meas. 27, 361–370. doi:10.1111/j.1745-3984.1990.tb00754.x
Thissen, D., Steinberg, L., and Gerrard, M. (1986). Beyond group-mean differences: the concept of item bias. Psychol. Bull. 99, 118. doi:10.1037/0033-2909.99.1.118
Thissen, D., Steinberg, L., and Wainer, H. (1993). “Detection of differential item functioning using the parameters of item response models,” in Differential Item Functioning: Theory and Practice, eds P. W. Holland and H. Wainer (Hillsdale, NJ: Lawrence Erlbaum Associates), 67–113.
Thorndike, R. L. (1971). Concepts of culture-fairness. J. Educ. Meas. 8, 63–70. doi:10.1111/j.1745-3984.1971.tb00907.x
Vandenberg, R. J., and Lance, C. E. (2000). A review and synthesis of the measurement invariance literature: suggestions, practices, and recommendations for organizational research. Organ. Res. Methods 3, 4–70. doi:10.1177/109442810031002
Zumbo, B. D. (1999). A Handbook on the Theory and Methods of Differential Item Functioning (DIF). Ottawa: National Defense Headquarters.
Keywords: attribution, balance scores, differential item functioning, differential item responding, impact, measurement bias, propensity scores, Rubin’s Causal Model
Citation: Wu AD, Liu Y, Stone JE, Zou D and Zumbo BD (2017) Is Difference in Measurement Outcome between Groups Differential Responding, Bias or Disparity? A Methodology for Detecting Bias and Impact from an Attributional Stance. Front. Educ. 2:39. doi: 10.3389/feduc.2017.00039
Received: 13 May 2017; Accepted: 17 July 2017;
Published: 08 August 2017
Edited by:
Christina Wikstrom, Umeå University, SwedenCopyright: © 2017 Wu, Liu, Stone, Zou and Zumbo. This is an open-access article distributed under the terms of the Creative Commons Attribution License (CC BY). The use, distribution or reproduction in other forums is permitted, provided the original author(s) or licensor are credited and that the original publication in this journal is cited, in accordance with accepted academic practice. No use, distribution or reproduction is permitted which does not comply with these terms.
*Correspondence: Amery D. Wu, amery.wu@ubc.ca