The Complexity of Assessing Student Work Using Comparative Judgment: The Moderating Role of Decision Accuracy
 Tine van Daal1*
 Marije Lesterhuis1
 Liesje Coertjens1,2
 Marie-Thérèse van de Kamp3
 Vincent Donche1
  Sven De Maeyer1
- 1Department of Training and Education Sciences, University of Antwerp, Antwerp, Belgium
- 2Psychological Sciences Research Institute, Université catholique de Louvain, Louvain-la-Neuve, Belgium
- 3Research Institute of Child Development and Education, University of Amsterdam, Amsterdam, Netherlands
Nowadays, comparative judgment (CJ) is used to assess competences. Judges compare two pieces of student work and judge which of both is better regarding the competence assessed. Using these pairwise comparison data, students’ work is scaled according to its quality. Since student work is highly information loaded and heterogeneous of nature, this raises the question whether judges can handle this type of complex judgments? However, research into the complexity of CJ and its relation with decision accuracy is currently lacking. Therefore, this study initiates a theoretical framework on the complexity of CJ and relates it to decision accuracy. Based on this framework, two hypotheses are formulated and their plausibility is examined. The first hypothesis states that the distance between two pieces of student work on the rank-order (rank-order distance) is negatively related to experienced complexity, irrespectively of decision accuracy. In contrast, hypothesis 2 expects decision accuracy to moderate the relation between rank-order distance and experienced complexity. A negative relation is expected for accurate decisions. Meanwhile, inaccurate decisions are assumed to result in higher experienced complexity than accurate decisions, irrespective of rank-order distance. In both hypotheses, judges are expected to vary in mean experienced complexity as well as in the strength of the expected relationship between rank-order distance and experienced complexity. Using an information-theoretic approach, both hypotheses are translated into a statistical model and their relative fit is assessed. All analyses are replicated on three samples. Sample 1 and 2 comprise CJ data on the assessment of writing, while sample 3 contains pairwise comparison data on the assessment of visual arts. In all samples, results unambiguously confirm the moderating role of decision accuracy (hypothesis 2). Inaccurate decisions are experienced as more complex than accurate decisions, irrespective of rank-order distance. Meanwhile, for accurate decisions, rank-order distance is negatively related to experienced complexity. In line with expectations, differences between judges are found in mean experienced complexity and in the strength of the relationship between rank-order distance and experienced complexity. Suggestions for further theory development are formulated based on the results of this study.
Introduction
Recently, comparative judgment (CJ) was introduced into the field of educational measurement to assess competences, such as mathematical understanding (Jones et al., 2015), geography (Whitehouse and Pollitt, 2012), design and technology (Seery et al., 2012), and writing (Pollitt, 2012a; van Daal et al., 2016). Judges are presented with two pieces of student work (e.g., essays or portfolio’s) and are asked to judge which piece shows more of the competence assessed. The outcomes of multiple pairwise comparisons are analyzed using the Bradley–Terry–Luce model (Bradley and Terry, 1952; Luce, 1959) and result in a quality estimate for each piece of student work (expressed in logits) and an accompanying standard error. Based on these estimates, student work is scaled by its quality (for an extended explanation on the statistical model and its formula see Bramley, 2007; Pollitt, 2012a,b). Although CJ is rooted in the work of Thurstone on the measurement of attitudes and social values (e.g., Thurstone, 1927a,b), its current application to pieces of student work raises some critical questions.
These concerns stem from fundamental differences between student work and the stimuli originally used by Thurstone. Thurstone (1927c) asked judges to compare statements reflecting attitudes toward, for example, seriousness of crime. The simple and homogeneous character of these stimuli highly contrasts with that of student work. Thurstone (1927a) already indicated that the heterogeneous character of student work might cause variability in the CJ process and undermine the assumptions underpinning its use (Thurstone, 1927b). Furthermore, as high information load increases the amount of information that judges have to process in order to decide on the winner, it adds to the complexity of the judgment task (Campbell, 1988). This raises the question whether this type of CJ task is not too complex for judges. Research on the complexity of CJ is, however, scarce.
Two perspectives on the complexity of CJ emerge. The first perspective focuses on judges’ experiences with the complexity of the CJ task. Mostly qualitative evidence supports that judges experience some comparisons as being too difficult to decide on (Black, 2008; Pollitt, 2012a; Whitehouse, 2012). Furthermore, judges experience more self-confidence in their decisions for some CJs than for others. As self-confidence was found to positively relate to decision accuracy (Gill and Bramley, 2013), this underpins the significance of judges’ experienced complexity for judgment quality. The latter study also incorporates the second perspective on complexity: complexity as an objective characteristic of the judgment task. In this regard, Gill and Bramley (2013) evidence that larger quality differences between two pieces of student work are related to higher decision accuracy. This finding underpins Pollitt’s (2012b) remark that comparisons of two pieces of student work with a similar quality are more difficult for judges. In sum, both self-confidence (experienced complexity) and quality differences between student work (objective complexity) seem to matter, but empirical research integrating both perspectives is lacking which is needed for further theoretical understanding.
Therefore, this study aims to broaden the theoretical base of the interrelatedness between both perspectives on the complexity of CJ and relate it to decision accuracy. Subsequently, the expected relationships between experienced complexity, rank-order distance as an indicator of objective complexity and decision accuracy will be empirically tested.
Theoretical Framework
First, objective and experienced complexity are connected using the framework on task complexity of Campbell (1988). Then, this framework on complexity is applied to CJ by describing rank-order distance and decision accuracy and relating them to one another. Finally, the theoretical relations between rank-order distance, decision accuracy, and experienced complexity are explained.
Campbell’s Framework on Task Complexity
The framework on task complexity, as laid out by Campbell (1988) provides a good starting point to theorize on the complexity of CJ. Two reasons underpin its fitness for application to CJ. First, Campbell (1988) distinguishes between objective complexity and experienced complexity. This matches with the two perspectives on complexity currently emerging within the literature on CJ. Second, according to Campbell (1988) judgment tasks are complex tasks that are characterized by selecting information from different sources and integrate this information to come to an overall judgment. The latter description fits with the task judges have to carry out while comparing student work.
According to Campbell (1988), the objective complexity of a task is defined by task characteristics that enhance the amount, diversity, and/or uncertainty of the information that task-doers have to handle to complete their task. Experienced complexity is conceptualized as the task-doer’ subjective reaction to the objective complexity of the task. Since task-doers differ in information handling capacity and task familiarity, experienced complexity of the same objective complex task is expected to vary between task-doers. In the following paragraphs, Campbell’s (1988) framework on task complexity will be applied to CJ.
Rank-Order Distance As an Indicator of Objective Complexity
In CJ, the judgment task requires judges to compare two pieces of student work and decide on which is better with regard to a specified quality (Pollitt, 2012a,b). As such, comparisons are at the heart of the CJ process and judges’ ability to correctly decide for any pair given is a central assumption underpinning its use (Thurstone, 1927a,b). Consequently, comparison characteristics define the objective complexity of CJ. To gain insight into the objective complexity of a comparison, it is useful to picture its relationship with the composing pieces of student work and the rank-order. Since student work can encompass a broad range of products representing the competence to be assessed by CJ, from now on student work will be referred to by “representations.” As can be seen in Figure 1, each comparison is a combination of two representations. Each representation has a certain quality that is reflected by its location on the rank-order. Combining two representations results in a comparison characterized by a certain quality difference between both representations. This quality difference mirrors their rank-order distance.
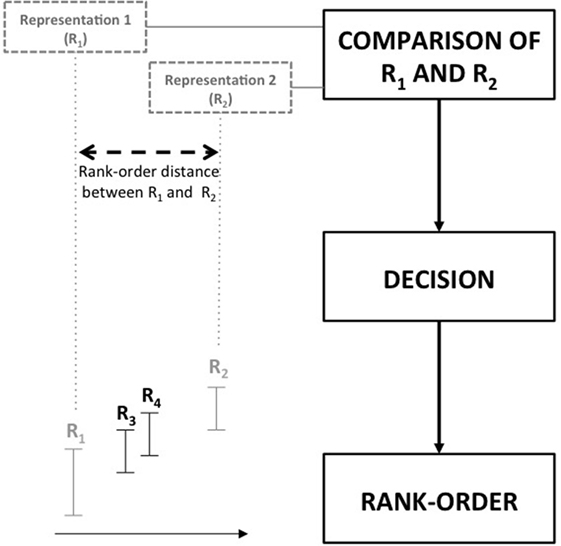
Figure 1. Relationships between comparison, representations and rank-order.
According to Thurstone (1927a), the distance on the rank-order between two representations has to be large enough to enable correct judgment. He suggested that “The proportion of correct judgments will of course increase if the two stimuli are chosen farther apart” (Thurstone, 1927b, p. 378). Consequently, rank-order distance can be conceptualized as an objective comparison characteristic that defines its objective complexity. If a judge compares two pieces of student work far apart on the rank-order (for example R1 and R2 in Figure 1), it is easier to discriminate between both. Consequently, its decision uncertainty and objective complexity are low. In contrast, distinguishing between two representations of similar quality results in a comparison with high decision uncertainty. Accordingly, its objective complexity is high. The comparison of R3 and R4 (see Figure 1) is an example of the latter.
The rank-order distance between two representations is estimated by subtracting the quality estimate, resulting from application of the Bradley–Terry–Luce model (Bradley and Terry, 1952; Luce, 1959), of the winning piece from that of the losing piece. Since inaccurate decisions result in a negative rank-order distance, the absolute value of the resulting difference is used. Rank-order distance expresses the estimated distance between the two pieces of work in logits: the log of the odds that one piece will win over the other (Pollitt, 2012a,b). Comparing two representations of exactly the same quality results in a rank-order distance of 0 whereby each piece has a probability of 50% to win the comparison. As the rank-order distance increases, the two representations are further apart on the rank-order and the comparison is supposed to become objectively less complex. Pollitt (2012b) suggests that judges are capable of deciding on comparisons with a decision uncertainty of at least 66%. He made this suggestion within the context of adaptive CJ (see Pollitt, 2012a,b) whereby comparisons are targeted at a specified rank-order distance to increase the efficiency of CJ while warranting feasibility for judges. However, empirical evidence that underpins this suggestion or that even substantiates the nature of the relationship of rank-order distance with decision accuracy or with judges’ experienced complexity is lacking.
Decision Accuracy in CJ
To define decision accuracy in CJ, it is necessary to take its relationship with the final rank-order into account. Since multiple pairwise comparisons by multiple judges are used to generate a rank-order of representations, the rank-order reflects the shared consensus across all judges on what constitutes quality (Pollitt, 2012a,b). In this context, decision accuracy refers to the consistency of an individual decision with the final rank-order that is based on the shared consensus across judges. Looking at Figure 1, if a judge compares R3 with R2 and chooses R3 over R2, than this decision is classified as inaccurate. Because based on the shared consensus, R2 is top-ranked and is expected to win its comparison with R3. This dichotomous view on decision accuracy can, however, be challenged.
Since decision uncertainty is related to rank-order distance, the latter should be taken into account when conceptualizing on decision accuracy. Comparing two representations of the same quality (rank-order distance = 0) results in a comparison with a probability of 50% for each representation to win the comparison (see Figure 2). Consequently, this type of comparison resembles a gambling decision and a judge picking the wrong representation can hardly be seen as taking an inaccurate decision. If the rank-order distance increases, decision uncertainty quickly diminishes. For example, a comparison of two representations with a rank-order distance of 2 logits results in a probability of 12% that the lower-ranked representation will win its comparison (see Figure 2). In this case, decision uncertainty is very low and picking the wrong representation can be conceptualized as a true inaccurate decision. Which rank-order distance indicates the boundary between gambling and making an inaccurate decision is unclear.
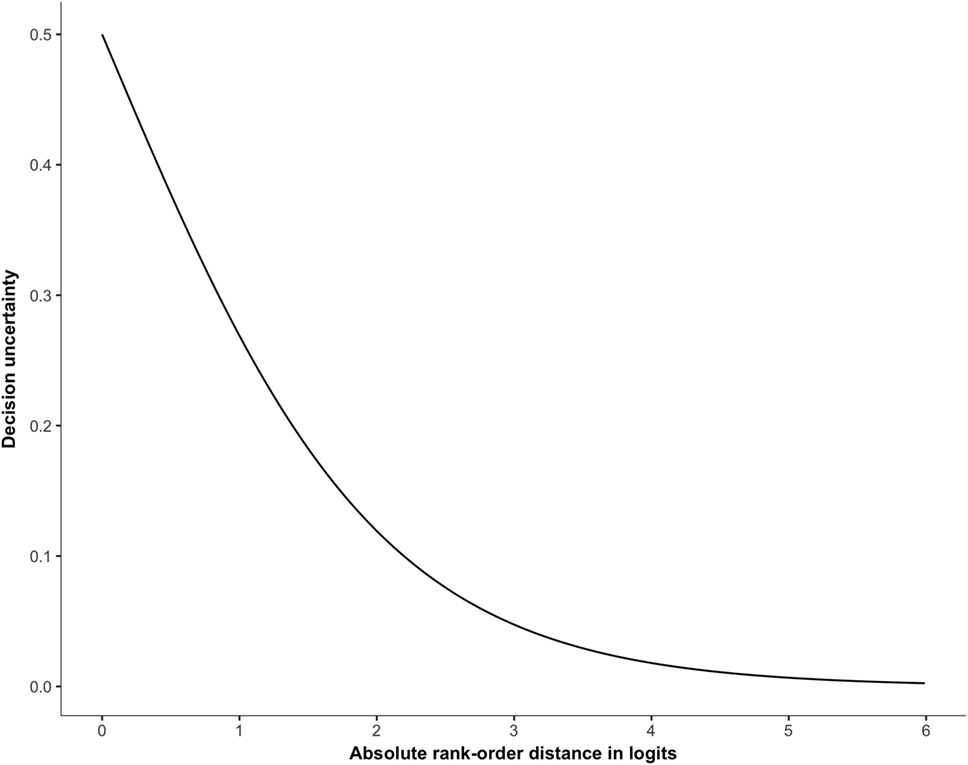
Figure 2. Relationship between rank-order distance and decision uncertainty (in probabilities).
Relationships of Rank-Order Distance and Decision Accuracy with Experienced Complexity
A negative relationship between rank-order distance and experienced complexity is expected (Pollitt, 2012b). As the rank-order distance between two representations increases, the probability for one of both representations to win its comparison rises. In other words, decision uncertainty diminishes and consequently the comparison is expected to be experienced as less complex. Theoretically, a rank-order distance of 0 logits corresponds to a comparison with the most uncertain outcome: both representations have a probability of 50% to win the comparison. Therefore, it can be hypothesized that a lack of distance between two representations is related to the highest experienced complexity.
Since rank-order distance and decision accuracy are theoretically related, the latter needs to be taken into account. As decision accuracy is relative to the shared consensus across judges, it can only be identified after establishing the final rank-order. Therefore, one possibility is that judges are unaware of the inaccurateness of their decision while making CJs. In this case, decision accuracy is unrelated to experienced complexity and only rank-order distance specifies judges’ experienced complexity. Then, the same negative relationship between rank-order distance and experienced complexity is expected for both accurate and inaccurate decisions. However, a study on raters’ meta-cognitive strategies found that inaccurate raters tend to feel more uncertain about their decisions (Zhang, 2016). Furthermore, Gill and Bramley (2013) evidence in their study that judges’ self-confidence in their decisions and the amount of correct decisions are positively related while controlling for mark difference. This suggests that the way judges experience a comparison is related to the accuracy of their decision. In the latter case, inaccurate decisions are hypothesized to be associated with higher experienced complexity than accurate decisions, irrespectively of the rank-order distance between both representations.
Finally, since experienced complexity results from the interaction between objective complexity and judges, it varies between judges (Campbell, 1988). Consequently, judges are expected to differ in mean experienced complexity. In other words, judges are assumed to differ in how complex they experience a comparison of the same rank-order distance. Furthermore, the strength of the expected negative relation between rank-order distance and experienced complexity is also supposed to vary between judges. The latter means that the same increase in rank-order distance is associated with a different decrease in experienced complexity across judges.
The Present Research
The present study investigates two hypotheses concerning the relationships between rank-order distance, decision accuracy, and experienced complexity.
The first hypothesis (H1, Figure 3) assumes that the relationship between rank-order distance and experienced complexity is invariant to the accuracy of the decision. Hence, it is solely the rank-order distance between both representations that specifies experienced complexity. Following the suggestion of Pollitt (2012b), a negative relation between rank-order distance and experienced complexity is expected. Finally, it is assumed that judges differ in mean experienced complexity and in the strength of the negative relationship between rank-order distance and experienced complexity. The gray lines in Figure 3 visualize the expected variation in experienced complexity between judges.
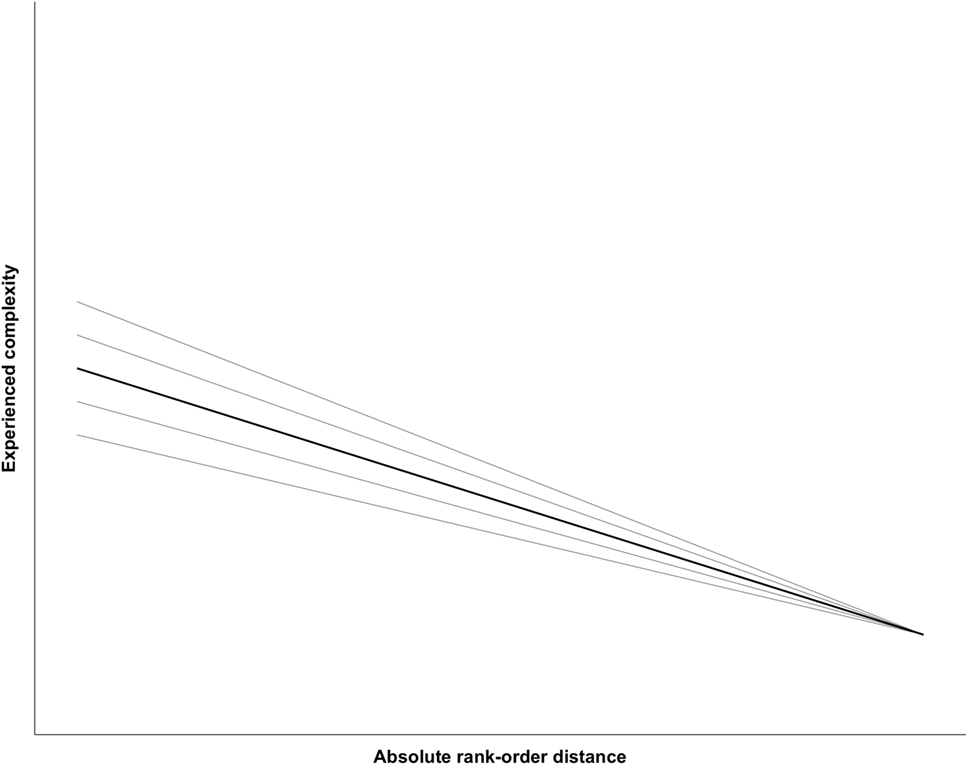
Figure 3. Visualization of hypothesis 1.
Hypothesis 2 (H2, Figure 4) differs only from H1 regarding the role of decision accuracy with regard to experienced complexity. Based on former work of Zhang (2016) and Gill and Bramley (2013), decision accuracy is hypothesized to moderate the relation of rank-order distance with experienced complexity. Moreover, inaccurate decisions are supposed to yield higher experienced complexity than accurate decisions. If judges take a decision that is not consistent with the rank-order, experienced complexity is assumed to be high, irrespective of rank-order distance. Meanwhile, for accurate decisions the same negative relationship between rank-order distance and experienced complexity is expected. Again, this negative relationship is assumed to be varying across judges and judges are expected to differ in average experienced complexity for both inaccurate and accurate decisions (gray lines in Figure 4).
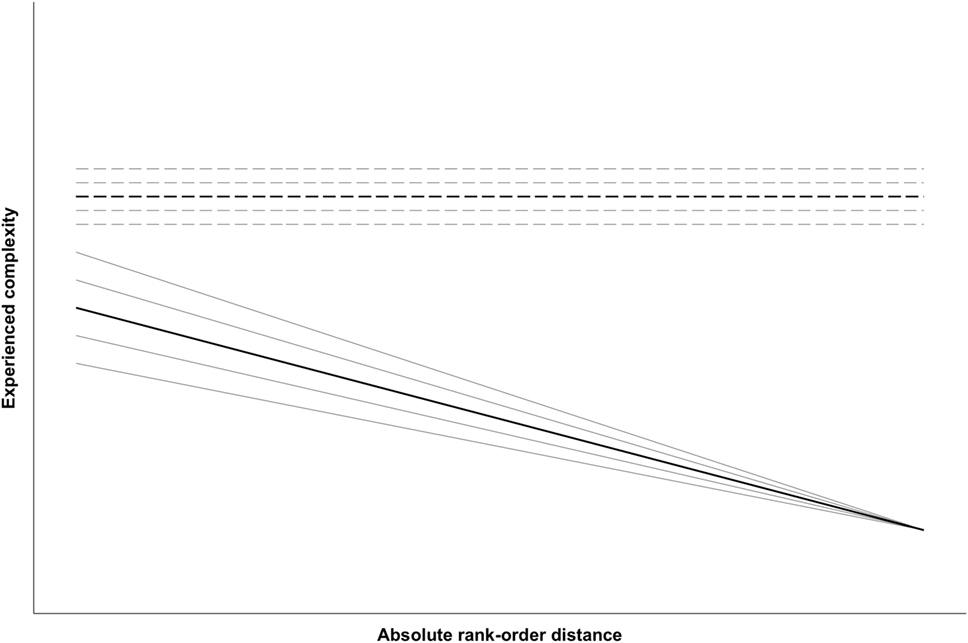
Figure 4. Visualization of hypothesis 2 (with dashed lines representing inaccurate decisions).
Method
The holding of both hypotheses will be tested using an information-theoretic approach. This requires one-on-one translation of each hypothesis into a statistical model, while assuming that models can only be approximations of full reality (Anderson, 2008). Then, model selection is based on relative model fit using Aikaike’s Information Criterion (AIC, Anderson, 2008). This implies gathering evidence for the plausibility of both models. To account for model selection uncertainty due to between-sample-variation (Long, 2012), all analyses will be replicated on three different samples. The first two samples comprise data of CJs on pairs of essays of high school students (sample 1 and sample 2). The third data set includes data on CJs of visual arts products of high school students (sample 3).
Sample 1 and 2
Judges assessed the writing assignments of 136 students following the same study program (Economics and Modern languages) within the general secondary education track in Flanders (Dutch-speaking part of Belgium). The writing assignments were designed to elicit students’ argumentative writing ability. Each assignment asked students to write a short article reflecting their opinion regarding a debatable issue. These topics were “Getting children” (sample 1) and “Organ donation” (sample 2). The assignments were used in previous studies (Van Weijen, 2009; Tillema, 2012) and slightly adapted for use in the present study. Students were given 25 min to respond to each prompt and gave their written consent for inclusion of their essays for research purposes.
The CJ exercise was spread out over various sessions, each lasting for 3 h. Before the start of the judgment exercise, the writing assignments were presented to the judges and a short introduction on CJ was provided. All essays on “Organ donation” (n = 136) were included in the judgment exercise. One essay on “Getting Children” could not be included due to technical reasons resulting in 135 essays to be judged. Judges started with comparing 23 pairs of essays on “Getting children,” followed by at most 20 pairs of essays on “Organ donation.” Due to differences in judgment speed, judges differ in their number of CJs on sample 2 (range = 6–20, μ = 17.76, SD = 3.80). Judges were instructed to choose the essay that better evidenced the competence argumentative writing. The pairs were randomly generated using a digital tool to facilitate CJ (see www.d-pac.be/english/).
The complete data contained 1,229 comparisons for sample 1 and 918 comparisons for sample 2. After removal of comparisons without a decision (sample 1 n = 5, sample 2 n = 14) and of one comparison that accidentally compared an essay to itself (sample 2), rank-orders were generated separately for both samples by applying the Bradley–Terry–Luce model using joint maximum likelihood estimation (Wright and Panchapakesan, 1969; Wright and Douglas, 1996). This was performed in R using a user-defined function (see script “iterativeML.R”, available from the first author). Table 1 provides an overview of the mean, SD, range of the quality estimates (in logits) for each rank-order and the rank-order reliability.
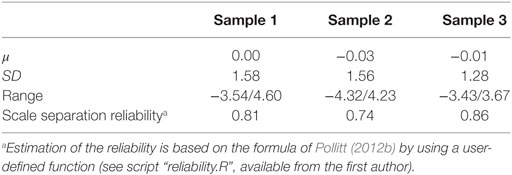
Table 1. Overview of mean, SD, range, and reliability of rank-orders.
As further inspection of the number of comparisons per essay revealed that one essay in sample 2 was accidentally compared twice as much, 10 comparisons on this essay were randomly removed from the data. Finally, only comparisons made by judges who judged at least five pairs within both samples were included in the final samples. The latter was done to minimalize differences in the pool of judges involved between both samples. This resulted in another deletion of 97 comparisons for sample 1 and of 23 comparisons for sample 2. As such, the final datasets for analyses compromised 1,127 comparisons for sample 1 and 870 comparisons for sample 2.
Forty-nine of all judges (n = 64) that participated in the study were included in sample 1 and sample 2. All judges were recruited using the university network or participated as part of a course within teacher education (student teachers). The age of the judges ranged from 23 to 62 years with a mean age of 40.33 (SD = 14.11). Most judges were female (n = 36). Almost 70% of the judges were employed within secondary or higher education or worked for a central examination center (n = 34). About one-quarter followed a teacher education program at college or university (n = 11). The remaining judges were retired or looking for a job (n = 4). Most judges held at least a master degree or higher (n = 45). All judges provided written consent for their participation in this study.
Sample 3
In sample 3, 147 portfolio events of eleven high school students’ (ten females, aged 16/17) visual arts portfolios were assessed using CJ. All these students took part in a visual arts project at one secondary school in the Netherlands. Students were introduced to the theme “TechnoBodies & Sensorium” that focused on the relationship between technology and the senses. Subsequently, students generated portfolios to capture their brainstorm, problem finding, and creative processes. Each portfolio consists of several pages reflecting students’ descriptions of their problem finding processes using images (e.g., collages, sketches) and/or text. 283 portfolio pages were collected and were structured by students, indicating which portfolio pages formed one unit, into 196 portfolio events. As 49 portfolio events only consisted of text, they were not included in the assessment. Only the 147 events of visual nature were used to assess originality of the visual art designs of these portfolio events. (Examples of portfolio events can be found in the Supplementary Material.) The number of visual portfolio events per student ranged from 8 to 21 (μ = 13.36, SD = 4.39). All students and their parents provided written consent for use of these portfolios for research purposes.
The CJ exercise was setup using the D-PAC tool (see www.d-pac.be/english/). As such, judges received the necessary information on the student’s assignment and judgment instructions online. All judges practiced CJ before starting with the actual assessment by making a few “test” comparisons. Then, judges were asked to complete 172 comparisons and pick each time the portfolio event that evidenced higher originality in visual arts. Since the D-PAC tool facilitates online CJ, judges were given 4 weeks to complete their judgments at home. Due to technical issues and one judge’s lack of time, the number of comparisons made by each judge ranged from 138 to 200 (μ = 168.7, SD = 13.57). Again, the pairs were randomly generated.
The complete data contained 2,193 comparisons (sample 3). As inspection of the raw data did not reveal any undecided comparisons or comparisons of visual portfolio events with themselves, the same procedure as for sample 1 and sample 2 was used to generate a rank-order of portfolio events. Table 1 provides an overview of the mean, SD, range of the quality estimates (in logits) for this rank-order and its reliability.
A group of thirteen expert judges was recruited to take part in the judgment exercise. Five of these judges were visual arts teachers from the secondary school students attended with teaching experience ranging from 1 to 21 years. The remaining judges were visual arts history teachers, all university graduates, from one graduate school. They had between 1 and 6 years of experience in teaching visual arts history within secondary education. Most judges were female (n = 9). Judges’ experience with CJ to assess portfolios differed. Seven judges participated in a pilot study to test CJ’s viability regarding portfolio assessment on visual arts. All judges, however, practiced CJ before starting with their allocated comparisons. Finally, all judges provided written consent for their participation in this study.
Measures
Using the logit scores of the essays/portfolio events, the variable rank-order distance was calculated for each comparison by subtracting the quality score of the losing representation from that of the winning representation. Subsequently, the absolute value of the resulting difference was taken to account for negative rank-order distances. Table 2 provides descriptive statistics for rank-order distance within all samples. Rank-order distance was standardized before analyses.
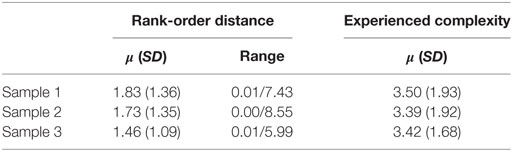
Table 2. Descriptive statistics of rank-order distance and experienced complexity within all samples.
To operationalize experienced complexity, self-report data were gathered using a single ease question: “Overall, how difficult or easy did you find this task?” This question was answered after each comparison made. A seven-point scale, ranging from 1 (very easy) to 7 (very hard), was used. This question stems from usability research. Previous research evidenced its validity and reliability (Sauro and Dumas, 2009). Its brevity makes it suitable for use in the present study as it minimalizes distortion of the intuitive and holistic judgment process characterizing CJ (Pollitt, 2012a,b). Table 2 provides descriptive statistics of experienced complexity for all samples. Experienced complexity was standardized before analyses.
Finally, a dummy variable AccurateD (AccuD) was created that was coded as 1 for accurate decisions (i.e., decisions in line with the final rank-order) and as 0 for inaccurate decisions. Table 3 summarizes the absolute and relative frequencies of AccuD in all samples. In all samples, around a fifth of the decisions were not in line with the final rank-order.
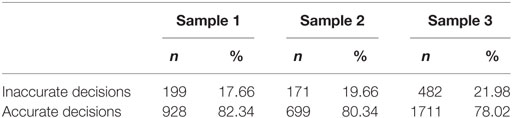
Table 3. Absolute and relative frequencies of AccurateD in all samples.
Data Analyses
In this study, the holding of both hypotheses is tested using an information-theoretic approach. The latter focuses on providing evidence for the plausibility of both hypotheses. This requires statistical modeling of the hypotheses and ranking of these models according to their plausibility to be the best in approximating full reality (Burnham et al., 2011). After describing the statistical modeling of the hypotheses, model selection using AIC-values is explained.
Modeling the Hypotheses
To adequately model both hypotheses, the hierarchical structure of the CJ data is taken into account. As comparisons (or decisions) are nested in representations and judges, cross-classified multilevel analysis is employed to account for the hierarchical structure of the pairwise comparison data (Fielding and Goldstein, 2006). Therefore, random effects for representations and judges are included in all models.
H1 assumes a negative relationship between rank-order distance (RD) and experienced complexity. Decision accuracy is supposed to be unrelated to experienced complexity and consequently not included in the equation. To model the experienced complexity yc(jr) of a comparison c of representation r for judge j the following formula is used:
In Model 1, β0 denotes the complexity as experienced by a random judge comparing two random representations with an average rank-order distance. β1 accounts for the expected relationship between rank-order distance and experienced complexity. As explained above, this model allows experienced complexity to vary between representations (μ0r), judges (μ0j) and comparisons (ε0c(jr)), with the latter being the residual variance that also includes the effect of not modeled interactions (e.g., interaction between representations and judges). Finally, since the relation between rank-order distance and experienced complexity is expected to vary between judges (Campbell, 1988), a random slope for rank-order distance is included. μ1j represents the residual for the slope of rank-order distance for judge j.
In Model 2, the in H2 expected difference in experienced complexity between inaccurate decisions and accurate decisions is modeled by adding the dummy variable AccuD to the fixed part of the model. Since AccuD is coded as 0 for inaccurate decisions, β2 represents the difference in experienced complexity for accurate decisions. Meanwhile, decision accuracy is expected to moderate the relationship between rank-order distance and experienced complexity. This is modeled by including β1 and β2. β1 represents the effect of rank-order distance on experienced complexity for inaccurate decisions, while the interaction between rank-order distance and AccuD (RD * AccuD) (β3) accounts for the effect of rank-order distance on experienced complexity for accurate decisions only. β0 is the expected experienced complexity for a random judge comparing two random representations with an average rank-order distance while taking an inaccurate decision.
All models are fitted in R using lme4 (version 1.1-12; Bates et al., 2015).
Model Selection
Ranking of both fitted models according to their plausibility to be the best approximating model is based on a sample-size corrected version of Aikaike’s Information Criterion (AICc) (Anderson, 2008; Burnham et al., 2011). Using their AICc-values, both models are ranked according to their relative fit. Then, two effect sizes are used to evaluate the plausibility of the competing models and provide scientific evidence for both hypotheses: weight of evidence (w) and evidence ratio (E). Calculation of these effect measures is done using the R-package AICcmodav (version 2.1-0; Mazerolle, 2016; for the statistical formula see Anderson, 2008).
wi is the probability that model i is the best approximating model. It can be calculated by dividing the likelihood of model i by the sum of likelihoods of all candidate models (Anderson, 2008). Using wi it becomes possible to provide evidence for model i given the data and the other candidate models (Anderson, 2008). Furthermore, wi allows inclusion of model selection uncertainty. As the models are evaluated based on a single sample, replication of model selection using another similar sample of the same size might result in another model selected as being the best. This model selection uncertainty can be taken into account by selecting all models that have a cumulative weight of 0.90 or higher (Long, 2012). To calculate the evidence ratio of model i (Ei), wi is divided by the weight of evidence of the best fitting model (wbest) (Anderson, 2008). Ei expresses the likelihood that model i is the best approximating model. As Ebest is always equal to 1, the higher the value for Ei the less plausible model i becomes.
The literature on the information-theoretic approach provides no clear cutoffs regarding wi and Ei. This lack of cutoffs is justified by two reasons (Anderson, 2008). First, model selection using AIC(c) depends on sample size. As sample size increases, information in the sample increases and selection of more complex models becomes more plausible. Second, the effect measures based on the differences in AIC(c) provide scientific evidence for the models. Interpretation of these measures is a value judgment and should not have a dichotomous character (Anderson, 2008). However, Anderson (2008) provides some very general guidelines regarding discarding models for being implausible. In his view, evidence ratio values of up to 7.4 provide reasonable empirical support for retaining the related models. Models with ratios up to 400 are still reasonably plausible. These guidelines will be used cautiously to select to most plausible model(s).
The parameter estimates and 95% confidence intervals of the selected model(s) will be reported. As experienced complexity is theoretically expected to vary between judges (Campbell, 1988), the SD of the intercept differences between judges in experienced complexity and the SD of the differences in slope of rank-order distance across judges will be provided. Furthermore, since AIC(c) only provides evidence regarding relative fit, evaluation of absolute model fit is required (Anderson, 2008). Therefore, R2 of the fixed effects is estimated following the approach of Vonesh and Chinchilli (1997). This measure provides an estimate of the variance in experienced complexity accounted for by the fixed effects only and can be calculated using the following formula:
where yij refers to the observed values of experienced complexity based on the fixed effects, while represent the corresponding expected values.
Results
Model Selection
Both models are ranked according to their plausibility to be the best approximating model given the data and the models based on their AICc values. Table 4 provides an overview of these values and of w and E for all samples.
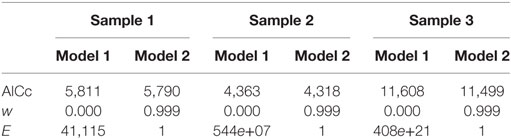
Table 4. AICc, weight of evidence (w), and evidence ratio (E) for all samples.
In all samples, wModel2 indicates that the probability that Model 2 is the best approximating model approaches 1 (wModel2.S1 = 0.999, wModel2.S2 = 0.999, wModel2.S3 = 0.999), conditional on the data and the models tested. Moreover, model selection uncertainty is very low in all samples with EModel1 to be the best approximating model up to 408e+21 in sample 3. This can be interpreted as the likelihood of Model 1 to be the best approximating model being 1 while that of Model 2 is 408e+21. Consequently, the rankings of both models provide convincing evidence for discarding Model 1 as being implausible. Based on these results, only the absolute fit, parameter estimates and 95% confidence intervals of Model 2 will be reported. (The results for Model 1 are provided in the Supplementary Material.)
Examination of the Best Approximating Model(s)
Absolute Fit
Since AICc only ranks models according to their relative fit, the absolute fit of Model 2 is estimated using R2 (Vonesh and Chinchilli, 1997). Absolute fit measures indicate that rank-order distance, decision accuracy and their interaction explain, respectively, 8.9% (sample 1), 9.4% (sample 3), and 15.3% (sample 2) of the variance in experienced complexity. This points at a medium to large effect (Cohen, 1988).
Parameter Estimates and 95% Confidence Interval
Model 2 represents H2. Consequently, in Model 2 it is assumed that decision accuracy moderates the relationship between rank-order distance and experienced complexity. For accurate decisions, rank-order distance is supposed to be negatively related to experienced complexity. Judges are expected to differ in mean experienced complexity and in the strength of the relationship between rank-order distance and experienced complexity. Meanwhile, it is hypothesized that inaccurate decisions are associated with higher experienced complexity than accurate decisions irrespectively of rank-order distance. Again, judges are expected to differ in average experienced complexity. These assumptions are examined using the parameter estimates and 95% confidence intervals of Model 2 (see Table 5).
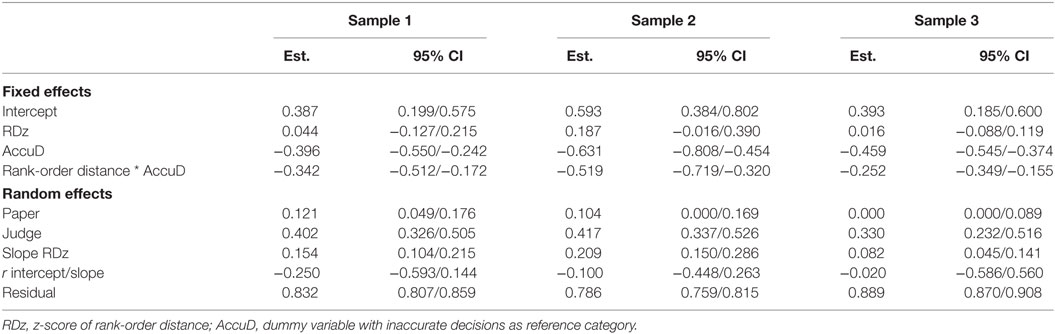
Table 5. Parameter estimates (Est.) and 95% confidence intervals (95% CI) of the fixed and random effects (in SD) on experienced complexity for Model 2.
The results of Model 2 support the assumption stated in H2 that inaccurate decisions are associated with higher experienced complexity than accurate decisions, irrespective of rank-order distance. First, intercept estimates are positive in all samples. Given that experienced complexity and rank-order distance are standardized, positive intercept estimates indicate that judges experience inaccurate decisions of mean rank-order distance as, respectively, 0.387 SD (sample 1), 0.593 SD (sample 2), and 0.393 SD (sample 3) above mean experienced complexity. Furthermore, if judges take an accurate decision (AccuD) regarding the same comparison, they experience this comparison as less complex. The experienced complexity lowers with, respectively, 0.396 SD (sample 1), 0.631 SD (sample 2), and 0.459 SD (sample 3). Hence, an inaccurate decision is experienced as more complex irrespective of the rank-order distance. The latter is also evidenced by the absence of a main effect of rank-order distance (RDz) on experienced complexity. Although the effect of rank-order distance is positive in all samples (βRDz.S1 = 0.044, βRDz.S2 = 0.187, βRDz.S3 = 0.016), the 95% confidence intervals indicate that this effect cannot be generalized to the population of comparisons. Since this effect only accounts for inaccurate decisions, this suggests that rank-order distance is not related to experienced complexity for inaccurate decisions. As expected, the latter finding is different for accurate decisions.
The interaction effect between RDz and AccuD confirms the in H2 expected negative relationship between rank-order distance and experienced complexity for accurate decisions. For accurate decisions, an increase of 1 SD in rank-order distance is accompanied by an average decrease in experienced complexity of, respectively, 0.342 SD (sample 1), 0.519 SD (sample 2), and 0.252 SD (sample 3). If two representations are further apart on the rank-order, judges’ experienced complexity decreases accordingly. However, the random part of the model indicates that judges differ with regard to the effect of rank-order distance on their experienced complexity (SDslope.S1 = 0.154, SDslope.S2 = 0.209, SDslope.S3 = 0.082). Figure 5 visualizes these differences between judges in slope of rank-order distance for accurate decisions (right column of Figure 5). As can be seen, for some judges the negative relation of rank-order distance with experienced complexity is stronger than for other judges. For these judges, an increase of 1 SD in rank-order distance is associated with a larger decrease in experienced complexity. Within sample 3, the differences between judges in the slope of rank-order distance are smaller than in sample 1 and sample 2. This indicates that the effect of rank-order distance on experienced complexity is more similar across judges. Finally, judges also differ in mean experienced complexity for both inaccurate and inaccurate decisions (see Figure 5). In other words, judges differ with regard to the rank-order distance they experience as of average complexity. These differences between judges are found in all samples (SDjudge.S1 = 0.402, SDjudge.S2 = 0.417, SDjudge.S3 = 0.330). Again, variation between judges is smaller in sample 3.
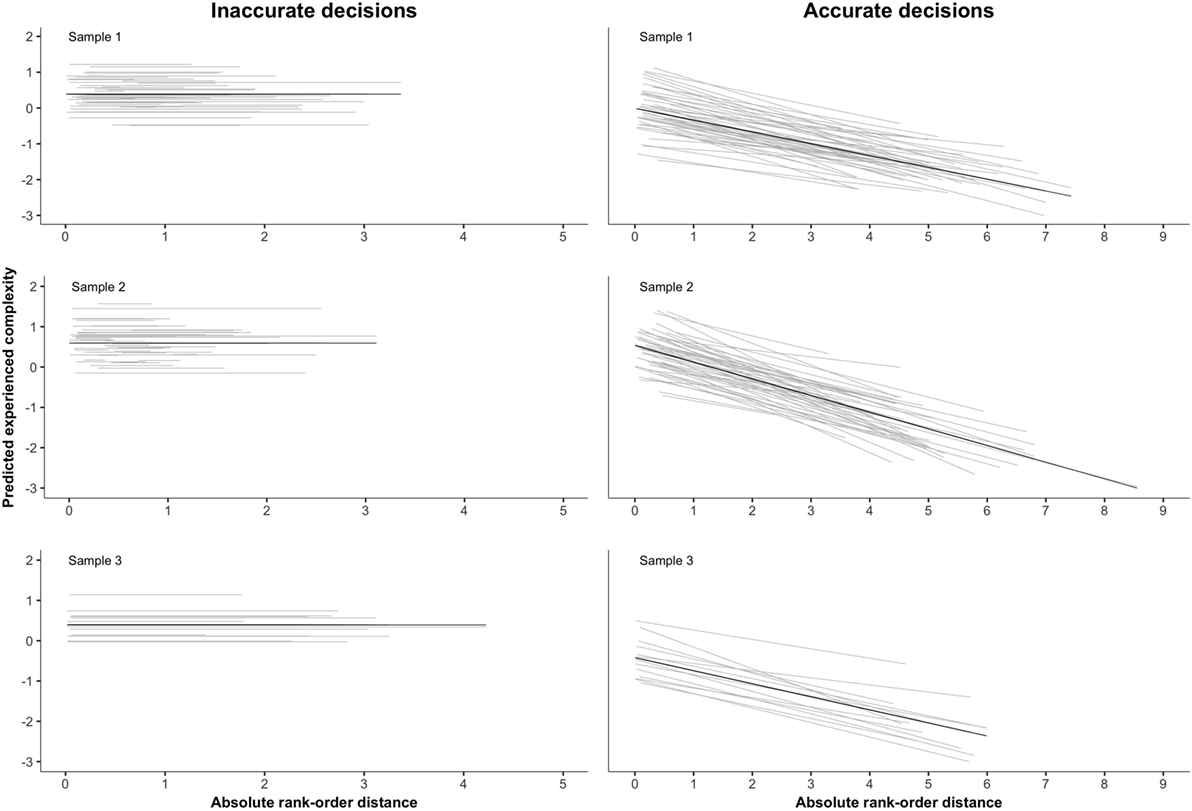
Figure 5. Relation of rank-order distance with experienced complexity (by judge).
Discussion
Nowadays, CJ is used to assess competences such as writing (Pollitt, 2012a, van Daal et al., 2016) and mathematical understanding (Jones et al., 2015). Consequently, judges are asked to compare for example students’ essays or portfolios (representations) and decide which is of higher quality. Student work is, however, heterogeneous and highly information loaded which enhances the complexity of the judgment task (Thurstone, 1927a; Campbell, 1988). This raises the question whether judges are capable of handling this type of complex comparisons. Since a theoretical framework regarding the complexity of CJ is lacking, this study applies Campbell’s (1988) framework on task complexity to CJ and focuses on judges’ experienced complexity by relating it to decision accuracy and the rank-order distance between two representations (objective complexity).
Two theoretical hypotheses concerning these relationships are driving this study. The first hypothesis (H1) assumes that the rank-order distance between two representations is negative related to experienced complexity for both inaccurate and accurate decisions. Meanwhile, judges are expected to vary in average experienced complexity and in the strength of the relation between rank-order distance and experienced complexity. Hypothesis 2 (H2) differs only from H1 in expecting decision accuracy to moderate the relation between rank-order distance and experienced complexity. Inaccurate decisions are assumed to be associated with higher experienced complexity than accurate decisions irrespectively of the rank-order distance. Meanwhile, a negative relation between rank-order distance and experienced complexity is expected for accurate decision. Evidence for the plausibility of both hypotheses is gathered using an information-theoretic approach (Anderson, 2008).
This approach to model selection requires one-on-one translation of both hypotheses into a statistical model. Both hypotheses are modeled using cross-classified multilevel modeling to account for the hierarchical nature of the CJ data (Fielding and Goldstein, 2006). Subsequently, model selection is based on relative model fit using a sample-size corrected version of Akaike’s Information Criterion (AICc, Anderson, 2008). To account for model selection uncertainty (Long, 2012), all analyses are replicated on three samples. Sample 1 and sample 2 consist of CJ data of 49 judges on high school students’ essays on two different topics, while sample 3 contains pairwise comparison data of 13 judges on judgments regarding high school students’ visual arts portfolios events. The relative ranking of the models provides clear evidence for Model 2 (representing H2) to be the best approximating model. In all samples, the likelihood of Model 2 being the best model is at least 41,115 times higher than that of Model 1 (representing H1). This results in discarding Model 1 as being implausible (Anderson, 2008). Since both models only differ regarding the role of decision accuracy, evidence clearly points to the moderating role of decision accuracy in explaining judges’ experienced complexity. In the following paragraphs, the theoretical understanding that can be raised based on these empirical findings is detailed.
This study provides compelling evidence for H2. In this hypothesis, it is assumed that inaccurate decisions are associated with higher experienced complexity than accurate decisions. The results of Model 2 confirm this assumption within all samples. This finding is in line with evidence in the rating literature that found that raters experience inaccurate decisions as more difficult (Zhang, 2016) and also aligns with the results of the study by Gill and Bramley (2013) that related high self-confidence of judges to a higher number of accurate CJs. Furthermore, the relationship between inaccurate decisions and experienced complexity is assumed to be irrespectively of the rank-order distance between both representations. The results of this study confirm this assumption. It is, however, unclear whether the relation of rank-order distance with experienced complexity is absent or positive for inaccurate decisions. The positive relationship between rank-order distance and experienced complexity for inaccurate decisions found within this study could not be generalized beyond the samples investigated. A positive relationship is, however, in line with theoretical expectations given that increasing rank-order distance is associated with lower decision uncertainty. Picking the wrong representation can in the latter case be conceptualized as a true inaccurate decision. This is in turn associated with higher experienced complexity. Future studies should elaborate the nature of the relation between rank-order distance and experienced complexity for inaccurate decisions.
Another explanation for the results regarding inaccurate decisions is offered by the dichotomous operationalization of decision accuracy. A decision is either in line (accurate) with the shared consensus or not (inaccurate). More fine-grained conceptualizations of decision accuracy should be developed that take its relationship with decision uncertainty into account. For instance, psychometric research could investigate what cutoff in decision uncertainty should be used to classify a comparison as a gambling decision or a true inaccurate decision.
Looking at accurate decisions, this study provides evidence for the expected negative relationship between rank-order distance and experienced complexity. As the rank-order distance between two representations rises, judges experience the comparison as less complex in all samples. This negative relationship is in line with the suggestion of Pollitt (2012b), the study by Gill and Bramley (2013) and is also theoretically sound. If the rank-order distance grows, the decision uncertainty of the comparison decreases accordingly. In other words, comparing two representations further apart on the rank-order results in a higher probability for the higher ranked representation to win the comparison. However, the results indicate that the same rise in rank-order distance is associated with a different decrease in experienced complexity across judges. The latter is in line with the expectations formulated in H2 regarding differences in experienced complexity between judges. Theoretically, experienced complexity is assumed to result from the interaction between the objective complexity of the judgment task and each individual judge (Campbell, 1988). As judges differ in task familiarity and information handling capacity, experienced complexity is expected to vary accordingly. The differences in the effect of rank-order distance on experienced complexity between judges are found within all samples.
Another observation resulting from this study is that judges in sample 3 show less variability in experienced complexity. Since judges in sample 3 have a more similar profile than judges in samples 1 and 2, the smaller variability found in sample 3 provides additional evidence that underpins that differences between judges in experienced complexity are the judges’ subjective reaction to the objective complexity of a comparison (Campbell, 1988). Besides, this suggests that judges’ background characteristics should be integrated into the theoretical framework on CJ’s complexity as they offer an explanation for variation in experienced complexity across judges. Up to now, only two studies related judges’ background characteristics (e.g., examination experience, teaching level) to decision accuracy within CJ. The results of these studies are, however, mixed and did not integrate experienced complexity (Whitehouse and Pollitt, 2012; Jones et al., 2015). Besides this difference in profile, all judges in sample 3 practiced CJ before the main data collection and made a lot more comparisons than the judges in samples 1 and 2. As such, a learning effect offers another possible explanation for the smaller differences between judges in the effect of rank-order distance on experienced complexity in sample 3. Future studies should test this hypothesis. This can be accomplished by taking the differences in experienced complexity within judges across time into account or by setting up an experimental study into the effect of training.
Judges are also found to vary regarding their average experienced complexity, confirming the expectations stated in H2. This points to some judges experiencing comparisons of similar rank-order distance systematically as more complex than other judges and vice versa. The latter is irrespectively of the accuracy of the decision. Again, this aligns with the assumption of Campbell’s (1988) theoretical framework on task complexity that states that experienced complexity is judges’ subjective reaction to the objective complexity of the judgment task (i.e., rank-order distance). This finding also seems to suggest that judges differ in the rank-order distance they experience as being able to handle. Further examination of this hypothesis can be done using Receiver Operating Characteristic-analysis (e.g., Fawcett, 2006) that allows testing judges’ discriminating ability around specified rank-order distances and relate it to their experienced complexity. Again, judges’ background characteristics might explain the differences in average experienced complexity between judges. As such, investigating the possible impact of background characteristics is an interesting avenue for future research.
The results of this study clearly underpin the framework on CJ’s complexity as laid out in this study and provides compelling evidence for the plausibility of H2 over H1. However, some limitations should be kept in mind. First, although this study describes the key concepts of the theoretical framework on CJ’s complexity, more theoretical development is urgently needed to further elaborate on these key concepts. For example, looking at the objective complexity of CJ, the architecture of comparisons needs to be taken into account by focusing on characteristics of comparisons, features of the representations composing them and their interaction (for instance length of individual representations and their combined length in a comparison). Elaborating the theoretical framework will also lead to the formulation of new hypotheses to explain judges’ experienced complexity. Second, experienced complexity is operationalized using a self-report measure. As such, it might suffer from common problems with this type of instrument as the presence of ceiling effects. Therefore, in future studies complementary measures for experienced complexity should be used such as psycho-physiological cognitive load measures (e.g., heart rate variability, galvanic skin response) or judges’ reaction times next to self-report data. Finally, since the design of this study does not allow testing the causality of the relations found, studies using experimental designs should be carried out.
Besides these limitations, this study is the first to initiate a theoretical framework on the complexity of CJ by integrating Campbell’s (1988) framework on task complexity into the context of CJ. This study provides first empirical evidence regarding the driving assumptions underlying this framework: it shows that judges’ experienced complexity is the result of their interaction with an objective characteristic of each comparison: its rank-order distance. The latter insight is also valuable from a practical point of view. Differences between judges in discriminating ability should be taken into account in the setup of CJ assessments and in the development of algorithms to distribute pairs of representations. Furthermore, integrating the theoretical advancements suggested in this study, while taking into account to architecture of comparisons, provides an opportunity for further theory development on the complexity of CJ. With regard to the latter, this study also demonstrates that the information-theoretic approach used is fruitful for acceleration of theory development within educational sciences (see Chamberlin, 1890 for an in depth explanation of its link with the method of multiple working hypotheses). Finally, as all analyses were replicated on three samples and results are confirmed within all these samples, the external validity of the relations found is underpinned which further adds to the strength of this study.
Ethics Statement
At the time of this study approval of an ethical committee was not necessary in Belgium. However, all subjects in sample 1 and sample 2 gave their written informed consent. Sample 3 is collected in the Netherlands. At the time of the data collection of this study, approval of an ethical committee was not necessary in the Netherlands. However, all students and their parents in sample 3 provided written informed consent. All judges provided written informed consent.
Author Contributions
TD, SM, VD, and ML attributed to the conception and design of this study. ML, LC, and M-TK contributed to the acquisition of the data. TD analyzed and interpreted the data. SM supported and critically revised the analyses. TD drafted the manuscript. All other authors revised this manuscript critically and made improvements on it. All authors approve the final version of the manuscript to be published and are accountable for all aspects of the work.
Conflict of Interest Statement
The authors declare that the research was conducted in the absence of any commercial or financial relationships that could be construed as a potential conflict of interest.
Funding
This work was supported by the Flanders Innovation & Entrepreneurship and the Research Foundation [grant number 130043].
Supplementary Material
The Supplementary Material for this article can be found online at https://www.frontiersin.org/article/10.3389/feduc.2017.00044/full#supplementary-material.
References
Anderson, D. R. (2008). Model Based Inference in the Life Sciences: A Primer on Evidence. New York: Springer.
Bates, D., Mächler, M., Bolker, B., and Walker, S. (2015). Fitting linear mixed-effects models using lme4. J. Stat. Softw. 67, 1–48. doi: 10.18637/jss.v067.i01
Black, B. (2008). “Using an adapted rank-ordering method to investigate January versus June awarding standards,” in A Paper Presented at the Fourth Biennial EARLI/Northumbria Assessment Conference (Berlin, Germany).
Bradley, R. A., and Terry, M. (1952). Rank analysis of incomplete block designs, I. The method of paired comparisons. Biometrika 39, 324–345. doi:10.2307/2334029
Bramley, T. (2007). “Paired comparisons method,” in Techniques for Monitoring the Comparability of Examination Standards, eds P. Newton, J.-A. Baird, H. Goldstein, H. Patrick, and P. Tymms (London: Qualification and Curriculum Authority), 246–300.
Burnham, K. P., Anderson, D. R., and Huyvaert, K. P. (2011). AIC model selection and multimodel inference in behavioral ecology: some background, observations, and comparisons. Behav. Ecol. Sociobiol. 65, 23–35. doi:10.1007/s00265-010-1029-6
Campbell, D. J. (1988). Task complexity: a review and analysis. Acad. Manage. Rev. 13, 40–52. doi:10.5465/AMR.1988.4306775
Chamberlin, T. C. (1890). The method of multiple working hypotheses. Science 15, 92–96. doi:10.1126/science.148.3671.754
Fawcett, T. (2006). An introduction to ROC analysis. Pattern Recognit. Lett. 27, 861–874. doi:10.1016/j.patrec.2005.10.010
Fielding, A., and Goldstein, H. (2006). Cross-classified and Multiple Membership Structures in Multilevel Models: An Introduction and Review (Report No 791). Birmingham, UK: University of Birmingham.
Gill, T., and Bramley, T. (2013). How accurate are examiners’ holistic judgments of script quality? Assess. Educ. 20, 308–324. doi:10.1080/0969594X.2013.779229
Jones, I., Swan, M., and Pollitt, A. (2015). Assessing mathematical problem solving using comparative judgment. Int. J. Sci. Math. Educ. 13, 151–177. doi:10.1007/s10763-013-9497-6
Long, J. D. (2012). Longitudinal Data Analysis for the Behavioral Sciences Using R. Thousand Oaks, CA: Sage.
Mazerolle, M. J. (2016). AICcmodavg: Model Selection and Multimodel Inference Based on (Q)AIC(c). R Package Version 2.1-0. Available from: https://cran.r-project.org/package=AICcmodavg.
Pollitt, A. (2012a). The method of adaptive comparative judgement. Assess. Educ. 19, 281–300. doi:10.1080/0969594X.2012.665354
Pollitt, A. (2012b). Comparative judgment for assessment. Int. J. Technol. Des. Educ. 22, 157–170. doi:10.1007/s10798-011-9189-x
Sauro, J., and Dumas, J. S. (2009). “Comparison of three one-question, post-task usability questionnaires,” in Paper Presented at the Proceedings of the SIGCHI Conference on Human Factors in Computing Systems (Boston, USA).
Seery, N., Canty, D., and Phelan, P. (2012). The validity and value of peer assessment using adaptive comparative judgment in design driven practical education. Int. J. Technol. Des. Educ. 22, 205–226. doi:10.1007/s10798-011-9194-0
Thurstone, L. L. (1927a). A law of comparative judgment. Psychol. Rev. 34, 273–286. doi:10.1037/h0070288
Thurstone, L. L. (1927c). The method of paired comparisons for social value. J. Abnorm. Soc. Psychol. 21, 384–400. doi:10.1037/h0065439
Tillema, M. (2012). Writing in First and Second Language: Empirical Studies on Text Quality and Writing Processes. Dissertation. Utrecht: University of Utrecht.
van Daal, T., Lesterhuis, M., Coertjens, L., Donche, V., and De Maeyer, S. (2016). Validity of comparative judgement to assess academic writing: examining implications of its holistic character and building on a shared consensus. Assess. Educ. doi:10.1080/0969594X.2016.1253542
Van Weijen, D. (2009). Writing Processes, Text Quality, and Task Effects: Empirical Studies in First and Second Language Writing. Utrecht: Netherlands Graduate School of Linguistics.
Vonesh, E. F., and Chinchilli, V. M. (1997). Linear and Nonlinear Models for the Analysis of Repeated Measurement. New York: Marcel Dekker.
Whitehouse, C. (2012). Testing the Validity of Judgements about Geography Essays Using the Adaptive Comparative Judgement Method. Manchester: AQA Centre for Education Research and Policy.
Whitehouse, C., and Pollitt, A. (2012). Using Adaptive Comparative Judgement to Obtain a Highly Reliable Rank Order in Summative Assessment. Manchester: AQA Centre for Education Research and Policy.
Wright, B. D., and Douglas, G. A. (1996). Estimating Rasch (person, ability, theta) measures with known dichotomous item difficulties: anchored maximum likelihood estimation (AMLE). Rasch Measure. Trans. 10, 499.
Wright, B. D., and Panchapakesan, N. (1969). A procedure for sample-free item analysis. Educ. Psychol. Meas. 29, 23–48. doi:10.1177/001316446902900102
Keywords: comparative judgment, assessment, competence, experienced complexity, objective complexity, decision accuracy
Citation: van Daal T, Lesterhuis M, Coertjens L, van de Kamp M-T, Donche V and De Maeyer S (2017) The Complexity of Assessing Student Work Using Comparative Judgment: The Moderating Role of Decision Accuracy. Front. Educ. 2:44. doi: 10.3389/feduc.2017.00044
Received: 31 March 2017; Accepted: 03 August 2017;
Published: 30 August 2017
Edited by:
Bernard Veldkamp, University of Twente, NetherlandsReviewed by:
Eduardo Cascallar, KU Leuven, BelgiumEva Marie Ingeborg Hartell, Royal Institute of Technology, Sweden
Copyright: © 2017 van Daal, Lesterhuis, Coertjens, van de Kamp, Donche and De Maeyer. This is an open-access article distributed under the terms of the Creative Commons Attribution License (CC BY). The use, distribution or reproduction in other forums is permitted, provided the original author(s) or licensor are credited and that the original publication in this journal is cited, in accordance with accepted academic practice. No use, distribution or reproduction is permitted which does not comply with these terms.
*Correspondence: Tine van Daal, tine.vandaal@uantwerpen.be