Group Differences in Student Performance in the Selection to Higher Education: Tests vs Grades
 Christina Wikström
 Magnus Wikström
- 1Department of Applied Educational Science, Umeå University, Umeå, Sweden
- 2Umeå School of Business and Economics, Umeå University, Umeå, Sweden
Student selection in the Swedish admission to higher education system is based on two fundamentally different performance measures: their criterion-referenced upper secondary grade point average (GPA) and their score on a norm-referenced and multiple-choice admissions test [Swedish admissions test (SweSAT)]. Several student characteristics are known to affect rankings in such assessments. The objectives of this study are to assess main and interactive effects of several variables that influence rankings obtained from these measures in greater detail than previously attempted and assess the findings from a fairness perspective. The data consist of test scores, upper secondary grades, and background information for SweSAT participants aged 19–25 years, who took the test in the autumn of 2011 (N = 23,214) or spring of 2012 (N = 27,075). The data were analyzed through correlation and regression analyses. The results support previous findings that gender, parents’ education, and immigration status are all influential. Males obtain better SweSAT scores than females, while females obtain better GPAs, in accordance with previous findings regarding gender-related variations in rankings provided by similar instruments. Moreover, we found the same pattern in scores for specific components of the test and grades in specific subjects, suggesting that the test and GPA measure different, gender-related, things. In addition, students with an immigrant background seem to be more highly ranked by grades than by the SweSAT, largely due to differences in assessments of their verbal skills.
Introduction
The selection of students for admission to higher education raises many questions about the practical utility of applied criteria and various consequences not only for individuals but also for the higher education institutions and wider society. This is often discussed in terms of fairness, which has various definitions and highly debatable meanings and can be addressed from numerous perspectives. In the context of educational measurement, key elements of fairness are the objectivity and validity of scores provided by the applied instruments (tests or other measures) and consequences of the instruments’ use (Camilli, 2006; American Educational Research Association et al., 2014; Dorans and Cook, 2016). Kane (2010) identifies two general conceptions of fairness; the first is procedural fairness, which is concerned with how we treat test takers, that the same rule, the same test, or equivalent tests are given to everyone. The second is substantive fairness, which is concerned with how well the testing program functions and, in particular, with how it functions for different groups of test takers. When it comes to selection instruments, a common concern is substantive fairness that they may favor some groups of students and disadvantage others. This also has clear implications for social ideology, as discussed, for instance by Wolming (2001): who should be admitted, and if a systematic difference is detected, can it be accepted and how should it be handled?
The admission procedure generally involves two phases. First, threshold criteria are established that students must meet to prove their preparedness and hence eligibility for higher studies. These are generally measures of previous knowledge, such as school grades and indicators of mastery of upper secondary courses. Second, if there are more eligible applicants than available study positions, a selection procedure must be applied, which vary widely. A common approach is to rank the applicants based on their performance in terms of previous school grades, or scores obtained on a test. The choice of method will influence admission decisions, since it is well known that assessment formats, and various other factors associated with tests or grades and influence results (Willingham and Cole, 1997; Zwick, 2002, 2004).
The Swedish admissions’ system differs from most others in using two main instruments, or selection paths, in which grades and test scores are used separately rather in combination. More specifically, to be eligible for higher education, an applicant must have graduated from upper secondary education and there are certain requirements for specific programs. If there is competition for the study places, the universities must select at least a third of the intake on the basis of their upper secondary grade point averages (GPAs) and at least a third from those who have taken the Swedish admissions test (SweSAT). The test is optional, administered twice a year, and can be taken an unlimited number of times. A test score is valid for 5 years, and within this timeframe, the best test score counts. If an applicant decides to take the test, he or she will be placed in two admissions groups, the GPA group and the SweSAT group, and selected from the group where he or she is most highly ranked. So, applicants have nothing to lose from taking the test, and most applicants who aim to take selective study programs do so.
However, the use of two fundamentally different instruments in the selection process is controversial and both instruments have received support and criticism. The upper secondary grades have been especially criticized for lacking reliability as they are based on classroom assessments by teachers with varying assessment methods and interpretations of grading criteria (Wikström, 2005; Gustafsson et al., 2014). Nevertheless, although this problem is well known, the use of tests for examination and admission is also often criticized, mainly due to a lack of validity. Similar controversies have been described by Linn (1990, 2001) in a US context. Moreover, criticism regarding the procedural fairness of using a test in the selection process and giving it equal weighting to the grades (SOU, 2004, 2017) is accompanied by widespread belief in the objectivity, and in this respect fairness, of a centrally scored, standardized instrument.
As fairness is not limited to standardization in terms of using the same, objectively scored, instruments for all candidates, the possibility that instruments may favor particular groups of individuals, notably males or females (the main concern in Swedish contexts, although there may also be less well-explored differences with respect to other groups), has to be considered. It is well known that males obtain higher SweSAT scores than females (Stage, 1992, 2004), which is in accordance with findings regarding similar tests internationally (Beller, 2001; Zwick, 2002). However, there is limited knowledge about reasons for this pattern, if it is a valid performance difference, or caused by construct irrelevant variance.
The objective of this study is to compare the measures of students’ performance provided by the two instruments with fundamentally different formats used in the Swedish higher education admission system: upper secondary grades and the SweSAT. A specific research question addressed is: who benefits from taking the test and who benefits from being graded to gain admission into higher education? The empirical study uses data on participants in the SweSAT in the autumn of 2011 and spring of 2012. To determine if students benefit from one or the other instrument, we compare how they are ranked by the instruments using regression analysis. We focus on differences among groups defined in terms of student background and gender and discuss the findings from a fairness perspective, particularly focusing on the test as its use in admission procedures has been the most controversial.
The rest of the paper is structured as follows. In Section 2, previous research on admissions instruments is briefly reviewed. Section 3 describes the instruments and the data acquired in this study. Methodology is presented in Section 4. The results are presented and discussed in Section 5, and conclusions are presented in Section 6.
Previous Research
Admissions, admissions’ testing, and grades’ roles in admission procedures have been intensively researched, especially in US contexts (see e.g., Linn, 1990; Zwick, 2002, 2004). A substantial body of research has also considered these phenomena in Swedish contexts, especially issues related to the SweSAT. The Swedish research has had a strong focus on predictive validity, and the results show that the grades are better predictors than the test (see Lyrén, 2008; Wolming and Wikström, 2010, for overviews). These findings are consistent with international observations that academic performance is more strongly correlated with school grades than with admissions’ test scores (see, for instance, Linn, 1990; Zwick, 2002; Fischer et al., 2013b). The difference in predictive power between the grades and tests may be due to differences in what the instruments measure. The conjecture that tests and grades partly measure different things is supported in the Swedish research as well. Stage (1992) studied upper secondary graduates who took the test during the year they graduated and reported a correlation coefficient (r) between the upper secondary GPA and the overall SweSAT score of 0.51. Similarly, Lexelius (2004) found relationships with r = 0.52–0.53 between recent graduates’ test scores during the autumn of 1996 or spring of 1997 and their GPAs.
Besides differences in subject content, factors that influence school performance but are difficult to measure with an achievement test, such as discipline and motivation (Spinath et al., 2014), probably have contributory effects. In a Swedish context, one may be worried that selectivity may play a role in affecting predictive validity as the SweSAT is optional and some students with high grades do not need to take the test. There is little empirical information on how selectivity affects predictive validity and self-selection may not constitute a major problem, see Clark et al. (2009).
Research on school grades in Sweden show that there are gender differences, where female students generally perform higher than male students (Klapp Lekholm and Cliffordson, 2007), due to being more proficient in most school subjects, but also due to other factors that are valued by the teachers. Such findings are consistent with research also internationally (Fischer et al., 2013a; Spinath et al., 2014). Gender-related variations in the SweSAT scores have been studied but mainly on item level (Wester, 1995; Stage, 2004). Male students have consistently obtained higher scores than female students, which has been seen as a problem, although, or perhaps especially because, there is an opposite pattern in grades (Wikström, 2005). Such findings are consistent with observations of similar patterns internationally (see, for instance, Wainer and Steinberg, 1992; Beller, 2001; Voyer and Voyer, 2014). In a more detailed analysis of these patterns in Sweden, Reuterberg (1997) analyzed all SweSAT results but found no explanation for male students’ better test performance. If a true gender-related difference in ability is discounted, this suggests that self-selection to the test of higher performing male test takers, or some unknown element of construct irrelevant variance, is involved. Reuterberg (2003) also showed that test takers with a non-Swedish background obtained lower scores than those with a Swedish background, an issue that has not been thoroughly investigated since then.
Differences between genders in test results seem to be consistent over time, as shown in a meta-analysis by Voyer and Voyer (2014), and influence predictions. For example, Fischer et al. (2013b) found that female students’ college performance is under-predicted by SAT scores, while male students’ performance is over-predicted. It is well known that SES also affects academic achievement in general, although Delaney et al. (2011) show that this effect diminishes during higher education, and that SES has stronger effects for male students than for female students. The impact of ethnic background seems more complex, as research shows that non-whites obtain lower SAT scores than white students, but their scores still over-predict their college performance (Zwick, 2002, 2004), indicating that they are disadvantaged by mechanisms in higher education too. Similar differences among socioeconomic and ethnic groups have not yet been investigated thoroughly in a Swedish context.
Further factors that can affect performance in tests, especially high stakes tests, include the format, administration, “test-wiseness”, and test anxiety (which may be strongly inter-related). This seems to be especially relevant for some groups of students. For example, Stenlund et al. (2017) recently found differences among groups in both SweSAT test-taking strategies and test anxiety. Notably, the female test takers reported that they used random guessing more than the males and low scorers (especially females) had higher self-reported test anxiety than high scorers had. Similar patterns have been observed in other contexts, for instance by Williams (1996). In addition, students’ scores usually improve if they repeat the test, putatively due to a learning effect, mainly associated with increases in familiarity with the test format and skill at allocating time (Henriksson and Wolming, 1998; Cliffordson, 2004).
Description of Data
As already described, two selection instruments are used in the Swedish admission to higher education system: the GPA from upper secondary school (GPA) and the SweSAT admissions test. All applicants submit and are ranked by their upper secondary GPAs, and SweSAT rankings will also be considered for candidates who take the test and submit their results. Thus, most test takers will be placed in both selection groups. Since all eligible applicants must have graduated from upper secondary school, the GPA group is considerably larger than the SweSAT group.
The Instruments
In Swedish schools, the students are graded by their teachers, who are supposed to base their grades on performance descriptors linked to the national curriculum and assess the students in the way they find most suitable. There are so-called national tests in some subjects, which have several purposes, but the main aim is to give teachers guidance in making their decisions and to calibrate their grading (Klapp Lekholm and Cliffordson, 2007). These tests are important in the grading process but are not used for ranking students’ performance nationally. Before 2012, when the students included in this study were graded, the grading scale had only four levels: fail (IG), pass (G), pass with distinction (VG), and pass with special distinction (MVG). In 2012, two more grades were added and the scale is now F (fail), E (first pass level), D, C, B, and A (highest). The GPA is the calculated average of all upper secondary school grades (with weighting by the length of the courses). Advanced courses in mathematics and modern languages give extra credit. To calculate GPAs, the letter grades are converted to numbers (IG = 0, G = 10, VG = 15, MVG = 20, or, in the current system, F = 0, E = 10, D = 12.5, C = 15, B = 17.5, A = 20.00). It should also be noted that students in Swedish upper secondary education must take a fairly large number of subjects and courses, so a GPA includes a lot of information on their performance in various subjects.
The SweSAT is a norm-referenced, multiple-choice admissions test, intended to measure quantitative and verbal skills regarded as relevant for success in academic studies. The scores are reported on a normed scale (0.0–2.0), equated over time. The quantitative part of the test (SWESATQ) consists of 80 items divided between four subtests: DS (data sufficiency), DTM (diagrams, tables and maps), XYZ (mathematics), and QC (quantitative comparisons). The verbal part of the test (SWESATV) also consists of 80 items divided between four subtests: READ (Swedish reading comprehension), WORD (Swedish vocabulary), ERC (English reading comprehension), and SC (Swedish sentence completion). There is also a subtest with items for try-out.
The key variables derived from SweSAT results used in this study are the normed SweSAT test score (SWESAT), the normed test score for the quantitative parts of the test (SWESATQ), and the corresponding score for the verbal parts (SWESATV). The test scores are compared with students’ GPAs. In addition, since the SweSAT is supposed to capture basic verbal and quantitative skills corresponding to an achievement level at the first years of upper secondary school, school grades obtained for the first two mathematics courses (MATA and MATB), and English courses (ENGA and ENGB) are compared to scores obtained for the quantitative and verbal parts of the SweSAT, respectively. The considered SweSAT results are from the tests administered in the autumn of 2011 (2011B) and spring of 2012 (2012A).
Selection of Individuals and Background Variables in the Empirical Study
The data used in this study initially included scores and grades for everyone who took the SweSAT in the autumn of 2011 (N = 41,247) and the spring of 2012 (N = 57,634). A total of 16,049 took the test on both occasions so their results can be observed in both of these datasets. Since the test is open for all, some of the test takers are unlikely to apply for university studies, some are too young to apply, and some have already enrolled. The test takers selected for this study were between 19 and 25 years old in 2011, so they were born between 1986 and 1992. The main reason for excluding individuals who were more than 25 years old when the test was taken was that their upper secondary grades are difficult to compare with the younger cohorts’ grades. This is because a new criterion-referenced grading system was introduced in 1994, and strong grade inflation occurred in the following years (Wikström, 2005). By 2005, the grading became more stable as teachers became more familiar with the system, and more support for valid grading was provided. Thus, we chose to exclude individuals born before 1985. Individuals younger than 19 years were excluded since no upper secondary school GPAs were available for them.
Test scores and grades were complemented with the following background variables to enable comparisons of targeted groups of individuals and assess the variables’ effects on their scores: first: gender, operationalized using the dummy variable MALE, with females as the reference group; second: AGE (to probe age-related differences); third: immigrant status, operationalized as FIRSTGEN, SECONDGEN, and FORBORN, categorizing first-generation immigrants (born abroad and both parents born abroad), second-generation immigrants (born in Sweden but both parents born outside Sweden), and those born outside Sweden (but at least one parent born in Sweden), with native Swedes as the reference group; fourth: ACTRACK, categorizing students who took theoretically oriented upper secondary programs, as opposed to those who took vocationally oriented programs (the latter generally obtain lower SweSAT scores and are less likely to proceed into higher education); fifth: KOMVUX, referring to completion of upper secondary education by participation in municipal adult education rather than at school, and HIGHEXP, categorizing students with previous experience of higher (university level) education. In the analysis of the SweSAT 2012A dataset, we also examined effects of test takers’ participations in the previous round in 2011B (D11B).
Finally, we also assessed effects of the test takers’ socioeconomic background, which is often measured by parental education and/or occupation. We used parental education (since it appears to be the most strongly correlated variable with students’ educational performance), operationalized using two dummy variables: MIDEDU and HIGHEDU if the highest educational level of the most highly educated parent was upper secondary and post-upper secondary, respectively (with the reference group consisting of students whose parents had secondary education or less). Definitions of the variables are presented in Table A1 in Supplementary Material. Tables A2 and A3 in Supplementary Material, respectively, present descriptive statistics for participants in the 2011B and 2012A tests. Numbers of individuals selected from these participants for our analyses were 23,214 and 27,075, respectively. Missing information pertains to GPA and subject grades.
Methodology
As already stated, the purpose of this study is to analyze variations in upper secondary school graduates’ performance in terms of the two instruments (the SweSAT test and upper secondary grades), used for selecting candidates for admission to higher education in Sweden. We also examine correlations between grade points and test results.
In order to assess systematic variations in the two instruments’ measures, we examine associations between participants’ characteristics (listed in the preceding section) and differences between their scores and grades (as described for instance, by Wikström and Wikström, 2005). As dependent variables, we form score differences, defined as the difference between students’ GPAs (or separated grade points) and SweSAT score (or scores for the verbal and quantitative parts), following transformation to the same, standard normal scale. If a regression coefficient associated with a particular trait is positive, individuals in the corresponding group benefit more from grading than from use of SweSAT scores, and vice versa if the coefficient is negative.
However, it should be noted that the method used cannot identify the cause of an observed score difference, since there are several possible reasons for a particular difference to arise. First, the SweSAT is intended to measure knowledge of assumed importance for success in higher education, particularly core subject knowledge (reading, writing, arithmetic, etc.), while the GPA is supposed to reflect a student’s knowledge of various subjects and competencies according to broader criteria. Second, some differences may be related to format and practices, as the grades are aggregate indicators of performance in written tests, tasks performed in and outside classrooms, etc., while the SweSAT is a single multiple-choice test. Third, grades are set by the subject teachers and their grading standards may differ, while the test is scored centrally. Fourth, differences may arise through selection of the group of students taking the SweSAT. For example, older students may obtain better SweSAT verbal scores than otherwise similar participants as they have greater experience and vocabulary. Older test takers are also likely to have performed below average in upper secondary school, which may be a reason why they have not already entered higher education. For these reasons, one should not assume that differences are unjust or reflect bias in one or both instruments.
To facilitate interpretations, we also use regression models to assess relationships between the subjects’ considered characteristics and both their SweSAT scores (overall, quantitative, and verbal) and grades. Finally, to minimize risks of misinterpretation, e.g., detecting erroneous relationships or failure to detect a genuine relationship, we also assess the consistency of these associations for both considered SweSAT rounds.
Results
The results are presented in four sub-sections, describing the correlations between GPA and SweSAT scores, determinants of the SweSAT scores and grades, and two sections on determinants of differences between the scores and grades. A major aim of the first two sub-sections is to compare observed patterns with previous findings and facilitate the third and main part of the analysis: evaluation of factors that contribute to differences between the scores and grades. Finally, in the fourth part, we extend the main analysis by introducing interaction effects to study male–female differences.
Correlations between SweSAT Scores and GPA
As shown in Table 1, the correlation coefficients between the upper secondary GPA/course grades and the SweSAT scores were 0.51 and 0.46 (here and elsewhere when two coefficients are quoted they refer to correlations with the 2011B and 2012A scores, respectively), well in line with previous findings (Stage, 1992; Lexelius, 2004).
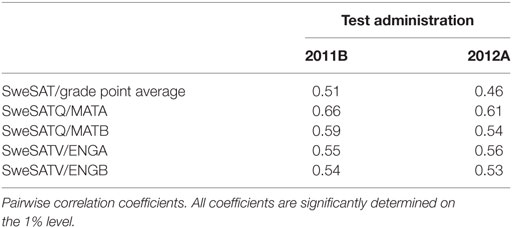
Table 1. Pairwise correlations between Swedish admissions test (SweSAT) scores and grade points.
The strongest correlations between subtest scores and course grades are between scores for the quantitative SweSAT (SweSATQ) parts and grades for the mathematics A-course (the first mathematics course in upper secondary school; r = 0.66 and 0.61, respectively). Correlations between the verbal parts of the test and English A-course grades are somewhat weaker (r = 0.55 and 0.56). Stronger subtest-grade correlations than test-GPA correlations are expected, since SweSAT is designed to capture core subject knowledge, and the GPA is a very broad measure. Similarly, Lexelius (2004) found that correlations were strongest between English B course grades and ERC (English reading comprehension) subtest scores, English B course grades and WORD (Swedish vocabulary) subtest scores, and mathematics A-course grades and DS (data sufficiency) subtest scores (r = 0.65, 0.61, and 0.58, respectively). Although the studies are not entirely comparable, the similarity of results strongly indicates that the patterns have changed little over time.
The correlation coefficients for subgroups defined in terms of gender, immigration status, parental education, and educational experience are presented in Tables A4–A6 in Supplementary Material. They are generally similar, but both parental education and educational track are clearly influential. The correlation coefficients are slightly higher for students with highly educated parents than for students with less well-educated parents and higher for students who took academic school programs than for students who took non-academic programs. These differences are generally more pronounced for the overall GPA/SweSAT relationship than for relationships between the subtest scores and grades, but they are also quite pronounced in the relationship between mathematics A grades and SweSATQ scores.
Determinants of SweSAT Scores and Grade Points
To assess the degrees (if any) that the instruments favor particular groups of students, we first assess variations in SweSAT scores and GPAs, based on ordinary least squares regression. Detailed results are presented in the Supplementary Material. They confirm well-known patterns, as males obtained better SweSAT scores than females, while females obtained better GPAs than male students (Tables A7–A9 in Supplementary Material). Males’ overall SweSAT scores were 1.3 points higher, on average, than females’ scores (equivalent to ca. 0.35 standard deviations of the mean overall score). The SweSAT difference is largest for the quantitative parts of the test: 2 points (0.44 standard deviations), compared to 0.5 points (0.11 standard deviations) for the verbal part. The females’ mean GPA was 1 point (0.38 standard deviations) higher than the males’ mean GPA. However, males obtained better grades in both mathematics (for example, by 0.37 points, ca. 0.1 standard deviations, for the 2011B sample) and English A-courses. However, it should be noted that SweSAT test takers differ from the general student population in at least two respects, as they are more high achieving and a larger proportion have graduated from an academically oriented program. The fact that we observe positive male–female grade differences in this sample is due to the latter fact; a larger proportion of males enter vocationally oriented programs and students graduating from vocational programs have lower GPAs on average.1
The results also show clear negative associations between the SweSAT test takers’ age and both their GPA and course grades. The GPA declined by about 0.3 points per additional year. In contrast, the overall SweSAT score did not depend on age, but older test takers did better on the verbal parts and worse on the quantitative parts than younger ones, in accordance with previous research (Stage, 1992; Lexelius, 2004). Scores for the verbal part increased by ca. 0.28 per year, so 24-year-old test takers’ scores were ca. 1.4 points higher (0.33 standard deviations) than those of otherwise similar 19-year-old test takers.
The results also support previous findings that immigration status strongly affects SweSAT scores (Reuterberg and Hansen, 2001; Reuterberg, 2003). Second-generation immigrants obtained lower scores than test takers with a Swedish origin, and first-generation immigrants obtained lower scores than second-generation immigrants. The differences were largest for the verbal parts; first-generation immigrants’ scores were 2.9 points lower on average than those of similar test takers with a Swedish background. There were also similar patterns in GPAs and course grades (except that there was no significant difference in English A grades between second-generation immigrants and native Swedes). Socioeconomic status, as measured by parental education, was also positively linked to both grades and SweSAT results (particularly for test takers who had at least one parent with post-upper secondary education). Finally, students who took a theoretical upper secondary school program (ACTRACK) and those who had some experience of higher education at the time of the test (HIGHEXP) obtained higher core grades, GPA, and SweSAT scores than those who took vocational programs and had no experience of higher education, respectively.
Score Differences
Having shown that many of the background variables influence SweSAT scores and grades, we turn to our main analysis. First, to assess differences in grade- and SweSAT-based rankings (as used in selection for higher education programs), we examine differences between the students’ GPAs (and A-course grades) and SweSAT scores, both on a standard normal scale. The way that the dependent variable is constructed means that one can interpret the coefficient estimates as standard deviations of either instrument. The results are presented in Tables 2 and 3.
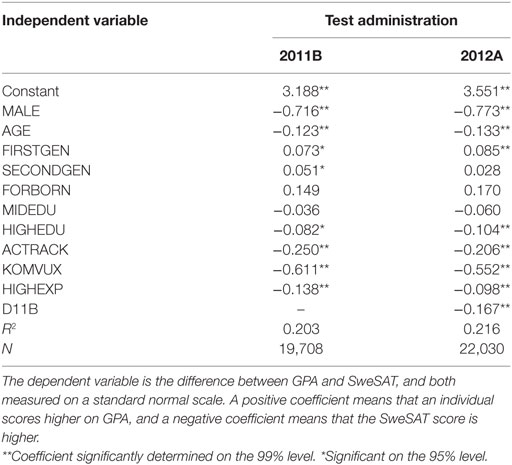
Table 2. Least squares estimates of score differences between grade point average (GPA) and Swedish admissions test (SweSAT).
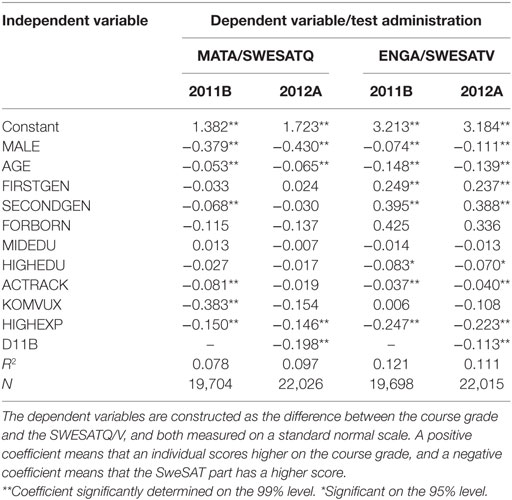
Table 3. Least squares estimates of score differences between grades and Swedish admissions test (SweSAT) quantitative and verbal parts.
As Table 2 shows, the differences in rankings are influenced by most of the considered characteristics, and the estimates show that the differences between grades and both 2011B and 2012A SweSAT scores were generally consistent. The independent variables that most strongly affected the differences in rankings were gender and age. Males were generally favored more by the SweSAT than GPAs: on average, male students’ scores were 0.7–0.8 standard deviations higher in the overall distribution of SweSAT scores. Older test takers were also ranked more highly by SweSAT scores, but this was entirely because they had lower GPAs than younger test takers.
The variables associated with educational experience also affected the relative rankings. Individuals who graduated from academic track programs (ACTRACK) were more highly ranked by the SweSAT than GPAs, while GPAs favored students from the vocational track. This can be partly explained by academic track students being better prepared for tests like SweSAT. However, as already mentioned, more lenient grading in non-academic track programs may also contribute to the pattern. Students with experience of higher education (HIGHEXP) and those who finished their upper secondary education through the municipal adult education program (KOMVUX) were also more highly ranked by SweSAT than GPAs. Socioeconomic status also influenced the GPA-SweSAT difference: individuals from a high education environment (HIGHEDU) were favored more by the SweSAT than GPAs. The difference in rankings was small but indicates that the SweSAT may contribute to social recruitment bias. We also noted a significant, but small difference, for first-generation immigrants (FIRSTGEN), who were favored more by GPA rankings than SweSAT rankings (relative to native Swedes). For second-generation immigrants, as for individuals born outside Sweden with a Swedish parent, there was no such difference in rankings relative to native Swedes.
Results from the comparison of core grades and scores for SweSAT subtests support the hypothesis that they should correlate more closely than overall GPAs and SweSAT scores (as shown by the smaller coefficient estimates and coefficients of determination, R2 values; cf. Tables 2 and 3). Notably, the coefficients of determination (indicating predictive power of the model) and many of the estimated coefficients are larger for the verbal rankings (ENGA/SWESATV) than for the quantitative rankings (MATA/SWESATQ). Exceptions to this pattern are the male–female differences, which are relatively large in the quantitative rankings and small (but still significant) in the verbal rankings. In the comparison of quantitative rankings, it should be noted that many of the coefficient estimates for variables influencing the relationships between MATA and the two sets of quantitative SweSAT scores are not consistent. In fact, only three explanatory variables have coefficients that are consistent (statistically significant, of the same sign, and of similar magnitude) for both quantitative SweSAT datasets: MALE, AGE, and HIGHEXP. In contrast, coefficient estimates for the relationship between ENGA and scores for verbal elements of the two SweSAT sets have similar magnitude.
Male–Female Score Differences
There seem to be important differences between genders in both grades and SweSAT scores, which can be more clearly elucidated by adding interactions between the variables considered in the previous sub-section and the dummy variable MALE to the regression models. In Tables 4 and 5, the estimates of the interaction effects are presented. Full results can be obtained from the authors upon request.
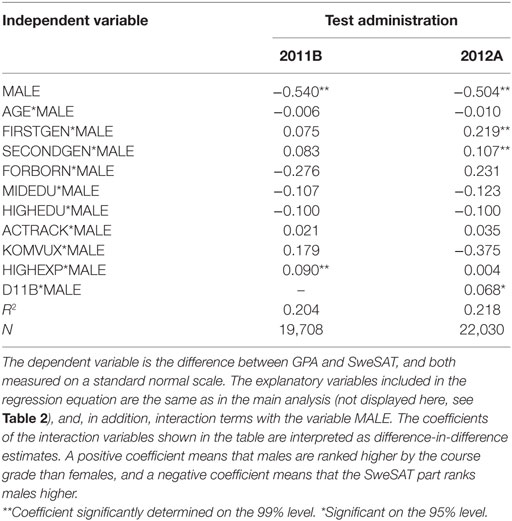
Table 4. Least squares estimates of gender differences in ranking of grade point average (GPA) vs Swedish admissions test (SweSAT).
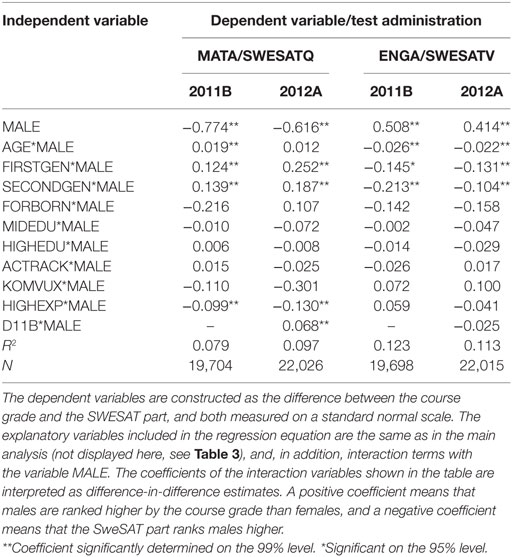
Table 5. Least squares estimates of gender differences in ranking of course grades vs Swedish admissions test (SweSAT) quantitative and verbal parts.
As shown in Table 4, the interaction effects on differences in GPA-SweSAT rankings seemed to be minor. Male–female differences did not vary with age or social background, although male first- and second-generation immigrants among the 2012 SweSAT test takers were favored less strongly by the SweSAT, relative to GPA. Moreover, the GPA appeared to be influenced by the male-immigrant status interaction but not the SweSAT scores, indicating that these additional male–female differences are entirely due to differences in grading (data not shown, but available from the authors on request). There are also indications in the 2011B of a positive interaction effect within the group with higher education experience, but this effect was close to zero in the 2012A sample. In conclusion, gender does not strongly influence differences between overall GPAs and SweSAT scores associated with any of the other considered characteristics.
However, there is evidence of stronger interactive effects in the differences between course grades and SweSAT subtest scores (Table 5). First, when comparing the quantitative measures (MATA and SweSATQ), the male–female difference is larger among natives than on average (cf. coefficients in Tables 3 and 5). However, the immigrant interaction effects are positive, indicating that male (female) immigrants are either graded more leniently (less leniently) or obtain lower scores (higher scores) for quantitative parts of the SweSAT than females when compared to the native male–female difference. Separate analysis of grades and scores indicates that this pattern is mainly driven by differences in grading (although low scores obtained by first-generation immigrant males in the 2012A SweSAT round also contributed). There is also some indication that age is positively linked to these differences between MATA and SweSATQ scores (but these indications are not consistent in the two datasets).
While grading appears to favor immigrant males in assessments of quantitative skills, they appear to be favored more by SweSAT for the assessment of verbal skills. The estimated differences are mainly due to differences in grading, meaning that females within this group are more leniently graded. There is also an apparent negative age effect, indicating that older male students are particularly strongly favored by SweSATV (relative to ENGA). However, the male–female difference among natives in this respect is close to zero, and the estimated difference shown in Table 3 is therefore mainly due to differences in the immigrant groups.2 To sum up, male–female differences in the GPA- and SweSAT-based assessment of verbal skills can be largely attributed to differences in the immigrant group, but the differences in quantitative skills remain unexplained to a large extent.
Conclusion and Discussion
The main results of our comparison of the rankings of candidates for admission to higher education in Sweden by GPAs and SweSAT are consistent with previous findings, especially similar evaluations of previous forms of tests and grades. However, they provide more nuanced indications of patterns associated with students’ characteristics. The main conclusions, drawn from general patterns detected in comparisons of grades and scores recorded in both considered SweSAT rounds, are as follows.
• The correlation coefficient between the SweSAT scores and GPAs was ca. 0.5, similar to previous findings (Stage, 1992; Lexelius, 2004). Correlations between course grades and corresponding parts of the SweSAT were stronger. There were no large differences in the correlation coefficients between different subgroups, meaning that there is no group studied where the correlation between the instruments is especially weak.
• The trait that most strongly influences differences between grades and SweSAT scores is gender. Males had lower GPAs but obtained higher SweSAT scores than females. This is also the case for the SweSAT subtest and specific course grade comparisons. Thus, SweSAT scores favor males and GPA favor females. Generally, gender has minor interaction effects with the other considered characteristics. However, females with immigrant background appear to benefit from being graded in assessments of verbal skills (i.e., through use of English A-course grades rather than verbal SweSAT parts), relative to male counterparts, while the opposite is true for assessments of quantitative skills.
• Test takers with an immigrant background are more highly ranked by grades than by the SweSAT (relative to native Swedes), largely due to differences in assessments of their verbal skills (there is less variation in the differences in grade- and SweSAT-based rankings for quantitative elements between native Swedes and others).
• The influence of socioeconomic status (measured by parental education) appears to have minor influence on differences between GPAs and SweSAT scores, but individuals with high education backgrounds are slightly favored by the test.
• Academic track students are ranked more highly by the SweSAT than by GPAs and by the verbal part of the SweSAT than by English A-course grades, but there is no such difference in the quantitative assessments (indicating that grades for some other courses or educational elements favor non-academic track students).
• Selection into the pool of SweSAT test takers may play an important role in the differences in rankings. Notably, older than average students tend to have lower grades but obtain higher SweSAT scores than younger students.
These findings, and their similarities to previous findings, could be interpreted as confirmation of a general pattern: that regardless of adjustments some groups of students will be favored by grades, some by tests and some will be ranked equally well (or poorly) by grading and tests. However, the model is complex and several aspects warrant further discussion (and further investigation in future studies).
The main purpose of the SweSAT is to provide a second chance for admission to higher education. Students who have the required knowledge but, for some reason have too low GPAs, can take this alternative route to attractive university programs. The intention is to ensure fairness by giving everyone an opportunity for a second chance, although the main initial reason for introducing the test was to broaden recruitment to higher education. For obvious reasons, investigation of the extent that SweSAT serves these purposes is far beyond the scope of this study. However, one requirement for the SweSAT to provide a meaningful second chance is that potential entrants into higher education who did not perform well in upper secondary school for some reason have the opportunity and knowledge required to gain access to higher education. This means that at least some individuals must “climb the ladder” to be among those selected. Is this likely to happen?
The test is not exclusively open to underrepresented groups or students with low grades. Originally, there was such an intention and the test was open only to older students who lacked a GPA from upper secondary school. The eligibility requirements were not highlighted so strongly then, and the test was expected to provide similar information to a GPA. Nowadays, anyone can take the SweSAT, as it was found problematic from a procedural fairness perspective to offer this path only to some of the applicants, and anyone who meets the eligibility requirements and obtains a sufficiently high score may gain access to higher education through this quota group. This also means that a student who can compete with his or her GPA can take the test and compete in two quota groups. Hence, high-performing students are most likely to take the test, as they often aim for highly ranked university programs, and may see the test as a way to maximize their chances of success. This raises important questions about whether students are differentially ranked in the two admission groups, so historically weak students are prevented (despite improvement) from gaining access to higher education. This study shows that there is a positive correlation between the grades and SweSAT scores, but it is far from perfect. A less than perfect correlation is desirable in the sense that students’ rankings would otherwise be preserved and the second chance would have no practical meaning. However, the deviation from perfection in the correlation does not provide knowledge of the de facto opportunities for those with a low GPA.
To illuminate the possibility to improve one’s position in SweSAT rankings (relative to the GPA), we can roughly estimate the number of students with weak GPAs who will be in the pool of applicants admitted through the SweSAT route using the data at hand. Suppose that half of the test takers will gain access to higher education but not the other half. According to the general rules, a university must admit at least a third of its students according to SweSAT rankings. Thus, ca. 15% of the test takers will be admitted from the SweSAT group, assuming that all test takers apply to similarly selective programs on average. The number of students in the bottom half of the grade distribution who score sufficiently well to obtain a SweSAT score in the top 15% will set the lower boundary for the number of “weak” applicants who will get access to higher education. The 2011B and 2012A SweSAT datasets indicate that about 500 and 600 students out of the 9,500 and 11,000 students in the bottom halves of the GPA distributions, respectively, scored highly enough to be among the top 15%. This corresponds to about 5.3–5.5% of the students in the bottom half. Of course, there are several complications that increase uncertainties, such as repeated test taking and variations in application rates among programs and universities. Nevertheless, the example shows that some students do improve their position more than marginally when taking the SweSAT.
Analysis of the characteristics of students who improved their position in this manner is also informative. First, 84 and 87% of those in the 2011B and 2012A sets, respectively, were male. This is consistent with expectations, as males obtain higher SweSAT scores than females but have lower GPAs on average. Among those with sufficiently high GPAs for acceptance into higher education without taking the SweSAT, the proportion of men is about 43%. Thus, the SweSAT helps to even out male–female representation in the group of admitted students. Second, both first- and second-generation immigrants are slightly underrepresented in the group who improve their position enough for admission to higher education (7.8 and 6.9% in the 2011B and 2012A sets were first- or second-generation immigrants, in comparison to 9.1 and 8.6%, respectively, in the high GPA group). This is also consistent with expectations as immigrants benefit more from grading than from SweSAT scores. Finally, students who improved sufficiently were about a year older on average than those in the top half of the GPA distribution.
Clearly, therefore, there are some between-group differences in rankings by the two selection instruments. However, there is some uncertainty about the scale of these differences since high performers (male students, students with high socioeconomic status, and students with a Swedish origin) are most likely to take the SweSAT. Such differences in group performance, as well as the selection to the test, are important issues to consider from a substantive fairness perspective, when designing and/or revising the admissions system.
A substantial proportion of students (of the order of 5% of test takers, according to very rough calculations) change their rankings sufficiently to access higher education through taking the test and thus have exploited this opportunity for a second chance. Some of these would otherwise have very limited possibility for admission to any selective university education. Another interesting aspect is that the second chance reduces the gender differences in higher education intakes, since it is mostly beneficial for male applicants. However, whether this second chance should be reserved for students who have underperformed in terms of grades or should also provide opportunities for students with high grades to further improve their prospects warrants consideration from both policy perspectives and fairness perspectives; that is, should it be orientated toward a meritocratic rewarding of skills, help applicants find a path that works for them, or both? Moreover, if one instrument is seen as being more valid in terms of what it is measuring, will additional instruments with different characteristics mainly give certain underrepresented groups advantages, thereby making higher education intakes more representative of the general population, and if so how would this affect the broader validity of the admissions system? Clearly, there is a need for further research on selection effects and post-admission performance of students who have used the second chance.
Ethics Statement
The research project was not in need of ethical review according to the Swedish ethics review act, since the study is based on anonymized register data and does not include sensitive information.
Author Contributions
Both CW and MW have done an equal share of the work. MW has done more of the analytic work. CW has written the larger part of the text.
Conflict of Interest Statement
The authors declare that the research was conducted in the absence of any commercial or financial relationships that could be construed as a potential conflict of interest.
The reviewers, NG and TK-C, and handling editor declared their shared affiliation, and the handling editor states that the process nevertheless met the standards of a fair, independent and objective review.
Funding
The authors are grateful to the Swedish Research Council for financial funding (2014-01990) and to the National Council for Higher Education for providing data.
Supplementary Material
The Supplementary Material for this article can be found online at https://www.frontiersin.org/article/10.3389/feduc.2017.00045/full#supplementary-material.
Footnotes
- ^Information on grades, both aggregated and for specific programmes are available from the National Board of Education’s website; see http://www.jmftal.artisan.se/.
- ^Assuming that statistically insignificant coefficients are 0, the average male–female difference for a 20-year-old native is 0.508–0.026 × 20 = −0.012 using the point estimates in column 3 (2011B) of Table 5.
References
American Educational Research Association, American Psychological Association, National Council on Measurement in Education, Joint Committee on Standards for Educational and Psychological Testing. (2014). Standards for Educational and Psychological Testing. Washington, DC: AERA.
Beller, M. (2001). Admission to higher education in Israel and the role of the psychometric entrance test: educational and political dilemmas. Assess. Educ. Princ. Policy and Pract. 8, 315–337. doi: 10.1080/09695940120089125
Camilli, G. (2006). “Test fairness,” in Educational Measurement, 4th Edn, ed. R. Brennan (Westport, CT: American Council on Education and Praeger), 221–256.
Clark, M., Rothstein, J., and Whitmore Schanzenbach, D. (2009). Selection bias in college admissions test scores. Econ. Educ. Rev. 28, 295–307. doi:10.1016/j.econedurev.2008.08.001
Cliffordson, C. (2004). Effects of practice and intellectual growth on performance on the Swedish scholastic aptitude test (SweSAT). Eur. J. Psychol. Assess. 20, 192–204. doi:10.1027/1015-5759.20.3.192
Delaney, L., Harmon, C., and Redmond, C. (2011). Parental education, grade attainment and earnings expectations among university students. Econ. Educ. Rev. 30, 1136–1152. doi:10.1016/j.econedurev.2011.04.004
Dorans, N., and Cook, L. (eds). (2016). Fairness in Educational Assessment and Measurement. New York: Routledge.
Fischer, F., Schult, J., and Hell, B. (2013a). Sex differences in secondary school success: why female students perform better. Eur. J. Psychol. Educ. 28, 529–543. doi:10.1007/s10212-012-0127-4
Fischer, F., Schult, J., and Hell, B. (2013b). Sex-specific differential prediction of college admission tests: a meta-analysis. J. Educ. Psychol. 105, 478–488. doi:10.1037/a0031956
Gustafsson, J.-E., Cliffordson, C., and Erickson, G. (2014). Likvärdig kunskapsbedömning i och av den svenska skolan – problem och möjligheter [Equivalent Assessment in and of the Swedish School – Problems and Possibilities]. Stockholm: SNS Förlag.
Henriksson, W., and Wolming, S. (1998). Academic performance in four study programmes: a comparison of students admitted on the basis of GPA and SweSAT scores, with and without credits for work experience. Scand. J. Educ. Res. 42, 135–150. doi:10.1080/0031383980420203
Klapp Lekholm, A., and Cliffordson, C. (2007). Discrepancies between school grades and test scores at individual and school level: effects of gender and family background. Educ. Res. Eval. 14, 181–199. doi:10.1080/13803610801956663
Lexelius, A. (2004). Högskoleprovet och de målrelaterade betygen [SweSAT and the Goal Referenced Grades.]. (BVM No.8). Umeå: Umeå University, Department of Educational Measurement.
Linn, R. L. (1990). Admissions testing: recommended uses, validity, differential prediction, and coaching. Appl. Meas. Educ. 3, 297–318. doi:10.1207/s15324818ame0304_1
Linn, R. L. (2001). A century of standardized testing: controversies and pendulum swings. Educ. Assess. 7, 27–38. doi:10.1207/S15326977EA0701_4
Lyrén, P.-E. (2008). Prediction of academic performance by means of the Swedish scholastic assessment test. Scand. J. Educ. Res. 52, 565–581. doi:10.1080/00313830802497158
Reuterberg, S.-E. (1997). Gender Differences on the Swedish Scholastic Aptitude Test. (Report 1997:2). Gothenburg: Gothenburg University, Department of Education and Education Research.
Reuterberg, S.-E. (2003). Vilken betydelse har utländsk bakgrund för resultatet på Högskoleprovet: Del II [What Meaning Has National Background on the SweSAT Scores: Part II] (2003:23R). Stockholm: National Agency for Higher Education.
Reuterberg, S.-E., and Hansen, M. (2001). Vilken betydelse har utländsk bakgrund för resultatet på Högskoleprovet: Del I [What Meaning Has National Background on the SweSAT Scores: Part I] (2001: 3 R). Stockholm: National Agency for Higher Education.
SOU. (2004). Tre vägar till den öppna högskolan. Betänkande av Tillträdesutredningen. [Three Routes to Higher Education]. Stockholm: Ministry of Education, 29.
SOU. (2017). Tillträde för nybörjare. Ett öppnare och enklare system för tillträde till högskoleutbildning: betänkande från Tillträdesutredningen. [Access for New Beginners. An Easier and More Open System for Access to Higher Education]. Stockholm: Ministry of Education, 20.
Spinath, B., Eckert, C., and Steinmayr, R. (2014). Gender differences in school success: what are the roles of students’ intelligence, personality and motivation? Educ. Res. 56, 230–243. doi:10.1080/00131881.2014.898917
Stage, C. (1992). Skillnader mellan betyg och högskoleprovsresultat 1991 [Differences between Grades and SweSAT Scores 1991]. (PM No. 62). Umeå: Umeå University, Department of Educational Measurement.
Stage, C. (2004). Gruppskillnader i resultat på Högskoleprovet [Group Differences in the SweSAT Scores] (PM No. 192). Umeå: Umeå University, Department of Educational Measurement.
Stenlund, T., Eklöf, H., and Lyrén, P.-E. (2017). Group differences in test-taking behaviour: an example from a high-stakes testing program. Assess. Educ. Princ. Policy, and Pract. 24, 4–20. doi:10.1080/0969594X.2016.1142935
Voyer, D., and Voyer, S. D. (2014). Gender differences in scholastic achievement: a meta-analysis. Psychol. Bull. 140, 1174–1204. doi:10.1037/a0036620
Wainer, H., and Steinberg, L. (1992). Sex differences in performance on the mathematics section of the scholastic aptitude test: a bidirectional validity study. Harv. Educ. Rev. 62, 323–337. doi:10.17763/haer.62.3.1p1555011301r133
Wester, A. (1995). The importance of the item format with respect to gender differences in test performance: a study of open-format items in the DTM test. Scand. J. Educ. Res. 39, 335–346. doi:10.1080/0031383950390405
Wikström, C. (2005). Grade stability in a criterion referenced grading system: the Swedish example. Assess. Educ. Princ. Policy Pract. 12, 125–144. doi:10.1080/09695940500143811
Wikström, C., and Wikström, M. (2005). Grade inflation and school competition: an empirical analysis based on the Swedish upper secondary schools. Econ. Educ. Rev. 24, 309–322. doi:10.1016/j.econedurev.2004.04.010
Williams, J. E. (1996). Gender-related worry and emotionality test anxiety for high-achieving students. Psychol. Sch. 33, 159–162. doi:10.1002/(SICI)1520-6807(199604)33:2<159::AID-PITS9>3.0.CO;2-M
Willingham, W., and Cole, N. (1997). Gender and Fair Assessment. Mahwah, NJ: Lawrence Erlbaum Associated.
Wolming, S. (2001). Validering av urval [Validation of Selection]. Ph.D. thesis, Department of Education, Umeå University, Umeå.
Wolming, S., and Wikström, C. (2010). The concept of validity in theory and practice. Assess. Educ. Princ. Policy Pract. 17, 117–132. doi:10.1080/09695941003693856
Zwick, R. (2002). Fair Game? The Use of Standardised Admissions Tests in Higher Education. New York: RoutledgeFarmer.
Keywords: admission, selection by competition, grade point average, Swedish admissions test, fairness, group differences, higher education
Citation: Wikström C and Wikström M (2017) Group Differences in Student Performance in the Selection to Higher Education: Tests vs Grades. Front. Educ. 2:45. doi: 10.3389/feduc.2017.00045
Received: 29 April 2017; Accepted: 09 August 2017;
Published: 25 August 2017
Edited by:
Yoav Cohen, National Institute for Testing and Evaluation (NITE), IsraelReviewed by:
Eduardo Cascallar, KU Leuven, BelgiumTamar Kennet-Cohen, National Institute for Testing and Evaluation (NITE), Israel
Naomi Gafni, National Institute for Testing and Evaluation (NITE), Israel
Copyright: © 2017 Wikström and Wikström. This is an open-access article distributed under the terms of the Creative Commons Attribution License (CC BY). The use, distribution or reproduction in other forums is permitted, provided the original author(s) or licensor are credited and that the original publication in this journal is cited, in accordance with accepted academic practice. No use, distribution or reproduction is permitted which does not comply with these terms.
*Correspondence: Christina Wikström, christina.wikstrom@umu.se