Developing a Short Form of the Self-Assessment Practices Scale: Psychometric Evidence
 Zi Yan
- Department of Curriculum and Instruction, The Education University of Hong Kong, Tai Po, Hong Kong
This research aimed to develop a short form of the Self-assessment Practices Scale (SaPS). Guided by a process model of self-assessment, the SaPS scale was designed to assess the actions students engage in during the self-assessment process. The data used for developing the original 20-item SaPS (SaPS-20), i.e., 1,416 Hong Kong students ranging from Primary 4 to Secondary 3, were reanalyzed, and a 12-item short form (SaPS-SF) was developed. Factor analysis and Rasch analysis were applied in complementary ways to examine the psychometric properties of the SaPS-SF. The results showed that factor structure of the original scale held in the SaPS-SF, and all items fitted the Rasch model requirements sufficiently and measured the constructs as theorized. The findings presented in this study facilitate the measurement of self-assessment practice in a parsimonious and effective way.
Introduction
Self-assessment is a fundamental skill required at each phase of self-regulated learning (Yan, 2019) and is crucial for life-long learning (Boud, 1995; Tan, 2012). Through self-assessing their own performances, students can identify their strengths and weaknesses, and adjust their learning strategies accordingly to learn more (Boud, 1995; Yan and Brown, 2017). Recent review studies (e.g., Brown and Harris, 2013; Panadero et al., 2017) revealed a general consensus in the literature with regard to the positive impact of self-assessment on academic achievement, self-regulation, and motivational aspects of learning (e.g., self-efficacy), although the effect sizes varied across studies.
Despite the important role of self-assessment in education, the understanding of the exact nature of “standard self-assessment” varies in literature (Panadero et al., 2016). In many educational studies, self-assessment is often simplified as a mere self-rating/grading with little cognitive reflection involved. However, self-assessment appears to be a far more complex activity in real learning contexts. Panadero et al. (2016) argued that “student self-assessment most generally involves a wide variety of mechanisms and techniques through which students describe (i.e., assess) and possibly assign merit or worth to (i.e., evaluate) the qualities of their own learning processes and products.” Yan (2016, 2018) summarized conceptualizations of self-assessment into three categories: (1) self-assessment is treated as a personal ability/trait that enables an accurate evaluation of one's own performance; (2) self-assessment is used as a supplementary assessment method; and (3) self-assessment is regarded as a learning strategy or process aiming for enhancing learning effectiveness.
From a pedagogical perspective, it makes more sense to conceptualize self-assessment as a learning strategy in enacting its merits in supporting student learning due to the long-lasting concerns about the accuracy of self-assessment for summative purposes (Brown et al., 2015; Yan and Brown, 2017). Yan and Brown (2017) conceptualized self-assessment as “a process during which students collect information about their own performance, evaluate and reflect on the quality of their learning process model and outcomes according to selected criteria, to identify their own strengths and weaknesses.” (p. 2). Accordingly, they proposed a “cyclical self-assessment process” that covers three sequenced actions including determining the performance criteria, self-directed feedback seeking, and self-reflection (see Figure 1). The first step of student self-assessment is to determine the assessment criteria that is to be applied in the following actions. The second step is to seek feedback with regard to the quality of their own performance from external and/or internal sources. External feedback comes from either explicit learning processes (e.g., reviewing past test papers or doing extra exercises), or inquiry with people (e.g., teachers, peers). Internal feedback comes from internally generated reactions (e.g., internal states, physical sensation, and emotions) to their own performance. However, neither external nor internal feedback itself necessarily leads to a meaningful self-assessment judgment without the third step, i.e., reflection. In the third step, the task is to reflect the quality of the process and product of learning with the support of feedback and arrive at an initial self-assessment judgement. This judgement could be continuously calibrated based on different assessment criteria or new sources of feedback.
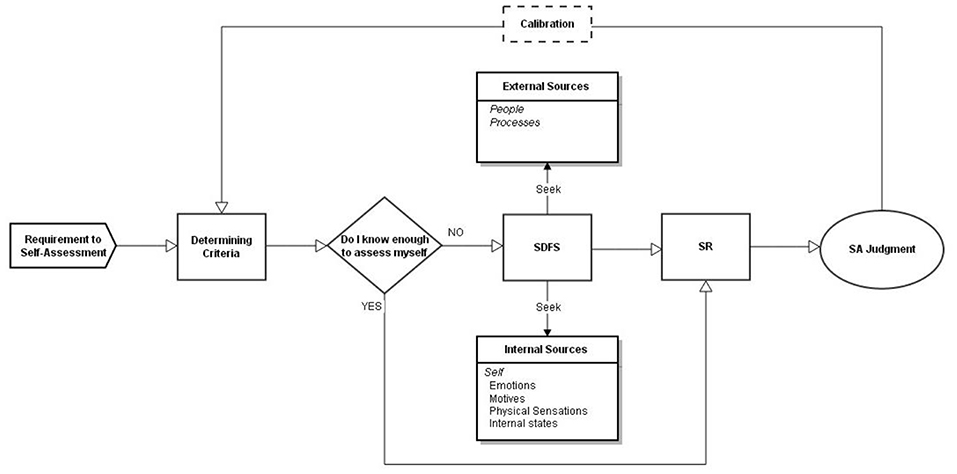
Figure 1. Theoretical framework of the cyclical self-assessment process (Yan and Brown, 2017).
Building on the Yan and Brown (2017) model, Yan (2018) developed a Self-assessment Practices Scale (SaPS) that contains 20 items (hereafter SaPS-20) assessing four self-assessment actions, namely, seeking external feedback through monitoring (SEFM), seeking external feedback through inquiry (SEFI), seeking internal feedback (SIF), and self-reflection (SR).
This Study
The SaPS-20 is not a long questionnaire in itself. However, in many situations where SaPS is likely to be used in conjunction with other instruments, a shorter version would be preferred to reduce respondent load as far as possible. Survey administration will be more efficient and less disturbance will be caused if a questionnaire can obtain quality psychometric information using fewer items (Meriac et al., 2013). Moreover, the number of items differs across the four subscales of the SaPS-20. It might be beneficial to have a balanced weighting among different subscales as there is no convincing justification for uneven weightings among the different self-assessment actions in the Yan and Brown (2017) process model. This study reanalyzed responses of 1416 students to the SaPS-20 (Yan, 2018) with an aim to develop a short form of SaPS (hereafter SaPS-SF) and to investigate its psychometric properties. The developed short form SaPS-SF was expected to be a more parsimonious measure with a balanced number of items within each subscale.
Method
Participants
The SaPS-20 had been administered to a convenience sample of 1416 Hong Kong students from 18 primary schools and 11 secondary schools (49.6% female, n = 703). Participating students ranged from Primary 4 (P4) to Secondary 3 (S3) and approximately aged 9 to 14 years (P4 = 185, P5 = 211, P6 = 232, S1 = 254, S2 = 237, S3 = 297).
Measures
The SaPS-20 was developed based on the Yan and Brown (2017) cyclical model of self-assessment process. The scale contains four subscales that assess four actions students engage in during self-assessment process including, seeking external feedback through monitoring (SEFM; 5 items), seeking external feedback through inquiry (SEFI; 4 items), seeking internal feedback (SIF; 4 items), and self-reflection (SR; 7 items). A six-point Likert-type response scale, ranging from Strongly Disagree (1) to Strongly Agree (6) was implemented. Yan (2018) reported satisfactory reliability for the SaPS-20. The Cronbach's α for the four subscales were SEFM 0.85, SEFI 0.84, SIF 0.79, and SR 0.90 respectively. The Rasch reliabilities for the four subscales were 0.88, 0.88, 0.80, and 0.90 respectively.
Data Analysis
To provide complementary information about the psychometric properties of the SaPS-SF, both confirmatory factor analysis (CFA) and Rasch analysis (Rasch, 1960) were employed. This approach has been used in many empirical studies (e.g., Deneen et al., 2013; Hart et al., 2013; Primi et al., 2014; Yan, 2016; West et al., 2018; Testa et al., 2019) for the benefit of providing comprehensive scrutiny of the psychometric qualities of instruments.
Since the data have a hierarchical structure, i.e., students are nested within schools, a reasonable concern is whether multilevel modeling is necessary. Maas and Hox (2005) suggested that multilevel modeling is preferred if the design effect >2 and the number of groups is large. In this case, fourteen items had a design effect lower than 2 and six items had a design effect between 2 and 3. Since the majority of items had a low design effect and the number of schools was only 18, single-level analyses were adopted in this study.
For selection of items for inclusion in the SaPS-SF, four criteria were considered. The items retained should (1) represent important content in terms of self-assessment practice; (2) have the largest structure coefficients within each of the four subscales; (3) have good fit to the Rasch model; and (4) cover as wide as possible a difficulty range along the latent trait scale.
The psychometric properties of the resultant SaPS-SF was then subject to the scrutiny of CFA, then Rasch analysis. CFA was conducted using AMOS 24.0 (Arbuckle, 2015) to examine the globe model-data fit. Multiple fit indices were checked including the comparative fit index (CFI), the goodness of fit index (GFI), the standardized root mean square residual (SRMR), and the root mean square error of approximation (RMSEA). As a general rule, values of GFI and CFI over 0.90, and values of RMSEA lower than 0.08 (McDonald and Ho, 2002) and values of SRMR lower than 0.08 (Hu and Bentler, 1999) indicate an acceptable model-data fit.
Rasch analysis was applied following CFA to further check the psychometric properties of the SaPS-SF. In Rasch analysis, the ordinal rating scale is transformed into a continuous interval scale which enables subsequent parametric analysis. For the purpose of examining the psychometric quality of an instrument, Rasch analysis checks the degree to which items in a scale reflect an underlying unidimensional latent construct. Rasch analysis adopts a “data fit the model” approach that requires the empirical data to satisfy a priori requirements essential for achieving fundamental measurement (Bond and Fox, 2015). As self-assessment practice was classified into four different but inter-related actions, a multidimensional Rasch-based model (Adams et al., 1997) using ConQuest 2.0 (Wu et al., 2007) was employed with these data. The indicators used for checking the scale quality included response category functioning and item fit statistics (i.e., Infit MNSQ and Outfit MNSQ). As suggested by Wilson (2005), Infit/Outfit MNSQs in the range between 0.75 and 1.33 indicate sufficient fit to the Rasch model.
In addition, internal consistency (i.e., Cronbach's α estimates) and Rasch reliabilities for each subscale were computed.
Results
CFA with maximum likelihood (ML) estimation was applied. The skewness and kurtosis values were computed to check the normality of each item. The skewness index ranged from −1.02 to −0.39 and kurtosis index from −0.55 to 1.17, indicating approximately normal distribution (Kline, 2015). Yan's (2018) study compared alternative models (e.g., the higher-order factor model and first-order factor model) and concluded that the higher-order model was a better choice because (1) it had better fit statistics, and (2) it was in line with the theoretical model specified by Yan and Brown (2017). Hence, this study adopted the high-order factor model. The results showed that the composite reliabilities for the four factors are: 0.86 for SEFM, 0.84 for SEFI, 0.80 fir SIF, and 0.90 for SR. In Table 1, the items in the SaPS-20 are ranked according to their standardized CFA factor loadings within each of the four subscales. Rasch item difficulties with associated standard errors and item fit statistics are also provided for each item. To produce a more parsimonious scale and, at the same time, to maintain adequate coverage of content, the target was set at a 12-item scale (rather than 20 items) with 3 items in each of the four subscales.
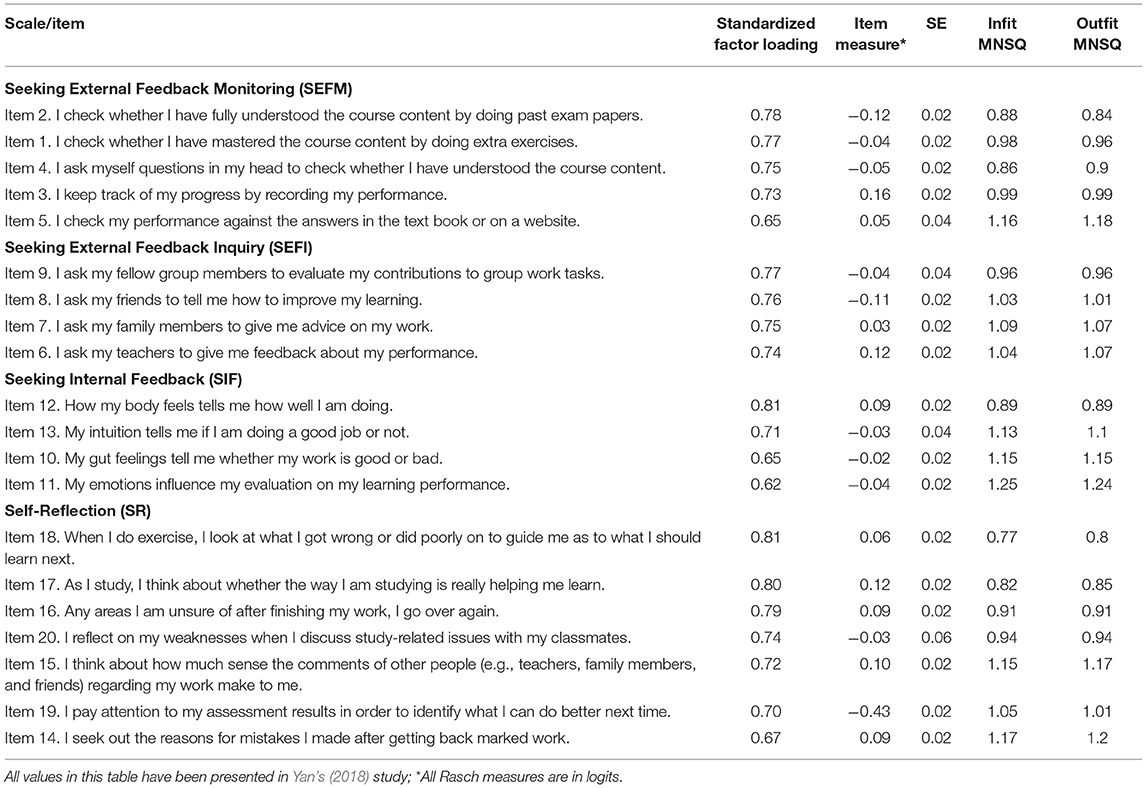
Table 1. Psychometric indicators for the SaPS-20 from CFA and Rasch analysis.
Item selection was guided by the four criteria, as described in the Method section. In subscale SEFM, items #2 and #1 was kept as they had the largest standardized factor loadings (0.78 and 0.77). However, item #3 was preferred over item #4, in spite of the marginal difference in the factor loading of item #4 (0.75) over that of item #3 (0.73). This was because item #3 had a higher item difficulty (0.16 logits) than item #4 (−0.05 logits) whose difficulty was similar to that of item #1 (−0.04 logits). Inclusion of item #3 (over #4) would help to cover a wider range of the underlying latent trait (0.28 over 0.08 logits).
In the SEFI subscale, items #9 and #8, with the largest standardized factor loadings (0.77 and 0.76), were included, but Item #6 (0.74) was retained in preference to item #7 (0.75) because teachers (item #6) are more likely to be an important source of feedback on students' performance compared to family members (item #7). Furthermore, Yan (2018) reported that item #7 demonstrated differential item functioning across year levels. Students from different year levels interpreted this item differently as it was unexpectedly more difficult to endorse for older students.
Items #12, #13, and #10 were retained for subscale SIF according to the four criteria. They had the largest standardized factor loadings, good fit to the Rasch model, and covered an appropriate range of difficulty.
For subscale SR, items #18 and #17 were kept. However, item #16 (0.79) was excluded in favor of item #19. Three considerations contributed to this decision: item #19 represented an essential aspect of self-reflection based on assessment results; had a difficulty of −0.43 logits that was helpful in covering a wider range of the latent trait; and the standardized factor loading of item #19 (0.70) was deemed adequate.
Confirmatory Factor Analysis
The 12 items included in the SaPS-SF were then subject to a CFA with maximum likelihood (ML) estimation. The specified model (Model 1) was identical to the high-order factor model tested in Yan's (2018) study, and in line with the Yan and Brown (2017) theoretical specification. In this model, the four actions of self-assessment form a hierarchical structure. SEFM and SEFI belonged to a second-order factor, i.e., seeking external feedback (SEF). SEF and SIF contributed to a higher-order factor, namely seeking feedback (SF). SF and SR were at the same level and constituted self-assessment (see Figure 2).
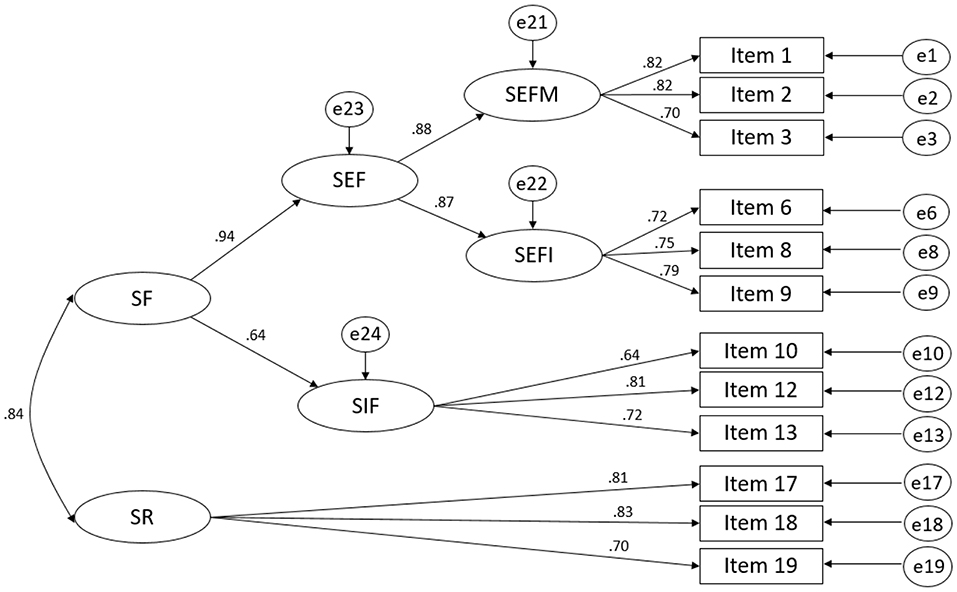
Figure 2. Model 1 for the SaPS-SF with standardized factor loadings.
It was found that the loading of SEF on SF was 0.94 with the 95% confidence interval ranging from 0.88 to 1.01, indicating that the loading of 0.94 does not significantly deviate from unity. It suggests that seeking external feedback (SEF) might be redundant. Hence, a revised model (Model 2) was tested. In this model, SEF was removed; SEFM, SEFI, and SIF contributed to SF (see Figure 3).
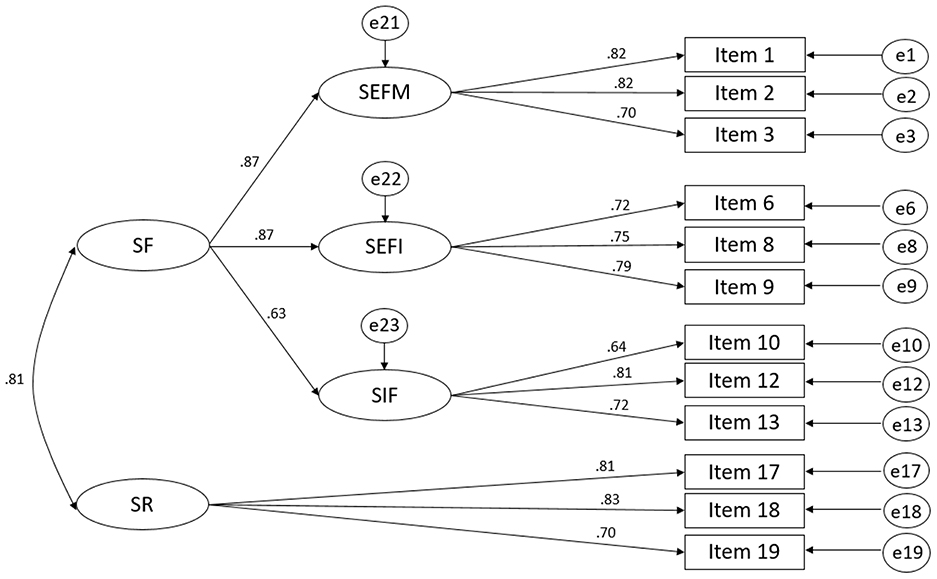
Figure 3. Model 2 for the SaPS-SF with standardized factor loadings.
The results in Table 2 showed that the SaPS-SF (both Model 1 and Model 2) had satisfactory and slightly better fit statistics than the SaPS-20. The standardized factor loadings of items in the SaPS-SF are presented in Figure 3 and Table 3. The factor loadings ranged from 0.70 to 0.82 for SEFM, 0.72 to 0.79 for SEFI, 0.64 to 0.81 for SIF, and 0.70 to 0.83 for SR.
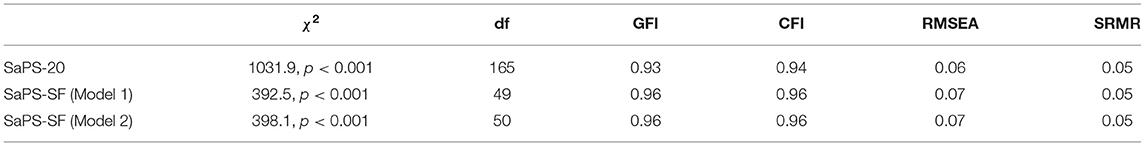
Table 2. CFA goodness-of-fit indices for the SaPS-20 and SaPS-SF.
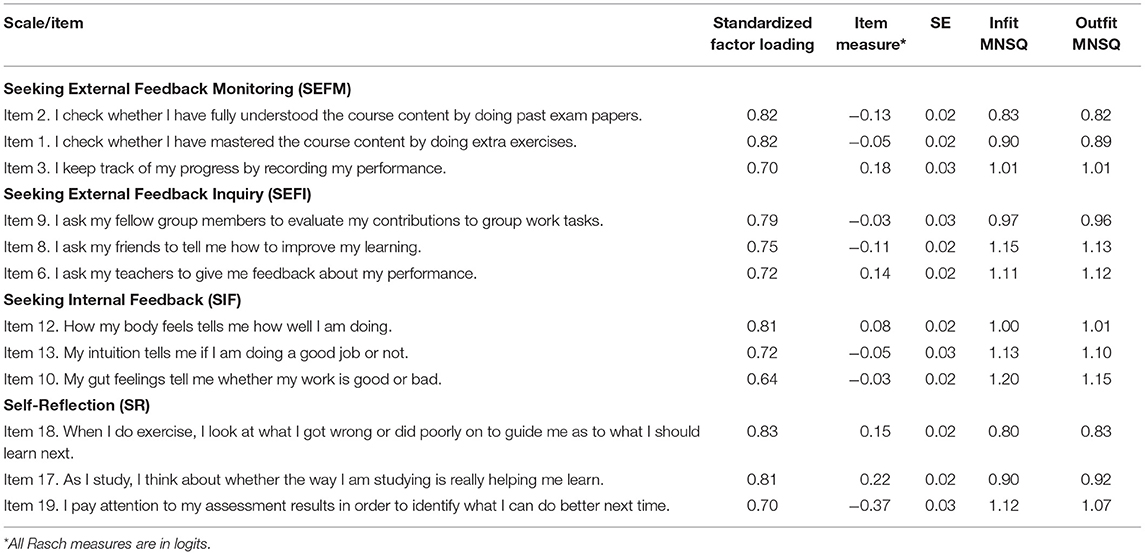
Table 3. Psychometric indicators for the SaPS-SF from CFA and Rasch analysis.
Rasch Analysis
Student responses to the selected 12 items in the SaPS-SF were also subject to a multidimensional Rasch analysis. The Rating Scale Model was applied as the same response scale was used across all items. The step calibrations (the transition points of from one category to the next) of the response scale increased monotonically from −1.47, −1.27, −0.76, 0.93, to 2.57 logits. This implied that the response scale functioned well in general although the step distances between the first three step calibrations could be larger, according to Linacre's (2002) guidelines. This result is similar to that of the SaPS-20. The correlations among the four latent traits (see Table 4) ranged from 0.57 to 0.85 for SaPS-20, from 0.56 to 0.82 for SaPS-SF.
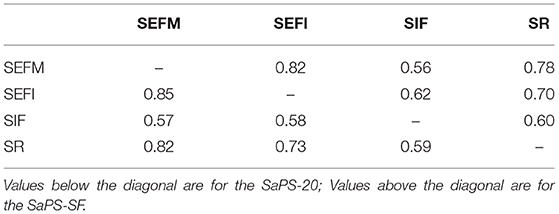
Table 4. Correlations between the four latent traits.
The item difficulty, standard error, item fit statistics (i.e., Infit and Outfit MNSQ) for the SaPS-SF are presented in Table 3. All the 12 items showed satisfactory fit to the Rasch model, indicating that all items within the same subscale were assessing the same construct as theorized.
The Wright map, as shown in Figure 4, presents person measures and item difficulties that are calibrated on the same metric. The four continua on the left side indicate the students' measures on each of the four subscales. The items with their thresholds, organized into the four subscales, are placed on the right side. The notation of x.y is used to indicate items and thresholds. For example, 3.5 refers to the 5th threshold of #3. Although the range of student ability was much larger than the range of item difficulty for each of the four subscales, the SaPS-SF still provided a targeted measurement of student self-assessment practice because items together with their item thresholds covered the major range of students' ability on the latent trait.
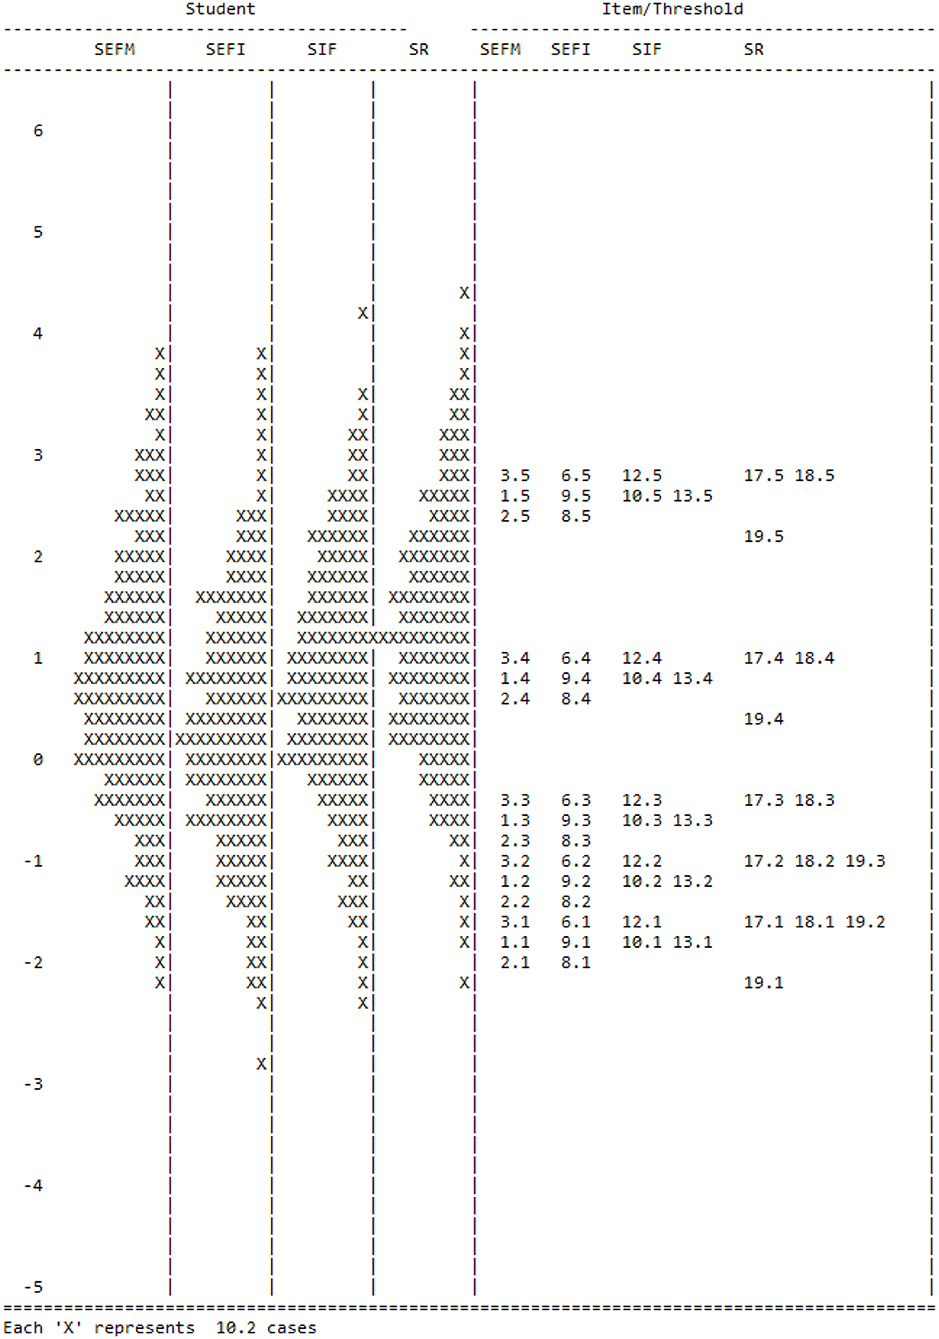
Figure 4. The Wright map of the SaPS-SF.
Both conventional reliability (i.e., Cronbach's α) and Rasch reliability (i.e., EAP/PV reliabilities generated by ConQuest) were calculated for the SaPS-SF. For an easy comparison, the reliabilities of each subscale of the SaPS-20 and SaPS-SF are presented in Table 5. It can be seen that all the four subscales in the SaPS-SF maintained a satisfactory reliability after the exclusion of 40% of the items (from 20 to 12 items). The Cronbach's α ranged from 0.76 to 0.82, and the Rasch reliability ranged from 0.79 to 0.86. The person separation indices of the two versions of SaPS were quite similar for SEFM, SEFI, and SIF. The separation for SR dropped marginally from 3 to 2.29, quite acceptable considering that the number of items decreased from 7 to 3.
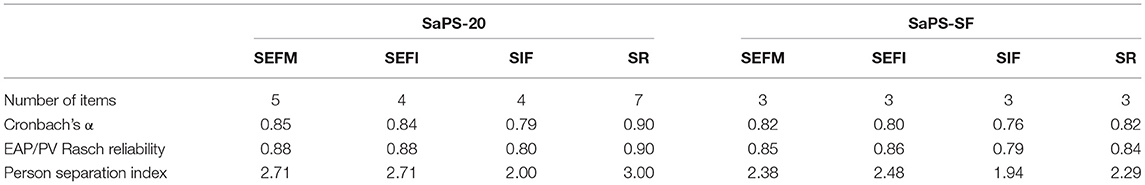
Table 5. Comparison of reliabilities of the SaPS-20 and SaPS-SF.
The correlations between students' Rasch person measures on the SaPS-SF and SaPS-20 were calculated. The coefficients were 0.94, 0.97, 0.95, and 0.92 for SEFM, SEFI, SIF, and SR, respectively. These high correlations indicated that the person measurement was stable across the short form and the original scale.
To further examine the invariance of estimates across the SaPS-20 and SaPS-SF, person measures and the associated standard errors obtained from these two versions of the scale were imported into an Excel spreadsheet provided by Bond and Fox (2015) and an invariance plot was generated for each subscale (see Figure 5). The person measures from SaPS-SF were plotted on the y-axis, and the measures from SaPS-20 on the x-axis. The 95% control lines were generated based on the standard errors for each of the person measures. It can be seen that the person measures for all the four subscales were within the 95% control lines with very few exceptions, indicating that person measures remained invariant (within error) across the short form and the original scale.
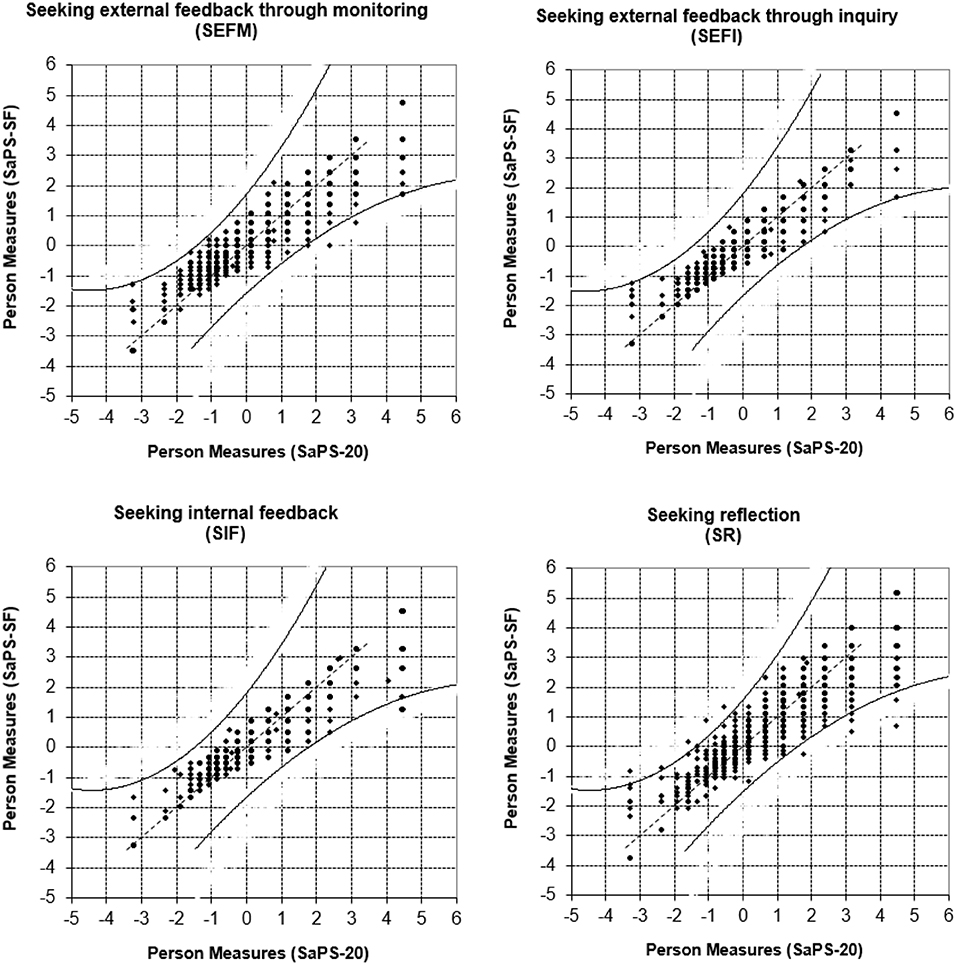
Figure 5. Person measure invariance (SaPS-SF vs. SaPS-20).
Discussion
The lack of a valid instrument for assessing self-assessment practice significantly hinders developing a detailed understanding of self-assessment. The SaPS-20 is the most recently developed tool (Yan, 2019; Yan et al., 2019) that is theory-driven and specifically designed for assessing different actions in the self-assessment process (Yan, 2018). The present study set out to extend the attempt to provide a valid and parsimonious measurement of self-assessment practice. The four-factor model found in the original SaPS-20 (Yan, 2018) fits very well in the 12-item SaPS-SF. The SaPS-SF reflected all actions of self-assessment practice—SEFM, SEFI, SIF, and SR—in a more balanced fashion (i.e., 3 items within each of the four subscales). All items in the SaPS-SF subscales fit the Rasch model sufficiently and measure unidimensional constructs as theorized. The SaPS-SF is much more parsimonious (40% decrease in item number) but almost equally as effective as using the original SaPS-20 in terms of differentiating person measures, as showed by person separation indices. The invariance of person measures demonstrated in Figure 5, as well as high correlations between the Rasch person measures obtained from the SaPS-SF and SaPS-20, provided strong evidence of concurrent validity.
As the SaPS (both the original scale and the short form) is a relatively new instrument, more studies are needed to provide further utility and validity evidence. First, as the sample used in this study was solely from the Confucian culture, examining the reliability and validity of the SaPS-SF on samples from other cultures would be an interesting topic. Second, the psychometric properties of the SaPS-SF with students of other age groups not covered in this study (e.g., lower primary students, upper secondary students, and university students) are warranted. Third, further studies could consider investigating the external (e.g., correlation with relevant constructs), and consequential aspects (e.g., prediction on outcome measures such as academic performance) of validity of the SaPS-SF (see Messick, 1995).
In conclusion, the SaPS-SF is a more economical measure of self-assessment practices which maintains the good psychometric properties of the original SaPS-20. The findings presented in this study facilitate the measurement of self-assessment practice in a parsimonious and effective way and, therefore, can contribute to future research in self-assessment.
Data Availability Statement
The datasets generated for this study are available on request to the corresponding author.
Ethics Statement
The studies involving human participants were reviewed and approved by The Education University of Hong Kong. Written informed consent to participate in this study was provided by the participants' legal guardian/next of kin.
Author Contributions
The author confirms being the sole contributor of this work and has approved it for publication.
Funding
This work was supported by a General Research Fund (GRF) (Project No: EDUHK 18600019) from the Research Grants Council of Hong Kong.
Conflict of Interest
The author declares that the research was conducted in the absence of any commercial or financial relationships that could be construed as a potential conflict of interest.
Acknowledgments
I would like to thank Prof. Trevor Bond for providing insightful comments on an early draft of this paper.
References
Adams, R. J., Wilson, M., and Wang, W. C. (1997). The multidimensional random coefficients multinomial logit model. Appl. Psychol. Meas. 21, 1–23. doi: 10.1177/0146621697211001
Bond, T. G., and Fox, C. M. (2015). Applying the Rasch Model: Fundamental Measurement in the Human Sciences, 3rd Edn. New York, NY: Routledge. doi: 10.4324/9781315814698
Brown, G., Andrade, H., and Chen, F. (2015). Accuracy in student self-assessment: directions and cautions for research. Assess. Educ. Princip. Policy Pract. 22, 444–457. doi: 10.1080/0969594X.2014.996523
Brown, G. T. L., and Harris, L. R. (2013). “Student self-assessment,” in The SAGE Handbook of Research on Classroom Assessment, ed J. H. McMillan (Thousand Oaks, CA: Sage), 367–393. doi: 10.4135/9781452218649.n21
Deneen, C., Brown, G. T. L., Bond, T. G., and Shroff, R. (2013). Understanding outcome-based education changes in teacher education: evaluation of a new instrument with preliminary findings. Asia Pac. J. Teach. Educ. 41, 441–456. doi: 10.1080/1359866X.2013.787392
Hart, C. O., Mueller, C. E., Royal, K. D., and Jones, M. H. (2013). Achievement goal validation among African American high school students: CFA and rasch results. J. Psychoeduc. Assess. 31, 284–299. doi: 10.1177/0734282912466726
Hu, L., and Bentler, P. M. (1999). Cutoff criteria for fit indexes in covariance structure analysis: conventional criteria versus new alternatives. Struct. Equat. Mod. 6, 1–55.
Kline, R. B. (2015). Principles and Practice of Structural Equation Modeling, 4th Edn. New York, NY: The Guilford Press. doi: 10.1080/10705519909540118
Maas, C. J. M., and Hox, J. J. (2005). Sufficient sample sizes for multilevel modeling. Methodology 1, 86–92. doi: 10.1027/1614-2241.1.3.86
McDonald, R. P., and Ho, M. R. (2002). Principles and practice in reporting structural equation analyses. Psychol. Methods 7, 64–82. doi: 10.1037/1082-989X.7.1.64
Meriac, J. P., Woehr, D. J., Gorman, C. A., and Thomas, A. L. (2013). Development and validation of a short form for the multidimensional work ethic profile. J. Vocat. Behav. 82, 101–107. doi: 10.1016/j.jvb.2013.01.007
Messick, S. (1995). Validity of psychological assessment: validation of inferences from persons' responses and performances as scientific inquiry into score meaning. Am. Psychol. 50, 741–749. doi: 10.1037/0003-066X.50.9.741
Panadero, E., Brown, G. T., and Strijbos, J. W. (2016). The future of student self-assessment: a review of known unknowns and potential directions. Educ. Psychol. Rev. 28, 803–830. doi: 10.1007/s10648-015-9350-2
Panadero, E., Jonsson, A., and Botella, J. (2017). Effects of self-assessment on self-regulated learning and self-efficacy: four meta-analyses. Educ. Res. Rev. 22, 74–98. doi: 10.1016/j.edurev.2017.08.004
Primi, R., Wechsler, S. M., Nakano, T. C., Oakland, T., and Guzzo, R. S. L. (2014). Using item response theory methods with the Brazilian Temperament Scale for students. J. Psychoeduc. Assess. 32, 651–662. doi: 10.1177/0734282914528613
Rasch, G. (1960). Probabilistic Models for Some Intelligence and Achievement Test. Copenhagan: Danish Institute for Educational Research. Expanded ed. Chicago, IL: The University of Chicago Press (1980).
Tan, K. H. K. (2012). Student self-Assessment. Assessment, Learning and Empowerment. Singapore: Research Publishing.
Testa, I., Capasso, G., Colantonio, A., Galano, S., Marzoli, I., di Uccio, U. S., et al. (2019). Development and validation of a university students' progression in learning quantum mechanics through exploratory factor analysis and Rasch analysis. Int. J. Sci. Educ. 41, 388–417. doi: 10.1080/09500693.2018.1556414
West, C., Baker, A., Ehrich, J. F., Woodcock, S., Bokosmaty, S., Howard, S. J., et al. (2018). Teacher disposition scale (TDS): construction and psychometric validation. J. Further Higher Educ. doi: 10.1080/0309877X.2018.1527022
Wilson, M. (2005). Constructing Measures: An Item Response Modeling Approach. Mahwah, NJ: Erlbaum Associates. doi: 10.4324/9781410611697
Wu, M. L., Adams, R. J., Wilson, M. R., and Haldane, S. A. (2007). ACER ConQuest, Version 2.0: Generalized Item Response Modelling Software [Computer Program]. Camberwell, VIC: Australian Council for Educational Research.
Yan, Z. (2016). The self-assessment practices of Hong Kong secondary students: findings with a new instrument. J. Appl. Meas. 17, 335–353.
Yan, Z. (2018). The Self-assessment Practice Scale (SaPS) for students: development and psychometric studies. Asia Pac. Educ. Res. 27, 123–135. doi: 10.1007/s40299-018-0371-8
Yan, Z. (2019). Self-assessment in the process of self-regulated learning and its relationship with academic achievement. Assess. Evalu. Higher Educ. doi: 10.1080/02602938.2019.1629390
Yan, Z., and Brown, G. T. L. (2017). A cyclical self-assessment process: Towards a model of how students engage in self-assessment. Assess. Eval. Higher Educ. 42, 1247–1262. doi: 10.1080/02602938.2016.1260091
Keywords: self-assessment, self-assessment practices scale, scale development, short form, rasch measurement model
Citation: Yan Z (2020) Developing a Short Form of the Self-Assessment Practices Scale: Psychometric Evidence. Front. Educ. 4:153. doi: 10.3389/feduc.2019.00153
Received: 23 September 2019; Accepted: 11 December 2019;
Published: 08 January 2020.
Edited by:
Maria Assunção Flores, University of Minho, PortugalReviewed by:
Nikolaos Tsigilis, Aristotle University of Thessaloniki, GreeceAnthony Joseph Nitko, University of Pittsburgh, United States
Copyright © 2020 Yan. This is an open-access article distributed under the terms of the Creative Commons Attribution License (CC BY). The use, distribution or reproduction in other forums is permitted, provided the original author(s) and the copyright owner(s) are credited and that the original publication in this journal is cited, in accordance with accepted academic practice. No use, distribution or reproduction is permitted which does not comply with these terms.
*Correspondence: Zi Yan, zyan@eduhk.hk