
- Departments of Radiology and Pediatrics, Children’s Hospital of Los Angeles, Keck School of Medicine, University of Southern California, Los Angeles, CA, USA
Fusion positron emission and computed tomography (PET/CT) remains the gold-standard imaging modality to non-invasively study metabolically active brown adipose tissue (BAT). It has been widely applied to studies in adult cohorts. In contrast, the number of BAT studies in children has been few. This is largely limited by the elevated risk of ionizing radiation and radionuclide tracer usage by PET/CT and the ethical restriction of performing such exams on healthy children. However, metabolically active BAT has a significantly higher prevalence in pediatric patients, according to recent literature. Young cohorts thus represent an ideal population to examine the potential relationships of BAT to muscle development, puberty, disease state, and the accumulation of white adipose tissue. In turn, magnetic resonance imaging (MRI) represents the most promising modality to overcome the limitations of PET/CT. The development of rapid, repeatable MRI techniques to identify and quantify both metabolically active and inactive BAT non-invasively and without the use of exogenous contrast agents or the need for sedation in pediatric patients are critically needed to advance our knowledge of this tissue’s physiology.
Introduction
The recent findings of metabolically active brown adipose tissue (BAT) in adult humans by fusion positron emission and computed tomography (PET/CT) have reinvigorated research toward the tissue’s role in energy balance, metabolism, and physiology (Cypess et al., 2009; van Marken Lichtenbelt et al., 2009; Virtanen et al., 2009). In contrast to white adipose tissue (WAT), which functions to store fat and consists of cells with large intracellular lipid droplets, BAT is involved in lipid metabolism and both non-shivering and diet-induced thermogenesis, facilitated by its unique uncoupling protein UCP-1 (Rothwell and Stock, 1979; Himms-Hagen, 1989). BAT is also highly vascularized, rich in mitochondria organelles, innervated by the sympathetic nervous system, and most importantly, it is metabolically active and prevalent in newborns and children (Heaton, 1972; Enerback, 2010). In contrast to WAT adipocytes, brown adipocytes are further characterized by multiple smaller intracellular lipid droplets, have lower lipid content by volume, and greater intracellular water (Cannon and Nedergaard, 2004; Cinti, 2006).
While fusion PET/CT has provided the unique ability to non-invasively visualize metabolically active BAT and remains the gold-standard approach, it is now recognized by the scientific community that PET/CT lacks sensitivity and specificity, has key limitations, and that new and alternative imaging techniques need to be developed. First, PET/CT is restricted to oncology patients as a tool for tumor detection and cancer screening. Second, PET/CT is not widely applicable to the general population due to significant radiation exposures, the need to inject a radionuclide tracer, and related prohibitive costs. It is also not suited for longitudinal studies where repeated scans are required. Third, PET/CT can only detect metabolically active BAT that uptakes the injected tracer, which represents only a small percentage of the tissue’s total amount in the body. Moreover, tracer uptake by metabolically active BAT is sensitive to factors such as environment and examination room temperature, season, anesthesia, the amount of clothing worn by the patient (Au-Yong et al., 2009; Pfannenberg et al., 2010; Yoneshiro et al., 2011), and the health/disease condition of the subject at exam time. The presence of metabolically active BAT can further be confounded by competing tracer uptake in nearby muscles, organs, and tumors. Perhaps the biggest unmet need in the imaging of BAT by PET/CT is that the endpoint measurement remains a binary visual interpretation of positive or negative depiction of BAT activity, often decided by the reading radiologist. This subjective measure has made systematic comparisons between studies from various investigators difficult with no apparent consensus amongst the literature. Ultimately, the method lacks the ability to generate a quantitative measure of total BAT mass or volume, one however that is critically needed to advance the field. Alternatives such as standalone CT and magnetic resonance imaging (MRI) that can detect BAT based on morphology, regardless of tissue metabolic activity, are necessary to avoid the confounding factors that have limited functional PET/CT.
In this review article, we first survey several unique imaging signatures of BAT that differentiates this tissue from WAT in CT and MRI based solely on morphology. These have been published in recent imaging periodicals. MRI holds promise as the most appropriate non-invasive imaging modality for studying BAT in humans, particularly in newborns and children, since it does not involve ionizing radiation and can be repeated multiple times with ultra-low risk. In the second part of this review, we summarize the high prevalence of BAT by PET/CT in pediatric patients and findings of BAT associations with muscle volume, puberty, and disease states from studies performed at our institution, Children’s Hospital of Los Angeles. Our goal is to inform the reader that (1) due to high BAT prevalence, young cohorts represent an ideal population to study BAT physiology and examine the relationships of BAT to muscle development, puberty, disease states, and body adiposity, and that (2) MRI is the most suitable platform to implement these investigations in pediatric populations.
Imaging of BAT
Imaging Signatures of BAT in CT
In PET/CT, standard uptake values (SUVs) have been used as an adjunct to distinguish metabolically active BAT from inactive WAT, based on uptake of a tracer, typically fluoro-deoxyglucose (FDG). By radiology convention CT images of tissues with negative Hounsfield units (HUs) X-ray attenuations have traditionally been interpreted as fat and no additional stratification of the negative HU scale was further considered. In contrast, all other soft tissues and bone occupy the positive HU range. The question of whether there exists a parallel difference in CT HUs and tissue densities between BAT and WAT has only been recently suggested and explored (Carter and Schucany, 2008; Baba et al., 2010; Hu et al., 2011). These studies have found that additional stratification of the negative HU scale is feasible to uniquely differentiate metabolically active BAT and WAT. Namely, metabolically active BAT was characterized by higher, but still negative, HUs than lipid-rich WAT. BAT exhibits higher CT attenuation values than WAT, largely due to its greater intracellular water content and higher degree of vascularization. Figure 1A illustrates results from a cohort of pediatric patients who all exhibited positive visual depiction of BAT on their PET/CT exams (Hu et al., 2011). It is important to note that metabolically active BAT and inert WAT data points occupy unique and nearly non-overlapping regions on the CT HU versus PET SUV plot. The use of standalone CT to identify and quantify metabolically active BAT, however, has not yet been corroborated by a large study or validated with histology. Furthermore, whether such HU differences between metabolically inactive BAT and WAT exist has yet to be explored.
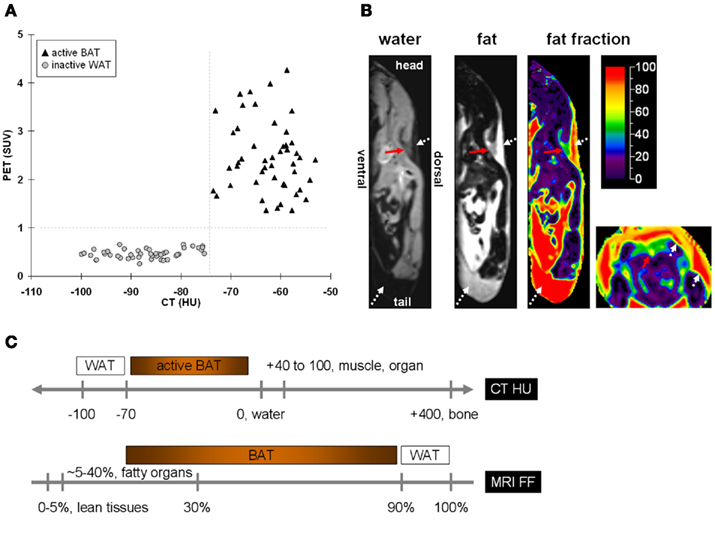
Figure 1. The difference in intracellular water and fat content between BAT and WAT leads to unique signal contrast between the two tissues in (A) PET/CT and (B) MRI. In (A) PET/CT, metabolically active BAT and WAT not only differ in their standard uptake values (SUVs) of the radionuclide tracer, but also in their Hounsfield units (HUs) of X-ray attenuation. The greater water content in BAT leads to more positive HUs than WAT. Note that the differences in SUVs and HUs between the two tissues are unique, with no overlap on either axis. In (B) MRI, separated water and fat representative images are shown in the sagittal plane of a mouse. Shown additionally is the corresponding fat fraction (FF) map, on a color scale from 0 to 100%. Illustrated to the far right is the fat fraction map in the axial plane from the same animal. The red arrows point to the triangular/trapezoidal interscapular BAT depot. The white dotted arrows denote WAT. Note that BAT has a much lower fat fraction than WAT, caused by BAT’s greater water and lower fat content, which can be observed by the opposing grayscale contrast differences in the water and fat images, respectively. (C) A schematic of approximate BAT and WAT signal contrasts based on CT HU and MRI FF.
Imaging Signatures of BAT in MRI
The use of MRI and magnetic resonance spectroscopy (MRS) to study BAT in rodents was investigated in the 1990s (Sbarbati et al., 1997; Lunati et al., 1999). Inspired by these early works, recent methodological advances in both MRI and MRS methodology have led to several promising literature publications describing more robust and accurate characterizations of rodent BAT. Unlike PET/CT where the functional uptake of a radionuclide tracer was needed to differentiate BAT from WAT, one common theme among these MR-based works was the use of only morphological differences between BAT and WAT for identification and signal contrast. Specifically, the greater vascularity, mitochondria number, and intracellular water in closer proximity to lipid droplets of BAT when compared to WAT have been exploited.
Using chemical-shift water–fat separation MRI techniques that can accurately decompose lean (water-based) and fatty (lipid-based) signals across an imaging volume on a voxel-wise basis, Hu et al. (2010a) demonstrated in mice the feasibility of differentiating BAT and WAT based on a fat fraction metric in wild-type mice. A fat fraction map was computed from the separated water and fat signals. Whereas WAT is predominantly composed of lipids and is thus typically characterized by a fat fraction >90%, interscapular BAT was shown to occupy a much broader and lower fat fraction range. Figure 1B illustrates a representative example. Figure 1C summarizes the approximate tissue signal contrast between BAT and WAT by CT and chemical-shift MRI. In a follow-up study, the investigators further showed that their technique could detect differences in BAT fat fraction among mice groups that were housed at cold (19°C) and warm (25°C) temperatures. Given ad libitum access to food, mice exposed to colder temperature consumed significantly more food (∼30%), exhibited lower BAT fat fractions (∼10% difference), but yet maintained the similar body weight, and composition, as determined by quantitative magnetic resonance (QMR), in comparison to warm-housed animals over a 4-week period (Hu et al., 2010b). The lower BAT fat fractions of the cold-exposed animals suggested greater metabolic activity and involvement of the tissue in thermogenesis. One limitation of this chemical-shift MRI approach is the need for high spatial resolution to avoid partial volume effects that can mimic BAT-like fat fractions at fat–lean tissue boundaries.
In another recent study, Branca and Warren (2011a) reported a novel and promising spectroscopy technique utilizing unique intermolecular zero-quantum coherence transitions between water and fat protons, specifically those of the methylene (–CH2–) groups, to differentiate BAT from WAT (Branca and Warren, 2011a). The approach exploited the fact that in BAT, intracellular water and fat are in close physical vicinity to each other, and thus gives rise to distinctive iZQC signal peaks. On the contrary, in WAT, water, and fat are separated by greater distances and thus such iZQC peaks are not observed. Furthermore, the authors demonstrated that the amplitude of the signal peaks were substantially greater in more thermogenically active young mice than in old or obese mice, signifying increased amounts of metabolically active BAT in the former group. However, in BAT, and WAT, iZQC signal peaks from interactions between lipid methylene and olefinic groups were both observed. The critical methodological advancement was that iZQC allowed the investigators to perform a survey-like scan and unambiguously determine whether BAT is simply present in an imaging volume based on the tissue’s unique water–fat signal peaks. In a related follow-up study by Branca and Warren (2011b) the researchers used a variant of their spectroscopy technique to determine differences in the chemical composition of adipose tissue, such as triglyceride degree of unsaturation, in mice fed with either standard chow or fatty diets (Branca and Warren, 2011b).
In another spectroscopy study by Hamilton et al. (2011), the authors utilized conventional high-resolution proton MRS to first confirm the finding that BAT has a uniquely lower fat fraction than BAT. The investigators then discovered that the T1 relaxation time of the water component in BAT was significantly reduced by nearly twofold from that in WAT. Briefly, the MRI/MRS signal arises from hydrogen protons in water and fat. When an object is placed inside a magnetic field, a longitudinal magnetization from the proton ensemble is created. In an MR experiment, radiofrequency pulses are applied repetitively to gather imaging data. The pulses excite the longitudinal magnetization and perturb it away from equilibrium. T1 is a tissue-specific exponential constant that describes the rate with which the perturbed magnetization recovers between consecutive radiofrequency excitation. The authors speculated that the source of this apparent T1 contrast was due to the fact that a molecule’s T1 rate is primarily governed by its surrounding chemical environment. In contrast to WAT where intracellular water is confined to a small globule, water molecules in BAT are more interspersed and in greater contact with lipids. Moreover, the researchers were able to quantify an average number of carbon–carbon double bonds from the MR spectra, and reported that BAT was more saturated than WAT, consistent with previous findings (Zingaretti et al., 2009). An extended imaging approach for carbon–carbon double-bond mapping was also recently reported (Bydder et al., 2011) and its application to BAT is under investigation. This MRS approach may not be adequate for the independent identification of BAT since a priori knowledge of tissue depot location is required. Nonetheless, the technique should serve as a useful adjunct tool for characterizing BAT properties.
Magnetic resonance is the most appropriate modality to address the shortcomings of PET/CT. It involves no ionizing radiation and requires no radionuclide tracer. It can be safely repeated multiple times with minimal risk in healthy volunteers and is applicable to large study populations and nearly all age groups, including children. The works demonstrated by Hu et al. (2010a,b); Branca and Warren(2011a,b); Hamilton et al. (2011) in identifying unique BAT imaging signatures from MRI and MRS represent the modality’s immense versatility. Their results represent exciting new potential from the fact that none of the described MR-based signals of BAT depend on the tissue’s metabolic functions, but rather its intrinsic cellular morphology. Validation and application of these MR-based methods to humans remains an area of future research. However, it is unlikely that a single MR-based approach will definitively capture both metabolically active and inactive BAT (Carter and Schucany, 2008). Many additional distinctive features of BAT are known but have not yet been explored by MRI and MRS. For example, BAT’s immense vasculature lends itself to well-established MRI perfusion techniques such as arterial-spin-labeling that can quantify local blood flow. MR techniques that are sensitive to  relaxation as a consequence of fluctuating levels of oxy- and deoxy-hemoglobin in blood are being evaluated in BAT by multiple investigators. Signal contrasts between BAT and WAT, such as diffusion and targeted molecular imaging of the mitochondria, have not been explored. Lastly, recent advances in fusion PET/MR also holds great promise as an additional complementary tool for imaging BAT and will likely play a critical role in validating a subset of aforementioned standalone MRI techniques in future studies.
BAT in Pediatrics
Prevalence of BAT in Children
Based on previous anatomical studies, BAT was known to be present in all neonates but thought to be lost after infancy (Enerback, 2010). However, significant amounts of metabolically active BAT have recently been noticed in a large proportion of pediatric patients undergoing PET/CT examinations (Celi, 2009). While BAT is seen in similar locations in adults and children, a significantly higher prevalence of nearly 10-fold increase in BAT depiction in pediatric PET/CT examinations (Gelfand et al., 2005; Zukotynski et al., 2010; Gilsanz et al., 2011; Hu et al., 2011) has been reported in comparison to the prevalence in adults (Cypess et al., 2009). Based our own experiences, approximately 40% of PET/CT studies in young patients depict metabolically BAT, even when they live in warm climates and when the PET/CT exams are performed under thermoneutral conditions (Gilsanz et al., 2011).
A previous study by Gelfand et al. (2005) found that the incidence of BAT uptake in adolescents was greater than in patients younger than 10 years. More recently, using qualitative and quantitative approaches to analyze PET/CT exams, Gilsanz et al. (2011) reported a higher prevalence and significantly greater amounts of BAT in adolescence than during childhood. In that study, whereas less than 20% of studies in pre-pubertal girls or boys exhibited uptake of FDG by metabolically active BAT, more than 75% of such studies in pubertal teenagers displayed visually identifiable BAT uptake. Additionally, the volume of metabolically active BAT measured using CT HU and PET SUV metrics increased with adolescence in both sexes. The magnitude of the increase in BAT was substantially greater during the late stages of puberty (e.g., Tanner stages) than during the early phases of sexual development and was substantially higher in boys when compared to girls.
Numerous metabolic and hormonal changes occur during puberty, including increases in the production of growth hormone/growth factors, gonadotropins, and sex steroid hormones. Variations in one or more of these important modifiers known to influence muscle development could also account for the increases and gender dimorphism in BAT development during adolescence. Recent data suggest that sex hormones have a marked effect on BAT activity, with corroborating studies demonstrating that associated receptor expression differs in cell-cultured brown adipocytes of male and female rodents, with higher numbers of all receptor types in male BAT (Rodriguez-Cuenca et al., 2007).
Association of BAT to Disease
In children, like in adults, the depiction of metabolically active BAT by PET/CT has been reported to be dependent on a multitude of physiologic and technical factors including age, sex, body composition, FDG dose, anesthesia, modality acquisition parameters, and season and temperature during examinations (Cohade et al., 2003; Au-Yong et al., 2009; Saito et al., 2009; Lee et al., 2010; Pfannenberg et al., 2010; Yoneshiro et al., 2011). In PET/CT studies of adult cancer patients, the visualization of metabolically active BAT was predominantly thought to be independent of disease status, and to date, no association has been noted between the prevalence of BAT depiction and the presence of metastases. One previous longitudinal investigation assessing changes in BAT in females with breast cancer found no association between tumor response during treatment and activation of the tissue (Rousseau et al., 2006). At our institution, we have recently observed several cases where a patient with a malignant lymphoma exhibited metabolically active BAT only when evidence of the disease was not present on the PET/CT images (Figure 2). This prompted the speculation that the prevalence of BAT in pediatric patients with lymphoma is greater when there is no evidence of disease than at diagnosis. In 62 studies to date involving 30 pediatric patients at our institution, we have found that approximately 10% of the exams at diagnosis exhibited uptake of FDG tracer by metabolically active BAT, while a significantly higher 80% of follow-up exams after therapeutic treatment displayed BAT when there was no longer evidence of disease.
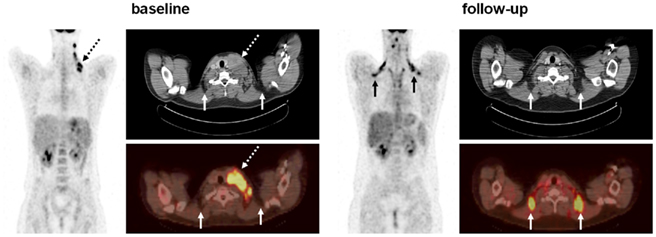
Figure 2. Coronal PET, and registered axial CT and fusion PET/CT of a 16-year-old male patient at baseline and 36 weeks follow-up after chemotherapy treatment. At baseline, the subject exhibits no evident bilateral and symmetrical FDG uptake by interscapular BAT (solid arrows). However, the presence of disease is clearly visualized by strong unilateral FDG uptake of the enlarged cervical lymph nodes (dashed arrows). On the CT image, note that the lymph node mass is characterized by soft-tissue-like attenuation. At follow-up, the subject exhibits clear bilateral FDG uptake indicative of BAT. This is confirmed on the CT images which show negative fat-like attenuation (solid arrows). In contrast, the corresponding BAT depots on the baseline axial images do not exhibit FDG uptake. Note that the enlarged lymph node has been successfully treated.
The mechanisms responsible for the possible suppression of BAT activity by lymphoma are unknown. However, we speculate that patients with malignant lymphomas have high circulating levels of tumor necrosis factor-alpha (TNF-α; Salles et al., 1996; Warzocha et al., 1997), a pluripotent cytokine reported to elicit a large number of biological effects in different cell systems including the apoptotic degeneration of brown adipocytes (Nisoli et al., 1997). This cytotoxic effect is known to be mediated by the p55 TNF-α receptor subtype, and its deletion has been shown to increase thermogenesis with an associated increase of uncoupling protein-1 expression in BAT (Romanatto et al., 2009). The finding of an apparent association between disease state and BAT depiction is still at an early stage, and additional research is needed to better establish the roles of TNF-α on BAT homeostasis.
Association of BAT to Muscle
Adipose and musculoskeletal tissues originate from the mesoderm, and the prevailing model has been that a common stem cell gives rise to WAT, BAT, bone, and muscle. In an intermediate developmental step, it was assumed that WAT and BAT share a common precursor because both forms of adipose tissue express a similar array of genes involved in triglyceride metabolism. However, although it is possible to convert WAT precursors into brown adipocyte-like cells, evidence also suggests that brown adipocytes are developmentally close to skeletal muscle. An in vivo study by Seale et al. (2008) indicated that some brown adipocytes arise from the same Myf5-expressing progenitor as skeletal muscle cells, whereas white adipocytes did not show such commonality. Consistent with this notion are additional data indicating that brown adipocytes and skeletal muscle cells share many common features: an abundance of mitochondria, energy expenditure via oxidative phosphorylation, and sympathetically mediated adaptive thermogenesis.
In a recent study by Gilsanz et al. (2011) young patients with metabolically active BAT on PET/CT examinations were observed to have significantly greater muscle volume than patients of the same age and body-mass-index with no visibly identifiable BAT on PET/CT. This finding was present in the axial and appendicular skeletons of both male and female patients. Gilsanz et al. (2011) reported that on average, pediatric cancer patients who exhibited visually evident BAT on their PET/CT exams had approximately 50% greater neck volume and approximately 33% greater gluteal muscle volume than patients who did not exhibit BAT FDG uptake. Figure 3 summarizes some additional results from that study.
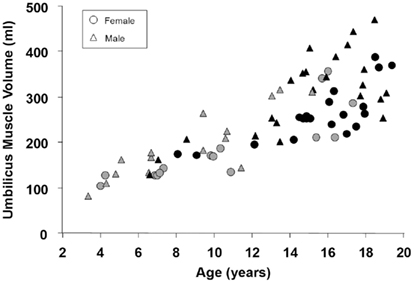
Figure 3. Scatter plot of muscle volume versus age for male and female pediatric patients with (black, BAT+) and without (gray, BAT−) visually depicted metabolically active BAT by PET/CT. For males without visualized BAT (gray triangles), the linear correlation coefficient was r = 0.88; for males with visualized BAT (black triangles), the coefficient was r = 0.72; for females without visualized BAT (gray circles), the coefficient was r = 0.85; for females with visualized BAT (black circles), the coefficient was r = 0.78. All correlations were statistically significant with p < 0.001.
Lastly, studies in adults have consistently shown an inverse relation between body mass, body fat, and BAT (van Marken Lichtenbelt et al., 2009; Yoneshiro et al., 2011). However, since BAT decreases while WAT increases with age, attempts to make an unequivocal connection between these two age dependent tissues has been difficult. Establishing whether increased obesity is inversely associated with BAT in normal pediatric populations can have important implications that can lead to potential strategies to combat obesity and its comorbidities (Lee et al., 2011).
Summary
With the resurgent discovery of human BAT by PET/CT, new frontiers are now being pursued to study the modulation of this tissue during human growth and development and its involvement in regulating body metabolism, energy expenditure and body composition, especially in children and adolescents. These issues are of high relevance to public healthcare as the obesity epidemic affecting all ages across Western countries continues to spread. MRI represents the most suitable non-invasive imaging modality to overcome the limitations of PET/CT. MRI methods that can detect BAT based on intrinsic tissue morphology are minimally susceptible to environmental and extraneous confounding factors that have thus far restricted functional PET/CT. The demonstration of feasibility in employing such MRI methods in humans, particularly in pediatrics, will be the next major advancement. Progress in knowledge of human BAT physiology will come from MRI methodological developments that will allow the identification and quantification of both metabolically active and inactive BAT with high sensitivity and specificity.
Conflict of Interest Statement
The authors declare that the research was conducted in the absence of any commercial or financial relationships that could be construed as a potential conflict of interest.
Acknowledgments
The authors thank Michelle Smith and Nicole Warburton for research assistance, the National Institutes of Health for funding support (Hu – K25DK087931, Hu, Gilsanz – R21DK090778), and Thomas G. Perkins, Ph.D. from Philips Healthcare for MRI assistance. Funding Support: National Institutes of Health Gilsanz – R21DK090778, Hu – K25DK087931.
References
Au-Yong, I. T., Thorn, N., Ganatra, R., Perkins, A. C., and Symonds, M. E. (2009). Brown adipose tissue and seasonal variation in humans. Diabetes 58, 2583–2587.
Baba, S., Jacene, H. A., Engles, J. M., Honda, H., and Wahl, R. L. (2010). CT Hounsfield units of brown adipose tissue increase with activation: preclinical and clinical studies. J. Nucl. Med. 51, 246–250.
Branca, R. T., and Warren, W. S. (2011a). In vivo brown adipose tissue detection and characterization using water-lipid intermolecular zero-quantum coherences. Magn. Reson. Med. 65, 313–319.
Branca, R. T., and Warren, W. S. (2011b). In vivo NMR detection of diet-induced changes in adipose tissue composition. J. Lipid Res. 52, 833–839.
Bydder, M., Girard, O., and Hamilton, G. (2011). Mapping the double bonds in triglycerides. Magn. Reson. Imaging doi: 10.1016/j.mri.2011.07.004. [Epub ahead of print].
Cannon, B., and Nedergaard, J. (2004). Brown adipose tissue: function and physiological significance. Physiol. Rev. 84, 277–359.
Carter, B. W., and Schucany, W. G. (2008). Brown adipose tissue in a newborn. Proc. (Bayl. Univ. Med. Cent.) 21, 328–330.
Celi, F. S. (2009). Brown adipose tissue – when it pays to be inefficient. N. Engl. J. Med. 360, 1553–1556.
Cinti, S. (2006). The role of brown adipose tissue in human obesity. Nutr. Metab. Cardiovasc. Dis. 16, 569–574.
Cohade, C., Mourtzikos, K. A., and Wahl, R. L. (2003). “USA-Fat”: prevalence is related to ambient outdoor temperature-evaluation with 18F-FDG PET/CT. J. Nucl. Med. 44, 1267–1270.
Cypess, A. M., Lehman, S., Williams, G., Tal, I., Rodman, D., Goldfine, A. B., Kuo, F. C., Palmer, E. L., Tseng, Y. H., Doria, A., Kolodny, G. M., and Kahn, C. R. (2009). Identification and importance of brown adipose tissue in adult humans. N. Engl. J. Med. 360, 1509–1517.
Gelfand, M. J., O’Hara, S. M., Curtwright, L. A., and Maclean, J. R. (2005). Pre-medication to block 18F-FDG uptake in the brown adipose tissue of pediatric and adolescent patients. Pediatr. Radiol. 35, 984–990.
Gilsanz, V., Chung, S. A., Jackson, H., Dorey, F. J., and Hu, H. H. (2011). Functional brown adipose tissue is related to muscle volume in children and adolescents. J. Pediatr. 158, 722–726.
Hamilton, G., Bydder, M., Smith, D. L. Jr., Nayak, K. S., and Hu, H. H. (2011). Properties of brown and white adipose tissue measured by 1H MRS. J. Magn. Reson. Imaging 34, 468–473.
Himms-Hagen, J. (1989). Brown adipose tissue thermogenesis and obesity. Prog. Lipid Res. 28, 67–115.
Hu, H. H., Chung, S. A., Nayak, K. S., Jackson, H. A., and Gilsanz, V. (2011). Differential computed tomographic attenuation of metabolically active and inactive adipose tissues: preliminary findings. J. Comput. Assist. Tomogr. 35, 65–71.
Hu, H. H., Smith, D. L. Jr., Nayak, K. S., Goran, M. I., and Nagy, T. R. (2010a). Identification of brown adipose tissue in mice with fat-water IDEAL-MRI. J. Magn. Reson. Imaging 31, 1195–1202.
Hu, H. H., Smith, D. L. Jr., Goran, M. I., Nagy, T. R., and Nayak, K. S. (2010b). Characterization of brown adipose tissue in mice with IDEAL fat-water MRI. Proc. Int. Soc. Magn. Reson. Med. 18, 749.
Lee, P., Greenfield, J. R., Ho, K. K., and Fulham, M. J. (2010). A critical appraisal of the prevalence and metabolic significance of brown adipose tissue in adult humans. Am. J. Physiol. Endocrinol. Metab. 299, E601–E606.
Lee, P., Swarbrick, M. M., Ting, Z. J., and Ho, K. K. (2011). Inducible brown adipogenesis of supraclavicular fat in adult humans. Endocrinology. doi: 10.1210/en.2011-1349. [Epub ahead of print].
Lunati, E., Marzola, P., Nicolato, E., Fedrigo, M., Villa, M., and Sbarbati, A. (1999). In vivo quantitative lipidic map of brown adipose tissue by chemical shift imaging at 4.7 Tesla. J. Lipid Res. 40, 1395–1400.
Nisoli, E., Briscini, L., Tonello, C., De Giuli-Morghen, C., and Carruba, M. O. (1997). Tumor necrosis factor-alpha induces apoptosis in rat brown adipocytes. Cell Death Differ. 4, 771–778.
Pfannenberg, C., Werner, M. K., Ripkens, S., Stef, I., Deckert, A., Schmadl, M., Reimold, M., Haring, H. U., Claussen, C. D., and Stefan, N. (2010). Impact of age on the relationships of brown adipose tissue with sex and adiposity in humans. Diabetes 59, 1789–1793.
Rodriguez-Cuenca, S., Monjo, M., Frontera, M., Gianotti, M., Proenza, A. M., and Roca, P. (2007). Sex steroid receptor expression profile in brown adipose tissue: effects of hormonal status. Cell. Physiol. Biochem. 20, 877–886.
Romanatto, T., Roman, E. A., Arruda, A. P., Denis, R. G., Solon, C., Milanski, M., Moraes, J. C., Bonfleur, M. L., Degasperi, G. R., Picardi, P. K., Hirabara, S., Boschero, A. C., Curi, R., and Velloso, L. A. (2009). Deletion of tumor necrosis factor-alpha receptor 1 (TNFR1) protects against diet-induced obesity by means of increased thermogenesis. J. Biol. Chem. 284, 36213–36222.
Rothwell, N. J., and Stock, M. J. (1979). A role for brown adipose tissue in diet-induced thermogenesis. Nature 281, 31–35.
Rousseau, C., Bourbouloux, E., Campion, L., Fleury, N., Bridji, B., Chatal, J. F., Resche, I., and Campone, M. (2006). Brown fat in breast cancer patients: analysis of serial 18F-FDG PET/CT scans. Eur. J. Nucl. Med. Mol. Imaging 33, 785–791.
Saito, M., Okamatsu-Ogura, Y., Matsushita, M., Watanabe, K., Yoneshiro, T., Nio-Kobayashi, J., Iwanaga, T., Miyagawa, M., Kameya, T., Nakada, K., Kawai, Y., and Tsujisaki, M. (2009). High incidence of metabolically active brown adipose tissue in healthy adult humans: effects of cold exposure and adiposity. Diabetes 58, 1526–1531.
Salles, G., Bienvenu, J., Bastion, Y., Barbier, Y., Doche, C., Warzocha, K., Gutowski, M. C., Rieux, C., and Coiffier, B. (1996). Elevated circulating levels of TNFalpha and its p55 soluble receptor are associated with an adverse prognosis in lymphoma patients. Br. J. Haematol. 93, 352–359.
Sbarbati, A., Guerrini, U., Marzola, P., Asperio, R., and Osculati, F. (1997). Chemical shift imaging at 4.7 Tesla of brown adipose tissue. J. Lipid Res. 38, 343–347.
Seale, P., Bjork, B., Yang, W., Yang, W., Kajimura, S., Chin, S., Kuang, S., Scime, A., Devarakonda, S., Conroe, H. M., Erdjument-Bromage, H., Tempst, P., Rudnicki, M. A., Beier, D. R., and Spiegelman, B. M. (2008). PRDM16 controls a brown fat/skeletal muscle switch. Nature 454, 961–967.
van Marken Lichtenbelt, W. D., Vanhommerig, J. W., Smulders, N. M., Drossaerts, J. M., Kemerink, G. J., Bouvy, N. D., Schrauwen, P., and Teule, G. J. (2009). Cold-activated brown adipose tissue in healthy men. N. Engl. J. Med. 360, 1500–1508.
Virtanen, K. A., Lidell, M. E., Orava, J., Heglind, M., Westergren, R., Niemi, T., Taittonen, M., Laine, J., Savisto, N. J., Enerback, S., and Nuutila, P. (2009). Functional brown adipose tissue in healthy adults. N. Engl. J. Med. 360, 1518–1525.
Warzocha, K., Salles, G., Bienvenu, J., Bastion, Y., Dumontet, C., Renard, N., Neidhardt-Berard, E. M., and Coiffier, B. (1997). Tumor necrosis factor ligand-receptor system can predict treatment outcome in lymphoma patients. J. Clin. Oncol. 15, 499–508.
Yoneshiro, T., Aita, S., Matsushita, M., Okamatsu-Ogura, Y., Kameya, T., Kawai, Y., Miyagawa, M., Tsujisaki, M., and Saito, M. (2011). Age-related decrease in cold-activated brown adipose tissue and accumulation of body fat in healthy humans. Obesity (Silver Spring) 19, 1755–1760.
Zingaretti, M. C., Crosta, F., Vitali, A., Guerrieri, M., Frontini, A., Cannon, B., Nedergaard, J., and Cinti, S. (2009). The presence of UCP1 demonstrates that metabolically active adipose tissue in the neck of adult humans truly represents brown adipose tissue. FASEB J. 23, 3113–3120.
Keywords: brown adipose tissue, PET/CT, Hounsfield units, children, MRI, muscle, puberty, white adipose tissue
Citation: Hu HH and Gilsanz V (2011) Developments in the imaging of brown adipose tissue and its associations with muscle, puberty, and health in children. Front. Endocrin. 2:33. doi: 10.3389/fendo.2011.00033
Received: 19 July 2011; Paper pending published: 17 August 2011;
Accepted: 31 August 2011; Published online: 22 September 2011.
Edited by:
Patrick Seale, University of Pennsylvania, USAReviewed by:
Marta Letizia Hribal, University of Catanzaro Magna Graecia, ItalyJenny Tong, University of Cincinnati, USA
Copyright: © 2011 Hu and Gilsanz. This is an open-access article subject to a non-exclusive license between the authors and Frontiers Media SA, which permits use, distribution and reproduction in other forums, provided the original authors and source are credited and other Frontiers conditions are complied with.
*Correspondence: Vicente Gilsanz, Department of Radiology, Children’s Hospital of Los Angeles, 4650 Sunset Boulevard, MS #81, Los Angeles, CA 90027, USA. e-mail: vgilsanz@chla.usc.edu