 Mohammed Akli Ayoub1,2,3,4,5*
 Flavie Landomiel1,2,3,4
 Nathalie Gallay1,2,3,4Gwenhael Jégot1,2,3,4
 Anne Poupon1,2,3,4
 Pascale Crépieux1,2,3,4
 Eric Reiter1,2,3,4
- 1Biologie et Bioinformatique des Systèmes de Signalisation (BIOS) Group, INRA, UMR85, Unité Physiologie de la Reproduction et des Comportements, Nouzilly, France
- 2CNRS, UMR7247, Nouzilly, France
- 3Université François Rabelais, Tours, France
- 4L’Institut français du cheval et de l’équitation (IFCE), Nouzilly, France
- 5LE STUDIUM ® Loire Valley Institute for Advanced Studies, Orléans, France
Gonadotropin receptors belong to the super family of G protein-coupled receptors and mediate the physiological effects of follicle-stimulating hormone (FSHR) and luteinizing hormone (LHR). Their central role in the control of reproductive function has made them the focus of intensive studies. Upon binding to their cognate hormone, they trigger complex signaling and trafficking mechanisms that are tightly regulated in concentration, time, and space. Classical cellular assays often fail to capture all these dynamics. Here, we describe the use of various bioluminescence and fluorescence resonance energy transfer (BRET and FRET) assays to investigate the activation and regulation of FSHR and LHR in real-time, in living cells (i.e., transiently expressed in human embryonic kidney 293 cells). Indeed, the dynamics of hormone-mediated heterotrimeric G protein activation, cyclic adenosine-monophosphate (cAMP) production, calcium release, β-arrestin 2 recruitment, and receptor internalization/recycling was assessed. Kinetics and dose–response analyses confirmed the expected pharmacological and signaling properties of hFSHR and hLHR but revealed interesting characteristics when considering the two major pathways (cAMP and β-arrestin 2) of the two receptors assessed by BRET. Indeed, the EC50 values were in picomolar range for cAMP production while nanomolar range was observed for β-arrestin 2 recruitment as well as receptor internalization. Interestingly, the predicted receptor occupancy indicates that the maximal G protein activation and cAMP response occur at <10% of receptor occupancy whereas >90% of activated receptors is required to achieve full β-arrestin 2 recruitment and subsequent receptor internalization. The rapid receptor internalization was also followed by a recycling phase. Collectively, our data reveal that β-arrestin-mediated desensitization, internalization, and the subsequent fast recycling of receptors at the plasma membrane may provide a mechanistic ground to the “spare receptor” paradigm. More generally, the novel tools described here will undoubtedly provide the scientific community investigating gonadotropin receptors with powerful means to decipher their pharmacology and signaling with the prospect of pathophysiological and drug discovery applications.
Introduction
The gonadotropin receptors play a central role in the control of mammal reproduction by mediating the physiological responses of the two major pituitary glycoprotein hormones, follicle-stimulating hormone (FSH) and luteinizing hormone (LH). Their respective receptors, follicle-stimulating hormone receptor (FSHR) and luteinizing hormone receptor (LHR), are mainly expressed in the gonads where they control the ovarian and testicular functions in females and males, respectively, by regulating both steroidogenesis and gametogenesis (1, 2). Both FSHR and LHR belong to a subgroup of class A (rhodopsin-like) G protein-coupled receptors (GPCRs) characterized by the presence of multiple leucine-rich repeats (LRRs) in their extracellular amino-terminal domain. This subgroup also includes the thyroid-stimulating hormone receptor (TSHR) and the receptors for the peptidic hormone relaxin and INSL3 (RXFP1 and 2). The LRRs containing region in FSHR has been shown to be determinant for its interaction with FSH (3–5). In terms of the intracellular signaling, FSHR and LHR are known to mediate the canonical G protein-mediated signaling pathway through coupling to heterotrimeric Gαs proteins, which activates the adenylate cyclase, resulting in an increase in intracellular cyclic adenosine-monophosphate (cAMP) levels and activation of protein kinase A (PKA) as well as the exchange protein directly activated by cAMP (EPAC). This in turn triggers the activation of multiple downstream kinases that modulate the nuclear activity of cAMP response element-binding protein (CREB) and the expression of the genes involved in the physiological responses of the gonadotropins. However, recent evidences point to a multiplicity of the signaling that can be mediated by FSHR and LHR by engaging additional G protein-dependent and independent pathways [for review, see Ref. (6–9)], including β-arrestin-dependent pathways (10–13). As a consequence, similar to most other GPCRs, these receptors’ pharmacology and signaling involve highly diverse and complex mechanisms. Therefore, the use of recent innovative technologies to investigate these receptors could certainly help understanding better their activation mode.
Among the emerging methods to study GPCRs, the focus is on energy transfer-based assays that rely on the biophysical bioluminescence and fluorescence resonance energy transfer (BRET and FRET) technologies. These approaches link the concept of distance/proximity, in space and time, between an energy donor and an energy acceptor to the biological question of interest according to Förster’s Law in both static and dynamic configurations (14–16). Since their development, BRET and FRET have been extensively used to study different cellular and molecular aspects related to the function and regulation of cell surface receptors, such as GPCRs and tyrosine kinase receptors (TKRs) (17, 18). In fact, GPCRs constitute the research field of choice where BRET/FRET are elegantly used and are being the subject of permanent development and improvement (16, 19–21). Indeed, by using BRET and FRET, it is now possible to quantitatively address, in real-time and live cells, different questions about the functioning of GPCRs including ligand binding, receptor activation, G protein coupling, intracellular downstream signaling, β-arrestin recruitment, receptor trafficking, and oligomerization (16, 19–26). In this context, BRET and FRET significantly contributed to major recent advances in the field with the emergence of new concepts, such as receptor heteromerization, receptor/G protein preassembly, and biased signaling. Even though these advances further illustrate the complexity of the GPCR functioning, they pushed the scientific community one step further in understanding better the involvement of GPCRs in physiology and pathophysiology. However, the application of BRET and FRET approaches to the gonadotropin receptors has remained limited to date. In this study, we report the application of a series of novel BRET and FRET assays to study the activation and regulation of the human gonadotropin receptors, hFSHR and hLHR/hCGR (here designed as hLHR), when they are transiently expressed in HEK 293 cells. Kinetics and dose–response analyses using various assays were performed in 96- and 384-well formats in real-time and live cells.
Materials and Methods
Materials and Plasmid Constructions
The plasmid encoding human FSHR was generated as previously described (12). The other plasmids encoding the different BRET/FRET sensors and fusion proteins were generously provided as follows: hLHR from A. Ulloa-Aguirre (Universidad Nacional Autónoma de México, México, Mexico), different Rluc8- and Venus-fused G proteins from J. P. Pin (Functional Genomics Institute, Montpellier, France) and K. D. Pfleger (Harry Perkins Institute of Medical Research, Perth, WA, Australia) (also hV2R–Rluc8), Rluc8-fused hFSHR and hLHR from A. Hanyaloglu (Imperial College, London, UK), yPET-β-arrestin 2 from M. G. Scott (Cochin Institute, Paris, France), Aequorin-GFP from B. Lambolez (Pierre et Marie Curie University, Paris, France), CAMYEL from L. I. Jiang (University of Texas, TX, USA), ICUE from J. Zhang (The Johns Hopkins University, Baltimore, MD, USA), and Venus-KRas from N. A. Lambert (Georgia Health Sciences University, Augusta, GA, USA). Recombinant hFSH was kindly gifted by Merck-Serono (Darmstadt, Germany), hCG was kindly donated by Y. Combarnous (CNRS, Nouzilly, France), forskolin and DDAVP were purchased from Sigma-Aldrich (St. Louis, MO, USA). All the 96- and 384-well white microplates were from Greiner Bio-One (Courtaboeuf, France). Coelenterazine h substrate was purchased from Interchim (Montluçon, France).
Cell Culture and Transfection
HEK 293 cells were grown in complete medium (DMEM supplemented with 10% (v/v) fetal bovine serum, 4.5 g/l glucose, 100 U/ml penicillin, 0.1 mg/ml streptomycin, and 1 mM glutamine) (all from Invitrogen, Carlsbad, CA, USA). Transient transfections were performed by reverse transfection in 96-well plates using Metafectene PRO (Biontex, München, Germany) following the manufacturer’s protocol. Briefly, for each well, the different combinations of coding plasmids were used as follows: 200 ng of total plasmid per well were resuspended in 25 μl of serum-free DMEM and mixed with Metafectene PRO (0.5 μl/well) previously preincubated 5 min at room temperature in 25 μl serum-free DMEM (2 × 25 μl/well). Then the two solutions of serum-free DMEM-containing plasmids and Metafectene PRO were mixed and incubated for 20 min at room temperature. Cells (105 in 200 μl/well) in DMEM supplemented with 10% FCS were then incubated with the final plasmid-Metafectene PRO mix (50 μl/well). Transfection efficiency was typically in the 60–70% range and the correct expression of the different fusion proteins used for BRET and FRET was examined by fluorescence and luminescence measurements using a Mithras LB 943 plate reader (Berthold Technologies GmbH and Co. Wildbad, Germany).
BRET Measurements
Forty-eight hours after transfection, cells were washed with PBS and BRET measurements were performed depending on the experiments as described previously (27). For the endpoint dose–response analysis, cells were first preincubated 30 min at 37°C in 40 μl/well of PBS 1×, HEPES 5 mM, 200 μM IBMX (for cAMP assays) containing or not increasing concentrations of hFSH or hCG as indicated. Then BRET measurements were performed upon addition of 10 μl/well of coelenterazine h (5 μM final) using a Mithras LB 943 plate reader. For the real-time BRET kinetics, cells were first resuspended in 60 μl/well of PBS-HEPES 10 mM (+IBMX 200 μM for cAMP assays) and then BRET measurements were immediately performed upon addition of 10 μl/well of coelenterazine h (5 μM final) and 10 μl/well of the sub-maximal concentrations of hFSH or hCG (fivefold concentrated).
Calcium Measurements Using Aequorin-GFP
Forty-eight hours after transfection, cells co-expressing hFSHR and aequorin-GFP (AEQ-GFP) were incubated for 3 h with 40 μl/well of coelenterazine h substrate (5 μM final) in PBS 1×, HEPES 10 mM, BSA 0.1%, in the dark, and at 37°C to allow aequorin reconstitution. Luminescence emission at 480 and 540 nm was then measured in each well individually every 0.05 s before and after the rapid injection of 10 μl/well of hFSH (fivefold concentrated) or of vehicle, using the injection system and the dual emission detection of a Mithras LB 943 plate reader.
cAMP Accumulation Measured by HTRF®
Intracellular cAMP levels were measured using a homogeneous time-resolved fluorescence (HTRF®) cAMP dynamic 2 assay kit (CisBio Bioassays, Bagnol sur Cèze, France) (28). Forty-eight hours post-transfection cells were detached and seeded into white 384-well microplates with 5,000 cells/well in 5 μl of stimulation buffer (PBS 1×, 200 μM IBMX, 5 mM HEPES, 0.1% BSA). For their stimulation, 5 μl/well of the stimulation buffer containing or not different doses of hFSH and hCG as indicated were added. Then, cells were incubated for 30 min at 37°C and then lysed by addition of 10 μl/well of the supplied conjugate-lysis buffer containing d2-labeled cAMP and Europium cryptate-labeled anti-cAMP antibody, both reconstituted according to the manufacturer’s instructions. Plates were incubated for 1 h in the dark at room temperature and time-resolved fluorescence signals were measured at 620 and 665 nm, respectively, 50 ms after excitation at 320 nm using a Mithras LB 943 plate reader.
cAMP Accumulation Measured by Microscopic FRET Assay
Forty-eight hours after transfection, cells co-expressing the cAMP sensor (ICUE) with either hFSHR or hLHR were plated in imaging dishes and imaged in the dark at 37°C on a temperature-controlled stage using a Leica DM IRB (Leica Microsystems) microscope with a CoolSnap fx cooled charge-coupled device camera (Ropper Scientific) controlled by METAFLUOR 7.5 (Universal Imaging Corporation, Downingtown, PA, USA). Dual emission ratio imaging was carried out using a 436DF10 excitation filter, a 436–510 DBDR dichroic mirror, and 480-AF30 and 550-AF30 emission filters for CFP and YFP, respectively. Exposure time was 400 ms and images were taken every 30 s. Typically, equal sensor-positive cells and non-specific areas were chosen in the field of the microscope. The evolution of fluorescence was recorded individually in each area for the whole duration of the experiments. Several independent plates were analyzed according to this procedure, and the specific FRET signal of each cell (positive minus negative area) was pooled. Cells displaying a whole range of intensities were selected and analyzed without any impact of the expression level of the sensor on the responsiveness being noticed. After 5 min of baseline measurement, cells were stimulated with either 1 nM of hFSH or hCG, and 1 μM of forskolin was added as a positive control after 20 min of stimulation. A low hormone dose has been chosen in order to avoid saturation of the ICUE sensor, which has a limited dynamic range compared to BRET assays. Fluorescent intensity of non-specific areas was subtracted to the intensity of fluorescent cells expressing the sensor in order to quantify the specific signal. The FRET ratio (CFP/YFP) was calculated for each individual cell. Data represent the mean ± SEM of at least 20 individual cell responses measured in three independent experiments.
β-arrestin Recruitment Assessed by TANGO Assay
This assay was carried out as previously described by Barnea et al. (29). We generated HTLA cells (HEK293T-derived cell line containing a stably integrated tTA-dependent firefly luciferase reporter gene) stably expressing FSHR/AVPR2-CT chimera, and β-arrestin 2-TEV fusion protein. Growing HTLA hFSHR cells were plated in white 96-well assay plates at 4 × 10⁴ cells per well in MEM, supplemented with 10% FBS, glutamine, and antibiotic cocktail. Twenty-four hours after plating, increasing concentrations of hFSH were added and cells were cultured for 14–20 h before measuring reporter gene activity. Luciferase activity was determined by using the Bright-Glo luciferase assay system (Promega, Charbonnieres, France), following the manufacturer’s protocol, and using a POLARstar OPTIMA luminometer (BMG Labtech, Ortenberg, Germany).
Data Analysis
Bioluminescence resonance energy transfer data are represented either as 480 nm/540 nm (ICUE sensor), 540 nm/480 nm (β-arrestin and internalization kinetics), or as hFSH/hCG-induced BRET changes by subtracting the ratio 540 nm/480 nm of luminescence in a well of PBS-treated cells from the same ratio in wells where the cells were treated with hFSH or hCG. In this calculation, only ligand-induced BRET changes (increase or decrease) are represented and the PBS-treated cell sample represents the background eliminating the requirement for measuring an Rluc-only control sample since fast kinetics and dose–response analyses were performed. Kinetic and dose–response curves were fitted following the appropriate non-linear regression equations using Prism GraphPad software (San Diego, CA, USA). Statistical analyses were performed using two-way ANOVA included in Prism GraphPad software.
Results
Receptor-Mediated cAMP Production
First, we examined cAMP response by hFSHR and hLHR since they are both known to couple to heterotrimeric Gs protein, leading to adenylyl cyclase activation and ultimately to an increase in the intracellular cAMP levels. To this end, we used the BRET-based cAMP sensor, CAMYEL, developed by Jiang et al. (30) (Figure 1A), which allows the assessment of intracellular cAMP changes in real-time and live cells. Under basal conditions, a high-BRET signal occurs between the donor (Renilla luciferase or Rluc) and the acceptor (green fluorescent protein or GFP) due to the favorable conformation and proximity/orientation of the Rluc and GFP within the Epac motif composing the sensor. In contrast, an increase in the cytosolic cAMP concentrations and its binding to Epac induce changes in the conformation of Rluc-Epac-GFP sensor, resulting in a significant decrease in the BRET signal (Figure 1A). The receptors were transiently co-expressed with CAMYEL in HEK 293 cells and real-time kinetics were conducted (Figures 1B,C) at different doses allowing the inference of sigmoidal dose–response curves (Figures 1D,E). Kinetic analyses showed a relatively fast cAMP response (t1/2 of 3.2 and 1.7 min for FSHR and LHR, respectively) (Table 1) upon stimulation with 5 nM of gonadotropins with a plateau reached after ~10 min for both hFSHR (Figure 1B) and hLHR (Figure 1C). As expected, both hormones, hFSH (Figure 1D) and hCG (Figure 1E), showed very potent effects on their specific receptors with EC50 values in the picomolar range (Table 1). Similar results were obtained using HTRF®-based cAMP assay (28) on both hFSHR (Figure 1F) and hLHR (Figure 1G) either wildtype or Rluc8-fused receptors. This indicates that both Rluc8-fused receptors retained correct expression and function and can therefore be used in BRET assays for the recruitment of β-arrestin 2 and receptor internalization (Figures 5 and 6).
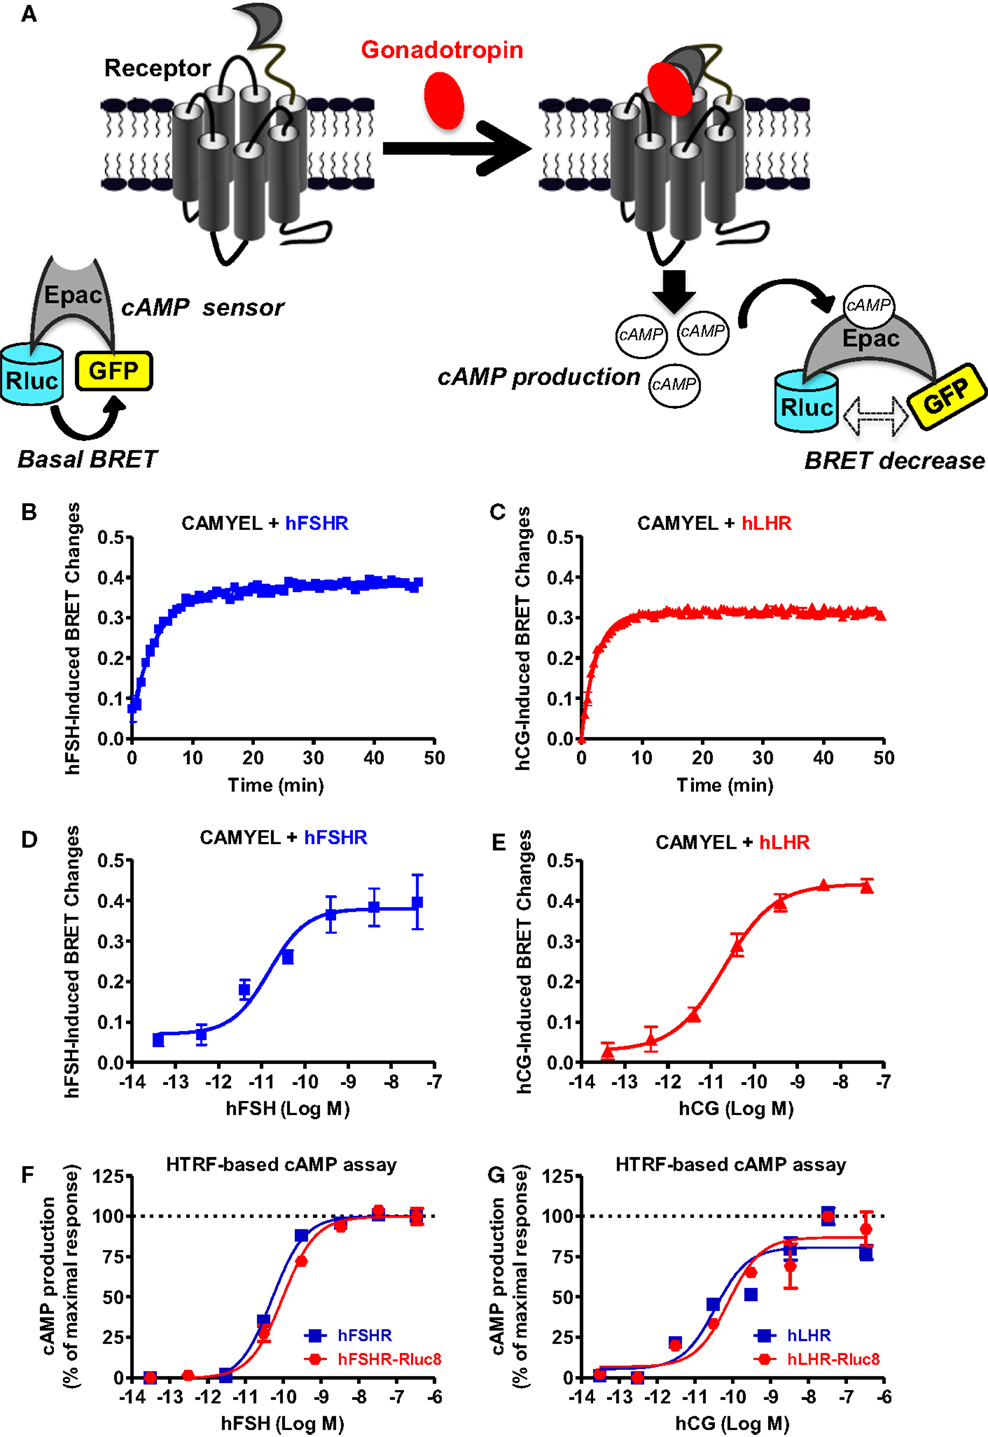
Figure 1. BRET- and HTRF-based cAMP production assays. (A) Principle of the BRET-based cAMP assay (CAMYEL sensor). HEK 293 cells transiently expressing the indicated proteins (wildtype receptors and CAMYEL for BRET; wildtype or Rluc8-tagged receptors for HTRF) were stimulated with either 5 nM (for kinetics) or increasing concentrations (for dose–response curves) of hFSH (B,D,F) or hCG (C,E,G) as indicated. Then BRET and HTRF measurements format were performed as described in the Section “Materials and Methods” in 96-well and 384-well plates, respectively. Data are means ± SEM of three experiments performed either in a single point or triplicate.
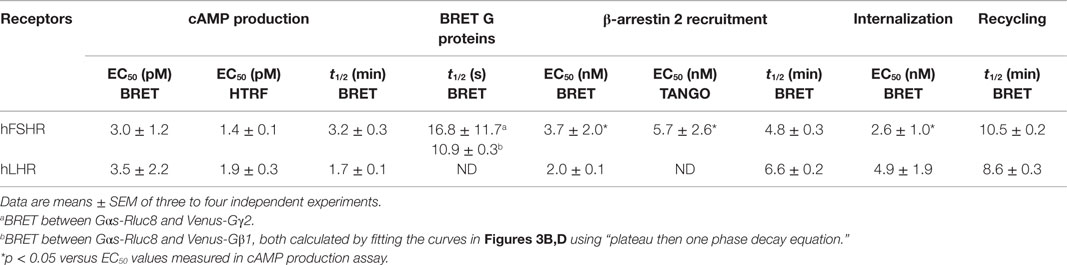
Table 1. EC50 and t1/2 values for gonadotropin-promoted cAMP production, β-arrestin 2 recruitment and receptor internalization/recycling of hFSHR and hLHR.
We also used a FRET-based cAMP sensor (ICUE) allowing real-time measurements of cAMP production as previously shown (31) (Figure 2A) using both real-time FRET measurements in 96-well plate format every 0.5 s as well as individual cell analysis with the appropriate fluorescence microscopy setting. The 96-well plate format clearly allowed to measure very rapid changes in the FRET signals in cells co-expressing ICUE and hFSHR and challenged with 1 μM of forskolin (Figure 2B) or 5 nM of hFSH (Figure 2C). These changes were specific to hFSH/forskolin-induced cAMP production since vehicle injection did not induce any change in the FRET signal (Figure 2D). In parallel, the FRET analysis by fluorescence microscopy on individual stimulated cells co-expressing ICUE and either hFSHR or hLHR showed a time-dependent increase of cAMP production induced by 1 nM of hFSH or hCG, respectively, as well as 1 μM of forskolin (Figure 2E), as previously reported (12).
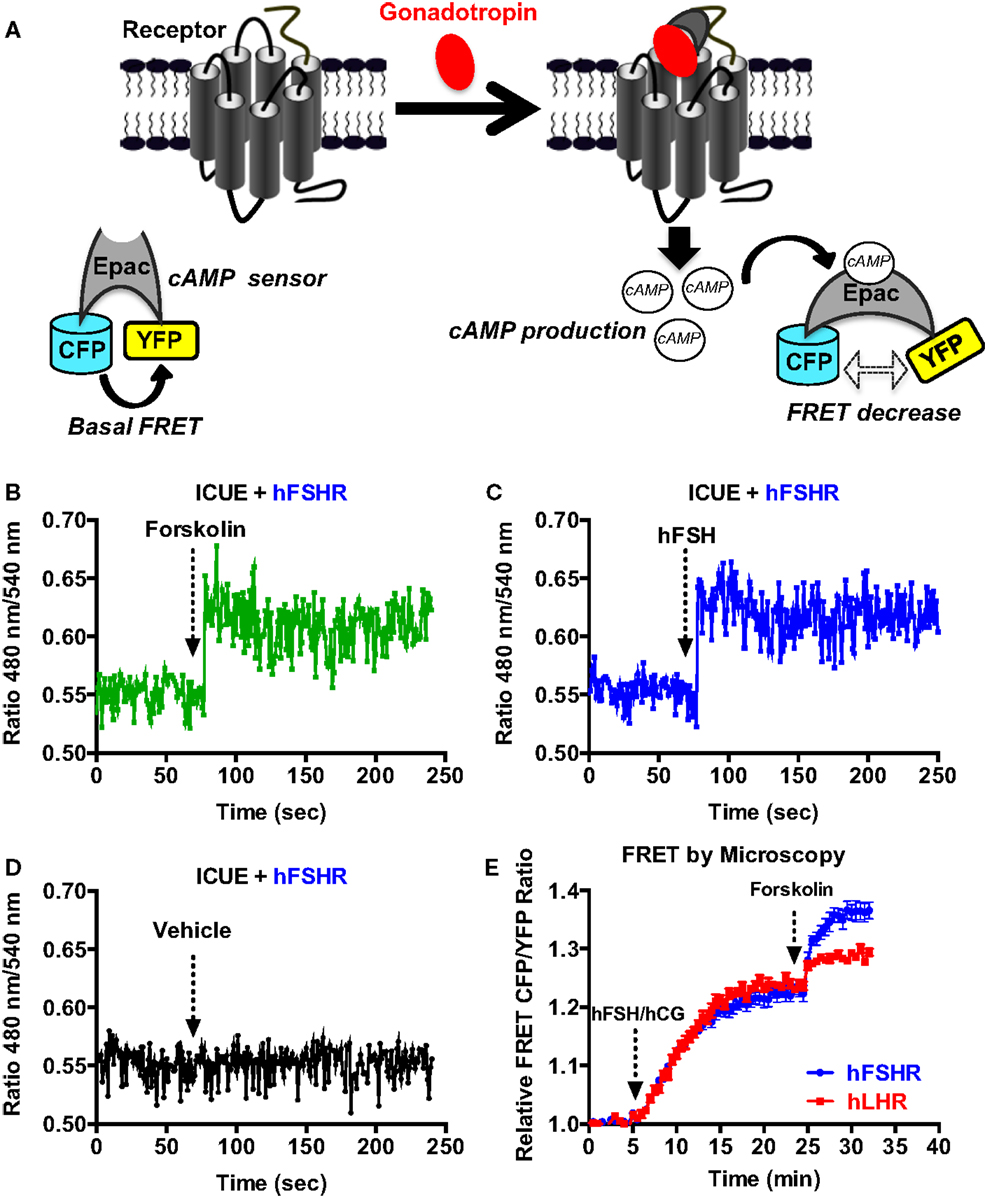
Figure 2. FRET-based cAMP production assays. (A) Principle of the FRET-based cAMP assay (ICUE sensor). HEK 293 cells transiently co-expressing ICUE sensor with either hFSHR or hLHR (E) were used for FRET measurements using either 96-well format (B–D) or microscopy on individual cells (E). Cells were stimulated with either 1 μM of forskolin (B,E), 5 nM of hFSH (C), 1 nM of hFSH or hCG (E), or vehicle (D) as indicated. Then FRET measurements were performed as described in the Section “Materials and Methods.” Data are representative of three independent experiments performed in single points (B–D) or 16 individual cells (E).
Receptor-Gαs Protein Coupling Assessed by BRET
Next, we examined the functional coupling of hFSHR and hLHR to the heterotrimeric G protein (Gαs and Gβγ) in real-time and live cells by measuring BRET changes between the different G protein subunits as previously reported (27, 32–36). In this assay, a change (in this case a decrease) in the proximity/association between the Gα subunit and Gβγ dimer as well as their conformation upon receptor activation is assessed in time-dependent manner reflecting the functional coupling of the receptor with its cognate heterotrimeric G protein (Figure 3A). Gαs-Rluc8 was transiently co-expressed with either Venus-Gγ2 (Figures 3B,C) or Venus-Gβ1 (Figures 3D,E) in the presence of hFSHR or hLHR as indicated. BRET changes were then rapidly assessed every 0.5 s before and after receptor activation by the injection of 10 nM of hFSH or hCG. As shown, hFSH nicely induced a very rapid and significant BRET decrease between Gαs-Rluc8 and Venus-Gγ2 (Figure 3B) and Venus-Gβ1 (Figure 3D) co-expressed with hFSHR. Similar albeit noisier effects were observed with 10 nM of hCG on BRET between Gαs-Rluc8 and Venus-Gγ2 (Figure 3C) and Venus-Gβ1 (Figure 3E) in the context of hLHR expressing cells. Such BRET changes likely reflect the activation of Gαs protein by the hFSHR and hLHR and are consistent with the cAMP measurements shown in Figures 1 and 2. Our data are consistent with the previous BRET data reported for other GPCRs, showing a decrease of the BRET signals between Gαs and Gβ/γ subunits (32, 33, 35, 36). As expected, the observed kinetics with these sensors was much faster than the one measured for cAMP (i.e., t1/2 between 10 and 16 s) (Table 1).
Figure 3. G protein activation assessed by BRET. (A) Principle of the BRET-based G protein assay. HEK 293 cells transiently co-expressing the indicated Rluc8- and Venus-fused G protein subunits with either hFSHR (B,D) or hLHR (C,E) were used for BRET measurements using 96-well format performed before and after injection of 10 nM hFSH or hCG as described in the Section “Materials and Methods.” Data are representative of three independent experiments performed in single points.
Receptor-Mediated Calcium Release
We also assessed the intracellular calcium release mediated by the activation of gonadotropin receptors as previously reported (37, 38). For this, we used an aequorin-dependent calcium assay (AEQ-GFP) based on luminescence and BRET increase upon binding of calcium to the aequorin protein fused to GFP (39, 40) (Figure 4A). In the presence of calcium, aequorin emits luminescence at 480 nm part of which is transferred to GFP due to their sufficient proximity leading to GFP excitation and light emission at 540 nm. As shown in Figure 4B, in cells co-expressing AEQ-GFP and hFSHR, a significant and rapid increase in light emission at 540 nm occurred upon cell stimulation with 10 nM of hFSH (Figure 4B) indicating intracellular calcium increase. However, in cells co-expressing AEQ-GFP and hLHR, a significant basal emission at 540 nm was observed and stimulation with 10 nM hCG only induced weaker response (Figure 4C) as compared to hFSH on its receptor (Figure 4B). Such an effect was specific to gonadotropins since no increase in light emission was observed in AEQ-GFP and hFSHR co-expressing cells upon vehicle injection (Figure 4D) and the hFSH-promoted luminescence increase was dose-dependent (Figure 4E). Moreover, no significant light emission was measured in cells expressing AEQ-GFP alone and stimulated with 10 nM of hFSH (data not shown).
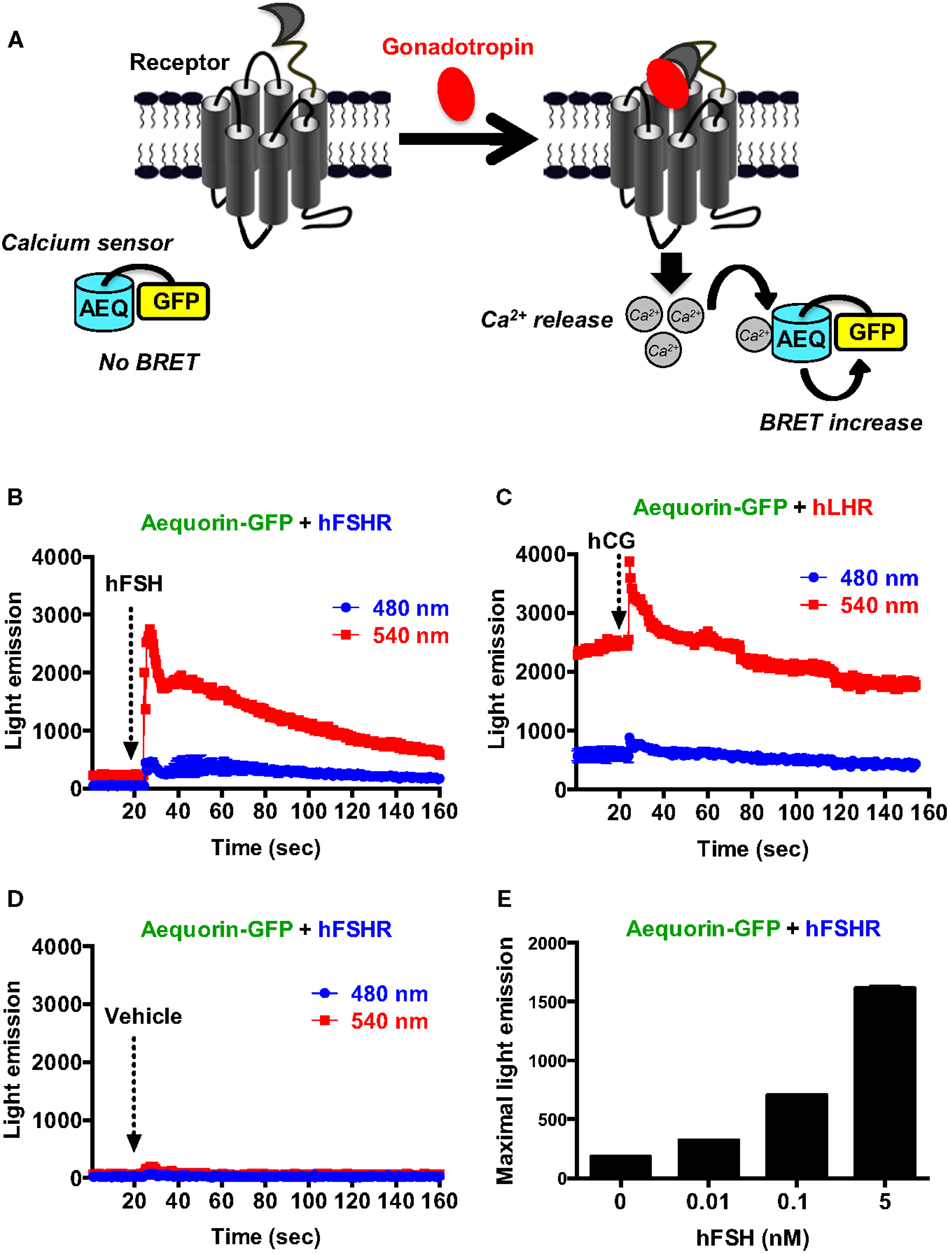
Figure 4. BRET-based calcium assay. (A) Principle of the BRET-based calcium assay. HEK 293 cells transiently co-expressing the AEQ-GFP sensor with either hFSHR (B,D,E) or hLHR (C) were used for light emission measurements using 96-well format before and after injection of vehicle (D) 10 nM hFSH or hCG or various doses of hFSH (E) as described in the Section “Materials and Methods.” Data are representative of three independent experiments performed in single points.
Recruitment of β-arrestin 2 Assessed by BRET
The role of β-arrestins not only in desensitization/internalization but also in signaling of GPCRs is now well established (41–43) and this has been previously reported for the FSHR (10, 11, 13, 44) and LHR (45). Here, we examined for the first time the recruitment of β-arrestins to activated hFSHR and hLHR in real-time and live cells using BRET technology as illustrated in Figure 5A. Indeed, under the inactive conformation of the receptors, β-arrestins are mostly cytosolic. Upon activation, the receptors are phosphorylated by G protein-coupled receptor kinases (GRKs) leading to the translocation of β-arrestins from the cytosol to the intracellular domains of the receptors triggering their desensitization, internalization, and signaling. The BRET increase between the receptors and β-arrestins is used to assess this process in real-time and living cells. For this purpose, the receptors were fused to BRET donor (Receptor-Rluc8) and co-expressed with β-arrestin 2 fused to BRET acceptor (here yPET as a GFP variant) and the translocation of β-arrestin 2 to the receptor was then measured before and after receptor activation (Figure 5A). The functionality of FSHR-Rluc8 and hLHR-Rluc8 is verified by the cAMP assay shown in Figures 1F,G. Dose–response and kinetics experiments were carried out in cells co-expressing yPET-β-arrestin 2 and either hFSHR-Rluc8 (Figures 5B,E) or hLHR-Rluc8 (Figures 5C,F). Real-time kinetic analyses showed a significant BRET increase over the basal signal with hFSHR-Rluc8 (Figure 5B) or hLHR-Rluc8 (Figure 5C) and yPET-β-arrestin 2 upon stimulation with 10 nM of hFSH or hCG, respectively. The BRET increase occurred in a time-dependent manner with a sustained plateau reached after 20–30 min of receptor activation indicating a class B profile according to the common GPCR classification with respect to β-arrestin association (46). We used the human vasopressin V2 receptor (hV2R–Rluc8) as a prototype for class B GPCR in our BRET assay and observed a similar kinetic profile compared to hFSHR and hLHR (Figure 5D). Moreover, the effects were dose-dependent for both hFSH (Figure 5E) and hCG (Figure 5F) on their respective receptors with EC50 values largely higher (i.e., nanomolar range) than those observed for cAMP signaling (Figure 1; Table 1). Such shift in the hormone potencies is not due to the effect of fusion of the receptors with Rluc8 since these constructs showed cAMP responses similar to that observed with their corresponding wild type receptors (Figures 1F,G). Moreover, dose–response experiments were also performed using an indirect TANGO assay on hFSHR bearing the vasopressin receptor 2 (V2R) C-terminus and showed similar potency of hFSH on hFSHR/β-arrestin 2 association as assessed by BRET (Figure 5G).
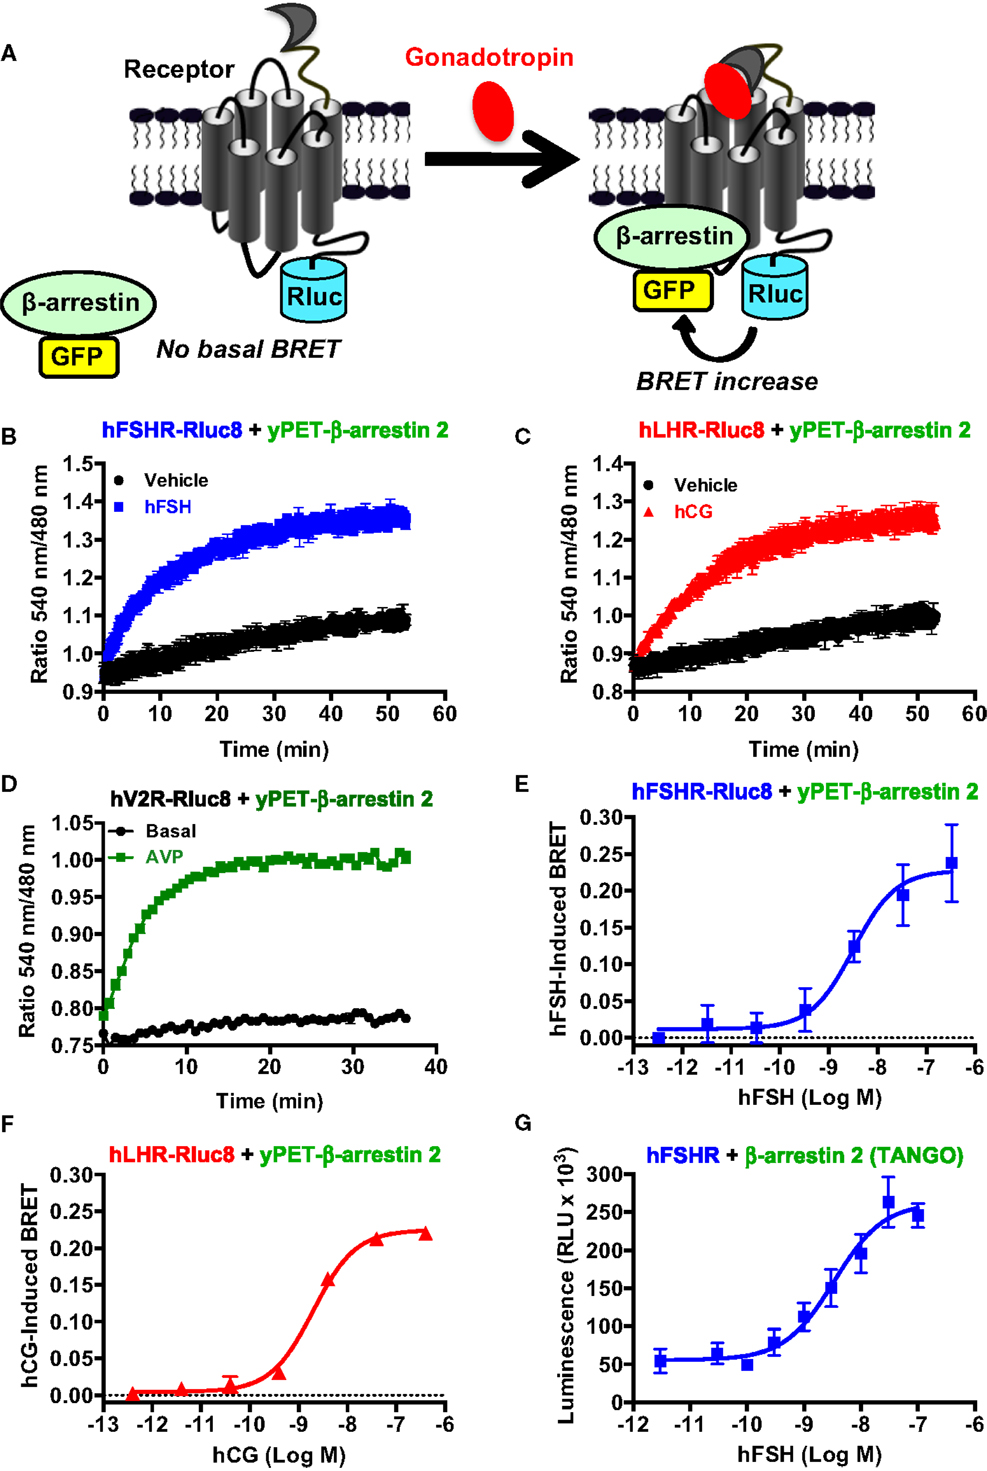
Figure 5. β-arrestin 2 recruitment assessed by BRET. (A). Principle of the BRET-based β-arrestin assay. HEK 293 cells transiently co-expressing yPET-β-arrestin 2 with either hFSHR-Rluc8 (B,E,G), hLHR-Rluc8 (C,F) or hV2R–Rluc8 (D) were used for BRET measurements in 96-well format using both real-time kinetics under basal (vehicle) and stimulated conditions in the presence of 10 nM of hormones (B,C) and endpoint signal recording after 30 min of stimulation with increasing hormone concentrations (D–F) as described in the Section “Materials and Methods.” In parallel, hFSHR/β-arrestin 2 association was also assessed in dose-dependent way using TANGO assay in 384-well format (G). Data are means ± SEM of three to four independent experiments performed in triplicate points.
Receptor Internalization and Recycling Assessed by BRET
Finally, we examined gonadotropin-induced receptor internalization in real-time and live cells using BRET between the Rluc8-tagged receptors (BRET donor) and a plasma membrane marker, KRas, fused to BRET acceptor (Venus, another GFP variant), as recently described (47). This assay is based on the changes in the physical proximity between KRas and the receptors at the plasma membrane upon receptor activation and thereby internalization as illustrated in Figure 6A. The agonist-induced decrease in the high basal BRET signals was assessed in cells co-expressing Venus-KRas with either hFSHR-Rluc8 or hLHR-Rluc8 (Figure 6A). We observed a very rapid decrease in the BRET signal between hFHSR-Rluc8 and Venus-KRas following cell stimulation with 10 nM of hFSH to reach the maximal decrease up to 2–5 min post-stimulation, indicating the rapid internalization of hFSHR under our conditions (Figure 6B). Interestingly, we observed a recovery phase of the BRET signal after 5–10 min of stimulation, which returns back to the basal level after 20 min suggesting recycling of the internalized receptors (Figure 6B). To confirm this observation on both hFSHR and hLHR, we performed time-course analysis where cells were first preincubated with hFSH or hCG at different times at 37°C before BRET signals were measured. The BRET measurements showed a maximal internalization of both receptors after 2–5 min and a total recovery of the BRET signals after 20 min (Figure 6C). Interestingly, the recovery phase continued to increase after 30 min to reach maximal BRET signals even higher than the basal levels after 45–60 min (Figure 6C), suggesting the recycling of the internalized receptors and/or the recruitment of an intracellular pool of receptors. Such behavior was specific to hFSHR and hLHR, since it was not observed for the human vasopressin 2 receptor (hV2R–Rluc8) activated with 1 μM of AVP (Figure 6C). In fact, these data are consistent with a delayed internalization (maximum after 30 min) and absence of recycling to the plasma membrane after internalization as it is well documented for V2R (48–50). Moreover, in order to estimate the kinetic parameter of the receptor recycling, we normalized the part of the curves corresponding to the recovery phase of hFSHR and hLHR shown in Figure 6C by taking 0 and 100% of the maximal BRET changes measured after 2 (maximal internalization) and 60 min of stimulation (maximal recycling), respectively (Figure 6D). As a result, both receptors recycled with similar kinetics with a half-time of about 10 min (Table 1), indicating that the recycling of hFSHR and hLHR was slower than their internalization, at least in our system. Finally, we performed BRET dose–response experiments after 5 min of stimulation showing the decrease in the BRET signals between Rluc8-tagged receptors and Venus-KRas in a dose-dependent manner with no significant differences between the two receptors (Figure 6E). It is worth noting that the potencies of hFSH and hCG on receptor internalization were similar to that observed for the recruitment of β-arrestin 2 (Figures 5D,E; Table 1), consistent with the notion that both events may be linked.
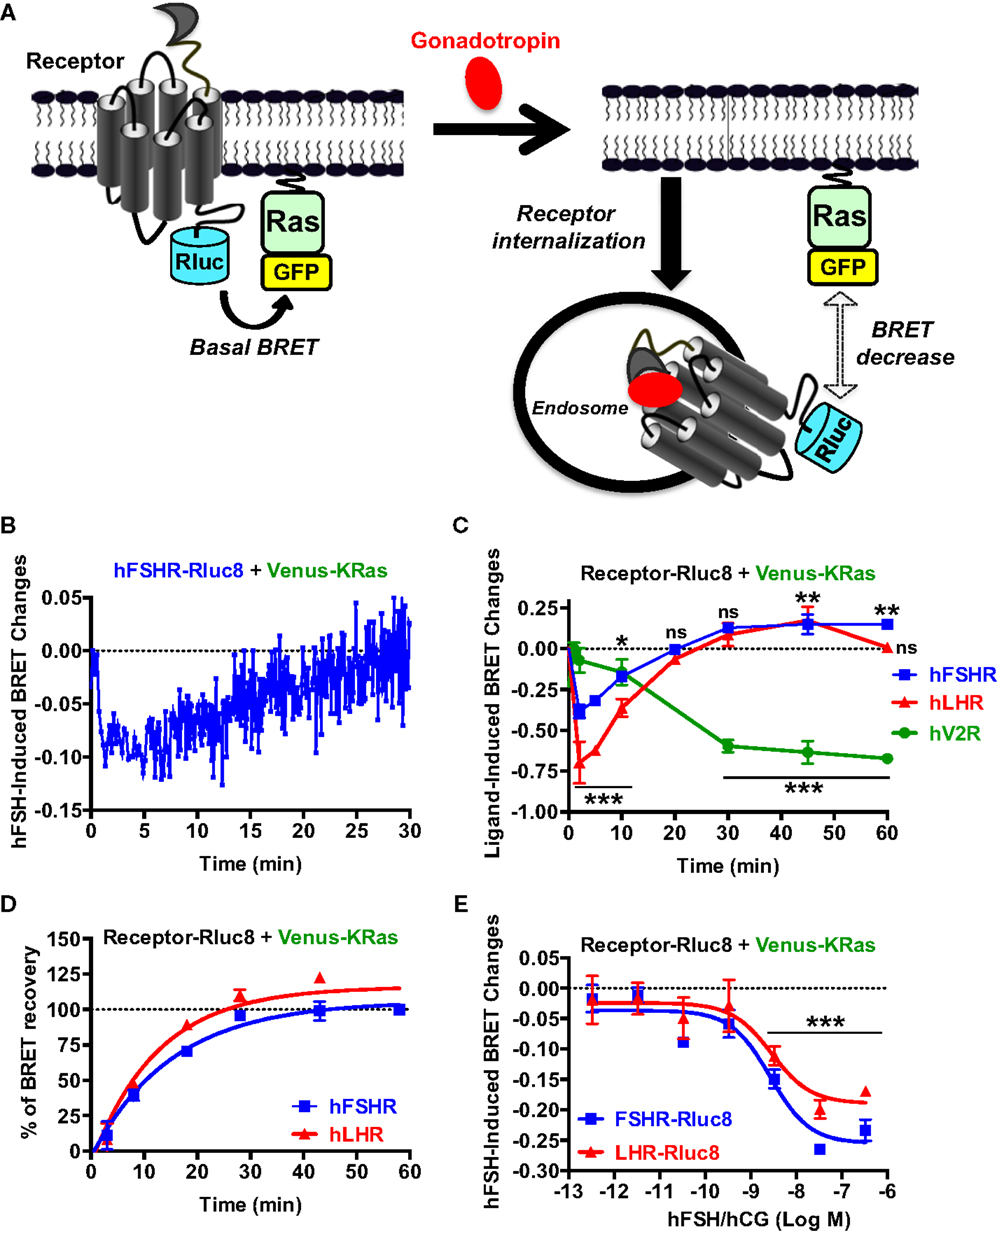
Figure 6. Receptor internalization and recycling assessed by BRET. (A) Principle of the BRET-based receptor internalization assay. HEK 293 cells transiently co-expressing Venus-KRas with either hFSHR-Rluc8, hLHR-Rluc8, or hV2R–Rluc8 were used for BRET measurements using 96-well format as described the Section “Materials and Methods.” Real-time kinetics (B) and dose–response analysis (E) after 2 min of stimulation with 10 nM (B) or increasing concentrations (E) of the hormones. In addition, time-course experiments were performed upon cell stimulation with 10 nM of the indicated agonists for 2, 5, 10, 20, 30, 45, and 60 min (C). The BRET recovery phases for hFSHR and hLHR in (C) were also fitted using a non-linear regression (one phase kinetic equation) and by taking the signals after 2 and 60 min as 0 and 100% of recovery, respectively (D). This allowed the calculation of t1/2 values of receptor recycling indicated in Table 1. Data are means ± SEM of three independent experiments performed in triplicate points. *p < 0.05, **p < 0.01, ***p < 0.001, ns, not significant compared to unstimulated controls.
Discussion
In this study, we provide new insights on the activation and regulation of gonadotropin receptors by applying energy transfer-based technologies (BRET and FRET). These aspects were studied in real-time in live HEK 293 cells in dose- and time-dependent manners using various BRET configurations and BRET/FRET sensors. This allowed us to cover critical steps in the signaling of hFSHR and hLHR going from their intimate coupling to the heterotrimeric Gαs/Gβγ proteins at the membrane to the accumulation of cytosolic cAMP and calcium as well as β-arrestin 2 recruitment, receptor internalization, and recycling. Together, our data illustrate the robustness of the different BRET and FRET assays used to examine such components of GPCR activation and signaling with exquisite precision. In our hand, FRET, which gives beautiful results in fluorescence microscopy, is less suited to multiwell plate measurements than BRET since it displayed highly reduced amplitude of response. However, FRET sensors combined with microscopy offers the advantage of measuring individual cell responses.
The set of data presented in this study on hFSHR and hLHR confirm and expand previous reports from the literature using conventional approaches in terms of G protein-dependent signaling, β-arrestin recruitment, and receptor trafficking. Indeed, a high potency (picomolar range) (Table 1) was classically observed for both hFSH and hCG with respect to the activation of the canonical Gs/cAMP signaling pathway, which is thought to account for the most physiological responses of FSH and LH in the gonads, hence in the control of reproduction (1, 2, 8). BRET measurements between the Gαs and Gβγ subunits activated by hFSHR and hLHR showed relatively rapid BRET changes upon receptor activation consistent with previous observations using similar BRET assays on different heterotrimeric G proteins and GPCRs (32, 33, 35, 36, 51). Moreover, BRET-based calcium sensor allowed the assessment of rapid and transient calcium release in response to the hormones confirming previous reports of FSHR- and LHR-mediated calcium response (37, 38). Moreover, our data suggest differences between the two receptors in terms of the basal calcium response, and further investigation will be needed to better understand this aspect of FSHR/LHR signaling. One possible explanation could be that the higher basal level observed in LHR-transfected cells is a reflexion of the fact that this receptor leads to significant constitutive activity while FSHR does not (52, 53).
Interestingly, our BRET data provide the first direct evidence for the dynamics of receptor/β-arrestin association, in real-time and live cells, in response to FSH and hCG stimulation. We confirmed the accuracy of the measurements for hFSHR/β-arrestin association using an indirect TANGO assay, both data sets being also consistent with those recently reported on FSHR using the PathHunter β-arrestin assay from DiscoverRx (4, 5). This commercial assay, similar to our home-made TANGO assay, precludes real-time measurements since 90 min of agonist stimulation are followed by 1 h of incubation before the assay detection (overnight incubation in the TANGO assay). In addition, it is worth noting that non-trivial modifications are introduced in the C-terminus of FSHR in these two assays, although this region is known to be critical for receptor phosphorylation by GRKs and β-arrestin interaction. The real-time kinetic analysis using BRET showed a time-dependent increase in β-arrestin 2 recruitment with a plateau reached after 20–30 min of stimulation consistent with previous BRET data on β-arrestin recruitment to other GPCRs (26, 27, 33, 34, 51, 54). The sustained BRET signals induced after 20–50 min of stimulation suggests that hFSHR and hLHR present a class B GPCR profile similarly to the prototypic vasopressin V2 receptor (41, 46). In addition, the BRET data on β-arrestin 2 recruitment were nicely correlated with the internalization data in terms of efficiency and to some extent kinetics (Figure 7; Table 1). This is consistent with the previously reported central role played by β-arrestins in the internalization of hFSHR and hLHR (55, 56) and fits well with the classical paradigm of GPCR trafficking (41, 42, 57, 58). However, our real-time BRET analysis on both receptors clearly showed receptor recycling and/or recruitment of new receptors at the plasma membrane as indicated by a recovery of BRET signals occurring after 10 min of stimulation and reaching a maximum higher than the basal level after 45–60 min. Such an observation was specific to hFSHR and hLHR since the internalization of hV2R was significantly delayed with no recycling of the receptor observed, as previously reported for this receptor (48–50). This difference with V2R suggests that the trafficking of hFSHR and hLHR is more complex than their simple classification into class A versus B GPCRs. In fact, the recovery phase observed with hFSHR and hLHR may be explained either by the recycling of the internalized receptors as previously shown for FSHR (44, 59) and LHR (60), or by the mobilization of a new intracellular pool of “spare receptors” or “receptor reserve” to the plasma membrane, or a combination of both processes. Beside, both FSHR and LHR have been reported to traffic through pre-early endosomes (60). This unusual trafficking may explain the fast internalization and recycling observed in our system.
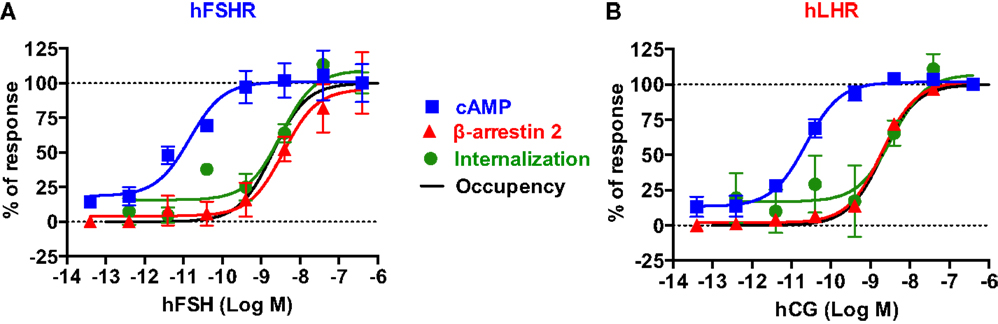
Figure 7. Comparative analysis of the dose–response analysis on cAMP responses, β-arrestin 2 recruitment, and receptor internalization. For both hFSHR (A) and hLHR (B), the individual dose–response data obtained in each BRET assay were normalized to the maximal signal taken as 100% of receptor-mediated responses. Moreover, receptor occupancy curves were incorporated to correlate the different specific responses with the percentage of occupied receptor. The occupancy was estimated using the following equation: % Occupancy = (Ligand)/(Ligand) + Kd, considering a Kd of 2 nM for both hFSH and hCG determined by radioligand binding assay on hFSHR expressed in HEK 293 cells (data not shown).
To get a better picture of what happens with hFSH and hLHR in terms of activation, desensitization, and internalization, we normalized the dose-dependent responses of both receptors with regard to cAMP pathway, β-arrestin 2 recruitment, and receptor internalization assessed by different BRET assays reported in this study (Figure 7). For both hFSHR (Figure 7A) and hLHR (Figure 7B), we found a spectacular left-warded shift (about three logs) of cAMP curve (EC50 ≈ pM) as compared to β-arrestin 2 and internalization curves (EC50 ≈ nM), indicating the high efficiency of gonadotropins for this signaling pathway. In contrast, there was no difference between β-arrestin 2 recruitment and internalization curves since both processes are tightly linked. Such a shift cannot be due to the fusion of the receptors with Rluc8 since both hFSHR-Rluc8 and hLHR-Rluc8 respond to gonadotropin stimulation with similar potencies as their respective unmodified receptors as shown by BRET (Figures 1D,E) and HTRF® (Figures 1F,G) assays. In addition, dose–response curves of receptor internalization using BRET with KRas were similar to that for β-arrestin 2 recruitment even though no yPET-β-arrestin overexpression was used in the internalization assay, ruling out the possibility that the shift observed for β-arrestin 2 recruitment could reflect a diminished functionality of the yPET-β-arrestin 2 (Figures 5E and 7) or the modified variant in TANGO assay (Figure 5G).
Interestingly, the predicted receptor occupancy curves, using a Kd of 2 nM determined by radioligand binding assay on HEK 293 cells stably expressing hFSHR, indicated that <10% of the activated receptors is sufficient to promote maximal cAMP response whereas more than 90% of the receptors needed to be occupied to have full β-arrestin 2 recruitment as well as receptor internalization (Figures 7A,B). Noteworthy, our measurements of the rapid internalization phase displayed maximal response in the nanomolar range for both receptors, demonstrating that the full complement of receptor is accessible to hormone binding, even at early stimulation times. This observation rules out the scenario where only a limited fraction of receptors would be present at the plasma membrane at the time of stimulation. Together with the recycling data shown in Figure 6, our results are in accordance with the concept of “spare receptors,” postulating that for high-efficacy hormones, a small population of receptors occupied is sufficient to fully promote the biological response (61–63), a paradigm, which has also been previously evoked for gonadotropin receptors (61, 64–66). The “spare receptors” concept predicates that there is a mechanism by which only small amount of gonadotropin receptors needs to be occupied to fully elicit cAMP-dependent function of the gonadotropin hormones. This is consistent with the well-established amplification of the intracellular cAMP signaling pathway and suggests a model where Gαs and/or adenylyl cyclase would be limiting yet accessible to all the occupied receptors in the cells. Alternatively, the existence of pre-assembled receptor-G protein complexes, as demonstrated for many GPCR-G protein pairs (27, 51, 67–69), may explain such an observation. Indeed, a limited amount of pre-assembled complexes could preferentially bind hormones by virtue of its well-established affinity increase for the ligand within the ternary complex (70). In contrast, β-arrestin recruitment and receptor internalization processes are remarkably proportional to receptor occupancy, suggesting that neither mechanism is amplified but rather that they depend on a 1:1 stoichiometric interaction with the receptors. Moreover, the differences in hormone potencies and receptor efficacies between cAMP and β-arrestin 2 recruitment/internalization pathways may explain the balance between receptor activation and receptor desensitization but also the balance between G protein-dependent and β-arrestin-dependent signaling pathways. Therefore, further investigation will be required to better dissect these aspects of FSHR and LHR trafficking and their putative link with the G protein- and β-arrestin-dependent downstream signaling in the gonads in physiological and pathophysiological settings. From the technological point of view, our study illustrates the advantage of applying BRET and FRET approaches to study the signaling and trafficking of FSHR and LHR in real-time and live cells. Of course, these approaches are based on transient expression of fusion proteins of the receptors and their different signaling and regulatory partners. Therefore, it will be important in the future, to apply other methods in order to confirm our observations in cells or native tissues expressing unmodified receptors and regulatory proteins at endogenous levels. Despite these potential shortcomings, the assays presented here may nonetheless have considerable potential for pharmacological profiling of gonadotropin receptors.
Conflict of Interest Statement
The authors declare that the research was conducted in the absence of any commercial or financial relationships that could be construed as a potential conflict of interest.
Acknowledgments
This work was funded by ARTE2, MODUPHAC, “ARD 2020 Biomédicament” grants from Région Centre. MAA is funded by LE STUDIUM® Loire Valley Institute for Advanced Studies and AgreenSkills Plus. FL is recipient of a doctoral fellowship from Région Centre. The authors thank Dr. A. Hanyaloglu from Imperial College (London) for kindly providing the receptor–Rluc8 fusion constructs. Special thanks to INRA and CNRS for their support.
References
1. Simoni M, Gromoll J, et al. The follicle-stimulating hormone receptor: biochemistry, molecular biology, physiology, and pathophysiology. Endocr Rev (1997) 18(6):739–73. doi: 10.1210/er.18.6.739
2. Ascoli M, Fanelli F, Segaloff DL. The lutropin/choriogonadotropin receptor, a 2002 perspective. Endocr Rev (2002) 23(2):141–74. doi:10.1210/edrv.23.2.0462
3. Boutrel B, Kenny PJ, Specio SE, Martin-Fardon R, Markou A, Koob GF, et al. Role for hypocretin in mediating stress-induced reinstatement of cocaine-seeking behavior. Proc Natl Acad Sci U S A (2005) 102(52):19168–73. doi:10.1073/pnas.0507480102
4. Jiang N, Saba NF, Chen ZG. Advances in targeting HER3 as an anticancer therapy. Chemother Res Pract (2012) 2012:817304. doi:10.1155/2012/817304
5. Jiang X, Dias JA, He X. Structural biology of glycoprotein hormones and their receptors: insights to signaling. Mol Cell Endocrinol (2014) 382(1):424–51. doi:10.1016/j.mce.2013.08.021
6. Arey BJ, Lopez FJ. Are circulating gonadotropin isoforms naturally occurring biased agonists? Basic and therapeutic implications. Rev Endocr Metab Disord (2011) 12(4):275–88. doi:10.1007/s11154-011-9188-y
7. Gloaguen P, Crépieux P, Heitzler D, Poupon A, Reiter E. Mapping the follicle-stimulating hormone-induced signaling networks. Frontiers in Endocrinology (2011) 2:45. doi:10.3389/fendo.2011.00045
8. Ulloa-Aguirre A, Crépieux P, Poupon A, Maurel MC, Reiter E. Novel pathways in gonadotropin receptor signaling and biased agonism. Rev Endocr Metab Disord (2011) 12(4):259–74. doi:10.1007/s11154-011-9176-2
9. Landomiel F, Gallay N, Jégot G, Tranchant T, Durand G, Bourquard T, et al. Biased signalling in follicle stimulating hormone action. Mol Cell Endocrinol (2014) 382(1):452–9. doi:10.1016/j.mce.2013.09.035
10. Kara E, Crépieux P, Gauthier C, Martinat N, Piketty V, Guillou F, et al. A phosphorylation cluster of five serine and threonine residues in the C-terminus of the follicle-stimulating hormone receptor is important for desensitization but not for beta-arrestin-mediated ERK activation. Mol Endocrinol (2006) 20(11):3014–26. doi:10.1210/me.2006-0098
11. Wehbi V, Tranchant T, Durand G, Musnier A, Decourtye J, Piketty V, et al. Partially deglycosylated equine LH preferentially activates beta-arrestin-dependent signaling at the follicle-stimulating hormone receptor. Mol Endocrinol (2010) 24(3):561–73. doi:10.1210/me.2009-0347
12. Tranchant T, Durand G, Gauthier C, Crépieux P, Ulloa-Aguirre A, Royère D, et al. Preferential beta-arrestin signalling at low receptor density revealed by functional characterization of the human FSH receptor A189 V mutation. Mol Cell Endocrinol (2011) 331(1):109–18. doi:10.1016/j.mce.2010.08.016
13. Heitzler D, Durand G, Gallay N, Rizk A, Ahn S, Kim J, et al. Competing G protein-coupled receptor kinases balance G protein and beta-arrestin signaling. Mol Syst Biol (2012) 8:590. doi:10.1038/msb.2012.22
14. Förster T. Intermolecular energy migration and fluorescence. Annals of Physics (1948) 437(1–2):55–75.
15. Helms V. Fluorescence resonance energy transfer. In: VCH W. editor. Principles of Computational Cell Biology. Weinheim: Wiley-Blackwell (2008). 202.
16. Pin JP, Ayoub MA, et al. Energy transfer technologies to monitor the dynamics and signaling properties of G – protein – coupled receptors in living cells. In: E. Pebay-Peyroula, editor. Biophysical Analysis of Membrane Proteins – Investigating Structure and Function. Weinheim, Wiley-VCH (2008). 311–34.
17. Boute N, Pernet K, Issad T. Monitoring the activation state of the insulin receptor using bioluminescence resonance energy transfer. Mol Pharmacol (2001) 60(4):640–5.
18. Ayoub MA, See HB, Seeber RM, Armstrong SP, Pfleger KD. Profiling epidermal growth factor receptor and heregulin receptor 3 heteromerization using receptor tyrosine kinase heteromer investigation technology. PLoS One (2013) 8(5):e64672. doi:10.1371/journal.pone.0064672
19. Pfleger KD, Eidne KA. Monitoring the formation of dynamic G-protein-coupled receptor-protein complexes in living cells. Biochem J (2005) 385(Pt 3):625–37. doi:10.1042/BJ20041361
20. Lohse MJ, Nuber S, Hoffmann C. Fluorescence/bioluminescence resonance energy transfer techniques to study g-protein-coupled receptor activation and signaling. Pharmacol Rev (2012) 64(2):299–336. doi:10.1124/pr.110.004309
21. Conn PM. Receptor-receptor interactions methods in cell biology. P. M Conn Elsevier Science (2013) 117:538. doi:10.1016/B978-0-12-408143-7.10000-3
22. Hein P, Frank M, Hoffmann C, Lohse MJ, Bünemann M. Dynamics of receptor/G protein coupling in living cells. EMBO J (2005) 24(23):4106–14. doi:10.1038/sj.emboj.7600870
23. Nguyen AW, Daugherty PS. Evolutionary optimization of fluorescent proteins for intracellular FRET. Nat Biotechnol (2005) 23(3):355–60. doi:10.1038/nbt1066
24. Ayoub MA, Pfleger KD. Recent advances in bioluminescence resonance energy transfer technologies to study GPCR heteromerization. Curr Opin Pharmacol (2010) 10(1):44–52. doi:10.1016/j.coph.2009.09.012
25. Cottet M, Faklaris O, Maurel D, Scholler P, Doumazane E, Trinquet E, et al. BRET and Time-resolved FRET strategy to study GPCR oligomerization: from cell lines toward native tissues. Front Endocrinol (Lausanne) (2012) 3:92. doi:10.3389/fendo.2012.00092
26. Ayoub MA, Al-Senaidy A, Pin JP. Receptor-G protein interaction studied by bioluminescence resonance energy transfer: lessons from protease-activated receptor 1. Front Endocrin (2012) 3:82. doi:10.3389/fendo.2012.00082
27. Ayoub MA, Maurel D, Binet V, Fink M, Prézeau L, Ansanay H, et al. Real-time analysis of agonist-induced activation of protease-activated receptor 1/Galphai1 protein complex measured by bioluminescence resonance energy transfer in living cells. Mol Pharmacol (2007) 71(5):1329–40. doi:10.1124/mol.106.030304
28. Nørskov-Lauritsen L, Thomsen AR, Bräuner-Osborne H. G protein-coupled receptor signaling analysis using homogenous time-resolved Forster resonance energy transfer (HTRF(R)) technology. Int J Mol Sci (2014) 15(2):2554–72. doi:10.3390/ijms15022554
29. Barnea G, Strapps W, Herrada G, Berman Y, Ong J, Kloss B, et al. The genetic design of signaling cascades to record receptor activation. Proc Natl Acad Sci U S A (2008) 105(1):64–9. doi:10.1073/pnas.0710487105
30. Jiang LI, Collins J, Davis R, Lin KM, DeCamp D, Roach T, et al. Use of a cAMP BRET sensor to characterize a novel regulation of cAMP by the sphingosine 1-phosphate/G13 pathway. J Biol Chem (2007) 282(14):10576–84. doi:10.1074/jbc.M701019200
31. DiPilato LM, Cheng X, Zhang J. Fluorescent indicators of cAMP and Epac activation reveal differential dynamics of cAMP signaling within discrete subcellular compartments. Proc Natl Acad Sci U S A (2004) 101(47):16513–8. doi:10.1073/pnas.0405973101
32. Galés C, Van Durm JJ, Schaak S, Pontier S, Percherancier Y, Audet M, et al. Probing the activation-promoted structural rearrangements in preassembled receptor-G protein complexes. Nat Struct Mol Biol (2006) 13:778–86. doi:10.1038/nsmb1134
33. Ayoub MA, Damian M, Gespach C, Ferrandis E, Lavergne O, De Wever O, et al. Inhibition of heterotrimeric G-protein signaling by a small molecule acting on galpha subunit. J Biol Chem (2009) 284(42):29136–45. doi:10.1074/jbc.M109.042333
34. Ayoub MA, Zhang Y, Kelly RS, See HB, Johnstone EK, McCall EA, et al. Functional interaction between angiotensin II receptor type 1 and chemokine (C-C Motif) receptor 2 with implications for chronic kidney disease. PLoS One (2015) 10(3):e0119803. doi:10.1371/journal.pone.0119803
35. Bellot M, Galandrin S, Boularan C, Matthies HJ, Despas F, Denis C, et al. Dual agonist occupancy of AT1-R-alpha2C-AR heterodimers results in atypical Gs-PKA signaling. Nat Chem Biol (2015) 11(4):271–9. doi:10.1038/nchembio.1766
36. Damian M, Mary S, Maingot M, M’Kadmi C, Gagne D, Leyris JP, et al. Ghrelin receptor conformational dynamics regulate the transition from a preassembled to an active receptor: Gq complex. Proc Natl Acad Sci U S A (2015) 112(5):1601–6. doi:10.1073/pnas.1414618112
37. Zhu X, Gilbert S, Birnbaumer M, Birnbaumer L. Dual signaling potential is common among Gs-coupled receptors and dependent on receptor density. Mol Pharmacol (1994) 46(3):460–9.
38. Thomas RM, Nechamen CA, Mazurkiewicz JE, Ulloa-Aguirre A, Dias JA. The adapter protein APPL1 links FSH receptor to inositol 1,4,5-trisphosphate production and is implicated in intracellular Ca(2+) mobilization. Endocrinology (2011) 152(4):1691–701. doi:10.1210/en.2010-1353
39. Gorokhovatsky AY, Marchenkov VV, Rudenko NV, Ivashina TV, Ksenzenko VN, Burkhardt N, et al. Fusion of Aequorea victoria GFP and aequorin provides their Ca(2+)-induced interaction that results in red shift of GFP absorption and efficient bioluminescence energy transfer. Biochem Biophys Res Commun (2004) 320(3):703–11. doi:10.1016/j.bbrc.2004.06.014
40. Naumann EA, Kampff AR, Prober DA, Schier AF, Engert F. Monitoring neural activity with bioluminescence during natural behavior. Nat Neurosci (2010) 13(4):513–20. doi:10.1038/nn.2518
41. Luttrell LM, Lefkowitz RJ. The role of beta-arrestins in the termination and transduction of G-protein-coupled receptor signals. J Cell Sci (2002) 115(Pt 3):455–65.
42. Lefkowitz RJ, Shenoy SK. Transduction of receptor signals by beta-arrestins. Science (2005) 308(5721):512–7. doi:10.1126/science.1109237
43. Reiter E, Lefkowitz RJ. GRKs and beta-arrestins: roles in receptor silencing, trafficking and signaling. Trends Endocrinol Metab (2006) 17(4):159–65. doi:10.1016/j.tem.2006.03.008
44. Kluetzman KS, Thomas RM, Nechamen CA, Dias JA. Decreased degradation of internalized follicle-stimulating hormone caused by mutation of aspartic acid 6.30(550) in a protein kinase-CK2 consensus sequence in the third intracellular loop of human follicle-stimulating hormone receptor. Biol Reprod (2011) 84(6):1154–63. doi:10.1095/biolreprod.110.087965
45. Galet C, Ascoli M. Arrestin-3 is essential for the activation of Fyn by the luteinizing hormone receptor (LHR) in MA-10 cells. Cell Signal (2008) 20(10):1822–9. doi:10.1016/j.cellsig.2008.06.005
46. Oakley RH, Laporte SA, Holt JA, Caron MG, Barak LS. Differential affinities of visual arrestin, beta arrestin1, and beta arrestin2 for G protein-coupled receptors delineate two major classes of receptors. J Biol Chem (2000) 275(22):17201–10. doi:10.1074/jbc.M910348199
47. Lan TH, Kuravi S, Lambert NA. Internalization dissociates beta2-adrenergic receptors. PLoS One (2011) 6(2):e17361. doi:10.1371/journal.pone.0017361
48. Robben JH, Knoers NV, Deen PM. Regulation of the vasopressin V2 receptor by vasopressin in polarized renal collecting duct cells. Mol Biol Cell (2004) 15(12):5693–9. doi:10.1091/mbc.E04-04-0337
49. Terrillon S, Barberis C, Bouvier M. Heterodimerization of V1a and V2 vasopressin receptors determines the interaction with beta-arrestin and their trafficking patterns. Proc Natl Acad Sci U S A (2004) 101(6):1548–53. doi:10.1073/pnas.0305322101
50. Bouley R, Lin HY, Raychowdhury MK, Marshansky V, Brown D, Ausiello DA. Downregulation of the vasopressin type 2 receptor after vasopressin-induced internalization: involvement of a lysosomal degradation pathway. Am J Physiol Cell Physiol (2005) 288(6):C1390–401. doi:10.1152/ajpcell.00353.2004
51. Ayoub MA, Trinquet E, Pfleger KD, Pin JP. Differential association modes of the thrombin receptor PAR1 with Galphai1, Galpha12, and beta-arrestin 1. FASEB J (2010) 24(9):3522–35. doi:10.1096/fj.10-154997
52. Guan Y, Zhang Y, Wu J, Qi Z, Yang G, Dou D, et al. Antihypertensive effects of selective prostaglandin E2 receptor subtype 1 targeting. J Clin Invest (2007) 117(9):2496–505. doi:10.1172/JCI29838
53. Ulloa-Aguirre A, Reiter E, Bousfield G, Dias JA, Huhtaniemi I. Constitutive activity in gonadotropin receptors. Adv Pharmacol (2014) 70:37–80. doi:10.1016/B978-0-12-417197-8.00002-X
54. Tenenbaum J, Ayoub MA, Perkovska S, Adra-Delenne AL, Mendre C, Ranchin B, et al. The constitutively active V2 receptor mutants conferring NSIAD are weakly sensitive to agonist and antagonist regulation. PLoS One (2009) 4(12):e8383. doi:10.1371/journal.pone.0008383
55. Nakamura K, Lazari MF, Li S, Korgaonkar C, Ascoli M. Role of the rate of internalization of the agonist-receptor complex on the agonist-induced down-regulation of the lutropin/choriogonadotropin receptor. Mol Endocrinol (1999) 13(8):1295–304. doi:10.1210/mend.13.8.0331
56. Bhaskaran RS, Min L, Krishnamurthy H, Ascoli M. Studies with chimeras of the gonadotropin receptors reveal the importance of third intracellular loop threonines on the formation of the receptor/nonvisual arrestin complex. Biochemistry (2003) 42(47):13950–9. doi:10.1021/bi034907w
57. Ferguson SS, Downey WE III, Colapietro AM, Barak LS, Ménard L, Caron MG. Role of beta-arrestin in mediating agonist-promoted G protein-coupled receptor internalization. Science (1996) 271(5247):363–6. doi:10.1126/science.271.5247.363
58. Shenoy SK, Lefkowitz RJ. beta-arrestin-mediated receptor trafficking and signal transduction. Trends Pharmacol Sci (2011) 32(9):521–33. doi:10.1016/j.tips.2011.05.002
59. Krishnamurthy H, Kishi H, Shi M, Galet C, Bhaskaran RS, Hirakawa T, et al. Postendocytotic trafficking of the follicle-stimulating hormone (FSH)-FSH receptor complex. Mol Endocrinol (2003) 17(11):2162–76. doi:10.1210/me.2003-0118
60. Jean-Alphonse F, Bowersox S, Chen S, Beard G, Puthenveedu MA, Hanyaloglu AC. Spatially restricted G protein-coupled receptor activity via divergent endocytic compartments. J Biol Chem (2014) 289(7):3960–77. doi:10.1074/jbc.M113.526350
61. Catt KJ, Dufau ML. Spare gonadotrophin receptors in rat testis. Nat New Biol (1973) 244(137):219–21. doi:10.1038/newbio244219a0
62. Marunaka Y, Niisato N, Miyazaki H. New concept of spare receptors and effectors. J Membr Biol (2005) 203(1):31–9. doi:10.1007/s00232-004-0729-0
63. Charlton SJ. Agonist efficacy and receptor desensitization: from partial truths to a fuller picture. Br J Pharmacol (2009) 158(1):165–8. doi:10.1111/j.1476-5381.2009.00352.x
64. Huhtaniemi IT, Clayton RN, Catt KJ. Gonadotropin binding and Leydig cell activation in the rat testis in vivo. Endocrinology (1982) 111(3):982–7. doi:10.1210/endo-111-3-982
65. Uribe A, Zariñán T, Pérez-Solis MA, Gutiérrez-Sagal R, Jardón-Valadez E, Piñeiro A, et al. Functional and structural roles of conserved cysteine residues in the carboxyl-terminal domain of the follicle-stimulating hormone receptor in human embryonic kidney 293 cells. Biol Reprod (2008) 78(5):869–82. doi:10.1095/biolreprod.107.063925
66. Rivero-Müller A, Chou YY, Ji I, Lajic S, Hanyaloglu AC, Jonas K, et al. Rescue of defective G protein-coupled receptor function in vivo by intermolecular cooperation. Proc Natl Acad Sci U S A (2010) 107(5):2319–24. doi:10.1073/pnas.0906695106
67. Roka F, Brydon L, Waldhoer M, Strosberg AD, Freissmuth M, Jockers R, et al. Tight association of the human Mel(1a)-melatonin receptor and G(i): precoupling and constitutive activity. Mol Pharmacol (1999) 56(5):1014–24.
68. Andressen KW, Norum JH, Levy FO, Krobert KA. Activation of adenylyl cyclase by endogenous G(s)-coupled receptors in human embryonic kidney 293 cells is attenuated by 5-HT(7) receptor expression. Mol Pharmacol (2006) 69(1):207–15. doi:10.1124/mol.105.015396
69. Qin K, Sethi PR, Lambert NA. Abundance and stability of complexes containing inactive G protein-coupled receptors and G proteins. FASEB J (2008) 22(8):2920–7. doi:10.1096/fj.08-105775
Keywords: gonadotropins, FSHR, LHR, GPCRs, G proteins, arrestins, BRET, FRET
Citation: Ayoub MA, Landomiel F, Gallay N, Jégot G, Poupon A, Crépieux P and Reiter E (2015) Assessing gonadotropin receptor function by resonance energy transfer-based assays. Front. Endocrinol. 6:130. doi: 10.3389/fendo.2015.00130
Received: 11 June 2015; Accepted: 10 August 2015;
Published: 27 August 2015
Edited by:
Brian J. Arey, Bristol-Myers Squibb, USAReviewed by:
Daniel James Scott, The Florey Institute and The University of Melbourne, AustraliaJonathan Janssens, University of Antwerp, Belgium
Copyright: © 2015 Ayoub, Landomiel, Gallay, Jégot, Poupon, Crépieux and Reiter. This is an open-access article distributed under the terms of the Creative Commons Attribution License (CC BY). The use, distribution or reproduction in other forums is permitted, provided the original author(s) or licensor are credited and that the original publication in this journal is cited, in accordance with accepted academic practice. No use, distribution or reproduction is permitted which does not comply with these terms.
*Correspondence: Mohammed Akli Ayoub, Institut National de la Recherche Agronomique (INRA) UMR85, CNRS-Université François Rabelais UMR7247, Physiologie de la Reproduction et des Comportements (PRC) - Nouzilly 37380, France, Mohammed.Ayoub@tours.inra.fr