 Weijing Wang
 Dongfeng Zhang
 Chunsheng Xu
 Yili Wu
 Haiping Duan
 Shuxia Li
 Qihua Tan
- 1Department of Epidemiology and Health Statistics, Public Health College, Qingdao University, Qingdao, China
- 2Epidemiology and Biostatistics, Department of Public Health, University of Southern Denmark, Odense, Denmark
- 3Qingdao Municipal Center for Disease Control and Prevention, Qingdao, China
- 4Qingdao Institute of Preventive Medicine, Qingdao, China
- 5Unit of Human Genetics, Department of Clinical Research, University of Southern Denmark, Odense, Denmark
Serum uric acid (SUA), as the end product of purine metabolism, has proven emerging roles in human disorders. Here based on a sample of 379 middle and old-aged Chinese twin pairs, we aimed to explore the magnitude of genetic impact on SUA variation by performing sex-limitation twin modeling analyses and further detect specific genetic variants related to SUA by conducting a genome-wide association study. Monozygotic (MZ) twin correlation for SUA level (rMZ = 0.56) was larger than for dizygotic (DZ) twin correlation (rDZ = 0.39). The common effects sex-limitation model provided the best fit with additive genetic parameter (A) accounting for 46.3%, common or shared environmental parameter (C) accounting for 26.3% and unique/nonshared environmental parameter (E) accounting for 27.5% for females and 29.9, 33.1, and 37.0% for males, respectively. Although no SUA-related genetic variants reached genome-wide significance level, 25 SNPs were suggestive of association (P < 1 × 10⁻⁵). Most of the SNPs were located in an intronic region and detected to have regulatory effects on gene transcription. The cell-type specific enhancer of skeletal muscle was detected which has been reported to implicate SUA. Two promising genetic regions on chromosome 17 around rs2253277 and chromosome 14 around rs11621523 were found. Gene-based analysis found 167 genes nominally associated with SUA level (P < 0.05), including PTGR2, ENTPD5, well-known SLC2A9, etc. Enrichment analysis identified one pathway of transmembrane transport of small molecules and 20 GO gene sets involving in ion transport, transmembrane transporter activity, hydrolase activity acting on acid anhydrides, etc. In conclusion, SUA shows moderate heritability in women and low heritability in men in the Chinese population and genetic variations are significantly involved in functional genes and regulatory domains that mediate SUA level. Our findings provide clues to further elucidate molecular physiology of SUA homeostasis and identify new diagnostic biomarkers and therapeutic targets for hyperuricemia and gout.
Introduction
Serum uric acid (SUA), as the end product of purine metabolism, has proven emerging roles in human disorders, such as kidney disease (1, 2), diabetic nephropathy (3), metabolic diseases (4, 5), preeclampsia (6), cardiovascular disease (2, 7), diabetes (8), etc. A systematic review and meta-analysis by Liu et al. concluded that the prevalence of hyperuricemia (13.3%) and gout (1.1%) was high in mainland China (9). Hence, it is necessary to explore factors affecting SUA homeostasis and elucidate underlying pathogenesis of increased SUA level.
The SUA level is mediated by the interplay between genetic and environmental factors. So far, the magnitude of genetic sources of variance in SUA level has been previously explored in several population studies (10–16). A strong genetic component was indicated with heritability estimates approximately ranging from 35 to 77%. Additionally, the genetic epidemiology has presented an enormous impact on the molecular physiology related to SUA homeostasis by genome-wide association study (GWAS), identifying several genetic loci located in key urate transporters such as SLC22A7, SLC2A9, SLC22A11, SLC22A12, ABCG2, etc., and a number of additional intriguing genetic networks (17–19).
Although intensively deployed, no GWAS has, to our knowledge, yet been performed on a sample of middle and old-aged Chinese twins. Chinese population differs in the genetic constitutions and a multitude of life style like dietary habit, work type, and physical activity from other ethnic populations in the world. Genetically related individuals, such as twin pairs, would highly confer increased power in genetic association analysis and efficiently identify genetic variants underlying human complex diseases (20).
Based on a sample of 379 middle and old-aged Chinese twin pairs, we explore the magnitude of genetic impact on SUA variation by performing twin modeling analyses and replicate previous findings on heritability of SUA level and further conduct a GWAS to detect specific genetic variants associated with SUA.
Materials and Methods
Participants
The sample collection was carried out through the Qingdao Twin Registry, and details of study recruitment have been described previously (21, 22). Participants who were with gout, systemic lupus erythematosus, eGFR < 60%, or serum creatinine level >1.4 mg/dL were excluded, and incomplete co-twin pairs were also dropped. The final sample consisted of 379 complete twin pairs with a median age of 50 years (95% range: 41–69 years), including 240 monozygotic (MZ) pairs (114 male and 126 female pairs) and 139 dizygotic (DZ) pairs (41 male, 39 female, and 59 opposite-sex pairs).
All co-twin pairs undertook a health examination after a 10–12 h overnight fast and completed a questionnaire. Serum and plasma were separated from blood cells in the field within 30 min and kept frozen at −80°C. The zygosity was determined by using 16 multiple short tandem sequence repeat DNA markers (23, 24). SUA level was measured on the Semi-automatic Analyzer (Hitachi 7600, Japan) and transformed following Blom’s formula for normality.
This study was approved by the Regional Ethics Committee of the Qingdao CDC Institutional Review Boards. Prior written informed consent was achieved for all participants. The ethical principles of the Helsinki Declaration were followed.
Genotyping and Quality Control
DNA samples of 139 DZ pairs were genotyped on the Illumina’s Infinium Omni2.5Exome-8v1.2 BeadChip platform (Illumina, San Diego, CA, USA). Strong quality control was performed using the genome-wide efficient mixed-model association (GEMMA) (25) by removing the SNPs of call rate (<0.98), Hardy–Weinberg Equilibrium (P < 1 × 10⁻⁴), locus missing (>0.05), and minor allele frequency (<0.05). Finally, a total of 1,365,181 SNPs was included for subsequent GWAS analysis.
Statistical Analysis
Heritability
Data preparation and descriptive analyses as well as genetic analyses were performed with SPSS version 22.0 and Mx program,1 respectively. Twin pair phenotypic correlations per zygosity were firstly measured by calculating the Pearson’s product-moment correlation coefficients. The higher correlations of MZ than those of DZ twin pairs indicated the genetic effect on individual differences in SUA level.
Then, standard structural equation modeling methods were used for sex-limitation twin modeling based on the classical twin methods. The variation was decomposed into sources of additive genetic (A), common or shared environmental (C), and unique/nonshared environmental (E) parameters. After the general sex-limitation ACE model was firstly fitted, we then fitted its sub-models: the common effects sex-limitation models by setting the male-specific additive genetic effects () and sex-specific common or shared environmental effects (Cm and Cf) to 0 and the scalar sex-limitation models by constraining the variance components for females to be equal to a scalar multiple of the variance components for males, respectively.
In order to choose the best fitting model, the likelihood ratio test was applied to compare the performances between the general sex-limitation model and its sub-models. In the likelihood ratio test, twice the difference in the log likelihoods between models was calculated, and change in chi-square against the change in degrees of freedom were tested. The Akaike’s information criterion (AIC) was calculated and a lower AIC indicated a better fit when no statistical difference was observed between two models (26). The covariates of age and body mass index (BMI) were adjusted for in the analysis.
Genome-Wide Association Study
SNPs-Based Genome-Wide Association Study
The association of SUA level with SNP genotypes was tested using the GEMMA (25). The covariates of age, sex, BMI, and the first five principle components were adjusted for in the model fitting. The conventional genome-wide significance level of P < 5 × 10⁻⁸ and suggestive evidence level of P < 1 × 10⁻⁵ for this association were adopted (27). We further conducted functional elaboration of GWAS results and predicted putative causal variants in haplotype blocks, likely cell types of action and candidate target genes of noncoding genome by using online HaploReg v4.1 software2 (28, 29). A set of 25 query SNPs (P < 1 × 10⁻⁵) was submitted. The enrichments of cell-type enhancers with uncorrected P < 0.05 were reported.
Gene-Based Analysis
We performed gene-based tests on GWAS summary results by using Versatile Gene-based Association Study-2 (VEGAS2) which uses 1,000 genomes data to model SNP correlations across the autosomes and chromosome X (30, 31). In the test, the evidence for association from all SNPs was aggregated within a per gene while correcting for linkage disequilibrium and gene size, and genes showing more signal or strength of association than expected by chance were identified. The SNPs from “1000G East ASIAN Population” were adopted. The P < 2.63 × 10⁻⁶ (0.05/19,001) was considered to be genome-wide significant for the association as 19,001 genes being evaluated.
Gene Sets-Based Analysis
A list of significant genes (P < 0.05) were included to compute the over-represented gene sets in the gene sets-based analysis using the online version of gene set enrichment analysis (GSEA) program3 (32, 33). Gene sets of Canonical pathways, BioCarta, KEGG, Reactome, GO biological process, and GO molecular function were selected in MSigDB. The significance of over-represented gene sets was determined by Benjamini and Hochberg method corrected P-value, i.e., false discovery rate (FDR) <0.05.
Results
Heritability
The final sample contained a total of 379 twin pairs (240 MZ and 139 DZ pairs) with a median age of 50 years (95% range: 41–69 years). The median (95% range) of SUA level for all participating individuals was 256 µmol/L (143–468 µmol/L), with males having higher SUA level than females [298 (179–509) vs. 226 (130–374), P < 0.001] (Table S1 in Supplementary Material).
After adjusting for the effects of age, sex, and BMI, MZ twin correlation for SUA level (rMZ = 0.56, 95% CI: 0.47–0.64) was larger than for DZ twin (rDZ = 0.39, 95% CI: 0.25–0.50), indicating the presence of genetic influence (Table S2 in Supplementary Material) As described, we firstly fitted the general sex-limitation ACE model and its sub-models and then compared their performances. For the variance in SUA, the common effects sex-limitation model (Model II) provided the best fit (AIC = 443.56, P > 0.05) with A parameter accounting for 46.3% (95% CI: 15.0–73.4), C parameter accounting for 26.3% (95% CI: 0–55.8), and E parameter accounting for 27.5% (95% CI: 19.8–37.9) for females and 29.9% (95% CI: 0–60.0), 33.1% (95% CI: 5.4–63.4), and 37.0% (95% CI: 26.9–50.3) for males, respectively (Table 1).
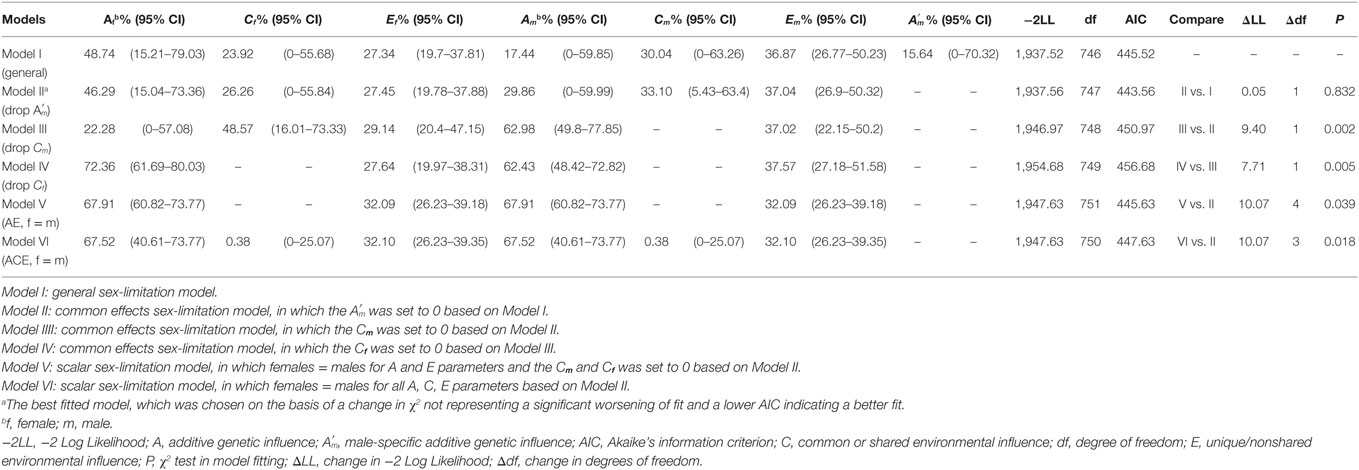
Table 1. Sex-limitation model fitting and proportion of variance for serum uric acid phenotype accounted by genetic and environmental parameters.
Genome-Wide Association Study
A total of 1,365,181 SNPs genotyped from a sample of 139 DZ twin pairs were included for the GWAS of SUA level. The relationship between the observed and expected GWAS P-values was illustrated in the Q–Q plot (Figure 1). No evidence of genomic inflation of the test statistics or the bias from the possible population stratification was indicated (λ-statistic = 1). And the slight deviation in the upper right tail from the null distribution suggested evidence for weak association. None of the SNPs reached the genome-wide significance level as illustrated in Figure 2; however, 25 SNPs were suggestive of association (P < 1 × 10⁻⁵) (Table 2). The strongest association was detected with rs346750 (P = 2.50 × 10⁻⁷) in an intronic region of EXOC3L2 on chromosome 19q13.32.
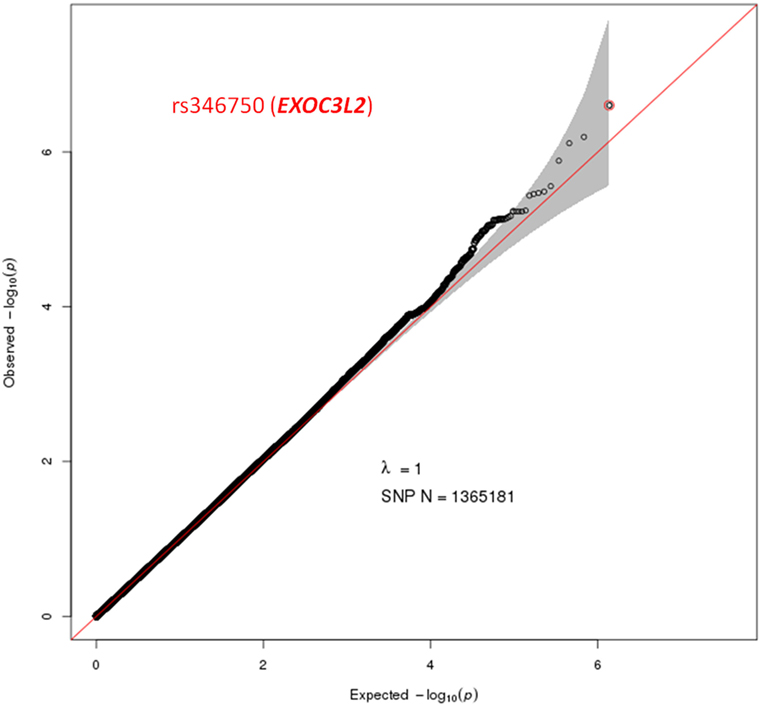
Figure 1. Quantile–quantile plot for quality control check and visualizing crude association for genome-wide association study of serum uric acid (SUA) level. The x-axis shows the −log10 of expected P-values of association from chi-square distribution and the y-axis shows the −log10 of P-values from the observed chi-square distribution. The black dots represent the observed data with top hit SNP being colored, and the red line is the expectation under the null hypothesis of no association. Gene at the best SNP is indicated.
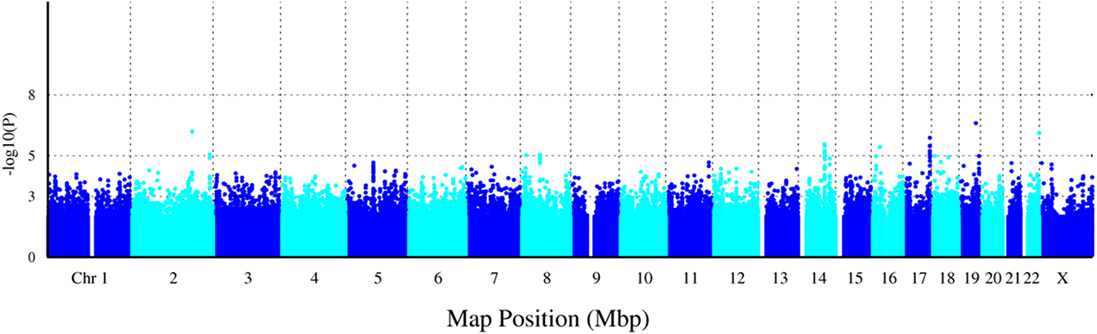
Figure 2. Manhattan plot for genome-wide association study of serum uric acid (SUA) level. The x-axis shows the numbers of autosomes and the X chromosome, and the y-axis shows the −log10 of P-values for statistical significance. The dots represent the SNPs. None of the SNPs reached the genome-wide significance level (P < 5 × 10⁻⁸); however, 25 SNPs were suggestive of association (P < 1 × 10⁻⁵).
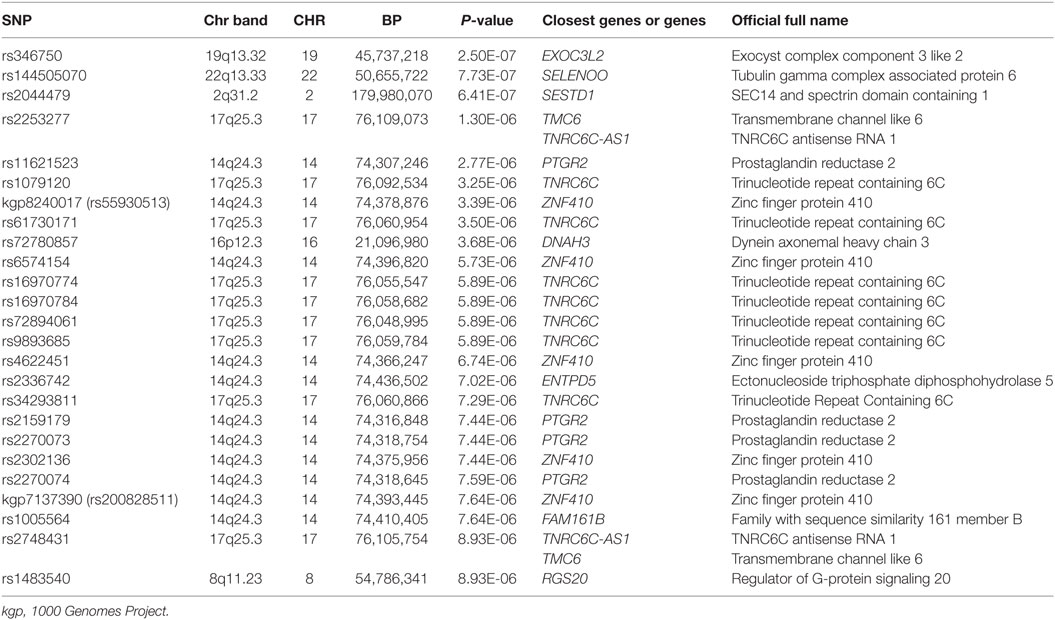
Table 2. The summary of SNPs with P-value < 1 × 10⁻⁵ for association with serum uric acid in genome-wide association study.
Among these top signals, two chromosomal loci (17q25.3 and 14q24.3) showed nominal association with SUA level as the locus zoom plots illustrated (Figures 3 and 4). On chromosome 17q25.3, seven SNPs (P = 3.25 × 10⁻⁶–7.29 × 10⁻⁶) and two SNPs (P = 1.30 × 10⁻⁶–8.93 × 10⁻⁶) were located at or near TNRC6C and TMC6/TNRC6C-AS1 genes, respectively. At chromosome 14q24.3, four SNPs rs2270073, rs2270074, rs11621523, and rs2159179 (P = 2.77 × 10⁻⁶–7.59 × 10⁻⁶) were positioned within or closest to PTGR2 gene that was involved in terminal inactivation of prostaglandins. The rs2336742 (P = 7.02 × 10⁻⁶) was located at the intronic region of ENTPD5 gene, which was involved in the pathway of purine metabolism. The number of SNPs mapping to ZNF410 and FAM161B was five (P = 3.39 × 10⁻⁶–7.64 × 10⁻⁶) and one (P = 7.64 × 10⁻⁶), respectively. All the abovementioned genes showed nominal association with SUA level (P < 0.05) from the following VEGAS2 analysis.
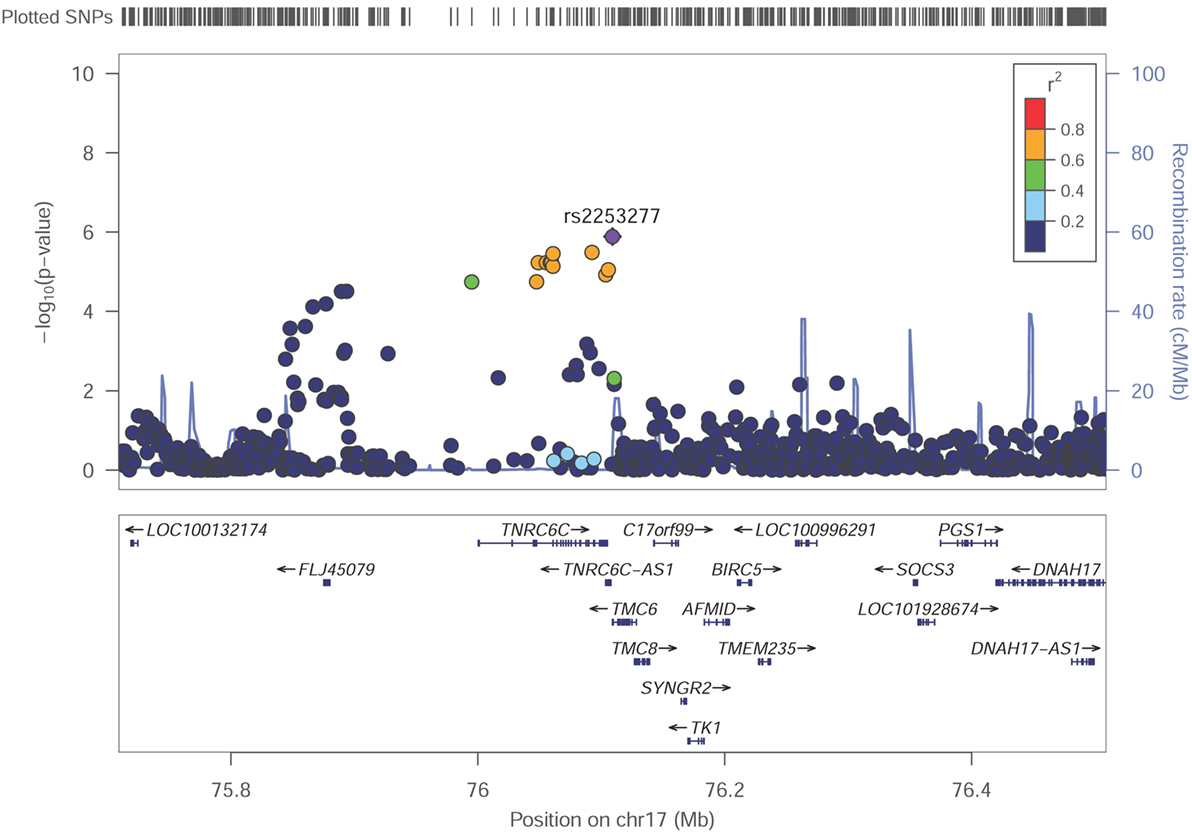
Figure 3. Regional association plot showing signal around chromosomal loci of 17q25.3 for genome-wide association study of serum uric acid (SUA) level. The strongest association was detected with rs2253277 in TMC6/TNRC6C-AS1 genes.
As predicted by HaploReg v4.1, two cell-type specific enhancers (uncorrected P < 0.05) of brain angular gyrus (P = 0.003) and skeletal muscle (female) (P = 0.008) were identified for the set of 25 query SNPs (Table S3 in Supplementary Material). Most of the SNPs were located in intronic regions. Several SNPs were detected within regions with promoter histone marks or enhancer histone marks and could change DNA motifs for DNA-binding proteins, and thus would have regulatory effects on gene transcription (Table S4 in Supplementary Material). We compared previously reported 2,368 significant SUA-associated SNPs in a series of studies with our results. Although no genome-wide significant SNPs were identified in our study, we defined our SNPs with P < 0.05 as supportive to the reported SNPs. And 57 SNPs located in genes SLC2A9, ABCG2, LRRC16A, LOC107986260, GLUT9, SCGN, LOC107986971, TFCP2L1, TET2, KCNQ1, FRAS1, SLC16A9, RAF1P1, LOC100129344, LOC107986581, LRRC16A, LOC100287951, WDR1, PDZK1, and LOC107986260 could be replicated (Table S5 in Supplementary Material).
While no genes achieved genome-wide significance level, a total of 167 genes were observed to be nominally associated with SUA level (P < 0.05) from VEGAS2 analysis. Genes of TNRC6C-AS1, ZNF410, TNRC6C, FAM161B, PTGR2, SESTD1, RGS20, ENTPD5, EXOC3L2, DNAH3, and TMC6 had already been indicated in the SNPs-based analysis (Table 2), whereas the others were novel. The well-known urate transporter SLC2A9 gene was also identified. The top 20 genes ranked by P-values were listed in Table 3.
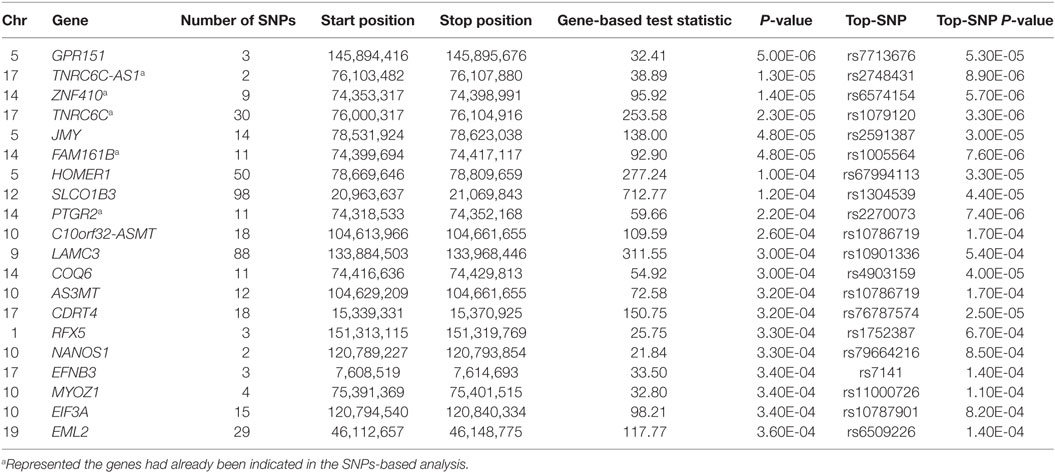
Table 3. The top 20 genes from Versatile Gene-based Association Study-2 gene-based analysis showing the strongest association with serum uric acid level.
In the gene sets-based analysis using GSEA program, one REACTOME gene set and 20 GO gene sets (FDR q-value < 0.01) were presented in Table 4. The only REACTOME pathway was transmembrane transport of small molecules (FDR q-value = 0.020). And the GO gene sets were involved in ion transport, regulation of catabolic process, transmembrane transporter activity, hydrolase activity acting on acid anhydrides, cellular process, regulation of immune system process, etc.
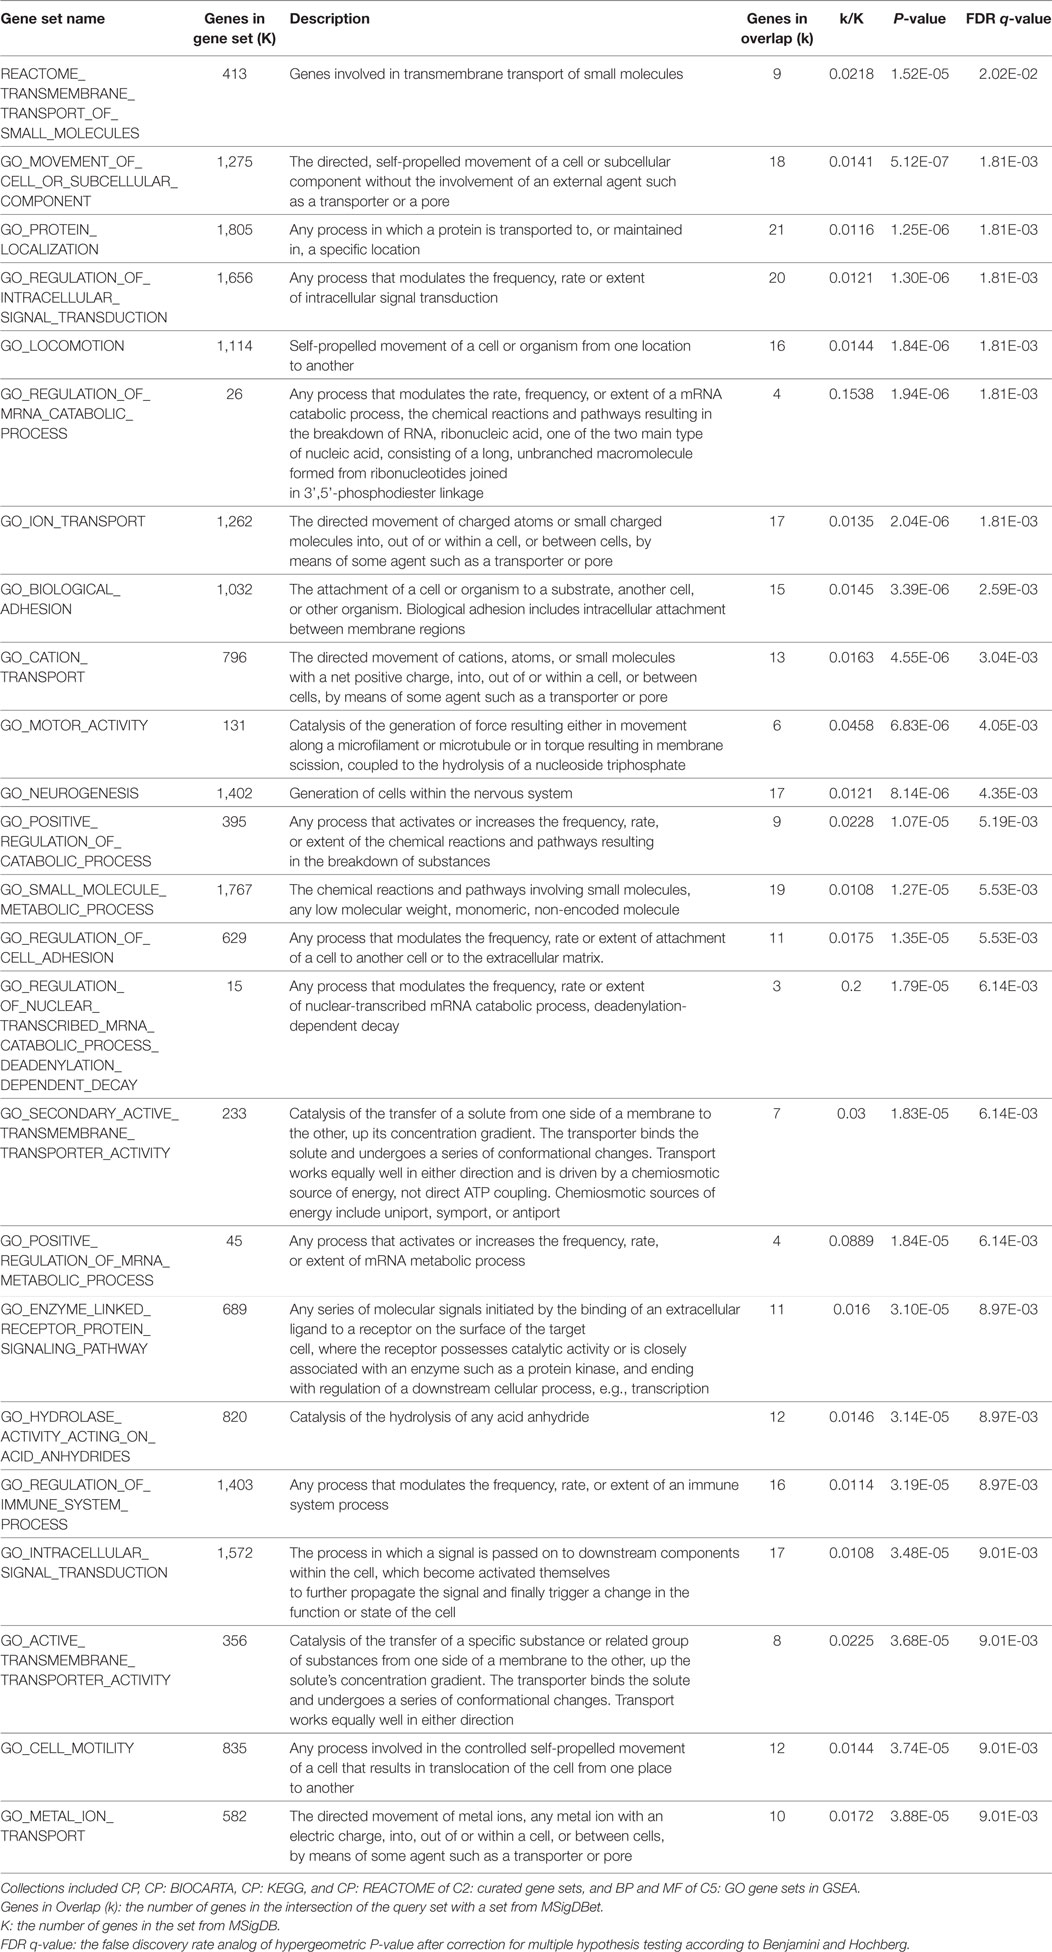
Table 4. The gene sets results-one REACTOME gene set and top 20 GO gene sets (FDR q-value < 0.01) using gene set enrichment analysis (GSEA) program.
Discussion
In this investigation based on 379 twin pairs, we explored the proportion of genetic sources in SUA variation, and confirmed the genetic variants underlying this trait by GWAS. The MZ twin correlation for SUA level was larger than for DZ twin, indicating the presence of genetic influence (Table S2 in Supplementary Material). In fitting the sex-limitation ACE models, the common effects sex-limitation model of dropping effects (Model II) was favored over the general model (Model I) (AIC = 443.56, P > 0.05), indicating that there was no evidence for sex-specific additive genetic effects. We then considered whether the common or shared environmental effects for males (Cm) (Model III) and further for females (Cf) (Model IV) could also be fixed to 0. However, the goodness-of-fit statistics indicated that these two models provided a significantly worse fit (P < 0.05). Thus, these two models were rejected and model II remained the favored one. Finally, we considered the scalar sex-limitation models (Model V and Model VI) by constraining the variance components of females to be equal to scalar multiples of the variance components of males. Both of the models provided a significantly worse fit than Model II (P < 0.05). Hence, we concluded that the Model II was the best fitting model, in which additive genetic parameter (A) explained larger proportion of SUA variation for females (46.3%) than for males (29.9%), whereas the environmental parameters together (C and E) explained smaller proportion (53.7 vs. 70.1%) (Table 1).
The sex-difference in the genetic and environmental effects on SUA variation obtained here was in line with the previous Boyle et al.’s genetic study. Based on a sample of 112 twin pairs, they also found a more significant genetic component in control of SUA variation in females than males, whereas a stronger role of environmental component in males (34). We speculated that the genetic architecture may indeed differ across sexes because of the sex differences in selective pressures during human evolution. Additional data from adopted twins and siblings reared together may be used to explore this hypothesis further.
Although no genome-wide significant SNPs were identified in GWAS, we found two promising genetic regions on chromosome 17 around rs2253277 (Figure 3) and chromosome 14 around rs11621523 (Figure 4). The PTGR2 and ENTPD5 genes around the rs11621523 have been emphasized for their roles in SUA level. Prostaglandin reductase 2 (PTGR2) is the enzyme involved in terminal inactivation of prostaglandins (35) which may contribute to renal uric acid metabolism (36, 37). Four highly correlated SNPs showing suggestive evidence of association with SUA level were detected within or near PTGR2 gene. The rs2270073 and rs2270074 were detected within a region with promoter histone marks in the 5’-UTR of PTGR2 gene and could change DNA motifs for DNA-binding proteins, which provided strong evidence for their regulatory effects on gene transcription (Table S4 in Supplementary Material). Additionally, rs11621523 and rs2159179, which were located in an intergenic region at 14q24.3 and closest to PTGR2 gene, should also be candidates to be further studied. The protein encoding by ENTPD5 gene was involved in the pathway of purine metabolism in which SUA was a by-product of oxidation. As SNP rs2336742 was located at the intronic region of ENTPD5 gene and could change its DNA motifs, it might be associated with purine metabolism as well as SUA level (Table S4 in Supplementary Material). However, the association of novel TNRC6C, TMC6, and TNRC6C-AS1 genes around the other SNP rs225327 with SUA level still needs to be validated. Finally, the enhancer of skeletal muscle was predicted by submitting the set of 25 query SNPs to HaploReg v4.1 (Table S3 in Supplementary Material). And the relationship between SUA level and skeletal muscle strength/volume has been fully researched currently (38–41).
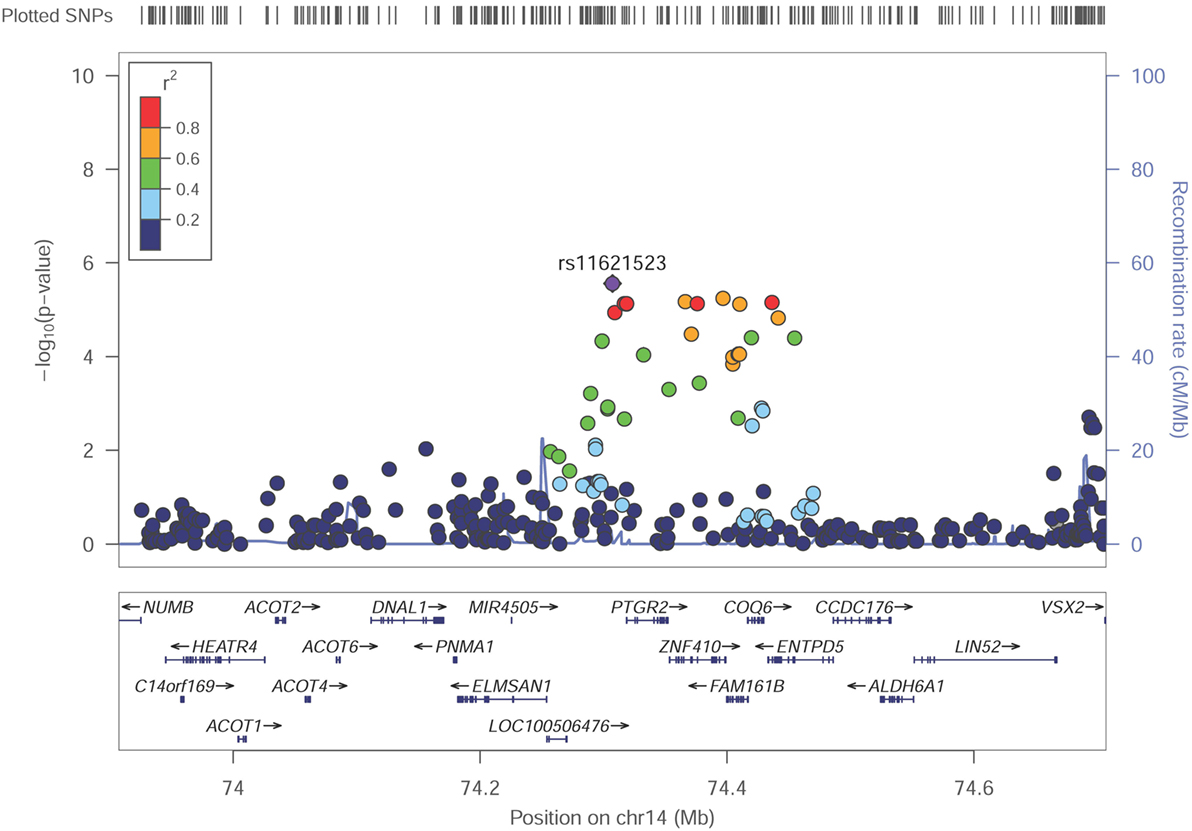
Figure 4. Regional association plot showing signal around chromosomal loci of 14q24.3 for genome-wide association study of serum uric acid (SUA) level. The strongest association was detected with rs11621523 in PTGR2 gene.
As additional replication, we compared the SUA-associated SNPs reported in a series of studies with ours (18, 42–59) (Table S5 in Supplementary Material). A list of SNPs could be replicated, especially the variants located in the well-known SUA-associated genes SLC2A9 and ABCG2. Notably, two SNPs rs2231142 (ABCG2) and rs10008015 (TET2) were also found by Yang et al. (58) and three SNPs rs11996526 (LOC107986971), rs4848700 (TFCP2L1), and rs179785 (KCNQ1) by Li et al. (49) in Chinese populations.
Even though none genome-wide significant genes were found, a total of 167 genes were observed to be nominally associated with SUA level (P < 0.05) from VEGAS2 analysis. The results of GO gene sets from using GSEA program indicated that these genes might be associated with process of generation, catabolism, transport, intracellular signal transduction, and hydrolase activity during SUA metabolism. Besides, several genes were enriched in pathway of transmembrane transport of small molecules, including solute carrier family (SLC14A2, SLC22A1, SLC2A9, SLC5A3, SLCO1B3, and SLC12A5) and ATPase family (ATP6V1H and ATP11B), which strengthened their significance in regulating SUA transport process and thus further influencing SUA level (Table 4). Except for the PTGR2 and ENTPD5 genes being abovementioned, the GPR151 gene should be also noted. This gene encodes an orphan member of the class A rhodopsin-like family of G protein-coupled receptors (GPCRs) and thus influences the GPCRs activity. And the GPCRs could regulate the assembly of a multienzyme complex for purine biosynthesis (60). The association of well-known urate transporter gene SLC2A9 (P = 0.001) with SUA level has previously been reported (61, 62). Other genes were of unknown function in terms of SUA level or purine metabolism currently, whereas they may also be interesting potential candidates to be future researched and validated, especially the top 20 genes (Table 3).
Several strengths must be noticed in our study. First, our results based on the twin data of SUA level would be credible. Phenotype variation may be under the effect of subjects’ genetic background, age, gender, and environmental exposures as well as some experimental variables related to sampling, processing, and data analysis. Genetically related individuals, such as twin pairs, would highly confer increased power in genetic association analysis and efficiently identify genetic variants underlying human complex diseases (20). Second, given the various genetic constitutions and multitude of life style among different ethnic populations in the world, this is the first GWAS conducted in the sample of middle and old-aged Chinese twins.
Nevertheless, our study has potential limitations as well. First, our study was with relatively small sample size and limited statistical power resulting from the challenges of identifying and recruiting qualified twin pairs. The results presented here, however, provided a useful reference for hypotheses to be further replicated and validated for exploring increased SUA level. Given the genetic effect on SUA variation is expected to comprise a large number of SNPs possessing very small effect size, a meta-analysis with larger samples will be desirable and ideal. Second, even though we replicated parts of our GWAS results by comparing with results generated from external and independent datasets, most of the SNPs didnot reach the genome-wide significance level. In addition, as no other study has explored the differential expressed genes based on SUA-discordant samples, we cannot yet validate our findings further.
In summary, we have confirmed that genetic factors are significant in explaining SUA level variability through twin modeling. Two novel suggestive regions located at chromosomes 17 and 14 were identified. Twenty-five SNPs reached suggestive evidence level of association with SUA and most of them could have regulatory effects on gene transcription, and 167 genes nominally associated with SUA level were involved in significant biological functions related to uric acid generating and metabolism. The potential candidate biomarkers of SUA level reported here should merit further verifications.
Data Availability Statements
The SNPs datasets for this study have been deposited in the European Variation Archive (EVA) (Accession No. PRJEB23749).
Ethics Statement
All participants provided written informed consent for participating in the study which was approved by the local ethics committee at Qingdao CDC, Qingdao, China.
Author Contributions
DZ and WW contributed to the conception and design. HD and CX organized the collection of samples and phenotypes. WW and YW contributed to sample data and sequencing data management. QT and SL analyzed the sequencing data and WW and CX interpreted the analysis results. WW and DZ drafted the manuscript, YW and HD were involved in the discussion, and QT, SL, and DZ revised it. All the authors read the manuscript and gave the final approval of the version to be published. All the authors agreed to be accountable for all aspects of the work.
Conflict of Interest Statement
The authors declare that the research was conducted in the absence of any commercial or financial relationships that could be construed as a potential conflict of interest.
Acknowledgments
We thank Weilong Li and Jesper Lund for their help on the installation and application of related software and the corresponding results interpretation.
Funding
This study was supported by the grants from the National Natural Science Foundation of China (31371024), the EFSD/CDS/Lilly Programme award (2013), and the project of training and studying abroad for full-time doctoral candidate in Faculty of Medicine in Qingdao University.
Supplementary Material
The Supplementary Material for this article can be found online at http://www.frontiersin.org/articles/10.3389/fendo.2018.00075/full#supplementary-material.
Abbreviations
BMI, body mass index; DZ, dizygotic; GSEA, gene set enrichment analysis; GWAS, genome-wide association study; MZ, monozygotic; SUA, serum uric acid; VEGAS2, Versatile Gene-based Association Study-2.
Footnotes
References
1. Fathallah-Shaykh SA, Cramer MT. Uric acid and the kidney. Pediatr Nephrol (2014) 29:999–1008. doi:10.1007/s00467-013-2549-x
2. Johnson RJ. Why focus on uric acid? Curr Med Res Opin (2015) 31:3–7. doi:10.1185/03007995.2015.1087979
3. Bjornstad P, Lanaspa MA, Ishimoto T, Kosugi T, Kume S, Jalal D, et al. Fructose and uric acid in diabetic nephropathy. Diabetologia (2015) 58:1993–2002. doi:10.1007/s00125-015-3650-4
4. Lima WG, Martins-Santos MES, Chaves VE. Uric acid as a modulator of glucose and lipid metabolism. Biochimie (2015) 116:17–23. doi:10.1016/j.biochi.2015.06.025
5. Shokoufeh B, Banafsheh K. Association of serum uric acid and metabolic syndrome in type 2 diabetes. Curr Diabetes Rev (2014) 10:113–7. doi:10.2174/1573399810666140228160938
6. Sophia M, Kali M, Theodoros T, Anargyros K, Leonidas Z, Apostolos A. The involvement of uric acid in the pathogenesis of preeclampsia. Curr Hypertens Rev (2015) 11:110–5. doi:10.2174/1573402111666150529130703
7. Fenech G, Rajzbaum G, Mazighi M, Blacher J. Serum uric acid and cardiovascular risk: state of the art and perspectives. Joint Bone Spine (2014) 81:392–7. doi:10.1016/j.jbspin.2014.01.008
8. Johnson RJ, Nakagawa T, Sanchez-Lozada LG, Shafiu M, Sundaram S, Le M, et al. Sugar, uric acid, and the etiology of diabetes and obesity. Diabetes (2013) 62:3307–15. doi:10.2337/db12-1814
9. Liu R, Han C, Wu D, Xia X, Gu J, Guan H, et al. Prevalence of hyperuricemia and gout in mainland China from 2000 to 2014: a systematic review and meta-analysis. Biomed Res Int (2015) 2015:762820. doi:10.1155/2015/762820
10. Ji F, Ning F, Duan H, Kaprio J, Zhang D, Zhang D, et al. Genetic and environmental influences on cardiovascular disease risk factors: a study of Chinese twin children and adolescents. Twin Res Hum Genet (2014) 17:72–9. doi:10.1017/thg.2014.5
11. Nath SD, Voruganti VS, Arar NH, Thameem F, Lopez-Alvarenga JC, Bauer R, et al. Genome scan for determinants of serum uric acid variability. J Am Soc Nephrol (2007) 18:3156–63. doi:10.1681/asn.2007040426
12. Rule AD, Fridley BL, Hunt SC, Asmann Y, Boerwinkle E, Pankow JS, et al. Genome-wide linkage analysis for uric acid in families enriched for hypertension. Nephrol Dial Transplant (2009) 24:2414–20. doi:10.1093/ndt/gfp080
13. Tang WH, Miller MB, Rich SS, North KE, Pankow JS, Borecki IB, et al. Linkage analysis of a composite factor for the multiple metabolic syndrome – the National Heart, Lung, and Blood Institute family heart study. Diabetes (2003) 52:2840–7. doi:10.2337/diabetes.52.11.2840
14. Voruganti VS, Goring HHH, Mottl A, Franceschini N, Haack K, Laston S, et al. Genetic influence on variation in serum uric acid in American Indians: the strong heart family study. Hum Genet (2009) 126:667–76. doi:10.1007/s00439-009-0716-8
15. Voruganti VS, Nath SD, Cole SA, Thameem F, Jowett JB, Bauer R, et al. Genetics of variation in serum uric acid and cardiovascular risk factors in Mexican Americans. J Clin Endocrinol Metab (2009) 94:632–8. doi:10.1210/jc.2008-0682
16. Yang Q, Guo CY, Cupples LA, Levy D, Wilson PW, Fox CS. Genome-wide search for genes affecting serum uric acid levels: the Framingham heart study. Metabolism (2005) 54:1435–41. doi:10.1016/j.metabol.2005.05.007
17. Giri AK, Banerjee P, Chakraborty S, Kauser Y, Undru A, Roy S, et al. Genome wide association study of uric acid in Indian population and interaction of identified variants with Type 2 diabetes. Sci Rep (2016) 6:21440. doi:10.1038/srep21440
18. Kottgen A, Albrecht E, Teumer A, Vitart V, Krumsiek J, Hundertmark C, et al. Genome-wide association analyses identify 18 new loci associated with serum urate concentrations. Nat Genet (2013) 45:145–54. doi:10.1038/ng.2500
19. Mandal AK, Mount DB. The molecular physiology of uric acid homeostasis. Annu Rev Physiol (2015) 77:323–45. doi:10.1146/annurev-physiol-021113-170343
20. Tan Q, Li W, Vandin F. Disease-concordant twins empower genetic association studies. Ann Hum Genet (2017) 81:20–6. doi:10.1111/ahg.12181
21. Xu C, Zhang D, Tian X, Duan H, Wu Y, Pang Z, et al. Genetic and environmental influences on correlations between hearing and cognitive functions in middle and older Chinese twins. Twin Res Hum Genet (2017) 20(5):374–9. doi:10.1017/thg.2017.42
22. Xu C, Zhang D, Tian X, Wu Y, Pang Z, Li S, et al. Genetic and environmental basis in phenotype correlation between physical function and cognition in aging Chinese twins. Twin Res Hum Genet (2017) 20:60–5. doi:10.1017/thg.2016.98
23. Becker A, Busjahn A, Faulhaber HD, Bahring S, Robertson J, Schuster H, et al. Twin zygosity. Automated determination with microsatellites. J Reprod Med (1997) 42:260–6.
24. Tomsey CS, Kurtz M, Kist F, Hockensmith M, Call P. Comparison of PowerPlex 16, PowerPlex1.1/2.1, and ABI AmpfISTR Profiler Plus/COfiler for forensic use. Croat Med J (2001) 42:239–43.
25. Zhou X, Stephens M. Genome-wide efficient mixed-model analysis for association studies. Nat Genet (2012) 44:821–4. doi:10.1038/ng.2310
27. Dudbridge F, Gusnanto A. Estimation of significance thresholds for genomewide association scans. Genet Epidemiol (2008) 32:227–34. doi:10.1002/gepi.20297
28. Ward LD, Kellis M. HaploReg: a resource for exploring chromatin states, conservation, and regulatory motif alterations within sets of genetically linked variants. Nucleic Acids Res (2012) 40:D930–4. doi:10.1093/nar/gkr917
29. Ward LD, Kellis M. HaploReg v4: systematic mining of putative causal variants, cell types, regulators and target genes for human complex traits and disease. Nucleic Acids Res (2016) 44:D877–81. doi:10.1093/nar/gkv1340
30. Liu JZ, McRae AF, Nyholt DR, Medland SE, Wray NR, Brown KM, et al. A versatile gene-based test for genome-wide association studies. Am J Hum Genet (2010) 87:139–45. doi:10.1016/j.ajhg.2010.06.009
31. Mishra A, Macgregor S. VEGAS2: software for more flexible gene-based testing. Twin Res Hum Genet (2015) 18:86–91. doi:10.1017/thg.2014.79
32. Mootha VK, Lindgren CM, Eriksson KF, Subramanian A, Sihag S, Lehar J, et al. PGC-1alpha-responsive genes involved in oxidative phosphorylation are coordinately downregulated in human diabetes. Nat Genet (2003) 34:267–73. doi:10.1038/ng1180
33. Subramanian A, Tamayo P, Mootha VK, Mukherjee S, Ebert BL, Gillette MA, et al. Gene set enrichment analysis: a knowledge-based approach for interpreting genome-wide expression profiles. Proc Natl Acad Sci U S A (2005) 102:15545–50. doi:10.1073/pnas.0506580102
34. Boyle JA, Greig WR, Jasani MK, Duncan A, Diver M, Buchanan WW. Relative roles of genetic and environmental factors in the control of serum uric acid levels in normouricaemic subjects. Ann Rheum Dis (1967) 26:234–8. doi:10.1136/ard.26.3.234
35. Wu YH, Ko TP, Guo RT, Hu SM, Chuang LM, Wang AH. Structural basis for catalytic and inhibitory mechanisms of human prostaglandin reductase PTGR2. Structure (2008) 16:1714–23. doi:10.1016/j.str.2008.09.007
36. Satoh N, Kikuchi K, Hasegawa T, Komura H, Suzuki S, Ohtomo T, et al. The role of the renal dopaminergic and the prostaglandin systems in renal uric acid metabolism in patients with essential hypertension. Nihon Naibunpi Gakkai Zasshi (1991) 67:1271–81.
37. Wu SH, Shu XO, Milne G, Xiang YB, Zhang X, Cai Q, et al. Uric acid correlates to oxidation and inflammation in opposite directions in women. Biomarkers (2015) 20:225–31. doi:10.3109/1354750x.2015.1068852
38. Beavers KM, Beavers DP, Serra MC, Bowden RG, Wilson RL. Low relative skeletal muscle mass indicative of sarcopenia is associated with elevations in serum uric acid levels: findings from NHANES III. J Nutr Health Aging (2009) 13:177–82. doi:10.1007/s12603-009-0054-5
39. Dong XW, Tian HY, He J, Wang C, Qiu R, Chen YM. Elevated serum uric acid is associated with greater bone mineral density and skeletal muscle mass in middle-aged and older adults. PLoS One (2016) 11:e0154692. doi:10.1371/journal.pone.0154692
40. Huang C, Niu K, Kobayashi Y, Guan L, Momma H, Cui Y, et al. An inverted J-shaped association of serum uric acid with muscle strength among Japanese adult men: a cross-sectional study. BMC Musculoskelet Disord (2013) 14:258. doi:10.1186/1471-2474-14-258
41. Kuriyama S, Nakano T, Maruyama Y, Sugano N, Takane K, Suetsugu Y, et al. Relationship between serum uric acid levels and muscle strength/volume: a new insight from a large-scale survey. Nihon Jinzo Gakkai Shi (2014) 56:1260–9.
42. Charles BA, Shriner D, Doumatey A, Chen G, Zhou J, Huang H, et al. A genome-wide association study of serum uric acid in African Americans. BMC Med Genomics (2011) 4:17. doi:10.1186/1755-8794-4-17
43. Chen MH, Huang J, Chen WM, Larson MG, Fox CS, Vasan RS, et al. Using family-based imputation in genome-wide association studies with large complex pedigrees: the Framingham heart study. PLoS One (2012) 7:e51589. doi:10.1371/journal.pone.0051589
44. Chen MH, Larson MG, Hsu YH, Peloso GM, Guo CY, Fox CS, et al. A three-stage approach for genome-wide association studies with family data for quantitative traits. BMC Genet (2010) 11:40. doi:10.1186/1471-2156-11-40
45. Cummings N, Dyer TD, Kotea N, Kowlessur S, Chitson P, Zimmet P, et al. Genome-wide scan identifies a quantitative trait locus at 4p15.3 for serum urate. Eur J Hum Genet (2010) 18:1243–7. doi:10.1038/ejhg.2010.97
46. Dehghan A, Kottgen A, Yang Q, Hwang SJ, Kao WL, Rivadeneira F, et al. Association of three genetic loci with uric acid concentration and risk of gout: a genome-wide association study. Lancet (2008) 372:1953–61. doi:10.1016/s0140-6736(08)61343-4
47. Huffman JE, Albrecht E, Teumer A, Mangino M, Kapur K, Johnson T, et al. Modulation of genetic associations with serum urate levels by body-mass-index in humans. PLoS One (2015) 10:e0119752. doi:10.1371/journal.pone.0119752
48. Karns R, Zhang G, Sun G, Rao Indugula S, Cheng H, Havas-Augustin D, et al. Genome-wide association of serum uric acid concentration: replication of sequence variants in an island population of the Adriatic coast of Croatia. Ann Hum Genet (2012) 76:121–7. doi:10.1111/j.1469-1809.2011.00698.x
49. Li C, Li Z, Liu S, Wang C, Han L, Cui L, et al. Genome-wide association analysis identifies three new risk loci for gout arthritis in Han Chinese. Nat Commun (2015) 6:7041. doi:10.1038/ncomms8041
50. Li WD, Jiao H, Wang K, Zhang CK, Glessner JT, Grant SF, et al. A genome wide association study of plasma uric acid levels in obese cases and never-overweight controls. Obesity (Silver Spring) (2013) 21:E490–4. doi:10.1002/oby.20303
51. Matsuo H, Yamamoto K, Nakaoka H, Nakayama A, Sakiyama M, Chiba T, et al. Genome-wide association study of clinically defined gout identifies multiple risk loci and its association with clinical subtypes. Ann Rheum Dis (2016) 75:652–9. doi:10.1136/annrheumdis-2014-206191
52. McArdle PF, Parsa A, Chang YP, Weir MR, O’Connell JR, Mitchell BD, et al. Association of a common nonsynonymous variant in GLUT9 with serum uric acid levels in old order Amish. Arthritis Rheum (2008) 58:2874–81. doi:10.1002/art.23752
53. Nakayama A, Nakaoka H, Yamamoto K, Sakiyama M, Shaukat A, Toyoda Y, et al. GWAS of clinically defined gout and subtypes identifies multiple susceptibility loci that include urate transporter genes. Ann Rheum Dis (2017) 76:869–77. doi:10.1136/annrheumdis-2016-209632
54. Shin J, Kim Y, Kong M, Lee C. Genetic architecture for susceptibility to gout in the KARE cohort study. J Hum Genet (2012) 57:379–84. doi:10.1038/jhg.2012.39
55. Vitart V, Rudan I, Hayward C, Gray NK, Floyd J, Palmer CN, et al. SLC2A9 is a newly identified urate transporter influencing serum urate concentration, urate excretion and gout. Nat Genet (2008) 40:437–42. doi:10.1038/ng.106
56. Voruganti VS, Laston S, Haack K, Mehta NR, Cole SA, Butte NF, et al. Serum uric acid concentrations and SLC2A9 genetic variation in Hispanic children: the viva la familia study. Am J Clin Nutr (2015) 101:725–32. doi:10.3945/ajcn.114.095364
57. Wallace C, Newhouse SJ, Braund P, Zhang F, Tobin M, Falchi M, et al. Genome-wide association study identifies genes for biomarkers of cardiovascular disease: serum urate and dyslipidemia. Am J Hum Genet (2008) 82:139–49. doi:10.1016/j.ajhg.2007.11.001
58. Yang B, Mo Z, Wu C, Yang H, Yang X, He Y, et al. A genome-wide association study identifies common variants influencing serum uric acid concentrations in a Chinese population. BMC Med Genomics (2014) 7:10. doi:10.1186/1755-8794-7-10
59. Yang Q, Wu H, Guo CY, Fox CS. Analyze multivariate phenotypes in genetic association studies by combining univariate association tests. Genet Epidemiol (2010) 34:444–54. doi:10.1002/gepi.20497
60. Verrier F, An S, Ferrie AM, Sun H, Kyoung M, Deng H, et al. GPCRs regulate the assembly of a multienzyme complex for purine biosynthesis. Nat Chem Biol (2011) 7:909–15. doi:10.1038/nchembio.690
61. Merriman TR. An update on the genetic architecture of hyperuricemia and gout. Arthritis Res Ther (2015) 17:98. doi:10.1186/s13075-015-0609-2
Keywords: Chinese twins, gene-based test, genome-wide association study, heritability, serum uric acid
Citation: Wang W, Zhang D, Xu C, Wu Y, Duan H, Li S and Tan Q (2018) Heritability and Genome-Wide Association Analyses of Serum Uric Acid in Middle and Old-Aged Chinese Twins. Front. Endocrinol. 9:75. doi: 10.3389/fendo.2018.00075
Received: 10 December 2017; Accepted: 19 February 2018;
Published: 06 March 2018
Edited by:
Ken Ong, Medical Research Council, United KingdomReviewed by:
Eusebio Chiefari, Università degli Studi Magna Graecia di Catanzaro, ItalyConsolato Sergi, University of Alberta Hospital, Canada
Copyright: © 2018 Wang, Zhang, Xu, Wu, Duan, Li and Tan. This is an open-access article distributed under the terms of the Creative Commons Attribution License (CC BY). The use, distribution or reproduction in other forums is permitted, provided the original author(s) and the copyright owner are credited and that the original publication in this journal is cited, in accordance with accepted academic practice. No use, distribution or reproduction is permitted which does not comply with these terms.
*Correspondence: Dongfeng Zhang, zhangdf1961@126.com