 Tingting Wang
 Xuan Wang1,2
 Gen He
- 1Key Laboratory of Aquaculture Nutrition, Ministry of Agriculture, Ocean University of China, Qingdao, China
- 2Key Laboratory of Mariculture, Ministry of Education, Ocean University of China, Qingdao, China
- 3Laboratory for Marine Fisheries Science and Food Production Processes, Qingdao National Laboratory for Marine Science and Technology, Qingdao, China
Searching for nutraceuticals and understanding the underlying mechanism that promote fish growth is at high demand for aquaculture industry. In this study, the modulatory effects of soy phosphatidic acids (PA) on cell proliferation, nutrient sensing, and metabolic pathways were systematically examined in primary muscle cells of turbot (Scophthalmus maximus). PA was found to stimulate cell proliferation and promote G1/S phase transition through activation of target of rapamycin signaling pathway. The expression of myogenic regulatory factors, including myoD and follistatin, was upregulated, while that of myogenin and myostatin was downregulated by PA. Furthermore, PA increased intracellular free amino acid levels and enhanced protein synthesis, lipogenesis, and glycolysis, while suppressed amino acid degradation and lipolysis. PA also was found to increased cellular energy production through stimulated tricarboxylic acid cycle and oxidative phosphorylation. Our results identified PA as a potential nutraceutical that stimulates muscle cell proliferation and anabolism in fish.
Introduction
Fish grow in unique features among vertebrates. Specifically, most fish grow indeterminately and a significant portion of muscle fibers was formed during juvenile period through long-lasting hyperplastic growth (form more muscle cells) (1, 2) in addition to hypertrophic growth (increase in muscle fiber size), which is the predominant pattern in other vertebrates postnatally (3). This is both of biological interest and economical importance for commercial aquaculture. However, understanding the underlying mechanism of fish muscle cell growth and proliferation is still very limited.
Cell proliferation and growth are tightly regulated by extracellular cues and intracellular metabolites (4). Cells uptake and utilize extracellular nutrients to provide energy and building blocks for proliferation (5), while growth factors provide stimulus to switch between resting and proliferative states (6). Intracellular kinases such as target of rapamycin (TOR) sense the nutritional status and direct how biosynthetic intermediates are used and whether the cell should arrest, grow, or divide (7–10). The molecular integrations of nutrient, biosynthetic intermediates, and energy balance to the core cell cycle machinery have been the focus of many studies (4, 11, 12). TOR, the mitogen-activated protein kinase/extracellular signal-regulated protein kinase (9, 13–15), and phosphoinositide 3-kinase (PI3K)–Akt pathways were found to be involved in cell proliferation and growth control (16–18). The changes of these signaling pathways regulate the levels and activities of cyclins and cyclin-dependent kinases (CDKs), which phosphorylate retinoblastoma protein (Rb) and push the cell into S phase of the division cycle (19–21).
In fish, studies have demonstrated that growth hormone/insulin-like growth factor (IGF) and amino acids stimulated myocyte proliferation in gilthead sea bream, Atlantic salmon, and rainbow trout (22–30). IGF1 receptors express at high levels in muscle tissues and their downstream actions are mainly mediated through PI3K–Akt pathway in fish (17). TOR signaling plays a critical role in sensing intracellular amino acid levels and accretion of myofibrillar proteins in rainbow trout and fine flounders (31, 32). Its inhibition decreased muscle and body growth in fine flounder and turbot (33, 34). However, studies are still very rare in the identification of dietary supplements that can modulate the related pathways and promote fish growth.
Phosphatidic acid (PA) is one of the most important glycerophospholipids found in biomembranes (35). PA has different roles in the cell. For example, it is a precursor for other lipids such as phosphatidylserine or phosphatidylcholine (36). It also influences membrane curvature and acts as signaling lipid (35). PA can be either synthesized endogenously by enzymes such as phospholipase D (37) or obtained from food supplements such as soy lecithins (38). Oral administration of PA stimulated muscle protein synthesis in rat (39) and enhanced muscle thickness in resistance-trained individuals (36). Studies have shown that PA can directly bind and activate TOR and induce muscle fiber hypertrophy in mammals (36, 40, 41). It will be particularly interesting to examine the effects of PA on fish species such as turbot, whose growth is predominantly hyperplastic during juvenile stage (42). Thus, the aim of this research is to systematically examine the effects of PA on cell proliferation and metabolism in turbot primary muscle cells.
Materials and Methods
Primary Culture of Turbot Muscle Cells
All animal care and handling procedures in this study were approved by the Animal Care Committee of Ocean University of China. The turbot primary cell culture was generated as described before (43, 44). For each culture, 6–10 turbots weighed approximately 10–15 g were sacrificed and immersed in 75% alcohol for 30 s, and then rinsed by sterilized Dulbecco’s phosphate-buffered saline (DPBS) with 400 U/ml penicillin and 400 µg/ml streptomycin (GIBCO: 15240–112). White dorsal muscle was excised and collected in cold Leibowitz’s L-15 Medium (Sigma: L5520) with antibiotics. The tissue was cut into 1.0 mm3 pieces using sterilized stainless steel scissors and forceps. The tissue pieces were centrifuged at 300 g for 1 min to collect the pellet and then resuspended in L-15 medium. This operation was repeated for three times and then the pellet was resuspended in 0.1% trypsin in L-15medium. Enzymatic digestion was performed for 10 min at room temperature with gentle agitation and centrifuged for 1 min at 300 g. The supernatant was diluted with cold L-15 medium with 10% serum to block trypsin activity. The tissue fragments were subjected to a second trypsin digestion. The supernatants were pooled, filtered through a 100-µm nylon cell strainer, and centrifuged at 300 g for 20 min. The pellet was resuspended in growth medium [L-15 medium with 10% serum, 1% antibiotics (penicillin 100 U/ml, streptomycin 100 µg/ml) with 20 mM HEPES, 2 mM GlutaMAX™, and 2.5 ng/ml fibroblast growth factor. The medium osmolarity is 398–420 mOsm/kg]. The cell culture was maintained at 24°C in a humidified incubator without CO2. Observations of morphology were regularly made to monitor the status of the cells.
Cell Treatment
Cells were seeded at a density of 106 cells/ml for experiments except cell proliferation analysis. After 2 days of culture, the cells were incubated in serum-starved medium for 12 h and treated with experimental mediums for 16 h before lysis. PA was bought from Avanti (Cat. no. 840074). A stock solution (10 mM) in DPBS was prepared by sonication as described elsewhere (45, 46). The serum-starved medium was prepared with 20 mM HEPES, 2 mM GlutaMAX™ in L-15 medium and the experimental medium was prepared with 20 mM HEPES, 2 mM GlutaMAX™ in L-15 medium with indicated concentrations of PA. All cell culture experiments were repeated at least three times.
Cell Proliferation Analysis
Mitogenic response of cells to PA was determined by the CyQUANT™ Cell Proliferation Assay Kit (Molecular Probes, USA) (Cat. no. 7026) according to the manufacturer’s instructions. Cells (2 × 10⁴ cells/well) were seeded in 96-well black plates (Corning Inc.) and treated with various concentrations of PA at 0, 2, 5, 10, and 50 µM for 16 h. The cell medium was then removed and the cell pellet was stored at −80°C. For the assay, cells were lysed, and total cellular nucleic acid was measured using florescence at 520 nm emission after excitation at 480 nm with a fluorometer (spectraMax i3x, Molecular Devices, USA). Each treatment was repeated for three times.
Cell Cycle and Newly Synthesized DNA Analysis
Cell cycle and newly synthesized DNA were analyzed based on the methods described before (47, 48) with some modifications. Briefly, after treatment, cells were washed twice with DPBS and fixed with 75% cold ethanol at 4°C overnight. Afterward, cells were centrifuged at 200 g for 5 min and resuspended with 1 ml DPBS, followed by incubation with 50 µg/ml RNaseA (Invitrogen, USA) (Cat. no. 1692412), and 50 µg/ml propidium iodide (PI) (Life Technologies™, USA) (Cat. no. 3566) for 30 min. For newly synthesized DNA analysis, cells were incubated with 10 µM 5-ethynyl-2′-deoxyuridine (EdU) and processed according to the manufacturer’s instructions of Click-iT™ Plus EdU Alexa Fluor™ Flow Cytometry Assay Kit (Invitrogen, USA) (Cat. no. 10634) and proceed to the next step for staining the cells for DNA content by PI. To examine the newly synthesized DNA, double staining was conducted using PI with EdU, which was incorporated into DNA during active DNA synthesis and coupled to fluorescent dye that can be detected by different excitation and emission filter from PI (49). Cell cycle and newly synthesized DNA was determined by flow cytometry (Beckman Coulter FC 500 MPL).
Nonradioactive Measurements of Protein Synthesis With SUnSET
Turbot primary muscle cells were cultured and treated as described above. Protein synthesis was analyzed based on the methods described before with some modifications (50). Briefly, during the last 30 min of the treatment, cells were changed to experimental mediums with 1 µM puromycin (Thermo Fisher Scientific, USA, A1113802). The cells were then harvested and analyzed by Western blot with antibody against puromycin (Millipore, USA, MABE343).
Measurement of Intracellular Free Amino Acids
The concentrations of intracellular free amino acids were measured based on the methods described before (44). Briefly, after PA treatment, cells were rapidly washed with cold DPBS twice and chilled with 2 ml cold methanol on dry ice. Cells were collected with a rubber tipped cell scraper and transferred to liquid nitrogen for 10 min, thawed on ice for 10 min, and briefly vortexed. This freeze–thaw cycle was repeated three times for complete cell disruption. The samples were centrifuged at 4°C at 3,000 g for 30 min and the supernatant was collected. The pellet was lysed in 1 ml of lysis buffer (50 mM Tris, 150 NaCl, 0.5% Nonidet P-40, 0.1% SDS, 1 mM EDTA, pH 7.4, with protease inhibitor cocktail) and the protein concentration was quantitated using a BCA Protein Assay Kit (Beyotime Biotechnology) according to the manufacturer’s instructions. After sample normalization based on total protein levels, the collected supernatant was de-proteinized by mixing with equal volume of 10% sulfosalicylic acid and incubated on ice for 15 min. After centrifugation at 15,000 g for 15 min, 1 ml of supernatant was filtered through 0.22-µm filters for free amino acid measurement using an automatic amino acid analyzer (L-8900, HITACHI, Japan).
Western Blot Analysis
Cells were rinsed twice with ice-cold DPBS and lysed in ice-cold RIPA buffer composed of 50 mM Tris, 150 mM NaCl, 0.5% Nonidet P-40, 0.1% SDS, 1 mM EDTA, pH 7.4, with protease and phosphatase inhibitor cocktail (Roche). The cell lysate was collected after centrifugation at 12,000 g for 20 min at 4°C. Protein concentration was determined by a BCA Protein Assay Kit according to the manufacturer’s instructions. After normalization, samples (10 µg of protein) were separated by 12% SDS-PAGE gel for 1 h at 150 V and then transferred to a 0.45-µm polyvinylidene difluoride membrane (PVDF) (Millipore) for 1 h at 100 V. After transfer, the membrane was blocked with 5% nonfat milk in TBST for 1 h and incubated with primary antibodies overnight at 4°C, followed by secondary antibodies for 1 h, and developed with ECL Reagents (Beyotime Biotechnology). Antibodies against S6 kinase (Cat. no. 9202), phospho-S6k (Thr389) (Cat. no. 9205), Akt (Cat. no. 9272), phospho-Akt (Ser473, Ser308) (Cat. no. 9271,9275), S6 (Cat. no. 2217), phospho-S6 (Ser240/244), mTOR (Cat. no. 2972), phospho-mTOR (Thr2448), Erk (Cat. no. 9102), phospho-Erk (Cat. no. 9101), 4EBP1 (Cat. no. 9644), phospho-4EBP1 (Thr37/46) (Cat. no. 9459), phosphor-eIF2α (Cat. no. 3597), eIF2α (Cat. no. 9722), Rb (Cat. no. 9313), phospho-Rb (Ser807/811) (Cat. no. 8516), and β-tubulin (Cat. no. 2148) were from Cell Signaling Technology Inc. Cdk2 (Cat. no. 6248), Cyclin E (Cat. no. 48420), and minichromosome maintenance protein 2 (Mcm2) (Cat. no. 373702) antibodies were from Santa Cruz Biotechnology Inc. All these antibodies were developed using antigenic regions completely conserved in turbot, and many had been successfully used in turbot as reported before (34, 44, 51). All experiments were repeated at least three times. The densities of the protein bands were normalized to that of β-tubulin, which served as an inner control. All the band intensities were quantified using NIH Image 1.63 software.
Quantitative Real-Time PCR (qRT-PCR)
For qRT-PCR, cells were lysed with Trizol Reagent (Invitrogen, USA) according to the manufacturer’s instructions. The extracted RNA was quantified by Nanodrop 2000 spectrophotometer (Thermo Fisher Scientific, USA), and the integrity was examined by 1% denatured agarose gel electrophoresis. The genomic DNA was removed and single-stranded cDNA was synthesized using a PrimeScript® RT Reagent Kit with gDNA Eraser (Takara, Japan). The qRT-PCR analysis was conducted as described (52). All primer sequences of target genes were listed in Table S1 in Supplementary Material and many had been published previously (34, 44, 51, 53). To calculate the expression levels of target genes, results were normalized to RNA polymerase II subunit D (rpsd), as no expression changes of rpsd were observed in turbot primary muscle cells among treatments. The qRT-PCR was carried out in a quantitative thermal cycler Mastercycler ep realplex (Eppendorf, Germany). SYBR Green Real-Time PCR Kit (Takara, Japan) was used. The program was set at 95°C for 5 min, followed by 40 cycles of 95°C for 5 s, 58°C for 15 s, and 72°C for 20 s, and a final extension step at 72°C for 5 min. The melting curve was performed after the amplification phase for confirmation of the product specificity. Target gene expression levels were quantitated by the 2−ΔΔCt method (54). The data were reported as fold increase of the control (without PA stimulation).
Statistical Analysis
Each value is expressed as mean ± SEM. All statistical evaluations were analyzed using the software SPSS 22.0.0.0. Comparison of data from two treatments was performed by independent samples t tests. The effects of PA and rapamycin treatment and their interactions were analyzed by two-way ANOVA. Tukey’s multiple range tests were used to examine treatment differences among the interactions. When the interaction was significant, the results were further analyzed using one-way ANOVA and Turkey’s multiple range test. Prior to the statistical tests, data were examined for homogeneity of variances (F-test). Differences were regarded as significance when P < 0.05.
Results
PA Induced Cell Proliferation
The cell proliferation of turbot primary muscle cells was stimulated by PA in a dose-dependent manner (Figure 1A). The cell proliferation rate was increased 35.7 ± 8.8% compared with control after cells were treated with 50 µM PA for 16 h. As biomarkers for cell proliferation, the protein level of Mcm2 was increased 40.8 ± 12.0% (Figure 1B; P < 0.01), while the mRNA level of proliferating cell nuclear antigen (pcna) was upregulated 166.2 ± 12.9% (Figure 1C; P < 0.001) after 10-µM PA treatment. During the experimental treatments, no obvious cellular morphological changes were observed.
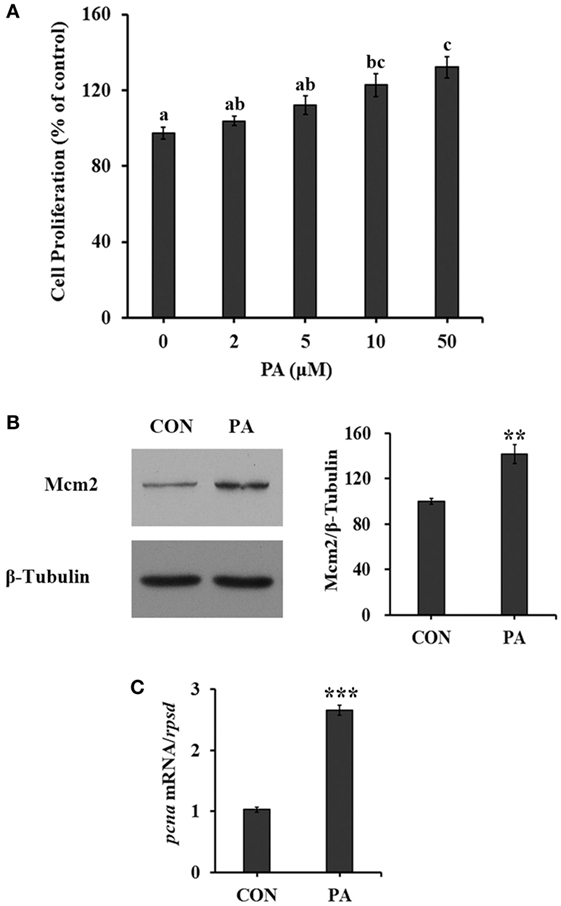
Figure 1. Phosphatidic acid (PA) induced cell proliferation. Serum starved cells were treated with indicated concentrations of PA for 16 h. (A) Cell proliferation was evaluated by the CyQUANT Assay Kit after PA treatment (n = 6). (B) The level of minichromosome maintenance protein 2 (Mcm2) was examined by Western blot after PA treatment and quantitated (n = 3). (C) The mRNA expression level of proliferating cell nuclear antigen (pcna) was quantitated by quantitative real-time PCR after PA treatment (n = 6). Results were represented as means with SEs and significance was evaluated by one-way ANOVA followed by Tukey’s multiple range tests in (A) (a,b,c means with different letters were significantly different, P < 0.05) and independent t tests in (B,C) (*P < 0.05, **P < 0.01, ***P < 0.001).
PA Promoted DNA Synthesis and G1/S Phase Transition
The cell cycle progression was analyzed by flow cytometry. As shown in Figure 2, the percentage of cells in S phase was increased from 8.2 ± 0.8 to 16.9 ± 1.1% (Figure 2A; P < 0.05) after 10-µM PA treatment. The newly synthesized DNA level was significantly increased by 128.2 ± 13.6% by PA treatment (Figure 2B; P < 0.05). As a major G1 checkpoint, the Rb protein phosphorylation was increased 62.3 ± 6.6% (Figure 2C; P < 0.05). The levels of other G1/S transition facilitators cyclin E and its binding partner Cdk2 were increased 70.0 ± 19.3 and 128.4 ± 29.9%, respectively (Figure 2C; P < 0.05). The expressions of their downstream effectors, including cyclin A and cyclin D, were increased 32.6 ± 15.5 and 34.4 ± 7.7%, respectively (Figure 2D; P < 0.05).
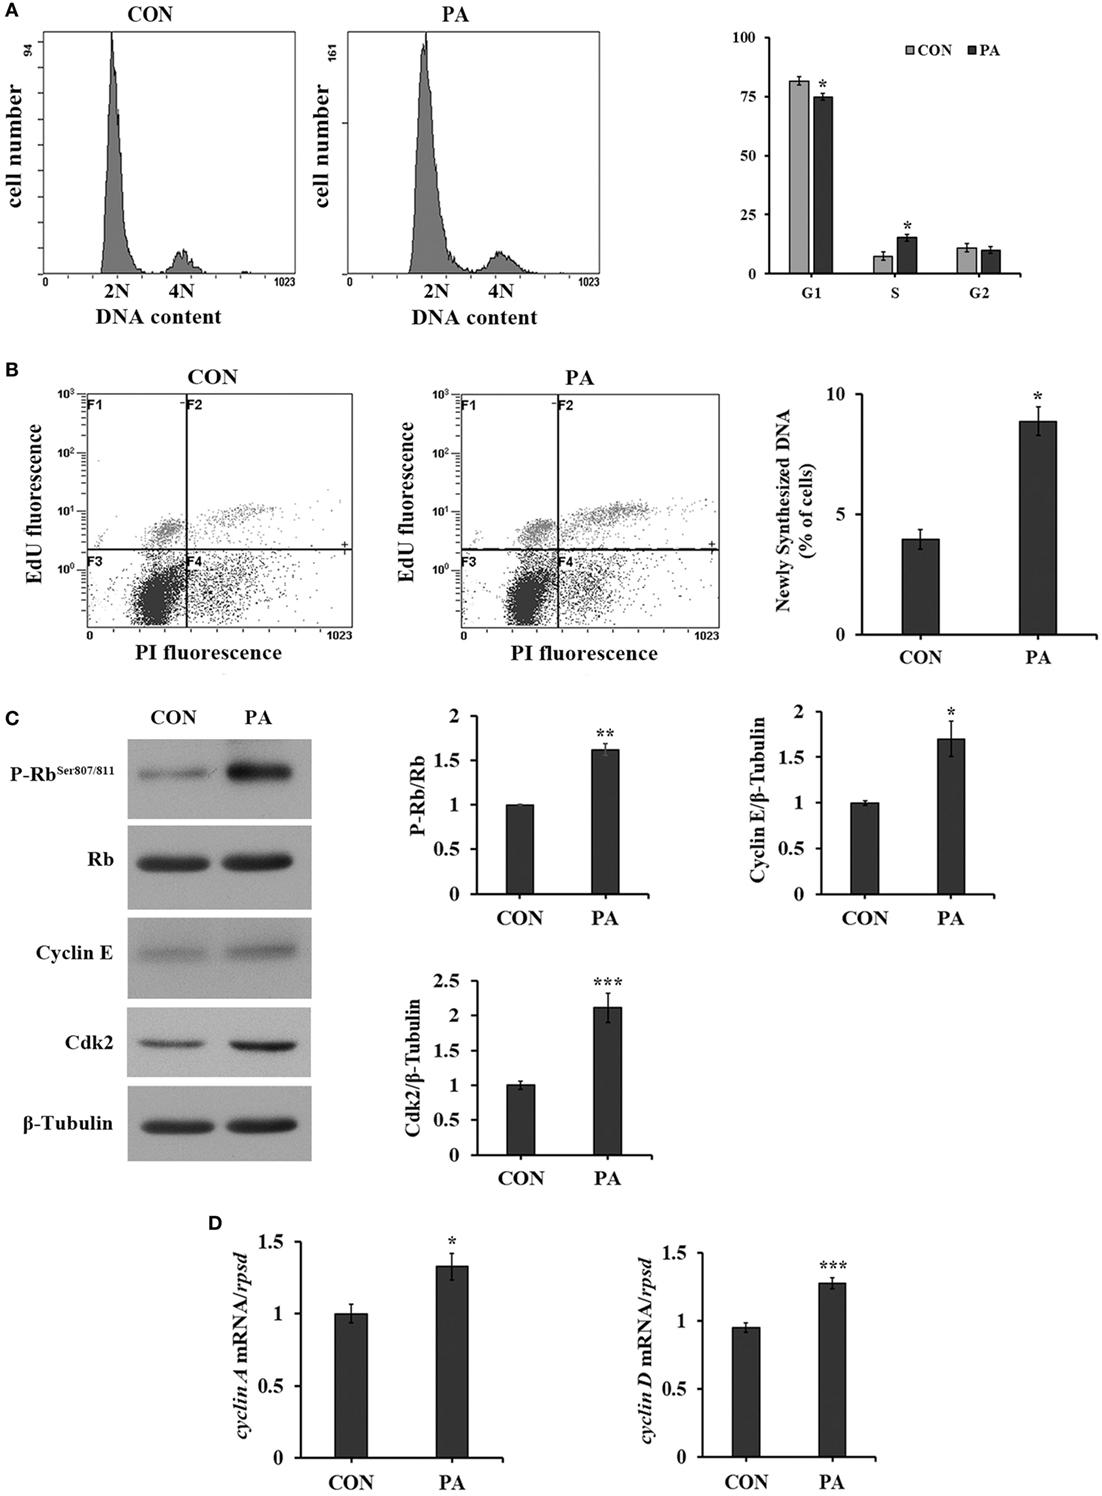
Figure 2. Phosphatidic acid (PA) promoted DNA synthesis and G1/S phase transition. Serum starved cells were treated with 10 µM PA for 16 h. (A) The percentages of cells on each phase were analyzed using flow cytometry with PI staining after PA treatment and quantitated (n = 3). (B) The newly synthesized DNA level was analyzed using flow cytometry with EdU/PI double staining by Click-iT™ Plus EdU Alexa Fluor™ Flow Cytometry Assay Kit after PA treatment (F1, cells in G1 phase; F2, cells in S phase; F3, cells in G0 phase; F4, cells in G2 phase) and quantitated (n = 3). (C) The levels of total and phosphorylated forms of Rb, cyclin E, and Cdk2 were examined by western blot after PA treatment and quantitated (n = 3). (D) The mRNA expressions of cyclin A and cyclin D were quantitated by quantitative real-time PCR after PA treatment (n = 6). Results were represented as means with SEs and were analyzed using independent t tests (*P < 0.05, **P < 0.01, ***P < 0.001).
PA Modulated Expression Levels of Muscle Regulatory Factors
The expression levels of myogenic regulatory factors (MRFs) were quantitated by qRT-PCR. The mRNA level of myoD was upregulated 134.7 ± 23.0% while that of myogenin was downregulated 41.9 ± 11.1% (Figures 3A,B; P < 0.01). The expression of myosin light chain (mlc) was also upregulated 105.6 ± 18.2% (Figure 3C; P < 0.05). Furthermore, the expression of myostatin, a negative regulator of muscle growth was downregulated 45.5 ± 14.4% while that of follistatin, the antagonist of myostatin, was upregulated 200.5 ± 24.0% significantly (Figures 3D,E; P < 0.01).
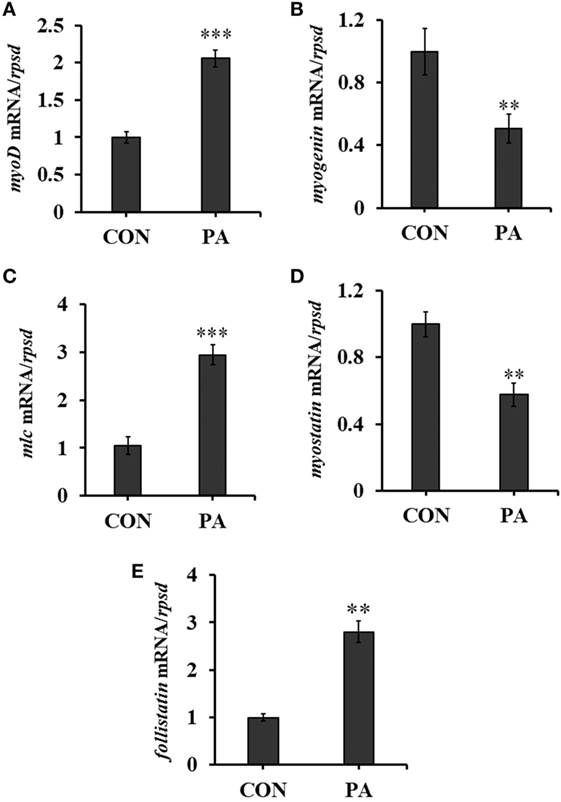
Figure 3. Phosphatidic acid (PA) modulated levels of muscle regulatory factors. The mRNA expressions of (A) myod, (B) myogenin, (C) myosin light chain, (D) myostatin, and (E) follistatin were analyzed by quantitative real-time PCR after PA treatment (n = 6). Results were represented as means with SEs and were analyzed using independent t tests (*P < 0.05, **P < 0.01, ***P < 0.001).
PA Induced Cellular Protein Synthesis and G1/S Phase Transition in a TOR-Dependent Manner
The activities of major nutrient sensing signaling pathways were also examined. PA treatment increased the phosphorylation levels of Akt (Ser473, Ser308), TOR (Thr2448), 4EBP1 (Thr36/47), S6k (Thr389), S6 (Ser235/236), and Erk (Thr202/204) in a dose-dependent manner (Figure 4A). Rapamycin treatment inhibited all of the above phosphorylations except that of Erk (Figure 4A). The newly synthesized protein rate was increased by 755.0 ± 70.8% in PA group compared with control (Figure 4B; P < 0.001). The stimulus effect of PA was diminished to an insignificant level after 10 µM rapamycin treatment. The stimulation of S phase percentage by PA was also diminished by rapamycin (Figure 4C).
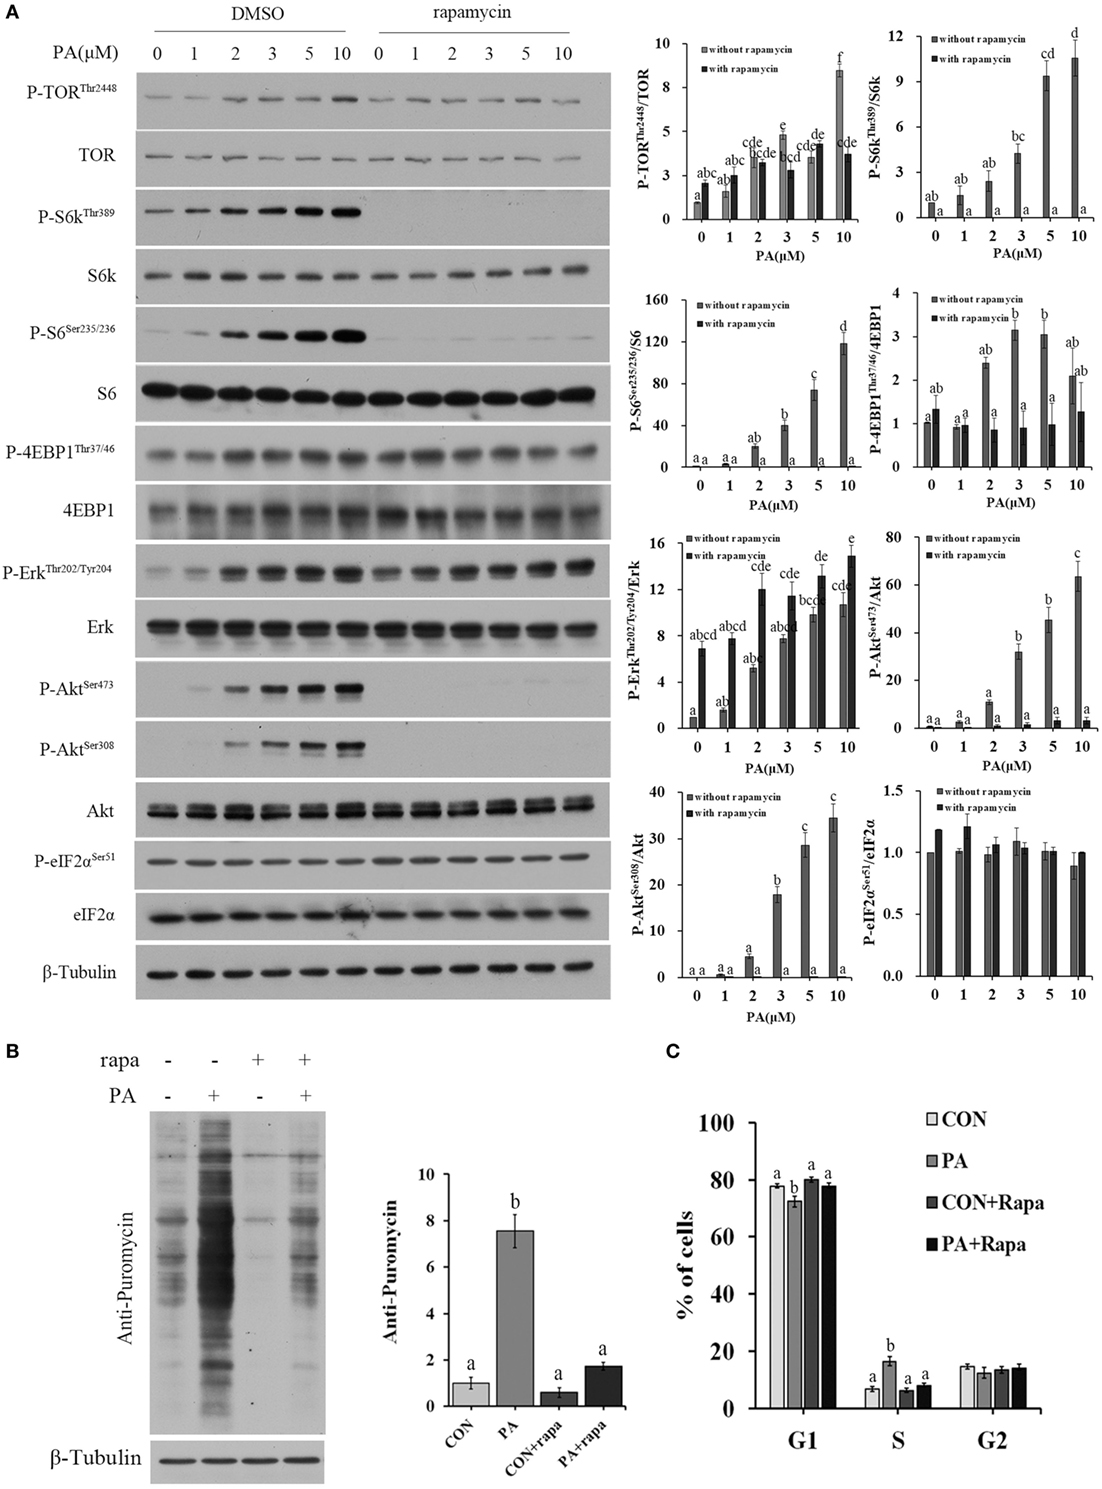
Figure 4. Phosphatidic acid (PA) induced cellular protein synthesis and G1/S phase transition in a target of rapamycin (TOR)-dependent manner. Serum starved cells were treated with indicated concentrations of PA with or without rapamycin for 16 h. (A) The levels of total and phosphorylated forms of TOR, S6k, S6, 4EBP1, Erk, Akt, and eIF2α were examined by western blot after treatment and quantitated (n = 3). (B) Cellular protein synthesis was analyzed by western blot using SUnSET technique after treatment (n = 3) and quantitated. (C) Cell cycle distribution was analyzed using flow cytometry with PI staining after treatment and quantitated (n = 3). Results were represented as means with SEs and significance was evaluated by one-way ANOVA followed by Tukey’s multiple range tests. a,b,c,d,e,f means with different letters were significantly different, P < 0.05.
PA Modulated Levels of Intracellular Free Amino Acids, Amino Acid Transporters, Amino Acid, and Protein Catabolism
The concentrations of intracellular free amino acids were increased between 31.1 and 92.2% after PA treatment (Figure 5A; P < 0.05). Meanwhile, the mRNA expression of protein degradation markers, including muscle atrophy markers atrogin-1 and muscle RING finger 1 (murf-1) were downregulated (Figure 5B; P < 0.01) 33.0 ± 7.3 and 40.4 ± 7.0%, respectively. The mRNA expressions of key enzymes in amino acid catabolism, including glutamate dehydrogenase (glud1) (67.1 ± 24.3%) and l-serine ammonia-lyase (sds) (17.6 ± 4.9%) were also downregulated (Figure 5C; P < 0.01). The expression levels of major amino acid transporters, including lat1 (slc7a5, 72.0 ± 17.7%), pat1 (slc36a1, 39.1 ± 14.5%), b0at1 (slc6a19, 183 ± 24.1%), and b0,+at (slc7a9, 180.6 ± 13.0%) were increased significantly after PA treatment (Figure 5D; P < 0.05).
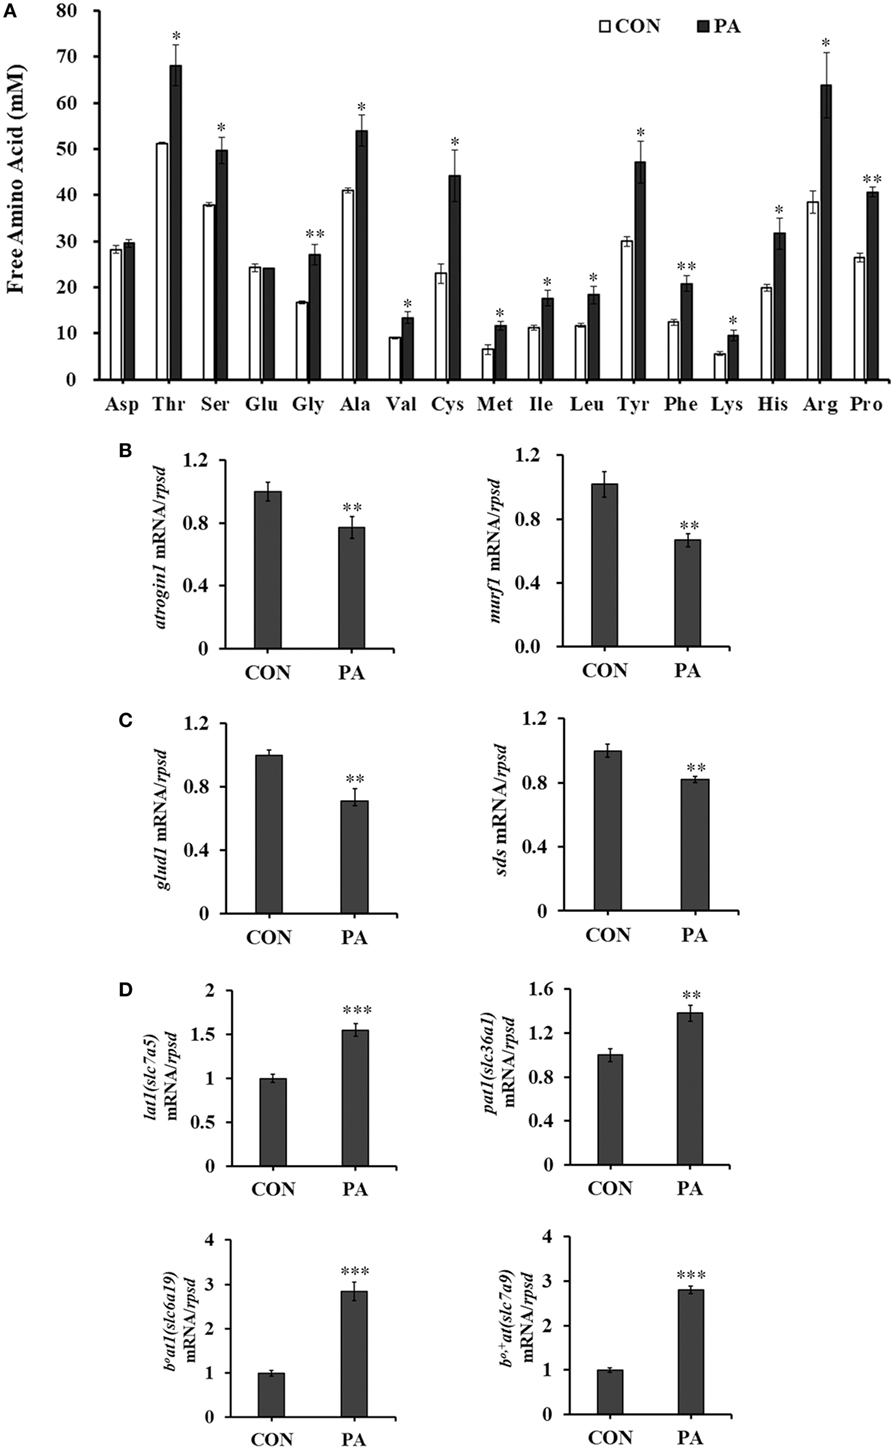
Figure 5. Phosphatidic acid (PA) modulated levels of intracellular free amino acids, amino acid transporters, amino acid, and protein catabolism. Serum starved cells were treated with 10 µM PA for 16 h. (A) Intracellular free amino acids concentrations changed after PA treatment (n = 3). (B–D) The mRNA expressions of atrogin1, murf1; glud1, sds; lat1, pat1, b0at1, and b0,+at were analyzed by quantitative real-time PCR after PA treatment (n = 6). Results were represented as means with SEs and were analyzed using independent t tests (*P < 0.05, **P < 0.01, ***P < 0.001).
PA Influenced Fatty Acid Metabolism, Glycolysis, and Energy Metabolism
The mRNA expression of genes involved in fatty acid synthesis, including sterol regulatory element-binding protein 1 (srebp1), fatty acid synthetase (fas), and glucose-6-phosphate dehydrogenase (g6pd) (55) were upregulated after PA stimulation (Figure 6A; P < 0.01). Meanwhile, the expression of genes involved in fatty acid β-oxidation (56), including carnitine palmitoyltransferase 1 isoforms α (cpt1α) (57), acyl-CoA dehydrogenase (acox1), and 3-hydroxyacyl-CoA dehydrogenase (hadh) (58) were downregulated in PA group (Figure 6B; P < 0.01). Furthermore, PA increased mRNA levels of key enzymes in glycolysis, including pyruvate kinase (pk), glucokinase (gk), and mitochondrial phosphoenolpyruvate carboxykinase (m-pepck) (Figure 6C; P < 0.05). A positive transcription regulator of glycolysis, hypoxia-inducible factor 1-alpha (hif1α) (59), was also upregulated (Figure 6C; P < 0.01). The expressions of key enzymes involved in energy production, including uncoupling protein 1 (ucp1), citrate synthesis (cs), isocitrate dehydrogenase1 (idh1) (60), and dihydrolipoamide succinyltransferase (dlst) were upregulated (Figure 6D; P < 0.05). The levels of key molecules involved in oxidative phosphorylation were also upregulated in PA group. These included F-type H + -transporting ATPase subunit alpha (atp5α) and F-type H + -transporting ATPase subunit epsilon (atp5ε) (Figure 6E; P < 0.05).
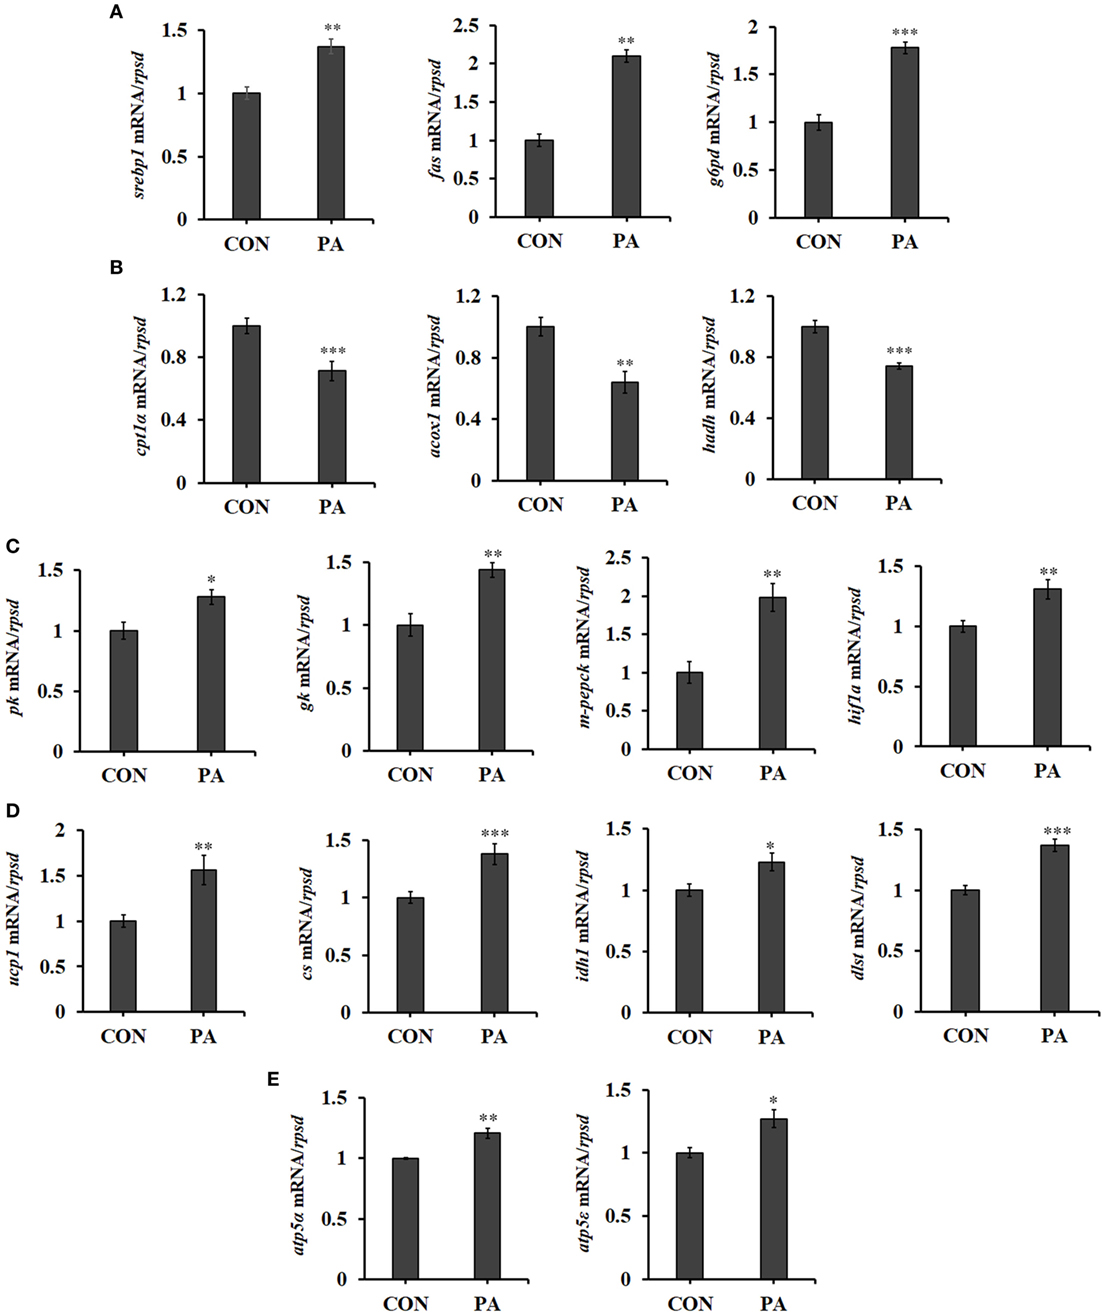
Figure 6. Phosphatidic acid (PA) influenced fatty acid metabolism, glycolysis, and energy metabolism. The mRNA expressions of (A) sterol regulatory element-binding protein 1 (srebp1), fatty acid synthetase (fas), glucose-6-phosphate dehydrogenase (g6pd), (B) cpt1α, acox1, hadh, (C) pk, gk, m-pepck, hypoxia-inducible factor 1-alpha (hif1α), (D) ucp1, cs, idh1, dlst, (E) atp5α, and atp5ε were analyzed by quantitative real-time PCR after PA treatment (n = 6). Results were represented as means with SEs and were analyzed using independent t tests (*P < 0.05, **P < 0.01, ***P < 0.001).
Discussion
In this study, PA was found to stimulate cell proliferation in a dose-dependent manner (Figure 1A). This was further confirmed by the increased levels of two cell proliferation markers (Mcm2 and pcna, Figures 1B,C) (61, 62) and newly synthesized DNA (Figure 2B). As measured, the percentage of cells entering S phase was increased by PA (Figure 2A). Previous study also demonstrated that inhibition of de novo synthesis of PA resulted in G1 cell cycle arrest (46). Mechanistically, the G1/S phase transition requires cyclin D-CDK4/6 complex accumulation (4). The phosphorylation of retinoblastoma protein (Rb) by Cyclin D–CDK4/6 complex can dissociate it from E2F and trans-activates the target genes including cyclins (cyclin A and E) that facilitate G1/S phase transition and S-phase (4, 20, 63). Our data showed that PA induced the Rb phosphorylation and upregulated the expressions of cyclin A, D, E, as well as Cdk2 (Figures 2C,D). This is consistent with what was observed in mammalian cells such as Swiss 3T3 cells (64, 65) and osteoblastic cells (66).
Hyperplasia and hypertrophy in fish muscle growth is tightly regulated by the sequential expression of transcription factors known as MRFs (67, 68). Quiescent satellite cells display no detectable levels of MRFs (69). Upregulation of MyoD precedes the expression of PCNA, a marker for cell proliferation (61). Muscle regeneration is severely impaired in MyoD (−/−) mice and is characterized by an almost complete absence of proliferative myogenic precursor cells (70). On the other hand, the expression of myogenin is associated with myoblast fusion and differentiation (71, 72). Thus, myoblast proliferation and hyperplasia can be inferred by the high expression of myoD, whereas myogenin expression can be related to myoblast hypertrophy in fish (73, 74). In this study, PA increased the expression level of myoD while decreased that of myogenin (Figures 3A,B), clearly suggesting its cell proliferative and hyperplastic effects. In gilthead sea bream myocytes, amino acids but not IGF1 stimulated TOR phosphorylation and myoD expression. However, IGF1 was able to increase the protein expression of myogenin (28, 29). Lysine limitation decreased expressions of IGF1, myoD, and myogenin in similar primary muscle cell cultures (75). These results clearly highlighted the distinct roles of biomolecules and signals in fish myogenesis (76). In fish, the accretion of myofibrillar proteins that makes the single most important contribution to fish growth. Myostatin is a TGF-β family member that acts as a negative regulator of skeletal muscle mass, while follistatin counteract its effect (77, 78). Our results showed that the expressions of myostatin and follistatin were down and upregulated respectively by PA (Figures 3D,E). The increased expression of mlc by PA further supported the positive role of PA in muscle hyperplasia and muscle mass production in turbot (Figure 3C).
Muscle growth represents the net balance between protein anabolism and catabolism (79). As the key pathway that governs protein synthesis and anabolism, TOR signaling plays a significant role in muscle growth in mammals (17, 80–82). Inhibition of TOR activity with rapamycin blocks hypertrophy in C2C12 induced myotubes and rat muscles (81). Several studies also demonstrated that TOR activities were closely associated with metabolism and nutrient utilization in fish (31, 55, 83–85). Our previous studies demonstrated that chronic inhibition of TOR by rapamycin significantly inhibited the growth in turbot (34). To date, there has been no report on the effect of TOR potentiation in fish. PA was shown to directly bind to TOR (41) and enhances its signaling both in vitro and in vivo (39, 45, 46, 86). Here, we demonstrated for the first time that PA addition induced a rapid and dose-dependent activation of TOR signaling in fish cells (Figure 4A). Similar effector was also observed in serum-starved HEK293 cells treated with high dose of PA (41, 45). PA treatment did not influenced the cellular phosphorylation level of eIF2α (Figure 4A), suggesting its effect was not likely cell stress related (87). It was known that starvation suppressed cellular TOR activities and protein synthesis (88). However, supplementation of PA strongly stimulated both of these parameters (Figures 4A,B). The stimulatory effects of PA on both protein synthesis and G1/S phase transition were abolished by rapamycin (Figures 4B,C). These results suggested that the stimulatory effects of cell proliferation and protein synthesis by PA were mediated by TOR signaling. Similar to what was reported in mammalian cells (39, 89), PA was also found to stimulate Erk phosphorylation (Figure 4A). This effect might be acted upstream of TOR (86).
The kinetics of intracellular free amino acids reflects the global output of cellular activities and also provides the critical input to the cellular signaling machinery (90). In this study, the intracellular free amino acids levels were increased after PA treatment (Figure 5A). The balance between catabolic and anabolic processes exerts a homeostatic control on the free amino acid pool (91). PA significantly downregulated the levels of key molecules involved in protein and amino acid degradations, while promoted protein synthesis as discussed above. Furthermore, PA stimulated the expressions of major amino acid transporters, which might facilitate across-membrane transportation of extracellular amino acids for intracellular biosynthesis (92). A rapid increase of amino acid transporters was observed in skeletal muscle following essential AA ingestion in humans and was associated with the muscle protein anabolic response (93). LAT1 (SLC7A5) in particular was reported to mediate large neutral amino acids entry and the downstream activation of intracellular AA sensors such as TOR signaling (94). PAT1 (SLC36A1) was found to mediate the transportation of amino acids such as proline (95) and act as an amino acid transceptor for the activation of TOR signaling in several cell lines (96). In addition, the major neutral amino acid transporter b0at1 (slc6a19) (97) and cationic amino acid transporter b0,+at (slc7a9) (98) were identified in turbot muscle in our previous study (99) and were found to be upregulated in the present study (Figure 5D). These data suggested that the intracellular amino acid availabilities, activation of TOR signaling, and downstream anabolic processes were tightly coordinated and regulated.
The effects of PA on the cellular metabolism were also examined. Increased lipogenesis is a common feature shared by most proliferating cells (100). In this study, the expression levels of major lipogenic factors (fas, srebp1, and g6pd) were upregulated while those of major fatty acid β-oxidation enzymes were downregulated by PA (Figures 6A,B). Glycolysis in proliferating cells provides intermediates for biosynthesis and ATP production (11). The mRNA expressions of major enzymes (pk, gk, and m-pepck) in glycolysis were all upregulated (Figure 6C) by PA. Thus, increased glycolysis was synchronized with enhancement of anabolism after PA stimulation. Such coordination was mediated though the regulation of TOR activities and its downstream effectors such as HIF1α, which acted upstream of glycolysis (59). ATP is highly demanded for biosynthesis. In fact, mitochondrial activity is enhanced in stimulated lymphocytes when compared with resting lymphocytes, and maximal activity correlates with peak DNA synthesis during S phase (101). Represented by the upregulated expression levels of key enzymes (Figures 6D,E), the tricarboxylic acid cycle and oxidative phosphorylation were stimulated by PA.
In summary, this study demonstrated that supplementation of PA significantly enhanced cell proliferation and anabolism through the activation of TOR signaling in primary muscle cells of turbot. This represents the first report of PA’s effects in fish, given the consideration of disparate growth pattern compared with mammals. Further validation of the effects of PA to promote fish growth will be conducted through growth trials and in vivo experiments. Identification of anabolic promoting nutraceuticals like PA should provide new strategies for better nutrition utilization and efficiency in aquaculture.
Ethics Statement
This study was carried out in accordance with the recommendations of the Animal Care Committee of Ocean University of China. The protocol was approved by the Animal Care Committee of Ocean University of China.
Author Contributions
GH and KM designed the research. GH, TW, and XW conducted the research, analyzed the data, and wrote the paper. HZ and HJ provided technical assistance and contributed to the preparation of the figures. All authors read and approved the final manuscript.
Conflict of Interest Statement
The authors declare that the research was conducted in the absence of any commercial or financial relationships that could be construed as a potential conflict of interest.
The reviewer JG and handling Editor declared their shared affiliation.
Acknowledgments
We thank Fuyun Bian, Dandan Xu, and Fei Song for technical assistance. This study was supported by National Basic Research Program of China (2014CB138602) to KM, National Scientific Foundation of China (31772860, 31572627) to GH, Aoshan Talents Cultivation Program Supported by Qingdao National Laboratory for marine science and technology (2017ASTCP-OS12) to GH, the Fundamental Research Funds for the Central Universities (201822017) to GH and China Agriculture Research System (CARS-47-G10) to KM.
Supplementary Material
The Supplementary Material for this article can be found online at https://www.frontiersin.org/articles/10.3389/fendo.2018.00221/full#supplementary-material.
References
1. Valente LM, Moutou KA, Conceição LE, Engrola S, Fernandes JM, Johnston IA. What determines growth potential and juvenile quality of farmed fish species? Rev Aquacult (2013) 5:S168–93. doi:10.1111/raq.12020
2. Verri T, Terova G, Dabrowski K, Saroglia M. Peptide transport and animal growth: the fish paradigm. Biol Lett (2011) 7:597–600. doi:10.1098/rsbl.2010.1164
3. Rossi G, Messina G. Comparative myogenesis in teleosts and mammals. Cell Mol Life Sci (2014) 71:3081–99. doi:10.1007/s00018-014-1604-5
4. Bohnsack BL, Hirschi KK. Nutrient regulation of cell cycle progression. Annu Rev Nutr (2004) 24:433–53. doi:10.1146/annurev.nutr.23.011702.073203
5. Vander Heiden MG, Cantley LC, Thompson CB. Understanding the Warburg effect: the metabolic requirements of cell proliferation. Science (2009) 324:1029–33. doi:10.1126/science.1160809
6. Pardee AB. G1 events and regulation of cell proliferation. Science (1989) 246:603–8. doi:10.1126/science.2683075
7. Alberts B, Johnson A, Lewis J, Morgan D, Raff M, Roberts K, et al. The Cell Cycle. Molecular Biology of the Cell. 6th ed. New York: Garland Science (2017). p. 967–77.
8. Laplante M, Sabatini DM. mTOR signaling in growth control and disease. Cell (2012) 149:274–93. doi:10.1016/j.cell.2012.03.017
9. Saxton RA, Sabatini DM. mTOR signaling in growth, metabolism, and disease. Cell (2017) 168:960–76. doi:10.1016/j.cell.2017.02.004
10. Wullschleger S, Loewith R, Hall MN. TOR signaling in growth and metabolism. Cell (2006) 124:471–84. doi:10.1016/j.cell.2006.01.016
11. Lunt SY, Vander Heiden MG. Aerobic glycolysis: meeting the metabolic requirements of cell proliferation. Annu Rev Cell Dev Biol (2011) 27:441–64. doi:10.1146/annurev-cellbio-092910-154237
12. Lamb J, Wheatley DN. Single amino acid (arginine) deprivation induces G1 arrest associated with inhibition of cdk4 expression in cultured human diploid fibroblasts. Exp Cell Res (2000) 255:238–49. doi:10.1006/excr.1999.4779
13. Jones NC, Fedorov YV, Rosenthal RS, Olwin BB. ERK1/2 is required for myoblast proliferation but is dispensable for muscle gene expression and cell fusion. J Cell Physiol (2001) 186:104–15. doi:10.1002/1097-4652(200101)186:1<104::AID-JCP1015>3.0.CO;2-0
14. Wang X, Proud CG. The mTOR pathway in the control of protein synthesis. Physiology (2006) 21:362–9. doi:10.1152/physiol.00024.2006
15. Mebratu Y, Tesfaigzi Y. How ERK1/2 activation controls cell proliferation and cell death: is subcellular localization the answer? Cell Cycle (2009) 8:1168–75. doi:10.4161/cc.8.8.8147
16. Jiang BH, Aoki M, Zheng JZ, Li J, Vogt PK. Myogenic signaling of phosphatidylinositol 3-kinase requires the serine-threonine kinase Akt/protein kinase B. Proc Natl Acad Sci U S A (1999) 96:2077–81. doi:10.1073/pnas.96.5.2077
17. Rommel C, Bodine SC, Clarke BA, Rossman R, Nunez L, Stitt TN, et al. Mediation of IGF-1-induced skeletal myotube hypertrophy by PI (3) K/Akt/mTOR and PI (3) K/Akt/GSK3 pathways. Nat Cell Biol (2001) 3:1009–13. doi:10.1038/ncb1101-1009
18. Sandri M. Signaling in muscle atrophy and hypertrophy. Physiology (2008) 23:160–70. doi:10.1152/physiol.00041.2007
19. Dyson N. The regulation of E2F by pRB-family proteins. Genes Dev (1998) 12:2245–62. doi:10.1101/gad.12.15.2245
20. Robert J. Cell Cycle Control. Textbook of Cell Signalling in Cancer. Berlin: Springer (2015). p. 203–19.
21. Lim S, Kaldis P. Cdks, cyclins and CKIs: roles beyond cell cycle regulation. Development (2013) 140:3079–93. doi:10.1242/dev.091744
22. Riusfrancino M, Acerete L, Jiménezamilburu V, Capilla E, Navarro I, Gutiérrez J. Differential effects on proliferation of GH and IGFs in sea bream (Sparus aurata) cultured myocytes. Gen Comp Endocrinol (2011) 172:44–9. doi:10.1016/j.ygcen.2011.03.024
23. Levesque H, Shears M, Fletcher G, Moon T. Myogenesis and muscle metabolism in juvenile Atlantic salmon (Salmo salar) made transgenic for growth hormone. J Exp Biol (2008) 211:128–37. doi:10.1242/jeb.006890
24. Jiménezamilburu V, Salmerón C, Codina M, Navarro I, Capilla E, Gutiérrez J. Insulin-like growth factors effects on the expression of myogenic regulatory factors in gilthead sea bream muscle cells. Gen Comp Endocrinol (2013) 188:151–8. doi:10.1016/j.ygcen.2013.02.033
25. Bower NI, Johnston IA. Transcriptional regulation of the IGF signaling pathway by amino acids and insulin-like growth factors during myogenesis in Atlantic salmon. PLoS One (2010) 5(6):e11100. doi:10.1371/journal.pone.0011100
26. Montserrat N, Capilla E, Navarro I, Gutiérrez J. Metabolic effects of insulin and IGFs on gilthead sea bream (Sparus aurata) muscle cells. Front Endocrinol (2012) 3:55. doi:10.3389/fendo.2012.00055
27. Codina M, García de la serrana D, Sánchez-Gurmaches J, Montserrat N, Chistyakova O, Navarro I, et al. Metabolic and mitogenic effects of IGF-II in rainbow trout (Oncorhynchus mykiss) myocytes in culture and the role of IGF-II in the PI3K/Akt and MAPK signalling pathways. Gen Comp Endocrinol (2008) 157(2):116–24. doi:10.1016/j.ygcen.2008.04.009
28. Vélez EJ, Lutfi E, Jiménezamilburu V, Riera-Codina M, Capilla E, Navarro I, et al. IGF-I and amino acids effects through TOR signaling on proliferation and differentiation of gilthead sea bream cultured myocytes. Gen Comp Endocrinol (2014) 205:296–304. doi:10.1016/j.ygcen.2014.05.024
29. Azizi S, Nematollahi MA, Amiri BM, Vélez EJ, Salmerón C, Chan SJ, et al. IGF-I and IGF-II effects on local IGF system and signaling pathways in gilthead sea bream (Sparus aurata) cultured myocytes. Gen Comp Endocrinol (2016) 232:7–16. doi:10.1016/j.ygcen.2015.11.011
30. Cleveland BM, Weber GM. Effects of insulin-like growth factor-I, insulin, and leucine on protein turnover and ubiquitin ligase expression in rainbow trout primary myocytes. Am J Physiol Regul Integr Comp Physiol (2010) 298(2):341–50. doi:10.1152/ajpregu.00516.2009
31. Lansard M, Panserat S, Plagnes-Juan E, Seiliez I, Skiba-Cassy S. Integration of insulin and amino acid signals that regulate hepatic metabolism-related gene expression in rainbow trout: role of TOR. Amino Acids (2010) 39:801–10. doi:10.1007/s00726-010-0533-3
32. Fuentes EN, Safian D, Einarsdottir IE, Valdés JA, Elorza AA, Molina A, et al. Nutritional status modulates plasma leptin, AMPK and TOR activation, and mitochondrial biogenesis: implications for cell metabolism and growth in skeletal muscle of the fine flounder. Gen Comp Endocrinol (2013) 186:172–80. doi:10.1016/j.ygcen.2013.02.009
33. Fuentes EN, Einarsdottir IE, Paredes R, Hidalgo C, Valdes JA, Björnsson BT, et al. The TORC1/P70S6K and TORC1/4EBP1 signaling pathways have a stronger contribution on skeletal muscle growth than MAPK/ERK in an early vertebrate: differential involvement of the IGF system and atrogenes. Gen Comp Endocrinol (2015) 210:96–106. doi:10.1016/j.ygcen.2014.10.012
34. Wang Q, He G, Mai K, Xu W, Zhou H, Wang X, et al. Chronic rapamycin treatment on the nutrient utilization and metabolism of juvenile turbot (Psetta maxima). Sci Rep (2016) 6:28068. doi:10.1038/srep28068
35. Xu Y, Fang Y, Chen J, Prestwich GD. Activation of mTOR signaling by novel fluoromethylene phosphonate analogues of phosphatidic acid. Bioorg Med Chem Lett (2004) 14:1461–4. doi:10.1016/j.bmcl.2004.01.020
36. Hoffman JR, Stout JR, Williams DR, Wells AJ, Fragala MS, Mangine GT, et al. Efficacy of phosphatidic acid ingestion on lean body mass, muscle thickness and strength gains in resistance-trained men. J Int Soc Sports Nutr (2012) 9:47. doi:10.1186/1550-2783-9-47
37. You J-S, Lincoln HC, Kim C-R, Frey JW, Goodman CA, Zhong X-P, et al. The role of diacylglycerol kinase ζ and phosphatidic acid in the mechanical activation of mammalian target of rapamycin (mTOR) signaling and skeletal muscle hypertrophy. J Biol Chem (2014) 289:1551–63. doi:10.1074/jbc.M113.531392
38. Erdahl WL, Stolyhwo A, Privett OS. Analysis of soybean lecithin by thin layer and analytical liquid chromatography. J Am Oil Chem Soc (1973) 50:513–5. doi:10.1007/BF02640522
39. Mobley CB, Hornberger TA, Fox CD, Healy JC, Ferguson BS, Lowery RP, et al. Effects of oral phosphatidic acid feeding with or without whey protein on muscle protein synthesis and anabolic signaling in rodent skeletal muscle. J Int Soc Sports Nutr (2015) 12:32. doi:10.1186/s12970-015-0094-7
40. Joy JM, Gundermann DM, Lowery RP, Jäger R, McCleary SA, Purpura M, et al. Phosphatidic acid enhances mTOR signaling and resistance exercise induced hypertrophy. Nutr Metab (2014) 11:29. doi:10.1186/1743-7075-11-29
41. Fang Y, Vilella-Bach M, Bachmann R, Flanigan A, Chen J. Phosphatidic acid-mediated mitogenic activation of mTOR signaling. Science (2001) 294:1942–5. doi:10.1126/science.1066015
42. Tong XH, Liu QH, Xu SH, Li J, Xiao ZZ, Ma DY. Changes in RNA, DNA, protein contents and growth of turbot Scophthalmus maximus larvae and juveniles. J Fish Biol (2010) 77:512–5. doi:10.1111/j.1095-8649.2010.02692.x
43. Wang X, He G, Mai KS, Xu W, Zhou HH. Molecular cloning and characterization of taurine transporter from turbot (Psetta maxima) and its expression analysis regulated by taurine in vitro. Aquacult Res (2017) 48:1724–34. doi:10.1111/are.13009
44. Jiang H, Bian F, Zhou H, Wang X, Wang K, Mai K, et al. Nutrient sensing and metabolic changes after methionine deprivation in primary muscle cells of turbot (Scophthalmus maximus L.). J Nutr Biochem (2017) 50:74–82. doi:10.1016/j.jnutbio.2017.08.015
45. Yoon MS, Sun Y, Arauz E, Jiang Y, Chen J. Phosphatidic acid activates mammalian target of rapamycin complex 1 (mTORC1) kinase by displacing FK506 binding protein 38 (FKBP38) and exerting an allosteric effect. J Biol Chem (2011) 286:29568–74. doi:10.1074/jbc.M111.262816
46. Menon D, Salloum D, Bernfeld E, Gorodetsky E, Akselrod A, Frias MA, et al. Lipid sensing by mTOR complexes via de novo synthesis of phosphatidic acid. J Biol Chem (2017) 292:6303–11. doi:10.1074/jbc.M116.772988
47. Riccardi C, Nicoletti I. Analysis of apoptosis by propidium iodide staining and flow cytometry. Nat Protoc (2006) 1:1458–61. doi:10.1038/nprot.2006.238
48. Kononenko AV, Bansal R, Lee NC, Grimes BR, Masumoto H, Earnshaw WC. A portable BRCA1-HAC (human artificial chromosome) module for analysis of BRCA1 tumor suppressor function. Nucleic Acids Res (2014) 42:e164. doi:10.1093/nar/gku870
49. Buck SB, Bradford J, Gee KR, Agnew BJ, Clarke ST, Salic A. Detection of S-phase cell cycle progression using 5-ethynyl-2’-deoxyuridine incorporation with click chemistry, an alternative to using 5-bromo-2’-deoxyuridine antibodies. Biotechniques (2008) 44:927–9. doi:10.2144/000112812
50. Schmidt EK, Clavarino G, Ceppi M, Pierre P. SUnSET, a nonradioactive method to monitor protein synthesis. Nat Methods (2009) 6:275–7. doi:10.1038/nmeth.1314
51. Bian F, Jiang H, Man M, Mai K, Zhou H, Xu W, et al. Dietary gossypol suppressed postprandial TOR signaling and elevated ER stress pathways in turbot (Scophthalmus maximus L.). Am J Physiol Endocrinol Metab (2017) 312:E37–47. doi:10.1152/ajpendo.00285.2016
52. Zuo R, Ai Q, Mai K, Xu W, Wang J, Xu H, et al. Effects of dietary n-3 highly unsaturated fatty acids on growth, nonspecific immunity, expression of some immune related genes and disease resistance of large yellow croaker (Larmichthys crocea) following natural infestation of parasites (Cryptocaryon irritans). Fish Shellfish Immunol (2012) 32:249–58. doi:10.1016/j.fsi.2011.11.005
53. Song F, Xu D, Mai K, Zhou H, Xu W, He G. Comparative study on the cellular and systemic nutrient sensing and intermediary metabolism after partial replacement of fishmeal by meat and bone meal in the diet of turbot (Scophthalmus maximus L.). PLoS One (2016) 11:e0165708. doi:10.1371/journal.pone.0165708
54. Livak KJ, Schmittgen TD. Analysis of relative gene expression data using real-time quantitative PCR and the 2(-Delta Delta C(T)) method. Methods (2001) 25:402–8. doi:10.1006/meth.2001.1262
55. Seiliez I, Panserat S, Lansard M, Polakof S, Plagnes-Juan E, Surget A, et al. Dietary carbohydrate-to-protein ratio affects TOR signaling and metabolism-related gene expression in the liver and muscle of rainbow trout after a single meal. Am J Physiol Regul Integr Comp Physiol (2011) 300:R733–43. doi:10.1152/ajpregu.00579.2010
56. Cunha I, Galante-Oliveira S, Rocha E, Planas M, Urbatzka R, Castro L. Dynamics of PPARs, fatty acid metabolism genes and lipid classes in eggs and early larvae of a teleost. Comp Biochem Physiol B Biochem Mol Biol (2013) 164:247–58. doi:10.1016/j.cbpb.2013.01.003
57. Sigauke E, Rakheja D, Kitson K, Bennett MJ. Carnitine palmitoyltransferase II deficiency: a clinical, biochemical, and molecular review. Lab Invest (2003) 83:1543–54. doi:10.1097/01.LAB.0000098428.51765.83
58. Reddy JK, Hashimoto T. Peroxisomal β-oxidation and peroxisome proliferator–activated receptor α: an adaptive metabolic system. Annu Rev Nutr (2001) 21:193–230. doi:10.1146/annurev.nutr.21.1.193
59. Düvel K, Yecies JL, Menon S, Raman P, Lipovsky AI, Souza AL, et al. Activation of a metabolic gene regulatory network downstream of mTOR complex 1. Mol Cell (2010) 39:171–83. doi:10.1016/j.molcel.2010.06.022
60. Louassini M, Foulquié M, Benítez R, Adroher J. Citric-acid cycle key enzyme activities during in vitro growth and metacyclogenesis of Leishmania infantum promastigotes. J Parasitol (1999) 85:595–602. doi:10.2307/3285729
61. Hall P, Levison D, Woods A, Yu CW, Kellock D, Watkins J, et al. Proliferating cell nuclear antigen (PCNA) immunolocalization in paraffin sections: an index of cell proliferation with evidence of deregulated expression in some, neoplasms. J Pathol (1990) 162:285–94. doi:10.1002/path.1711620403
62. Dudderidge TJ, Stoeber K, Loddo M, Atkinson G, Fanshawe T, Griffiths DF, et al. Mcm2, geminin, and KI67 define proliferative state and are prognostic markers in renal cell carcinoma. Clin Cancer Res (2005) 11:2510–7. doi:10.1158/1078-0432.CCR-04-1776
63. Massagué J. G1 cell-cycle control and cancer. Nature (2004) 432:298–306. doi:10.1038/nature03094
64. Zhang H, Desai NN, Murphey JM, Spiegel S. Increases in phosphatidic acid levels accompany sphingosine-stimulated proliferation of quiescent Swiss 3T3 cells. J Biol Chem (1990) 265:21309–16.
65. Wood CA, Padmore L, Radda GK. The effect of phosphatidic acid on the proliferation of Swiss 3T3 cells. Biochem Soc Trans (1993) 21:369S. doi:10.1042/bst021369s
66. Carpio L, Dziak R. Phosphatidic acid effects on cytosolic calcium and proliferation in osteoblastic cells. Prostglandins Leukot Essent Fatty Acids (1998) 59:101–9. doi:10.1016/S0952-3278(98)90088-6
67. Watabe S. Myogenic regulatory factors. In: Johnston IA, editor. Fish Physiology-Muscle Development and Growth. Vol 18. San Diego: Academic Press (2001). p. 19–41.
68. Watabe S. Myogenic regulatory factors and muscle differentiation during ontogeny in fish. J Fish Biol (1999) 55:1–18. doi:10.1023/A:1017184402192
69. Cornelison DDW, Wold BJ. Single-cell analysis of regulatory gene expression in quiescent and activated mouse skeletal muscle satellite cells. Dev Biol (1997) 191:270–83. doi:10.1006/dbio.1997.8721
70. Megeney LA, Kablar B, Garrett K, Anderson JE, Rudnicki MA. MyoD is required for myogenic stem cell function in adult skeletal muscle. Genes Dev (1996) 10:1173–83. doi:10.1101/gad.10.10.1173
71. Yablonka-Reuveni Z, Rivera AJ. Temporal expression of regulatory and structural muscle proteins during myogenesis of satellite cells on isolated adult rat fibers. Dev Biol (1994) 164:588–603. doi:10.1006/dbio.1994.1226
72. Smith CK II, Janney MJ, Allen RE. Temporal expression of myogenic regulatory genes during activation, proliferation, and differentiation of rat skeletal muscle satellite cells. J Cell Physiol (1994) 159:379. doi:10.1002/jcp.1041590222
73. Johansen KA, Overturf K. Sequence, conservation, and quantitative expression of rainbow trout Myf5. Comp Biochem Physiol B Biochem Mol Biol (2005) 140:533–41. doi:10.1016/j.cbpc.2004.11.016
74. de Almeida FLA, Pessotti NS, Pinhal D, Padovani CR, de Jesus Leitão N, Carvalho RF, et al. Quantitative expression of myogenic regulatory factors MyoD and myogenin in pacu (Piaractus mesopotamicus) skeletal muscle during growth. Micron (2010) 41:997–1004. doi:10.1016/j.micron.2010.06.012
75. Azizi S, Nematollahi MA, Amiri BM, Vélez EJ, Lutfi E, Navarro I, et al. Lysine and leucine deficiencies affect myocytes development and IGF signaling in gilthead sea bream (Sparus aurata). PLoS One (2016) 11:e0147618. doi:10.1371/journal.pone.0147618
76. Vélez EJ, Lutfi E, Azizi S, Montserrat N, Riera-Codina M, Capilla E, et al. Contribution of in vitro myocytes studies to understanding fish muscle physiology. Comp Biochem Physiol B Biochem Mol Biol (2015) 199:67–73. doi:10.1016/j.cbpb.2015.12.003
77. Thomas M, Langley B, Berry C, Sharma M, Kirk S, Bass J, et al. Myostatin, a negative regulator of muscle growth, functions by inhibiting myoblast proliferation. J Biol Chem (2000) 275:40235–43. doi:10.1074/jbc.M004356200
78. Gilson H, Schakman O, Kalista S, Lause P, Tsuchida K, Thissen JP. Follistatin induces muscle hypertrophy through satellite cell proliferation and inhibition of both myostatin and activin. Am J Physiol Endocrinol Metab (2009) 297:E157–64. doi:10.1152/ajpendo.00193.2009
79. Seiliez I, Dias K, Cleveland BM. Contribution of the autophagy-lysosomal and ubiquitin-proteasomal proteolytic systems to total proteolysis in rainbow trout (Oncorhynchus mykiss) myotubes. Am J Physiol Regul Inter Comp Physiol (2014) 307:R1330–7. doi:10.1152/ajpregu.00370.2014
80. Nader GA, McLoughlin TJ, Esser KA. mTOR function in skeletal muscle hypertrophy: increased ribosomal RNA via cell cycle regulators. Am J Physiol Cell Physiol (2005) 289:C1457–65. doi:10.1152/ajpcell.00165.2005
81. Park IH, Erbay E, Nuzzi P, Chen J. Skeletal myocyte hypertrophy requires mTOR kinase activity and S6K1. Exp Cell Res (2005) 309:211–9. doi:10.1016/j.yexcr.2005.05.017
82. Bodine SC, Stitt TN, Gonzalez M, Kline WO, Stover GL, Bauerlein R, et al. Akt/mTOR pathway is a crucial regulator of skeletal muscle hypertrophy and can prevent muscle atrophy in vivo. Nat Cell Biol (2001) 3:1014–9. doi:10.1038/ncb1101-1014
83. Skiba-Cassy S, Panserat S, Larquier M, Dias K, Surget A, Plagnes-Juan E, et al. Apparent low ability of liver and muscle to adapt to variation of dietary carbohydrate:protein ratio in rainbow trout (Oncorhynchus mykiss). Br J Nutr (2013) 109:1359–72. doi:10.1017/S0007114512003352
84. Garcia de la Serrana D, Fontanillas R, Koppe W, Fernández-Borràs J, Blasco J, Martín-Pérez M, et al. Effects of variable protein and lipid proportion in gilthead sea bream (Sparus aurata) diets on fillet structure and quality. Aquacult Nutr (2013) 19:368–81. doi:10.1111/j.1365-2095.2012.00966.x
85. Seiliez I, Gabillard JC, Skiba-Cassy S, Garcia de la Serrana D, Gutiérrez J, Kaushik S, et al. An in vivo and in vitro assessment of TOR signaling cascade in rainbow trout (Oncorhynchus mykiss). Am J Physiol Regul Integr Comp Physiol (2008) 295:R329–35. doi:10.1152/ajpregu.00146.2008
86. Winter JN, Fox TE, Kester M, Jefferson LS, Kimball SR. Phosphatidic acid mediates activation of mTORC1 through the ERK signaling pathway. Am J Physiol Cell Physiol (2010) 299:C335–44. doi:10.1152/ajpcell.00039.2010
87. Kimball SR. Eukaryotic initiation factor eIF2. Int J Biochem Cell B (1999) 31:25–9. doi:10.1016/S1357-2725(98)00128-9
88. Uddin MN, Ito S, Nishio N, Suganya T, Isobe KI. Gadd34 induces autophagy through the suppression of the mTOR pathway during starvation. Biochem Biophys Res Commun (2011) 407:692–8. doi:10.1016/j.bbrc.2011.03.077
89. Mobley CB, Fox CD, Pascoe C, Healy J, Ferguson BS, Lowery RP. Phosphatidic acid feeding increases muscle protein synthesis and select mTORC1 pathway signaling mediators in rodent skeletal muscle. J Int Soc Sports Nutr (2014) 11:1–2. doi:10.1186/1550-2783-11-S1-P50
90. Beugnet A, Tee A, Taylor P, Proud C. Regulation of targets of mTOR (mammalian target of rapamycin) signalling by intracellular amino acid availability. Biochem J (2003) 372:555–66. doi:10.1042/bj20021266
91. Fruhbeck G. Protein metabolism: slow and fast dietary proteins. Nature (1998) 391:843–5. doi:10.1038/35993
92. Hundal HS, Taylor PM. Amino acid transceptors: gate keepers of nutrient exchange and regulators of nutrient signaling. Am J Physiol Endocrinol Metab (2009) 296:E603–13. doi:10.1152/ajpendo.91002.2008
93. Drummond MJ, Glynn EL, Fry CS, Timmerman KL, Volpi E, Rasmussen BB. An increase in essential amino acid availability upregulates amino acid transporter expression in human skeletal muscle. Am J Physiol Endocrinol Metab (2010) 298:E1011–8. doi:10.1152/ajpendo.00690.2009
94. Yanagida O, Kanai Y, Chairoungdua A, Kim DK, Segawa H, Nii T, et al. Human L-type amino acid transporter 1 (LAT1): characterization of function and expression in tumor cell lines. Biochim Biophys Acta (2001) 1514:291–302. doi:10.1016/S0005-2736(01)00384-4
95. Bröer S. Amino acid transport across mammalian intestinal and renal epithelia. Physiol Rev (2008) 88:249–86. doi:10.1152/physrev.00018.2006
96. Heublein S, Kazi S, Ögmundsdóttir MH, Attwood EV, Kala S, Boyd CAR, et al. Proton-assisted amino acid transporters are conserved regulators of proliferation and amino acid-dependent mTORC1 activation. Oncogene (2010) 29:4068–79. doi:10.1038/onc.2010.177
97. Margheritis E, Imperiali FG, Cinquetti R, Vollero A, Terova G, Rimoldi S, et al. Amino acid transporter B0AT1 (slc6a19) and ancillary protein: impact on function. Pflugers Arch (2016) 468:1–12. doi:10.1007/s00424-016-1842-5
98. Cervantes M, Arce N, García H, Cota M, Htoo JK, Morales A. Expression of genes coding for selected amino acid transporters in small intestine, liver, and skeletal muscle of pigs fed excess branched-chain amino acids. Genet Mol Res (2015) 14:9779–92. doi:10.4238/2015.August.19.11
99. Xu D, He G, Mai K, Wang Q, Li M, Zhou H. Effect of fish meal replacement by plant protein blend on amino acid concentration, transportation and metabolism in juvenile turbot (Scophthalmus maximus L.). Aquacult Nutr (2017) 23:1169–78. doi:10.1111/anu.12486
100. Menendez JA, Lupu R. Fatty acid synthase and the lipogenic phenotype in cancer pathogenesis. Nat Rev Cancer (2007) 7:763–77. doi:10.1038/nrc2222
Keywords: phosphatidic acid, turbot, cell proliferation, target of rapamycin pathway, metabolism
Citation: Wang T, Wang X, Zhou H, Jiang H, Mai K and He G (2018) The Mitotic and Metabolic Effects of Phosphatidic Acid in the Primary Muscle Cells of Turbot (Scophthalmus maximus). Front. Endocrinol. 9:221. doi: 10.3389/fendo.2018.00221
Received: 10 February 2018; Accepted: 19 April 2018;
Published: 04 May 2018
Edited by:
Encarnación Capilla, Universitat de Barcelona, SpainReviewed by:
Jean-Charles Gabillard, INRA Centre Bretagne-Normandie, FranceJoaquin Gutierrez, Universitat de Barcelona, Spain
Takashi Yada, Japan Fisheries Research and Education Agency (FRA), Japan
Copyright: © 2018 Wang, Wang, Zhou, Jiang, Mai and He. This is an open-access article distributed under the terms of the Creative Commons Attribution License (CC BY). The use, distribution or reproduction in other forums is permitted, provided the original author(s) and the copyright owner are credited and that the original publication in this journal is cited, in accordance with accepted academic practice. No use, distribution or reproduction is permitted which does not comply with these terms.
*Correspondence: Gen He, hegen@ouc.edu.cn