Optimization of protein extraction from Spirulina platensis to generate a potential co-product and a biofuel feedstock with reduced nitrogen content
 Naga Sirisha Parimi1
 Manjinder Singh1
 James R. Kastner1
 Keshav C. Das1*
  Lennart S. Forsberg2
  Parastoo Azadi2
- 1College of Engineering, The University of Georgia, Athens, GA, USA
- 2Complex Carbohydrate Research Center, The University of Georgia, Athens, GA, USA
The current work reports protein extraction from Spirulina platensis cyanobacterial biomass in order to simultaneously generate a potential co-product and a biofuel feedstock with reduced nitrogen content. S. platensis cells were subjected to cell disruption by high-pressure homogenization and subsequent protein isolation by solubilization at alkaline pH followed by precipitation at acidic pH. Response surface methodology was used to optimize the process parameters – pH, extraction (solubilization/precipitation) time and biomass concentration for obtaining maximum protein yield. The optimized process conditions were found to be pH 11.38, solubilization time of 35 min and biomass concentration of 3.6% (w/w) solids for the solubilization step, and pH 4.01 and precipitation time of 60 min for the precipitation step. At the optimized conditions, a high protein yield of 60.7% (w/w) was obtained. The protein isolate (co-product) had a higher protein content [80.6% (w/w)], lower ash [1.9% (w/w)] and mineral content and was enriched in essential amino acids, the nutritious γ-linolenic acid and other high-value unsaturated fatty acids compared to the original biomass. The residual biomass obtained after protein extraction had lower nitrogen content and higher total non-protein content than the original biomass. The loss of about 50% of the total lipids from this fraction did not impact its composition significantly owing to the low lipid content of S. platensis (8.03%).
Introduction
The concept of biorefinery which proposes the integration of biofuel production processes with the extraction of co-product(s) such as proteins, pigments, and other high-value compounds is the path forward to improve the sustainability and economic feasibility of microalgal processing technologies. The high protein (and nitrogen) content of algal feedstock is a major limitation to whole biomass to biofuel conversion processes such as hydrothermal liquefaction (HTL) and anaerobic digestion (AD). High-protein feedstocks result in high nitrogen content in the fuel produced from HTL and ammonia toxicity in AD (Chen et al., 2008; López Barreiro et al., 2013). Thus, nitrogen removal through protein extraction could potentially improve the feedstock composition for biofuel applications, while generating a useful co-product. Microalgal proteins are comparable to conventional protein sources such as soymeal and eggs, and hence find potential applications in human nutrition and animal feed (Spolaore et al., 2006; Becker, 2007).
Pre-treatments such as mechanical cell lysis, enzymatic, thermal, and chemical treatments result in improved component extraction by complete or partial degradation of the microalgal cell wall, thus, improving the accessibility of the intra-cellular components. High-pressure homogenization and ultrasonication were reported to enhance microalgal protein solubilization, the former being the most effective method (Gerde et al., 2013; Safi et al., 2014). Autoclaving was reported as an effective pretreatment to improve lipid extraction from microalgae (Prabakaran and Ravindran, 2011).
Protein solubility is pH dependent. Highly acidic and alkaline conditions enhance the solubility of algal proteins by inducing net charges on the amino acid residues (Damodaran, 1996). Proteins are least soluble at their isoelectric pH and precipitate out. Thus, solubilization under alkaline conditions followed by precipitation at isoelectric pH is a useful strategy for obtaining crude protein isolates. Several authors reported protein extraction from green algae and cyanobacteria using this method (Choi and Markakis, 1981; Chronakis et al., 2000; Gerde et al., 2013; Safi et al., 2014; Ursu et al., 2014). Other parameters that could impact protein solubility include extraction (solubilization or precipitation) time, solvent/biomass ratio (biomass concentration), and temperature (Abas Wani et al., 2006). High temperature causes protein denaturing and also increases the energy input for the overall process (Goetz and Koehler, 2005). Hence, heat treatment is undesirable in protein isolation processes.
Process optimization and statistical analysis is necessary to maximize protein extraction and determine the independent and interaction effects of various process parameters on the extraction yields. Response surface methodology (RSM) is a popular statistical method for optimization of process parameters while conducting the least number of experiments (Firatligil-Durmus and Evranuz, 2010). Protein extraction process optimization using RSM for non-algal sources and Chlorella pyrenoidosa (green algae) was reported previously (Quanhong and Caili, 2005; Zhang et al., 2007; Ma et al., 2010; Wang and Zhang, 2012).
The current study dealt with process optimization for maximizing protein extraction from the cyanobacterium (blue-green alga) Spirulina platensis, and the generation of a residual biomass with lower nitrogen content than the original biomass for potential applications as a biofuel feedstock in whole biomass conversion processes such as HTL and AD. Cyanobacteria differ significantly from green algae in cell wall structure and biochemical composition. Unlike the latter which have a recalcitrant cell wall comprising of cellulose and hemicellulose (Payne and Rippingale, 2000), cyanobacteria such as Spirulina and Nostoc sp. have a peptidoglycan-based cell wall (Palinska and Krumbein, 2000). Moreover, they have a higher protein and lower lipid content (Becker, 2007). These differences necessitate the optimization of process parameters for the specific phylum. S. platensis was chosen in the current study for two reasons. First, it is an edible cyanobacterium and hence its protein isolate is expected to have a high nutritive value. Second, it has a very high protein content (Cohen, 1997) and hence the impact of protein isolation on the biochemical composition of the residual biomass would be very striking in this species compared to those with a lower protein content. Although some reports on extraction of proteins from S. platensis may be found in the literature, major knowledge gaps on process optimization, component fractionation, and product characterization remain (Devi et al., 1981; Chronakis et al., 2000; Safi et al., 2013b). The current work aimed at filling these gaps in order to understand the fate of various cell components as a result of the fractionation process and identify the bottlenecks in the process. Some of the parameters described in the literature to characterize protein isolates such as protein content, amino acid composition, mineral composition, and molecular weight range of the proteins were reported for the protein isolate obtained in this study (Chronakis et al., 2000; Gerde et al., 2013; Safi et al., 2013a). Such knowledge is very useful in assessing the sustainability, scalability, and economic feasibility of the process.
Materials and Methods
Microalgae
Spirulina platensis was obtained from Earthrise Nutritionals LLC (Calipatria, CA, USA) in dry powder form and was stored in sealed, air tight plastic packages at room temperature prior to use. The dry powder was mixed with deionized (DI) water to form biomass slurry at the desired concentration (solids content).
Protein Isolation Process
Spirulina platensis biomass slurry prepared at the desired concentration was subjected to a protein isolation process (Figure S1 in Supplementary Material) which involved pretreatment of the biomass and subsequent extraction of proteins by solubilization at alkaline pH using 1M NaOH followed by precipitation from the supernatant (obtained from the previous step) at acidic pH using either 1M HCl or 1M HCOOH. The solid–liquid separation after the solubilization and the precipitation steps was achieved by centrifugation at 8670 g for 35 min. The pellet and the supernatant from the solubilization step are henceforth referred to as alkali pellet and alkali supernatant, respectively, and those from the precipitation step are referred to as acid pellet and acid supernatant, respectively. The acid pellet was the protein isolate. The combined fraction of the alkali pellet and acid supernatant was the residual biomass.
Selection of Pretreatment
A 6% slurry of S. platensis biomass was subjected to three different pretreatments namely autoclaving, ultrasonication, and high-pressure homogenization. Autoclaving was carried out at 121°C with 103.4 kPa (15 psi) for 30 min. Ultrasonication was carried out using a probe sonicator (Biologics, Inc., VA, USA) at 20% maximum power for 60 min. High-pressure homogenization involved two passes through a high-pressure homogenizer (Constant systems LTD., UK) at 103.4 MPa (15 kpsi). The samples were placed on ice bath during ultrasonication and high-pressure homogenization, and a chiller was attached to the latter unit to minimize sample heating. The control experiment did not involve any pretreatment. Each of the pretreated and control samples was subjected to protein solubilization at pH 11 for 60 min followed by solid–liquid separation. The treatments were compared based on protein recovery in the supernatant fraction. The cells were observed visually under an optical microscope (400 times magnification).
Optimization of Experimental Conditions
Solubility curve determination. A 6% S. platensis biomass slurry was subjected to cell disruption by high-pressure homogenization and separated into aliquots. The pH of each aliquot was adjusted to various values in the range of 2–13 (with a step size of 1 U) using either 1M NaOH or 1M HCl and stirred for 30 min before subjecting to solid–liquid separation. A graph of pH versus protein recovery in the supernatant was plotted to obtain the solubility curve.
Statistical optimization. The design of optimization experiments and the statistical analysis was carried out using SAS-based JMP Pro (version 10) statistical software. A Box–Behnken design based on RSM was employed to optimize the process conditions affecting protein solubilization and precipitation. The optimization range for pH for both the steps was chosen based on the solubility curve data. The range for solubilization and precipitation times was 10–60 min. The 60 min maximum was chosen based on the literature which reported that increasing the solubilization time beyond 60 min did not result in a significant increase in the extracted proteins from pH 11 sonicated, non-defatted algae biomass (Gerde et al., 2013). The chosen range for biomass concentration was 2–10% solids, a typical solids range of harvested algal biomass.
Based on the design, set of 15 and 10 experiments were carried out for the solubilization and precipitation steps, respectively (Tables S1 and S2 in Supplementary Material). A second degree polynomial with the following general equation was fit to the data obtained from the solubilization experiments:
where Y was the protein recovery in the alkali supernatant, Xi (i = 1, 2, 3) was the coded dimensionless value of an independent input variable xi (i = 1, 2, 3) in the range of −1 to 1. The independent input variables were x1 (pH), x2 (solubilization time), and x3 (biomass concentration). A0 was the constant term, Ai (i = 1, 2, 3), Aii (i = 1, 2, 3), and Aij (i = 1, 2, 3; j = 2, 3; i ≠ j) are the linear, quadratic, and interaction regression coefficients. The variables were coded according to the following equation:
where x0 was the real value of the center point of each input variable and Δxi was the step change.
Protein precipitation from the alkali supernatant was carried out using 1M HCOOH obtained at the RSM optimized conditions. A second degree polynomial with the following general equation was fit to the data obtained from the precipitation experiments:
where Y was the protein recovery in the acid pellet, Xi (i = 1, 2) was the coded dimensionless value of an independent input variable xi (i = 1, 2) in the range of −1 to 1. The independent input variables were x1 (pH) and x2 (precipitation time). B0 was the constant term, Bi (i = 1, 2), Bii (i = 1, 2), and Bij (i = 1; j = 2) were the linear, quadratic, and interaction regression coefficients. The input variables were coded in a manner similar to the solubilization step variables.
The coefficient of determination (R2) and the scattered plots between the experimental and predicted protein recoveries were obtained. The significance of the regression coefficients of the polynomial equations was determined using the Student’s t-test and p value. Optimum process conditions were obtained from the response surface analysis and were experimentally validated.
Analytical Methods
Total Nitrogen, Protein, and Amino Acid Analysis
A HACH high-range total nitrogen assay method (HACH Corporation, Loveland, CO, USA) was used to measure the total nitrogen concentration (mg L−1) in each sample. The nitrogen concentration obtained was multiplied by a factor of 6.25 to obtain the protein concentration (Piorreck et al., 1984; Chronakis et al., 2000; Safi et al., 2013a). A modified Lowry protein assay was used to determine the hydro-soluble protein content (Lowry et al., 1951). Bovine serum albumin (BSA) was used to prepare the standard curve for Lowry protein quantification. Nitrogen content (% N on dry basis) was obtained from the C, H, N, S elemental analysis carried out using a LECO brand analyzer (Model CHNS-932) according to the methods described in ASTM D 5291 and D 3176 (Jena et al., 2011a). Protein content (based on elemental analysis) was determined by multiplying the nitrogen content by the conversion factor of 6.25. Amino acid analysis and quantification was carried out by the University of Missouri Agricultural Experiment Station (Columbia, MO, USA). The proteins in the feed and product fractions were visualized under denatured conditions by SDS-PAGE using a Bio-Rad Miniprotean System™ with Any kD™ gels (Bio-Rad Laboratories, Hercules, CA, USA) (Gerde et al., 2013).
Total Solids and Non-Protein Components Analysis
Total solids content was determined by drying the samples at 105°C for 4 h in a conventional oven (Sluiter et al., 2008a). Lipids were extracted by Folch extraction method using chloroform/methanol mixture (2:1 ratio) (Folch et al., 1957), followed by centrifugation at 2600 g for 10 min. The chloroform-soluble fractions were analyzed for fatty acids by preparing fatty acid methyl esters (FAMES) by methanolysis (1M methanolic HCl, 80°C, 16 h) and subjecting to GC-MS analysis using a non-polar DB-1 capillary column equipped with mass selective detector following procedures as described (York et al., 1986). All extracts were first analyzed without any internal standard, allowing the use of behenic acid (C:22:0, 10 μg) as an appropriate internal standard. Hydroxy fatty acids were subjected to trimethylsilylation following methanolysis to facilitate GC separation; the response factors of common normal chain saturated and unsaturated fatty acid standards, and 2-hydroxy myristic acid standard were normalized relative to that of behenic acid. Ash content was determined after drying the samples in a conventional oven for 4 h and then incinerating them in a furnace at 575°C for 3 h using a slightly modified version of the NREL procedure (Sluiter et al., 2008b). The rest of biomass which comprises predominantly of carbohydrates and small amounts of other cellular components may simply be considered as the carbohydrate fraction for convenience. Thus, the carbohydrate content was determined by the difference (Valdez et al., 2014).
PG Analysis
The product fractions were delipidated by the Folch lipid extraction method described in Section “Total Solids and Non-Protein Components Analysis” and then subjected to PG component analysis. In order to identify and quantify PG amino acids, a portion of the delipidated samples was hydrolyzed in 6M HCl for 16 h at 105°C followed by methanolysis for 4 h at 80°C to yield methyl esters of amino acids, and finally derivatized with heptafluorobutyric anhydride (HFBA), which yields the N-heptafluorobutyrate (and O- heptafluorobutyrate for Serine and Threonine) derivatives of the PG-derived amino acids (Pons et al., 2003). The method was modified slightly wherein trans-esterification with isoamylalcohol was not performed and 2-amino adipic acid (25 μg) was used as internal standard. The resulting methyl esterified, HFBA derivatives were analyzed by GC-MS analysis using the DB-1 capillary column programed to 240°C. For PG carbohydrate analysis, a separate aliquot was hydrolyzed in 1M HCl for 2 h at 105°C followed by methanolysis for 6 h at 80°C followed by N-acetylation (acetic anhydride/pyridine in methanol, 1:1:10 v/v, 45 min, 50°C) and trimethylsilylation using “Tri-Sil” reagent (20 min, 80°C) (York et al., 1986). Carbohydrates were measured relative to the internal standard myo-inositol (20 μg). The resulting HFBA-amino acids and TMS-methyl glycosides of monosaccharide sugars were analyzed separately by GC-MS analysis using a 30 m DB-1 capillary column with electron impact mass fragmentation and detection, using temperature programs optimized for separately analyzing the amino acid and carbohydrate derivatives.
Results and Discussion
Protein Isolation Optimization
Comparison of Different Pretreatments
The results indicated that both high-pressure homogenization and ultrasonication resulted in a higher protein recovery in the supernatant compared to control (Figure S2 in Supplementary Material). High-pressure homogenization was the better of the two pretreatments with a protein recovery of 83.5% as opposed to 69.9% in case of ultrasonication. Microscopic observation of the disrupted cells showed greater cell disruption with the former compared to the latter (Figure S3 in Supplementary Material). Similar trend was reported for various algae and cyanobacteria (Safi et al., 2014; Ursu et al., 2014). Cell counting revealed that high-pressure homogenization resulted in a near-complete cell lysis with disruption efficiency >99%, thus releasing most of the intra-cellular proteins. Autoclave treatment was the worst among all pretreatments with a protein recovery of only 29%, which was slightly lower than the 32.1% in the control. No visible cell disruption was observed under the microscope for the autoclaved S. platensis cells, explaining the lack of improvement in protein recovery. Thus, high-pressure homogenizer-based cell disruption was chosen as a pretreatment for all further protein isolation experiments.
Protein Solubility Curve
The solubility curve (Figure 1) showed that protein solubility (recovery in the supernatant) decreased with increasing pH in the acidic range of 2–4 and increased steadily in the range of 4–7. Least solubility was observed in the proximity of pH 4. High solubility (>75% recovery) was observed in the alkaline range of 7–12. However, under extremely high alkaline conditions (beyond pH 12) the solubility decreased notably. This could be a result of significant protein denaturation and clustering, rendering the proteins insoluble (Haque et al., 2005). The variation in protein recovery was only about 10% in the entire pH range of 6–12, although the trend was irregular. Highest recovery was obtained at pH 11 and closely followed by pH 8. These results differed from those reported for green algae. For Chlorella vulgaris the solubilization after cell lysis was 19% higher at pH 12 compared to pH 7 (Ursu et al., 2014). For Nannochloropsis species, protein solubilization was reported to increase with increasing pH all the way until 13 (Gerde et al., 2013). Thus, pH 11 and 8 were further explored under different experimental conditions to determine the better of the two for protein solubilization. A 3% S. platensis biomass slurry subjected to cell disruption by high-pressure homogenization and protein solubilization resulted in 87.9% protein recovery at pH 11 as opposed to 77.8% at pH 8. Similarly, S. platensis biomass at nearly the same solids content but disrupted using ultrasonication resulted in 58.2% protein recovery at pH 11 while only 38.7% at pH 8. Thus, pH 11 was better than 8 for protein solubilization.
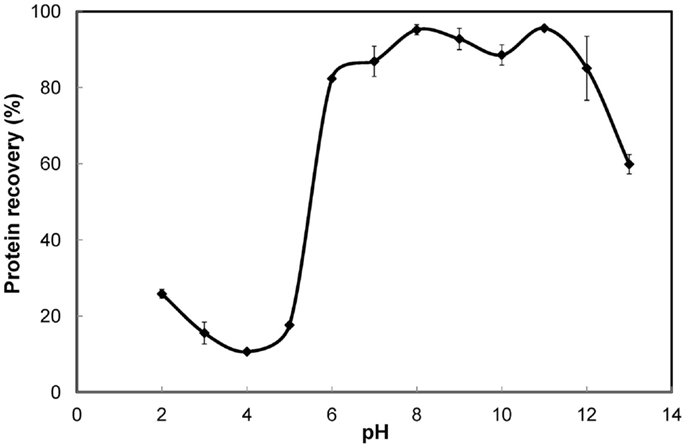
Figure 1. Solubility curve for S. platensis biomass. Error bars represent standard deviation of mean.
Optimization of Protein Isolation Using RSM
pH ranges of 10.5–12 and 3–5 that were in the proximity (within 1 U) of the points of highest and least solubility (reported in Section “Protein Solubility Curve”) were chosen for the design of protein solubilization and precipitation optimization experiments, respectively. Figure 2A shows the scattered plot between experimentally determined and RSM predicted protein recoveries in the alkali supernatant at different levels of the input variables. The experimental recovery varied from 64.87 to 95.6% (data presented in Table S1 in Supplementary Material). The regression coefficients of the second degree polynomial used to fit the protein recovery data, the standard error in their estimation, and the statistical analysis are presented in Table 1. The regression equation obtained from the analysis was as follows:
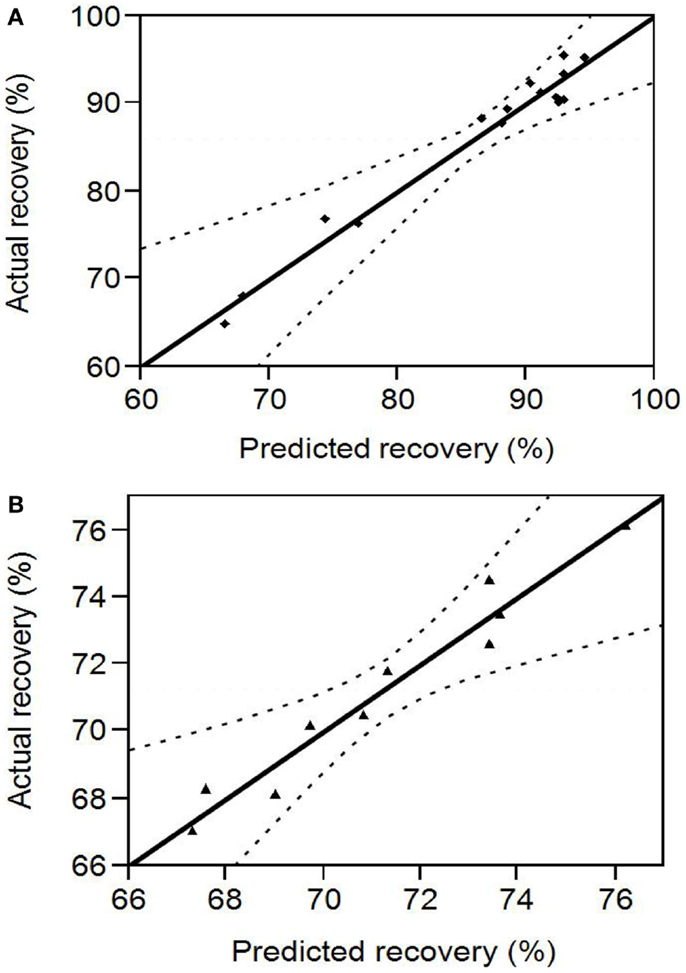
Figure 2. (A) Comparison between RSM predicted and experimental protein recovery for the alkali solubilization step. The region within the dotted lines represents a 95% confidence interval (B) Comparison between RSM predicted and experimental protein recovery for the acid precipitation step. The region within the dotted lines represents a 95% confidence interval.
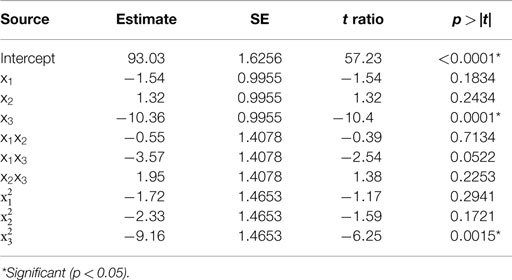
Table 1. Estimate of the regression coefficients for the alkali solubilization optimization model and their statistical significance determined by Student’s t-test.
The predicted recoveries were highly significant (p = 0.0027) and the coefficient of determination (R2) for this model was 0.97, indicating a good fit. The results from the t-test showed that biomass concentration was a highly significant factor (p = 0.0001) in impacting protein recovery. The other two factors, pH, and solubilization time were not significant in the chosen range. However, the interaction of pH and biomass concentration was slightly significant (p = 0.0522 < 0.1). Among the quadratic effects, only the quadratic biomass concentration term was highly significant (p = 0.0015). The rest of the interaction and quadratic terms were not significant. The optimal values for pH, solubilization time, and biomass concentration determined by RSM were 11.38, 35.32 min, and 3.61% (w/w) solids, respectively, and the predicted value of the response (protein recovery) at these conditions was 96%.
Formic acid is a weak organic acid compared to hydrochloric acid which is a strong inorganic acid. In a comparative study, protein recovery in the acid pellet (protein isolate) was 71.7% when precipitation was carried out using HCl and 71.5% using HCOOH at the same experimental conditions. Thus, the substitution of HCOOH for HCl did not show any significant impact on protein precipitation. The former is more preferable than the latter when the residual biomass is intended to be used for biofuel production processes because chloride ions can corrode reactor vessels in thermochemical processes such as HTL (Kritzer, 2004), and the NaCl formed as a result of NaOH and HCl added during the protein isolation process can be toxic to the microbes in biochemical processes such as AD (Chen et al., 2008). Thus, HCOOH was used for protein precipitation in all further experiments.
Figure 2B shows the scattered plot between experimental and RSM predicted protein recoveries in the acid pellet at different levels of the input variables. The experimental recovery varied from 67 to 74.5% (data presented in Table S2 in Supplementary Material). The regression coefficients of the second degree polynomial used to fit the protein recovery data, the standard error in their estimation, and their statistical analysis are presented in Table 2. The regression equation obtained from the analysis is as follows:
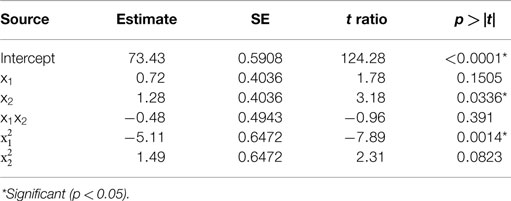
Table 2. Estimate of the regression coefficients for the acid precipitation optimization model and their statistical significance determined by Student’s t-test.
The predicted recoveries were significant (p = 0.01) and the coefficient of determination (R2) for this model was 0.95, indicating a reasonably good fit. The results from the t-test showed that precipitation time was a significant factor (p = 0.03) in impacting the protein recovery. The quadratic regression term for pH was highly significant (p = 0.0014) but not the linear term, implying a quadratic dependence of protein recovery on pH in the chosen range. The quadratic term for precipitation time was slightly significant (p = 0.0823 < 0.1). However, the interaction of pH and time was not significant implying that both of these factors are independent of each other in the chosen range. The model predicted the solution to be a saddle point. However, based on single parameter profiles, the optimum conditions for maximum protein precipitation were determined as pH 4.01 and precipitation time of 60 min. The predicted value of the response (protein recovery) at these values was 76.2%.
The RSM predicted maximum for overall protein yield after the alkali solubilization and acid precipitation steps was calculated as 73.15%. The experimentally determined protein recovery in the alkali supernatant and acid pellet at the RSM optimized process conditions for the solubilization and precipitation steps were 86 and 70.6%, respectively. Although the experimental recoveries for both the steps were lower than the theoretically predicted values, the variation (10.4 and 7.3%, respectively) was within acceptable limits, considering the scale of operation (the amount of biomass used in each of the optimization experiments was 10 times lower than that used in the protein isolation process at the optimized conditions), handling, and instrumental errors. The overall experimental protein yield at the optimum conditions was 60.7%.
Component Fractionation among the Product Fractions
Figure 3A shows the fractionation of various components between the protein isolate and the residual biomass obtained at the RSM optimized process conditions. The overall yield of total nitrogen and hence the yield of total protein in the protein isolate was 60.7%. This value was higher than the yields reported in the literature for proteins extracted using alkali–acid method from green algae (Gerde et al., 2013; Ursu et al., 2014) but lower than the 80% yield reported for S. platensis protein isolates (Devi et al., 1981). The higher yield reported in the latter case was a result of the use of hexane defatted biomass as the starting material and the repeated (three times) aqueous extraction and dialysis steps. Lowry protein assay estimated that 56.9% of soluble proteins were recovered in the protein isolate affecting a lower recovery in the residual biomass. The total solids fractionated almost equally between the two product fractions and so did the total lipids. However, carbohydrate recovery was higher in the residual biomass compared to the protein isolate.
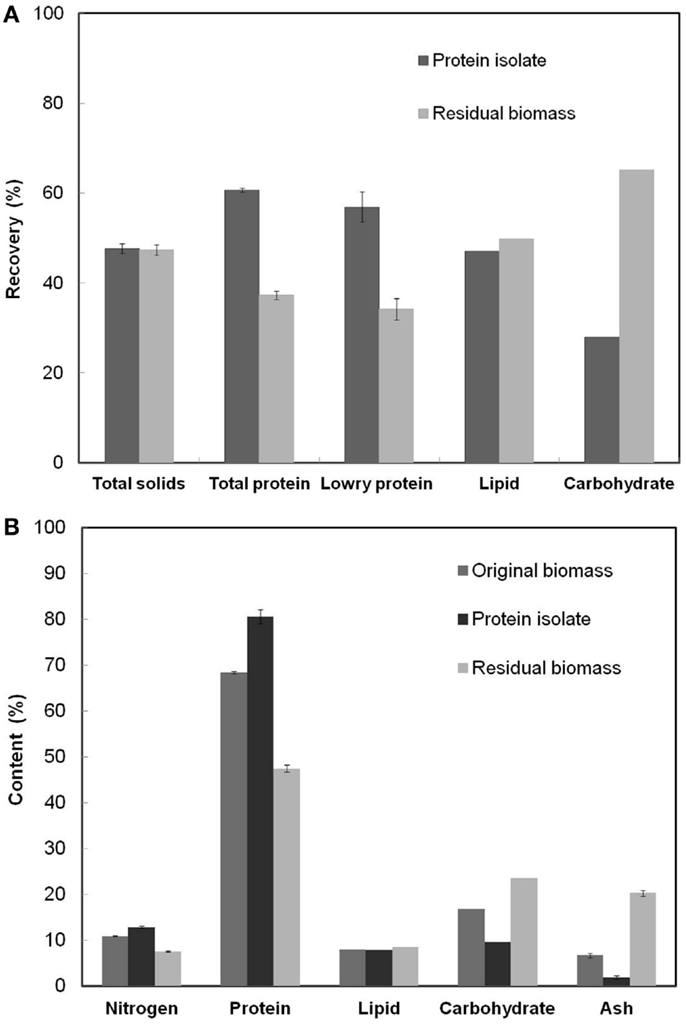
Figure 3. (A) Overall recoveries of various cell components in the protein isolate and the residual biomass fractions (B) The contents of various cell components in the original biomass, protein isolate, and residual biomass. The analyzed product fractions were obtained at the RSM optimized conditions [Alkali step: (pH: 11.38, solubilization time: 35.3 min, biomass concentration: 3.61%); Acid step: (pH: 4.01, precipitation time: 60 min)]. Error bars represent standard deviation of mean.
The calculated purity or the protein content (% w/w) in the protein isolate was 80.6%, which was 12.2% higher than S. platensis biomass. This value of protein content was higher than that reported in the literature for the protein isolate obtained from S. platensis using a slightly different procedure (Chronakis et al., 2000). Recovery of non-protein components in the protein isolate due to co-precipitation of insoluble carbohydrates, cell wall PG fragments (composed of amino sugars), and lipids limited the purity of this fraction. The PG fragments from the cell wall of S. platensis did not possibly degrade into their respective sugar and peptide components under the relatively mild pH (=4) condition used in the protein precipitation process resulting in their co-extraction with proteins (Vollmer, 2008). Further, the residual biomass fraction had an undesirably high nitrogen and protein content (7.6 and 47.5%, respectively) indicating incomplete protein extraction, the loss of non-protein components due to co-extraction with proteins and the presence of PG fragments. A PG composition analysis based on the diagnostic markers, diaminopimelic acid (DAP) and N-acetyl muramic acid (NAMA), revealed the presence of PG fragments in both the protein isolate and the residual biomass fractions. Although the latter had a slightly higher proportion of all PG components compared to the protein isolate, their overall contents were very low compared to other cellular components. The contribution of amino sugars toward the total nitrogen and carbohydrate content in both the fractions was also extremely low (0.16 and 1.39% of the total estimated nitrogen in the two fractions, respectively). Thus, a further reduction in the nitrogen content of the residual biomass may be achieved only by repeated protein extractions involving additional processing steps and/or other unit operations. However, such procedures would demand higher processing costs and other resources, and may negatively impact the scalability of the process. Hence, this idea was not investigated in this work.
Initial Biomass, Protein Isolate, and Residual Biomass Characterization
Figure 3B shows the nitrogen and protein (based on elemental analysis), lipid, carbohydrate and ash contents in the original biomass, the protein isolate, and the residual biomass obtained at the RSM optimized conditions. The original S. platensis biomass was comprised of 10.95% nitrogen, 68.4% total protein, and 6.7% ash by weight. Analysis of the protein isolate and the residual biomass revealed higher nitrogen and protein contents and lower lipid, carbohydrate, and ash contents in the protein isolate compared to the residual biomass, which was in accordance with the desired outcome. The former was enriched in proteins while the latter was enriched in non-protein components. Although only 50% of the total lipids were recovered in the residual biomass, this did not have a huge impact on its composition due to the low lipid content of the original S. platensis biomass (8.03%).
The PG carbohydrate analysis method described in Section “PG Analysis” also quantified non-PG originated sugars present in the biomass in addition to the PG amino sugars. The relative composition (% w/w) of the detected sugars in the protein isolate and the residual biomass fractions are shown in Figure 4A. A major proportion of the sugars were glucose, which accounted for 77.50 and 63.84% of the total sugars (by weight) in each of these fractions, respectively. This was expected, given that glucose is the most abundant sugar present in S. platensis (Shekharam et al., 1987). Galactose accounted for 8.24 and 12.72% in the protein isolate and the residual biomass, respectively. The PG amino sugars NAMA and GlcNAc accounted for 6.11 and 11.39% of the total sugars, respectively in the residual biomass. In the protein isolate the proportions of these amino sugars were 1.52% NAMA and 5% GlcNAc. Small amounts of mannose, 3-methyl hexose and fucose were also detected in both of these fractions.
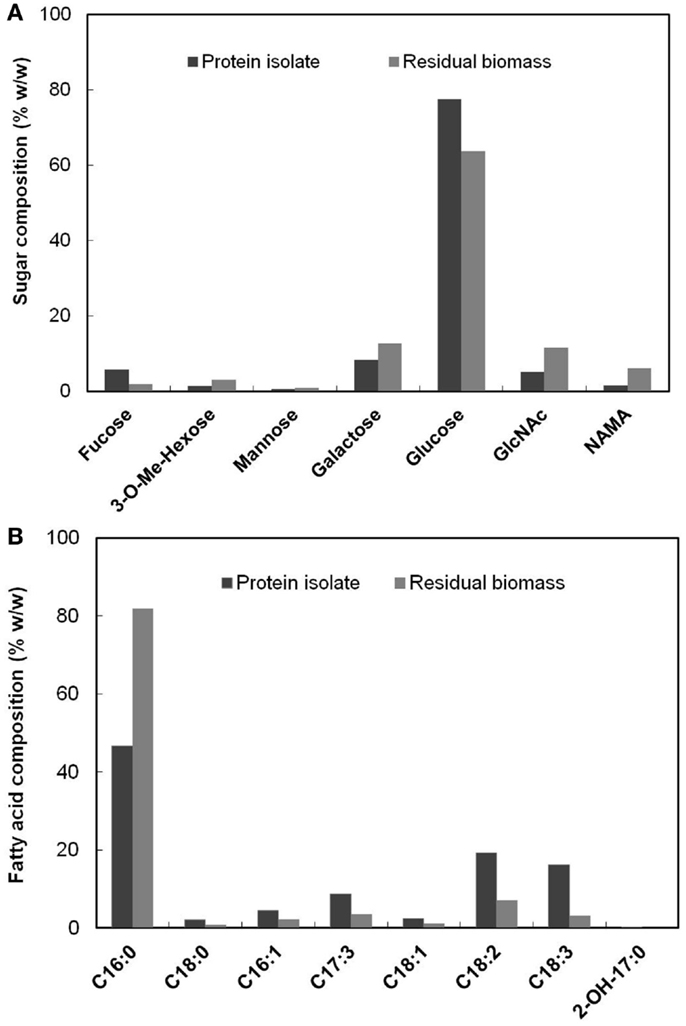
Figure 4. (A) Composition (% w/w) of each of the sugars present in the protein isolate and the residual biomass relative to total sugars in the respective fraction (B) Composition (% w/w) of each of the fatty acids present in the protein isolate and the residual biomass relative to total fatty acids in the respective fraction.
Figure 4B shows the relative composition (% w/w) of the fatty acids detected by FAMES analysis in the protein isolate and the residual biomass. C16:0 (Palmitic acid) was the dominant fatty acid in both the fractions, as was the case for original S. platensis biomass (Cohen, 1997). However, this fatty acid represented 81.83% of the total fatty acids in the residual biomass but only 46.76% of the protein isolate. The latter contained significant amounts of mono- and poly-unsaturated fatty acids (C16–18) while the residual biomass had very small amounts. These and other fatty acids typically originate from membrane phospholipids where they are acylated to moieties carrying choline (phosphatidyl choline) and other polar head groups (Hoiczyk and Hansel, 2000). An α-hydroxy fatty acid (2-OH-C17:0) was detected in low levels in the protein isolate, but not in the residual biomass. These results clearly indicated that the protein isolate was enriched in poly-unsaturated fatty acids while the residual biomass was enriched in saturated fatty acids. The former had a higher proportion of the essential fatty acid, γ-linolenic acid (C18:3) compared to the original S. platensis biomass. This and other unsaturated fatty acids can be separated from the protein isolate using methods such as supercritical CO2 extraction and urea complex formation (Cohen et al., 1993; Mendes et al., 2005) to yield high-value co-products. The lower proportion of unsaturated fatty acids in the residual biomass is favorable for biofuel production processes because they could result in lower oxidative stability (rancidification) of the generated biofuel (Gunstone, 1967).
SDS-PAGE analysis revealed that several lighter (low protein concentration) bands observed in the molecular weight range of 25–100 kDa in original S. platensis biomass were not found in the disrupted biomass implying protein degradation as a result of cell disruption by high-pressure homogenization (Figure S4 in Supplementary Material). The bands around 100 and 55 kDa were the most prominent ones among both the protein isolate and residual biomass fractions, although they were lighter in the latter indicating lower concentration of these proteins in this fraction. Thus, a higher proportion of the high molecular weight proteins fractionated into the protein isolate. Some of the bands observed in the disrupted biomass between 15 and 20 kDa were not observed in the protein isolate and the residual biomass fractions suggesting that these low molecular weight proteins degraded into peptide components during the protein isolation process. Further, the small dark band at the bottom of the gel in the original biomass was observed only in the residual biomass and not in the protein isolate, indicating that the low molecular weight peptides and free amino acids typically present in algae remained in the residual biomass.
The protein isolate obtained at a low ash content of 1.9% was freeze dried and further analyzed for amino acid and mineral contents. The results presented in Table 3 show that the variation in the composition of a majority of the amino acids between the protein isolate and the edible original S. platensis biomass was low (below 10%). The contents of six out of the eight essential amino acids were slightly higher in the protein isolate. S. platensis biomass has widely been accepted as a rich protein source for humans and animals (Becker, 2004) and hence the protein isolate could potentially be used in these applications. The predominant minerals present in the protein isolate were aluminum, calcium, iron, potassium, magnesium, sodium, phosphorus, sulfur, and silicon (Table S4 in Supplementary Material). Except for sodium, the composition of all the elements was lower than original S. platensis biomass (Jena et al., 2011b) and hence is within agreeable limits for nutritional purposes. The excess sodium originated from the NaOH added during the solubilization step.
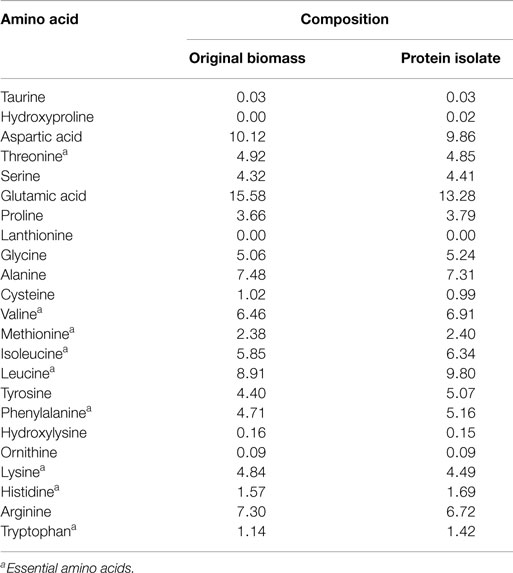
Table 3. Amino acid composition (expressed as g/100 g total amino acids) of the original S. platensis biomass and the protein isolate.
Conclusion
In this study, protein isolation from S. platensis cyanobacterium was carried out using the alkali–acid method after cell disruption using high-pressure homogenization. The process conditions were optimized using RSM. At the optimized conditions, the proteins were extracted at a high yield of 60.7% and content of 80.6%. Further improvement of protein extraction was limited by co-fractionation of the non-protein components into the protein isolate and incomplete protein precipitation. The extracted protein isolate was enriched in proteins, essential amino acids, and unsaturated fatty acids, and had a lower ash and mineral content compared to the original biomass. Such a composition is suitable for human food or animal feed applications. The residual biomass had a lower protein and nitrogen content than the original biomass and was enriched in carbohydrates and saturated lipids, a composition better suited for biofuel applications such as HTL and AD.
Conflict of Interest Statement
The authors declare that the research was conducted in the absence of any commercial or financial relationships that could be construed as a potential conflict of interest. The Guest Associate Editor S. Kent Hoekman declares that, despite having collaborated with author Keshav C. Das, the review process was handled objectively and no conflict of interest exists.
Acknowledgments
This research was funded in part by the Department of Defense ARO grant W911NF-11-1-0218 (KD, PI) and the Department of Energy grant DE-FG02-93ER20097 (A. Darvill, PI) for the Center for Plant and Microbial Complex Carbohydrates (Complex Carbohydrate Research Center), at the University of Georgia. The authors thankfully acknowledge Dr. David Blum, Paul Volny, and Ron Garrison for their assistance with laboratory analyses and equipment.
Supplementary Material
The Supplementary Material for this article can be found online at https://www.frontiersin.org/article/10.3389/fenrg.2015.00030
References
Abas Wani, A., Sogi, D., Grover, L., and Saxena, D. (2006). Effect of temperature, alkali concentration, mixing time and meal/solvent ratio on the extraction of watermelon seed proteins – a response surface approach. Biosyst. Eng. 94, 67–73. doi: 10.1016/j.biosystemseng.2006.02.004
Becker, E. W. (2007). Micro-algae as a source of protein. Biotechnol. Adv. 25, 207–210. doi:10.1016/j.biotechadv.2006.11.002
Becker, E. W. (2004). “Microalgae in human and animal nutrition,” in Handbook of Microalgal Culture: Biotechnology and Applied Phycology, ed. A. Richmond (Oxford: Blackwell Publishing), 312.
Chen, Y., Cheng, J. J., and Creamer, K. S. (2008). Inhibition of anaerobic digestion process: a review. Bioresour. Technol. 99, 4044–4064. doi:10.1016/j.biortech.2007.01.057
Choi, Y. R., and Markakis, P. (1981). Blue-green algae as a source of protein. Food Chem. 7, 239–247. doi:10.1016/0308-8146(81)90029-7
Chronakis, I. S., Galatanu, A. N., Nylander, T., and Lindman, B. (2000). The behaviour of protein preparations from blue-green algae (Spirulina platensis strain Pacifica) at the air/water interface. Colloids Surf. A Physicochem. Eng. Asp. 173, 181–192. doi:10.1016/s0927-7757(00)00548-3
Cohen, Z. (1997). “The chemicals of spirulina,” in Spirulina Platensis Arthrospira: Physiology, Cell-Biology and Biotechnology, ed. A. Vonshak (London: CRC Press), 175–204.
Cohen, Z., Reungjitchachawali, M., Siangdung, W., and Tanticharoen, M. (1993). Production and partial purification of γ-linolenic acid and some pigments from Spirulina platensis. J. Appl. Phycol. 5, 109–115. doi:10.1007/bf02182428
Damodaran, S. (1996). “Amino acids, peptides and proteins,” in Food Chemistry, ed. O. R. Fennema (New York, NY: Marcel Dekker, Inc.), 321–430.
Devi, M. A., Subbulakshmi, G., Devi, K. M., and Venkataraman, L. V. (1981). Studies on the proteins of mass-cultivated, blue-green alga (Spirulina platensis). J. Agric. Food Chem. 29, 522–525. doi:10.1021/jf00105a022
Firatligil-Durmus, E., and Evranuz, O. (2010). Response surface methodology for protein extraction optimization of red pepper seed (Capsicum frutescens). LWT Food Sci. Technol. 43, 226–231. doi:10.1016/j.lwt.2009.08.017
Folch, J., Lees, M., and Sloane-Stanley, G. (1957). A simple method for the isolation and purification of total lipids from animal tissues. J. Biol. Chem. 226, 497–509.
Gerde, J. A., Wang, T., Yao, L., Jung, S., Johnson, L. A., and Lamsal, B. (2013). Optimizing protein isolation from defatted and non-defatted Nannochloropsis microalgae biomass. Algal Res. 2, 145–153. doi:10.1016/j.algal.2013.02.001
Goetz, J., and Koehler, P. (2005). Study of the thermal denaturation of selected proteins of whey and egg by low resolution NMR. LWT Food Sci. Technol. 38, 501–512. doi:10.1016/j.lwt.2004.07.009
Gunstone, F. D. (1967). An Introduction to the Chemistry and Biochemistry of Fatty Acids and Their Glycerides, 2 Edn. London: Chapman and Hall.
Haque, I., Singh, R., Moosavi-Movahedi, A. A., and Ahmad, F. (2005). Effect of polyol osmolytes on δGD, the Gibbs energy of stabilisation of proteins at different pH values. Biophys. Chem. 117, 1–12. doi:10.1016/j.bpc.2005.04.004
Hoiczyk, E., and Hansel, A. (2000). Cyanobacterial cell walls: news from an unusual prokaryotic envelope. J. Bacteriol. 182, 1191–1199. doi:10.1128/JB.182.5.1191-1199.2000
Jena, U., Das, K. C., and Kastner, J. R. (2011a). Effect of operating conditions of thermochemical liquefaction on biocrude production from Spirulina platensis. Bioresour. Technol. 102, 6221–6229. doi:10.1016/j.biortech.2011.02.057
Jena, U., Vaidyanathan, N., Chinnasamy, S., and Das, K. (2011b). Evaluation of microalgae cultivation using recovered aqueous co-product from thermochemical liquefaction of algal biomass. Bioresour. Technol. 102, 3380–3387. doi:10.1016/j.biortech.2010.09.111
Kritzer, P. (2004). Corrosion in high-temperature and supercritical water and aqueous solutions: a review. J. Supercrit. Fluids 29, 1–29. doi:10.1016/S0896-8446(03)00031-7
López Barreiro, D., Prins, W., Ronsse, F., and Brilman, W. (2013). Hydrothermal liquefaction (HTL) of microalgae for biofuel production: state of the art review and future prospects. Biomass Bioenergy 53, 113–127. doi:10.1016/j.biombioe.2012.12.029
Lowry, O. H., Rosebrough, N. J., Farr, A. L., and Randall, R. J. (1951). Protein measurement with the Folin phenol reagent. J. Biol. Chem. 193, 265–275.
Ma, T., Wang, Q., and Wu, H. (2010). Optimization of extraction conditions for improving solubility of peanut protein concentrates by response surface methodology. LWT Food Sci. Technol. 43, 1450–1455. doi:10.1016/j.lwt.2010.03.015
Mendes, R. L., Reis, A. D., Pereira, A. P., Cardoso, M. T., Palavra, A. F., and Coelho, J. P. (2005). Supercritical CO2 extraction of γ-linolenic acid (GLA) from the cyanobacterium Arthrospira (spirulina) maxima: experiments and modeling. Chem. Eng. J. 105, 147–151. doi:10.1016/j.cej.2004.10.006
Palinska, K. A., and Krumbein, W. E. (2000). Perforation patterns in the peptidoglycan wall of filamentous cyanobacteria. J. Phycol. 36, 139–145. doi:10.1046/j.1529-8817.2000.99040.x
Payne, M. F., and Rippingale, R. J. (2000). Evaluation of diets for culture of the calanoid copepod gladioferens imparipes. Aquaculture 187, 85–96. doi:10.1016/S0044-8486(99)00391-9
Piorreck, M., Baasch, K.-H., and Pohl, P. (1984). Biomass production, total protein, chlorophylls, lipids and fatty acids of freshwater green and blue-green algae under different nitrogen regimes. Phytochemistry 23, 207–216. doi:10.1016/S0031-9422(00)80304-0
Pons, A., Richet, C., Robbe, C., Herrmann, A., Timmerman, P., Huet, G., et al. (2003). Sequential GC/MS analysis of sialic acids, monosaccharides, and amino acids of glycoproteins on a single sample as heptafluorobutyrate derivatives. Biochemistry 42, 8342–8353. doi:10.1021/bi034250e
Prabakaran, P., and Ravindran, A. D. (2011). A comparative study on effective cell disruption methods for lipid extraction from microalgae. Lett. Appl. Microbiol. 53, 150–154. doi:10.1111/j.1472-765X.2011.03082.x
Quanhong, L., and Caili, F. (2005). Application of response surface methodology for extraction optimization of germinant pumpkin seeds protein. Food Chem. 92, 701–706. doi:10.1016/j.foodchem.2004.08.042
Safi, C., Charton, M., Pignolet, O., Pontalier, P.-Y., and Vaca-Garcia, C. (2013a). Evaluation of the protein quality of Porphyridium cruentum. J. Appl. Phycol. 25, 497–501. doi:10.1007/s10811-012-9883-4
Safi, C., Charton, M., Pignolet, O., Silvestre, F., Vaca-Garcia, C., and Pontalier, P.-Y. (2013b). Influence of microalgae cell wall characteristics on protein extractability and determination of nitrogen-to-protein conversion factors. J. Appl. Phycol. 25, 523–529. doi:10.1007/s10811-012-9886-1
Safi, C., Ursu, A. V., Laroche, C., Zebib, B., Merah, O., Pontalier, P.-Y., et al. (2014). Aqueous extraction of proteins from microalgae: effect of different cell disruption methods. Algal Res. 3, 61–65. doi:10.1016/j.algal.2013.12.004
Shekharam, K. M., Venkataraman, L. V., and Salimath, P. V. (1987). Carbohydrate composition and characterization of two unusual sugars from the blue green alga Spirulina platensis. Phytochemistry 26, 2267–2269. doi:10.1016/S0031-9422(00)84698-1
Sluiter, A., Hames, B., Hyman, D., Payne, C., Ruiz, R., Scarlata, C., et al. (2008a). “Determination of Total Solids in Biomass and Total Dissolved Solids in Liquid Process Samples”. NREL Technical Report No. NREL/TP-510-42621. Golden, CO: National Renewable Energy Laboratory.
Sluiter, A., Hames, B., Ruiz, R., Scarlata, C., Sluiter, J., and Templeton, D. (2008b). “Determination of Ash in Biomass”. NREL Technical Report No. NREL/TP-510-42622. Golden, CO: National Renewable Energy Laboratory.
Spolaore, P., Joannis-Cassan, C., Duran, E., and Isambert, A. (2006). Commercial applications of microalgae. J. Biosci. Bioeng. 101, 87–96. doi:10.1263/jbb.101.87
Ursu, A.-V., Marcati, A., Sayd, T., Sante-Lhoutellier, V., Djelveh, G., and Michaud, P. (2014). Extraction, fractionation and functional properties of proteins from the microalgae Chlorella vulgaris. Bioresour. Technol. 157, 134–139. doi:10.1016/j.biortech.2014.01.071
Valdez, P. J., Tocco, V. J., and Savage, P. E. (2014). A general kinetic model for the hydrothermal liquefaction of microalgae. Bioresour. Technol. 163, 123–127. doi:10.1016/j.biortech.2014.04.013
Vollmer, W. (2008). Structural variation in the glycan strands of bacterial peptidoglycan. FEMS Microbiol. Rev. 32, 287–306. doi:10.1111/j.1574-6976.2007.00088.x
Wang, X., and Zhang, X. (2012). Optimal extraction and hydrolysis of Chlorella pyrenoidosa proteins. Bioresour. Technol. 126, 307–313. doi:10.1016/j.biortech.2012.09.059
York, W. S., Darvill, A. G., McNeil, M., Stevenson, T. T., and Albersheim, P. (1986). Isolation and characterization of plant cell walls and cell wall components. Meth. Enzymol. 118, 3–40.
Keywords: Spirulina platensis, protein isolate, high-pressure homogenization, response surface methodology, residual biomass, biofuel feedstock
Citation: Parimi NS, Singh M, Kastner JR, Das KC, Forsberg LS and Azadi P (2015) Optimization of protein extraction from Spirulina platensis to generate a potential co-product and a biofuel feedstock with reduced nitrogen content. Front. Energy Res. 3:30. doi: 10.3389/fenrg.2015.00030
Received: 03 February 2015; Accepted: 10 June 2015;
Published: 23 June 2015
Edited by:
S. Kent Hoekman, Desert Research Institute, USAReviewed by:
John Chandler Cushman, University of Nevada, USAArumugam Muthu, Council of Scientific and Industrial Research, India
Mi Li, Oak Ridge National Laboratory, USA
Copyright: © 2015 Parimi, Singh, Kastner, Das, Forsberg and Azadi. This is an open-access article distributed under the terms of the Creative Commons Attribution License (CC BY). The use, distribution or reproduction in other forums is permitted, provided the original author(s) or licensor are credited and that the original publication in this journal is cited, in accordance with accepted academic practice. No use, distribution or reproduction is permitted which does not comply with these terms.
*Correspondence: Keshav C. Das, Driftmier Engineering Center, University of Georgia, Room 509, Athens, GA 30602, USA, kdas@engr.uga.edu