Making the Sustainable Development Goals Consistent with Sustainability
 Mathis Wackernagel
 Laurel Hanscom
 David Lin
- Global Footprint Network, Oakland, CA, United States
The UN’s Sustainable development Goals (SDGs) are the most significant global effort so far to advance global sustainable development. Bertelsmann Stiftung and the sustainable development solutions network released an SDG index to assess countries’ average performance on SDGs. Ranking high on the SDG index strongly correlates with high per person demand on nature (or “Footprints”), and low ranking with low Footprints, making evident that the SDGs as expressed today vastly underperform on sustainability. Such underperformance is anti-poor because lowest-income people exposed to resource insecurity will lack the financial means to shield themselves from the consequences. Given the significance of the SDGs for guiding development, rigorous accounting is essential for making them consistent with the goals of sustainable development: thriving within the means of planet Earth.
Introduction: Sustainable Development Goals (SDGs) and Their Context
Sustainable development has finally become the North Star for the international community. While introduced only 30 years ago to the UN through the “Brundtland commission” (World Commission on Environment and Development, 1987), it has now moved center stage: it is referenced on the UN’s home page,1 and it has its dedicated website.2 This extraordinarily positive public endorsement reflects the world’s official commitment to everyone’s wellbeing (development), while recognizing the need to operate within the planet’s ecological limits (sustainable). This is the essence of any serious sustainable development definition, including WWF, IUCN, and UNEP’s “improving the quality of human life while living within the carrying capacity of supporting eco-systems” [WWF (World Wide Fund for Nature), IUCN (International Union for Conservation of Nature), and UNEP (United Nations Environment Programme), 1991] or the Brundtland commission’s “sustainable development is development that meets the needs of the present without compromising the ability of future generations to meet their own needs” (World Commission on Environment and Development, 1987). While the latter does not explicitly reference biophysical constraints or resource security (the inverse of biophysical constraints), it does so implicitly: a depleted planet will not be able to provide the necessary physical inputs for future generations.
The fact that the world’s regenerative capacity is overstretched is hardly disputed, nor that natural capital is becoming a limiting factor for current and future human activities. The Millennium Ecosystem Assessment (2005) and research backing the planetary boundaries initiative (UNFCCC, 2015; Huntingford and Mercado, 2016) document severe ecological overuse, including rapid biodiversity loss, excessive nitrification, and climate change. The limitations imposed by the latter has gained more prominence through the 2015 Paris Climate Agreement’s target to not exceed 2°C warming over pre-industrial temperatures (ideally no more than 1.5°C) (UNFCCC, 2015). Yet current concentrations of 409 ppm CO2 in the atmosphere may already commit humanity to 1.5°C warming (Huntingford and Mercado, 2016). If indeed 450 ppm CO2e is the upper limit for giving humanity a high probability of staying below 2°C (IPCC, 2014), and current emissions lead to an annual 2–3 ppm increase in the atmospheric CO2 concentration (assuming, for simplicity’s sake, that non-CO2 greenhouse gases can be neglected, while in reality they add significant warming pressure), then humanity has far less than 20 years of current CO2 emissions left for the next millenium and beyond (far less than 700 Gt CO2e), whether from fossil fuel use, cement production, GHG emitting agricultural practices, or land-use change (Rockström et al., 2017).
Also, humanity’s current overall overuse of the planet’s ecosystems can be quantified. One comprehensive metric adds up all of humanity’s competing demands for biologically productive space: area for crops, fish, livestock, fiber, timber, the sequestration of excessive CO2 from fossil fuels, and productive areas used for cities and roads. In essence, this approach is straight forward, adding up all non-overlapping area uses needed to regenerate what people demand. The sum total of this area is humanity’s Ecological Footprint (Wackernagel et al., 2014). The latest, most likely conservative, estimates indicate that humanity’s demand exceeds the available capacity by over 68% (Borucke et al., 2013; Global Footprint Network, 2017). Such overuse occurs because people can emit more CO2 than the land and the oceans sequester, trees can be cut more quickly than they regrow, and fish can be harvested faster than they restock. As the flows of natural capital demanded by human activities exceed what natural capital regenerates over the same time period, this metric reveals stock depletion leading to environmental degradation. Environmental degradation means that these ecosystems ability to regenerate is reduced. For some time, this gap between human demand and regeneration can be bridged by the draw-down of natural capital, such as through forest, groundwater, soil or fish sock depletion, or by building-up of waste sinks such as CO2 accumulation in the atmosphere. But the draw-down cannot last, as explained in the carbon emission example above, which represents a significant portion of current global overuse.
Given the call for sustainable development and the clearly documented physical constraints, the question becomes whether according efforts are successful in achieving the overarching goal of wellbeing for all, within the means of nature.
The most significant global effort to comprehensively address sustainable development are the UN’s SDGs (United Nations, 2015) launched in September 2015. They are unprecedented and unique, and we profoundly laud the UN for having been able to successfully orchestrate their coming into being. Developed by UN member nations, and adopted by 190 countries, these 17 goals and their 169 targets identify global development priorities, effectively defining sustainable development through the selected targets.
Those targets provide measurable benchmarks that in return allow observers to test progress against each target (United Nations, 2015). For any village, city, region, or country, it therefore becomes straightforward to assess how fully a country has met each goal.
Measuring the SDGs: The SDG Index
Researchers, supported by two non-for-profit organizations, the Bertelsmann Stiftung and the sustainable development solutions network, used the 17 goals to construct an overarching measure of countries’ SDG performance—the SDG index. This is the only index we have found that aggregates the overall SDG performance—while other publications exist that provide measures on the various aspects, such as the World Bank’s SDG Atlas (World Bank, 2017) or the SDG indicators of the UN’s IAEG (World Bank, 2017), Given the SDG targets, the research team identified available indicators to approximate the performance for each goal and then aggregated the performance across the 17 goals, giving them equal weight. In July 2016, they presented their initial results that quantify and rank the SDG achievements of all countries through their SDG index (Sachs et al., 2016). This independently produced index scores each country’s achievements regarding each of to the 17 goals, using readily available international indicators.
While there is no internationally comparable data for all 169 targets, the SDG index evaluates each goal with one to seven indicators that provide global coverage. While limited and not perfect, as the SDG index researchers proactively concede, they represent, as explained below, a reasonable attempt to quantify each country’s performance on the SDGs.
An index has two dimensions: how each component is evaluated and how then the components are aggregated or weighed. The SDG index weighs all goals equally, which is an adequate reflection of the SDGs, since they do not suggest any hierarchy or preferences between the goals. Also, the SDG index’s choices to quantify performance of each of the goals seems reasonable, possibly with the exception of goal 11 and goal 12, which could and probably should have more focus on aspects central to resource security.
Indicators within the SDG index can be split into three categories: (1) those that decrease people’s resource dependence (e.g., activities that boost the availability of water, crops, or zero-carbon energy), (2) those that increase people’s resource dependence. These are activities that require additional resource consumption in order to work (e.g., activities that provide human benefits but need to be powered by resources in order to function such as expanding hospitals or schools), and (3) those that neither increase or decrease resource dependence. These are activities that merely organize society differently but neither protect resources nor demand more of them (e.g., securing equal rights for women or increasing transparency of decision-making).
A rough analysis shows that in the current index, the first category makes up 13.6% of the weight of the index, the second one 67.6%, and the third one 18.8%. In other words, resource demanding aspects (category 2) outpace resource securing aspects (category 1) five to one. For instance, goal 13—climate action is measured through two lenses: carbon emissions per person and vulnerability to climate change. Carbon emissions correlates with income (a category 1 indicator), vulnerability negatively correlates with income since more affluent societies have more opportunities to reduce their infrastructure’s exposure to climate calamities (a category 2 indicator). As a result, the two measures largely neutralize each other in the index. Table 1 summarizes the indicators relevant to resource security (category 1).
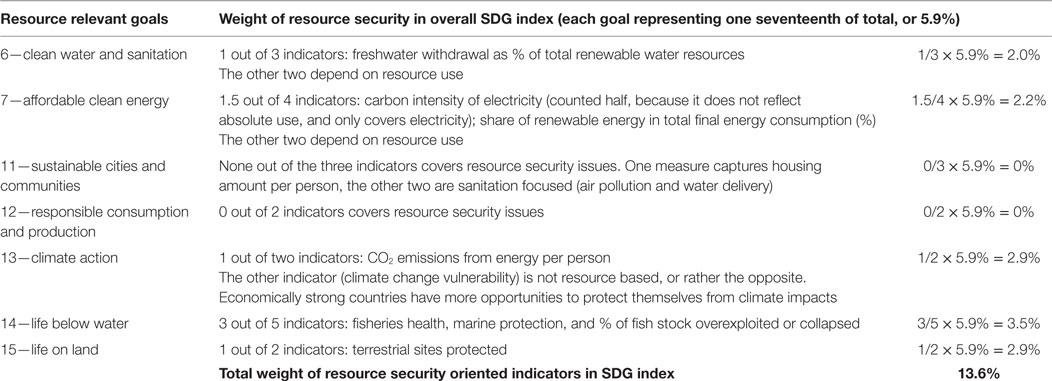
Table 1. Our analysis of the sustainable development goal (SDG) index’s sensitivity to the resource security (or sustainability) dimension of the metric.
If the index was more sensitive to resource security for goals 11 and 12 (as it probably should), resource security relevant indicators (category 1) would represent 19.5% of the weight. This assumes that at least half of the indicators for goals 11 and 12 would be measuring resource security, adding 5.9% to the 13.6% (=19.5%). This improvement in the index would reduce the weight of the resource demanding indicators to 61.7% (category 2). This reweighing would slightly improve the ratio between the two categories from 5 to 1 and 3.2 to 1 and most likely not change the argument presented below.
Evaluating the Performance of the SDGs on Sustainability
To evaluate the consistency of the SDGs with sustainable development outcome, countries’ rankings on the SDG index are marked in a diagram (Figure 1) that plots countries according to their development achievements (using the UN’s human development index) on the horizontal and their resource use (using Global Footprint Network’s Ecological Footprint) on the vertical. By identifying nations’ position according to their development status and resource demand, countries’ situation can be compared to the necessary conditions for global sustainable development. These conditions, marked as the global sustainable development quadrant, are an HDI over 0.7 for “high” (or 0.8 for “very high”) development, and less than what is available globally to make the Footprint replicable globally. This threshold could be 1.7 global hectares because this is the amount of biocapacity available per person in the world (Wackernagel et al., 2002; Global Footprint Network, 2017). It amounts to all the biologically productive land and sea areas divided by the number of people on the planet. A global hectare, used for both measuring Footprints and biocapacity, are biologically productive hectares with world average productivity. The threshold for the Footprint would need to be even lower in order to also support wild species, for instance 0.85 global hectares per person if we followed E.O. Wilson’s suggestion of leaving half the biocapacity wild (Wilson, 2016).
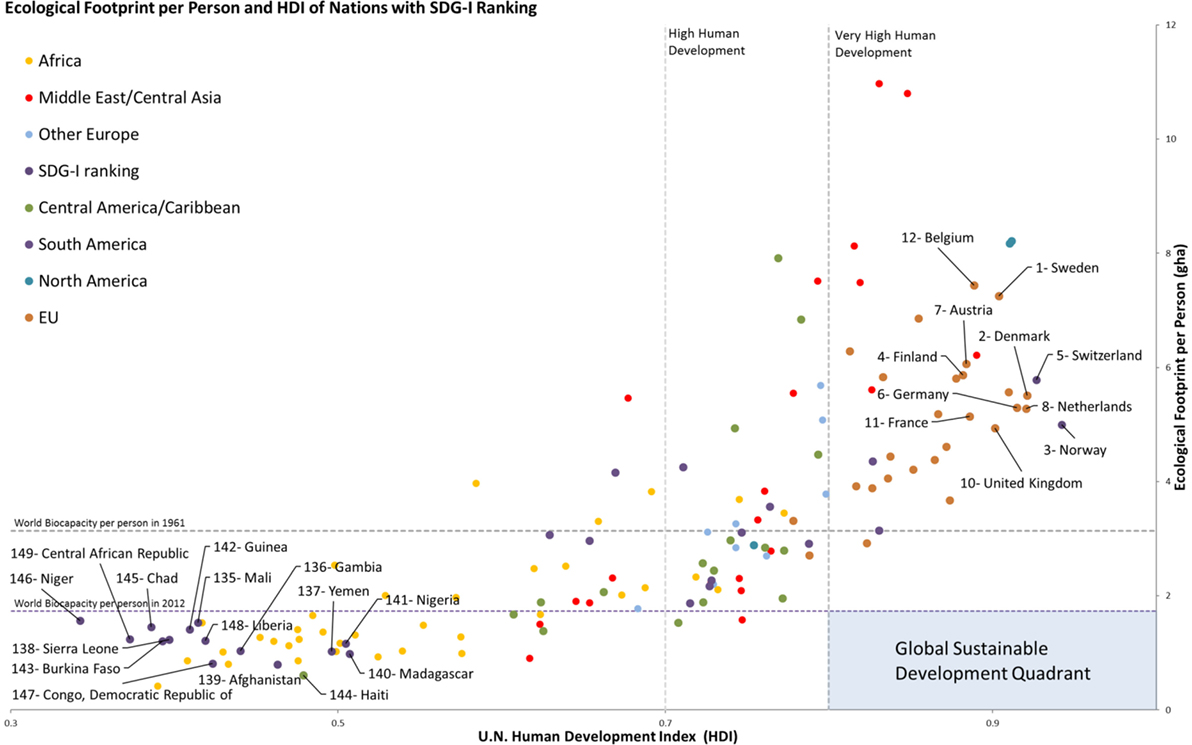
Figure 1. Ecological Footprint per person and HDI by country indicate how close each country is to basic global sustainable development criteria (high human development, within resource requirements that are globally replicable). Each number indicates the country’s ranking on the sustainable development goal (SDG) index (only top and bottom 10 are marked here).
The diagram in Figure 1 reveals that the top 10 countries of the SDG index are far distant from the global sustainable development quadrant in the bottom right; the bottom 10 countries have a low Footprint and low HDI. To put it in statistical terms, if SDG achievement was uncorrelated with each country’s level of resource demand, the likelihood of 19 out of the top 20 ranking countries in the SDG index having a Footprint of over 5 gha per person would be less than 1/5,000th of a billionth. (The under-5-gha-Footprint exception among the top 20 countries is the UK with a Footprint of 4.9 gha per person. Also note that the UK, according to the 2017 National Footprint Accounts edition, had a Footprint of 5.1 gha per person in 2013.) The probability of 19 out of 20 being high Footprint countries can be assessed with the following calculation: Given that 36 countries out of the 149 have a Footprint of 5 gha per person or larger, the likelihood of picking 19 out of 20 times a high Footprint country, if picked randomly, would be approximately 36!/16! × 129!/149! × 21 = 1/5,000th of a billionth. This is based on the assumption that the probability for the correct first pick is 36/149, for the second 35/148, for the third 34/147, etc. Also, since one pick can be wrong among the 20 draws, this increases the probability nearly 21 fold.
In other words, the link between high Footprints and high SDG index ranks is unlikely a coincidence. Also note that the Ecological Footprint of the index’s top 20 ranking countries is so large that if all other countries consumed at the same rate, it would take the ecological capacity of over three planet Earths to materially support all of humanity. This level of demand on the planet is clearly not sustainable.
Given the world’s current focus on carbon, one could make the same analysis based on carbon only. It would be less comprehensive because human economies demand far more from the planet than just carbon sequestration. However, the weakness of the SDGs to adequately address the resource dimension would reveal itself even starker as higher Footprint economies have also higher carbon portions of their Footprint (United Nations, 2015). In other words, the analysis of carbon only would show an even stronger negative correlation between high performance on SDG index and low-carbon economies.
Conclusion: SDGs Must Strengthen Their Sustainability Side
This SDG index, in spite of its potential limitations, makes it possible to reveal a paradox humanity still needs to overcome: as shown in Figure 1, the SDG index rankings mimics the conventional development pattern that links higher development achievements with higher Footprints, rather than approaching the global sustainable development quadrant. This conventional development pattern is exactly what sustainable development endeavors to rectify.
The SDG index may still not be a fully mature representation of the UN’s SDGs. The authors of the index acknowledge in their own report some of the index’s limitations. But even a more complete SDG index will unlikely change the conclusions: the weight the SDGs give to development consideration, and the weak representation of the resource security aspect among the goals and targets will not significantly shift the results even of a more complete and carefully constructed SDG index. This near exclusion of resource security aspects (AtKisson Group, 2016) makes the current SDGs fall short of actively advancing human wellbeing without further depleting the very natural capital on which development depends. In 2013, Dave Griggs from Monash University forewarned about the potential of the then emerging SDGs not to address adequately the need of “safeguarding Earth’s life-support system, on which the welfare of current and future generations depends” (Griggs, 2013).
The SDGs would be far more effective, if they were structured along the ultimate ends to ultimate means pyramid, recognizing the dependence of social outcomes on resource conditions (Pinter et al., 2014). As a growing population and climate change increase pressure on natural resources, decreasing overall resource demand is crucial for being able to continue to fuel development achievements. Furthermore, higher demands of some countries reduce opportunities of others to access the necessary resources, exacerbating equity challenges.
Ignoring physical constraints imposed by planetary limits is anti-poor because with fewer resources to go around, the lowest-income people will lack the financial means to shield themselves from resource constraints, whether it is food-price shocks, weather calamities, or energy and water shortages. All the legitimate and important development gains the SDGs seek to achieve will fall tragically short without the natural capital to power the economy of each nation, region, city, or village. If we want to have a future, SDGs need to robustly embrace the reality of resource constraints and climate change. Also, we need robust accounting tools that track the outcomes. Without such rigorous metrics, there is great risk to misallocate development investments.
Author Contributions
MW drafted the first version. LH co-conceived the way how to compare the SDG index ranking with the HDI-Footprint approach. All three authors completed the manuscript. DL led the update and improvements of the National Footprint Accounts (2016 edition and 2017 edition).
Conflict of Interest Statement
The authors declare that the research was conducted in the absence of any commercial or financial relationships that could be construed as a potential conflict of interest.
The reviewer, FS, and handling editor declared their shared affiliation, and the handling editor states that the process nevertheless met the standards of a fair and objective review.
Funding
This work, including the maintenance of the National Footprint Accounts, was supported by the Barr Foundation and the MAVA Foundation. The researchers of this study have no competing financial interests.
Footnotes
References
AtKisson Group. (2016). The SDG Indicators: What Are We Measuring? Available at: https://t.co/Ii59erwKf2
Borucke, M., Moore, D., Cranston, G., Gracey, K., Iha, K., Larson, J., et al. (2013). Accounting for demand and supply of the biosphere’s regenerative capacity: the National Footprint Accounts’ underlying methodology and framework. Ecol. Indic. 24, 518–533. doi: 10.1016/j.ecolind.2012.08.005
Global Footprint Network. (2017). National Footprint Accounts – Edition 2017. Available at: http://data.footprintnetwork.org. Provides the newest updates and covers the results for countries with sufficient data quality.
Griggs, D. (2013). Sustainable development goals for people and planet. Nature 495, 305–307. doi:10.1038/495305a
Huntingford, C., and Mercado, L. M. (2016). High chance that current atmospheric greenhouse concentrations commit to warmings greater than 1.5°C over land. Sci. Rep. 2016, 30294. doi:10.1038/srep30294
IPCC. (2014). in Climate Change 2014: Synthesis Report. Contribution of Working Groups I, II and III to the Fifth Assessment Report of the Intergovernmental Panel on Climate Change, eds Core Writing Team, R. K. Pachauri, and L. A. Meyer (Geneva, Switzerland: IPCC), 151.
Millennium Ecosystem Assessment. (2005). Ecosystems and Human Well-Being: Synthesis. Washington, DC: Island Press.
Pinter, L., Almassy, D., Antonio, E., Hatakeyama, S., Niestroy, I., Olsen, S., et al. (2014). Sustainable Development Goals and Indicators for a Small Planet—Part I: Methodology and Goal Framework. Singapore: Asia-Europe Foundation (ASEF).
Rockström, J., Gaffney, O., Rogelj, J., Meinshausen, M., Nakicenovic, N., and Schellnhuber, H. J. (2017). A roadmap for rapid decarbonization. Science 355, 1269–1271. doi:10.1126/science.aah3443
Sachs, J., Schmidt-Traub, G., Kroll, C., Durand-Delacre, D., and Teksoz, K. (2016). SDG Index and Dashboards – Global Report. New York: Bertelsmann Stiftung and Sustainable Development Solutions Network (SDSN). Available at: http://www.sdgindex.org/
UNFCCC. (2015). Paris Climate Agreement. Available at: http://unfccc.int/files/essential_background/convention/application/pdf/english_paris_agreement.pdf
United Nations. (2015). UN Sustainable Development Goals. Available at: https://sustainabledevelopment.un.org/sdgs
Wackernagel, M., Cranston, G., Morales, J. C., and Galli, A. (2014). “Chapter 24: Ecological footprint accounts: from research question to application,” in Handbook of Sustainable Development: Second Revised Edition, eds G. Atkinson, S. Dietz, E. Neumayer, and M. Agarwala (Cheltenham: Edward Elgar Publishing), 371–396.
Wackernagel, M., Schulz, N. B., Deumling, D., Linares, A. C., Jenkins, M., Kapos, V., et al. (2002). Tracking the ecological overshoot of the human economy. Proc. Natl. Acad. Sci. U.S.A. 99, 9266–9271. doi:10.1073/pnas.142033699
World Bank. (2017). Atlas of Sustainable Development Goals 2017: From World Development Indicators. Washington, DC: World Bank Atlas, World Bank. Available at: https://openknowledge.worldbank.org/handle/10986/26306. License: CC BY 3.0 IGO.
World Commission on Environment and Development. (1987). Our Common Future. Oxford: Oxford University Press. (Frequently referred to as the Brundtland report after Gro Harlem Brundtland, Chairman of the Commission).
WWF (World Wide Fund for Nature), IUCN (International Union for Conservation of Nature), and UNEP (United Nations Environment Programme). (1991). Caring for Earth. Gland: WWF (World Wide Fund for Nature), IUCN (International Union for Conservation of Nature), and UNEP (United Nations Environment Programme).
Keywords: sustainable development goals, SDG index, Ecological Footprint, biocapacity, sustainability, resource accounting, resource security, poverty eradication
Citation: Wackernagel M, Hanscom L and Lin D (2017) Making the Sustainable Development Goals Consistent with Sustainability. Front. Energy Res. 5:18. doi: 10.3389/fenrg.2017.00018
Received: 26 April 2017; Accepted: 21 June 2017;
Published: 11 July 2017
Edited by:
Federico Maria Pulselli, University of Siena, ItalyReviewed by:
Fabrizio Saladini, University of Siena, ItalySiamak Sam Loni, Monash Sustainable Development Institute (MSDI), Australia
Copyright: © 2017 Wackernagel, Hanscom and Lin. This is an open-access article distributed under the terms of the Creative Commons Attribution License (CC BY). The use, distribution or reproduction in other forums is permitted, provided the original author(s) or licensor are credited and that the original publication in this journal is cited, in accordance with accepted academic practice. No use, distribution or reproduction is permitted which does not comply with these terms.
*Correspondence: Mathis Wackernagel, mathis.wackernagel@footprintnetwork.org
One Sentence Summary: Bertelsmann and SDSN’s SDG index reveals that the sustainable development goals are largely development goals, vastly underperforming on sustainability.