Estimating the Energy Content of Wastewater Using Combustion Calorimetry and Different Drying Processes
 Benjamin Korth
 Thomas Maskow
 Susanne Günther
 Falk Harnisch
- Department of Environmental Microbiology, Helmholtz-Centre for Environmental Research, Leipzig, Germany
The energy content of wastewater is routinely assessed by chemical oxygen demand (COD) measurements that only provide an incomplete picture and the data fundament of other energy parameters remains scarce. The volumetric heat of combustion (ΔCH) of raw wastewater from a municipal wastewater treatment plant (WWTP) was assessed using oven drying method (ΔCHvol = −6.8 ± 4.3 kJ L−1, n = 20) and freeze drying method (ΔCHvol = −20.2 ± 9.7 kJ L−1, n = 6) illustrating the substantial loss during the oven drying approach. Normalizing ΔCH to COD of raw wastewater yielded −6.2 ± 3.5 kJ gCOD−1 for oven-dried samples (n = 14) and −13.0 ± 1.6 kJ gCOD−1 for freeze-dried samples (n = 3). A subsequent correlation analysis with further chemical wastewater parameters revealed a dependency of ΔCHvol on COD, total organic carbon (TOC), C:N ratio, and total sulfur content. To verify these correlations, wastewater of a second WWTP was sampled and analyzed. Only COD and TOC were in accordance with the data set from the first WWTP representing potential predictors for the chemical energy stored in wastewater for comparable WWTPs. Unfortunately, during the most practical method (oven drying), a certain loss of volatile compounds is inevitable so that the derived ΔCHvol systematically underestimates the total energetic potential of wastewater. Nevertheless, this work expands the, so far, little data fundament on the energy resource wastewater and implies the requirement for further long-term studies on different sites and different wastewater types with a highly standardized sample treatment protocol.
Introduction
The generation of wastewater and its management is inherent to modern societies. Although wastewater treatment has underwent remarkable progress since Ardern and Lockett invented the two-stage activated sludge process in 1914, material and energetic exploitation as well as extraction of drinking water from wastewater is among the grand challenges of the twenty-first century [Ardern and Lockett, 1914; World Health Organization (WHO) and United Nations Children’s Fund (UNICEF), 2013]. For instance, still 663 million people do not have access to potable drinking water and also 40% of the industrial wastewater in Europe does not receive treatment before disposal [Förster, 2014; World Health Organization (WHO), 2017]. At the same time, wastewater management is energy and cost intensive. When taking USA as an example, the public water sector consumes electric energy of 30 billion kWh/year for treating raw municipal wastewater while its wastewater treatment plants (WWTPs) annually treat around 50 billion m3 with a typical organic load of approximately 0.3 g L−1 soluble chemical oxygen demand (COD) (Henze and Comeau, 2008; Pabi et al., 2013). These numbers clearly illustrate not only the energy-saving potential of wastewater management but also highlight the energy stored in wastewater, as its chemical energy is about six times higher than the electric energy needed for treatment (S1 in Supplementary Material). Assuming that this energy could be technically exploited, the current energy sink of wastewater treatment can be transformed into a resource with an energy balanced water resource recovery facility being a grand step ahead. Besides physical processes for wastewater valorization, e.g., by exploiting its thermal energy content (Meggers and Leibundgut, 2011) and nutrient recovery (e.g., nitrogen, phosphorus), technologies based on anaerobic and phototropic metabolisms are under examination (McCarty et al., 2011; Shoener et al., 2014).
In modern societies, state of the art wastewater treatment is a multistage process combining physical, chemical, and biological approaches with the different treatment steps being energy consuming and requiring chemicals. Typically, aeration of the activated sludge basins consumes half of the total electrical input (0.6 kWh m−3) (McCarty et al., 2011). For exploiting the energy of wastewater at least partly, around 1,500 of 16,000 WWTPs in the USA anaerobically digest the activated sludge for producing biogas and on-site electricity generation (Sinicropi, 2012). This technology bears an annual electricity potential of 5.6 billion kWh when using combined heat and power systems (co-generation) (McCarty et al., 2011). Further concepts are already discussed for optimizing the energy management of primary wastewater treatment, e.g., using moving bed biofilm reactors or applying full anaerobic treatment of wastewater (McCarty et al., 2011; Jenicek et al., 2012; Ødegaard, 2016). Furthermore, microorganisms converting wastewater in valuable products (e.g., fatty acids and polyhydroxyalkanoates) and microbial electrochemical technologies (METs) constitute examples of further opportunities for wastewater treatment and valorization (Yamasaki et al., 2006; Logan, 2009; Rabaey and Rozendal, 2010; Morgan-Sagastume et al., 2014). Independent from the specific process for exploiting the chemical energy of wastewater, comprehensive information on its energy content is necessary to evaluate the economic viability of such processes. The COD and biochemical oxygen demand (e.g., after 5 days, BOD5) are usually used for assessing the energy content of wastewater (McCarty et al., 2011). From a thermodynamic viewpoint, the Gibbs free energy (ΔG) of formation or of combustion solely provides full information about the maximum useful energy stored in a compound or a mixture of compounds. However, this cannot be estimated for complex mixtures like wastewater without knowledge of the elemental composition of the mixture and the resulting relative degree of reduction [for details, see Roels (1983)]. Thus, another parameter is required that can be applied to wastewater analysis and captures most of the energetic information. Like in the fossil fuel industry, the heat of combustion or combustion enthalpy (ΔCH) can be proposed. Heat of combustion is the total energy released as heat when a substance is completely oxidized to water, carbon dioxide, and other compounds (e.g., N2O5, SO3, and P2O5) under standard conditions (298.15 K, 101.325 kPa). For a practical characterization of wastewater, ΔCH should be linked to routinely assessed parameters like COD or total organic carbon (TOC). However, to the best of our knowledge, only two studies exist analyzing the combustion enthalpy of raw wastewater at the same time as COD (Shizas and Bagley, 2004; Heidrich et al., 2011)—see also Table 2. These studies did not find a correlation between both parameters, but overall only three measurement points of ΔCH were normalized to its volume (i.e., ΔCHvol). Therefore, broader data fundament for assessing the energy stored in wastewater is needed. Here, we present a more comprehensive dataset for assessing the energy content of raw wastewater from a municipal WWTP in Germany. Thereby, the hitherto limited data foundation for evaluating the feasibility of wastewater treatment technologies, allowing energy harvest, is expanded. The analysis is based on an oven drying procedure for the preparation of wastewater samples and the subsequent determination of ΔCH and related values. Therefore, it has to be noted that the energy content of wastewater is probably underestimated because a substantial share of the volatile fraction is lost during this procedure. Consequently, the present work can only provide a lower limit of the energetic potential of wastewater. Although lyophilization of wastewater samples would capture more volatile compounds, it does also lead to a certain loss of volatiles and hence provides another estimate but no “true” value. Despite its major drawback, oven drying is the most practicable approach for handling the sample numbers and sample quantities that are currently needed in a long-term study (See Implications).
A correlation analysis between routinely measured parameters (including ΔCH) was subsequently performed leading to apparent correlation between ΔCH and COD, TOC, C:N, and the amount of sulfur, respectively. Finally, the encountered correlations were evaluated with a data set from a second WWTP and literature data.
Materials and Methods
General Conditions
All chemicals were of analytical or biochemical grade (from Sigma-Aldrich Chemie GmbH and Merck KGaA, Germany) and used as received. Millipore water (Merck KGaA, Germany) was used throughout the study.
Sampling and Storage of Wastewater
The wastewater was sampled at different days of the week between 08:00 and 09:00 a.m. from the effluent of the primary clarifier from two WWTPs near Leipzig, Germany. These are referred to as WWTP-1 and WWTP-2 with details on source and composition provided in S2 in Supplementary Material. Approximately 5 L were sampled during the time period August 2013–July 2014 leading to a data set of 38 sample points. Within 2 h after sampling time, the process of drying homogenized wastewater was initiated, and the remaining wastewater was stored at 4°C. Remaining wastewater was also homogenized before it was added to the drying setup. Wastewater samples used for the analysis provided by Günther et al. (2016) (Table 1) were sampled at the same time. 50 mL of 20 samples (January 2014–July 2014) were stored at −20°C for further experiments (dry weight).
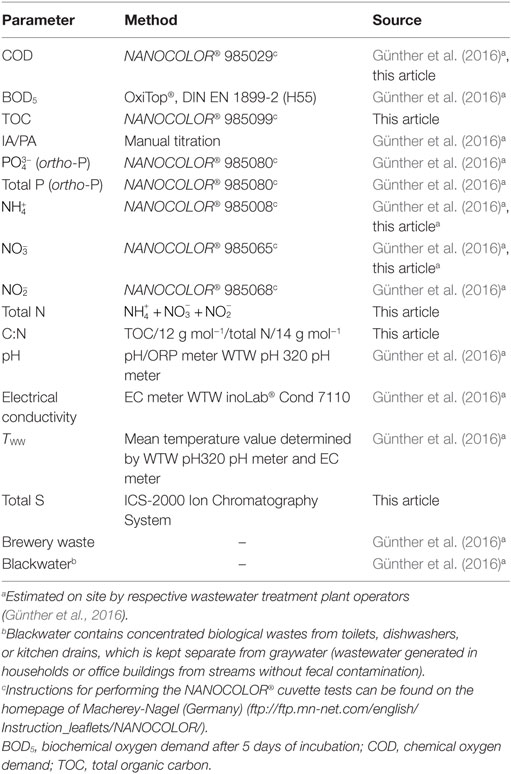
Table 1. Wastewater parameters used in the correlation analysis and the respective measurement methods.
Drying of Wastewater
The wastewater samples were dried in evaporating dishes (V = 500 mL, labsolute®, Th. Geyer GmbH & Co. KG, Germany) under stirring at around 70°C surface temperature. The temperature was controlled with an infrared thermometer (TFI-54, ebro Electronic GmbH, Germany). The evaporating dishes were regularly refilled with fresh wastewater until enough dry substance (DS) was obtained (approximately 2 L for 2 g DS). The DS was then further dried in an oven at 104°C until complete drought was achieved. After transferring the DS to Petri dishes (labsolute®, Th. Geyer GmbH & Co. KG, Germany), it was stored in a desiccator using silica gel as drying agent. For obtaining heat of combustion values of freeze-dried samples, approximately 1 L of wastewater was split to six 500 mL laboratory bottles (DURAN Group GmbH, Germany) and frozen at –20°C before lyophilization. Subsequently, the samples were dried in a lyophilizer (ALPHA 1-4 LSC, Martin Christ Gefriertrocknungsanlagen GmbH, Germany) for around 3 days at −20°C and 0.1 mbar. The obtained DS was stored in airtight laboratory bottles at −20°C.
Sample Preparation and Combustion Calorimetry
For each measurement, approximately 0.5 g of DS of the wastewater samples were pestled in a mortar and mixed 1:1 with benzoic acid (≤99.5%) to ensure complete combustion. The mixture was pressed to pills using a compactor (PHYWE Systeme GmbH & Co. KG, Germany) and stored until measurement in a desiccator. All measurements were performed in triplicates. The energy content was determined using an isothermal jacket combustion calorimeter (AC-350, LECO Corporation, USA). Measuring the heat of combustion and the following corrections were performed according to DIN 51900-1 (Deutsches Institut für Normung e.V., 2000). The combustion calorimeter was calibrated (including determination of the heat capacity of the calorimetric bomb) with pure benzoic acid (ΔCH = −26.4 kJ g−1) (Vanysek, 2001). According to thermodynamic conventions a minus sign indicates the release of heat and a plus sign the consumption of heat. DS pills and calibration pills were combusted in a calorimetric bomb with 2.89 MPa oxygen partial pressure (oxygen purity 5.1, Linde AG, Germany). For compensating unspecific heat transfer between the measurement system and its surroundings, the Regnault/Pfaundler mode was applied meaning that for 5 min the temperatures before and after combustion (8 min) were recorded and used for the correction of the heat transfer. The heat contribution of the ignition wire was considered for correcting the measured heat of combustion. The calorimetric measurement led to a value for uncompensated heat of combustion. Under the measuring conditions of a constant volume, the combustion energy corresponds to the internal energy change and not to the practically more relevant heat of combustion (or enthalpy of combustion). The difference is expansion work, which can be estimated assuming ideal gas and knowing the combustion stoichiometry. This is not the case for wastewater samples. However, the deviation is very small related to the total amount of energy. For instance, the deviation is 0 for glucose and acetate, 0.2% for n-hexane and 0.08% for phenol [the combustion enthalpies given by Kharasch (1929) were used for calculations]. For this reason, the raw values of the combustion calorimeter will be interpreted as uncompensated heat of combustion (ΔCHuncomp). In addition, liquid residues inside the bomb were collected in a defined volume of water (5–10 mL). The nitrate and sulfate concentrations of this solution were measured via ion chromatography (see Ion Chromatography) and used for compensating for the formation of nitric acid and sulfuric acid during the combustion (see Calculating the Heat of Combustion).
Ion Chromatography
The collected residues of the calorimetric measurements were diluted 1:100 and 1 mL of this solution were used to determine the concentration of nitrate and sulfate using a Dionex® ICS-2000 Ion Chromatograph (Thermo Fisher Scientific, USA) with an IonPac AS18 column and an IonPac AG18 pre-column (both Thermo Fisher Scientific, USA). For elution potassium hydroxide was used starting at a concentration of 22 mmol L−1 for 7 min followed by 40 mmol L−1 for further 8 min. The obtained concentration ranges were 0.1–10 g L−1 for nitrate and 0.1–5 g L−1 for sulfate.
Calculating the Heat of Combustion
The measured ΔCHuncomp includes the heat from the formation of nitric acid and sulfuric acid from the respective oxides and water. These contributions had to be subtracted to obtain a real gravimetric heat of combustion value (ΔCHgrav) (Eq. 2):
The absolute amounts of formed nitrate and sulfate were derived from ion chromatography (see Ion Chromatography).
Wastewater Parameters
Table 1 summarizes the measured abiotic parameters, already partly included in Günther et al. (2016), as well as the methods used. The amounts of blackwater and brewery waste were provided by the operators of the sampled WWTPs. TOC was measured from samples stored at −20°C. The amount of sulfur was calculated from the sulfate concentration measured by the ion chromatography (see Ion Chromatography). The complete data set with all recorded wastewater parameters is listed in S3 in Supplementary Material.
Determining the Dry Weight of Solids in Wastewater
Empty and oven-dried test tubes were weighted and subsequently filled with 5 mL of defrosted sample previously stored at −20°C. The test tubes were dried in an incubator at 104°C for approximately 2–3 days and afterwards stored in a desiccator. After weighing the test tubes again, the dry weights (g L−1) of solids in wastewater was calculated. The dry weights of the freeze-dried samples were determined with the same equipment and conditions described in the Section “Drying of Wastewater,” but only 1 mL of wastewater was filled in 2 mL Eppendorf tubes®. The drying process took approximately 1 day. This analysis was performed in triplicates. The dry weights were used to transform the gravimetric heat of combustion (ΔCHgrav, kJ g−1) in a heat of combustion related to wastewater volume (ΔCHvol, kJ L−1, S3 in Supplementary Material).
Statistics
The statistical analysis for Figure 1 was performed with RStudio and the packages “gplots” and “Hmisc”. Correlations between wastewater parameters were tested according to Pearson, Spearman, and Kendall (Kendall and Gibbons, 1990). Afterwards, the p-value was corrected via the Benjamini–Hochberg algorithm. If two correlation tests were significant (p < 0.05), the respective correlation was included in the heat map, and means of the respective correlation coefficients were calculated. The linear regression for Figure 2 was performed with OriginPro2015G b9.2.22 (OriginLab Corporation, USA).
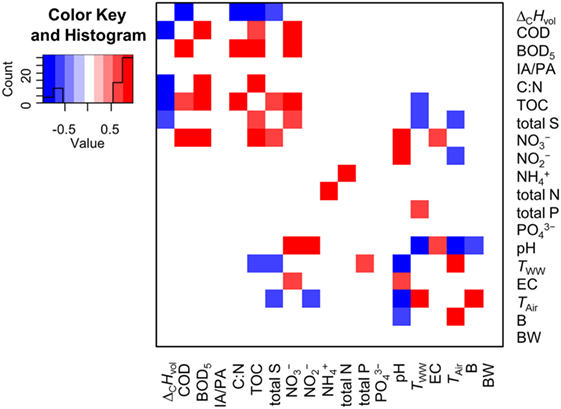
Figure 1. Heat map of a correlation analysis with all determined wastewater parameters. Red, positive correlation coefficient; blue, negative correlation coefficient (−1 ≤ x ≤ + 1); white, no correlation. All possible correlations were tested according to Pearson, Spearman, and Kendall. Afterwards the p-value was corrected via the Benjamini–Hochberg algorithm. If two correlation tests were significant (p < 0.05), the respective correlation was included to the heat map. The depicted correlation coefficients are the calculated means. ΔCHvol, heat of combustion (kJ L−1); COD, chemical oxygen demand (g L−1); BOD5, biochemical oxygen demand after 5 days of incubation (mg L−1); IA/PA, ratio of the intermediate alkalinity over the partial alkalinity; C:N, ratio of organic carbon and inorganic nitrogen; TOC, total organic carbon (mg L−1); total S, total sulfur content (mg L−1); , nitrate (mg L−1); , nitrite (mg L−1); , ammonia (mg L−1); total N, total inorganic nitrogen (mg L−1); total P, total phosphorus (mg L−1); , phosphate (mg L−1); TWW, wastewater temperature (K); EC, electrical conductivity (mS cm−1); TAir, air temperature (K); B: volume flow of treated brewery waste (m3 day−1); BW, volume flow of treated blackwater (m3 day−1).
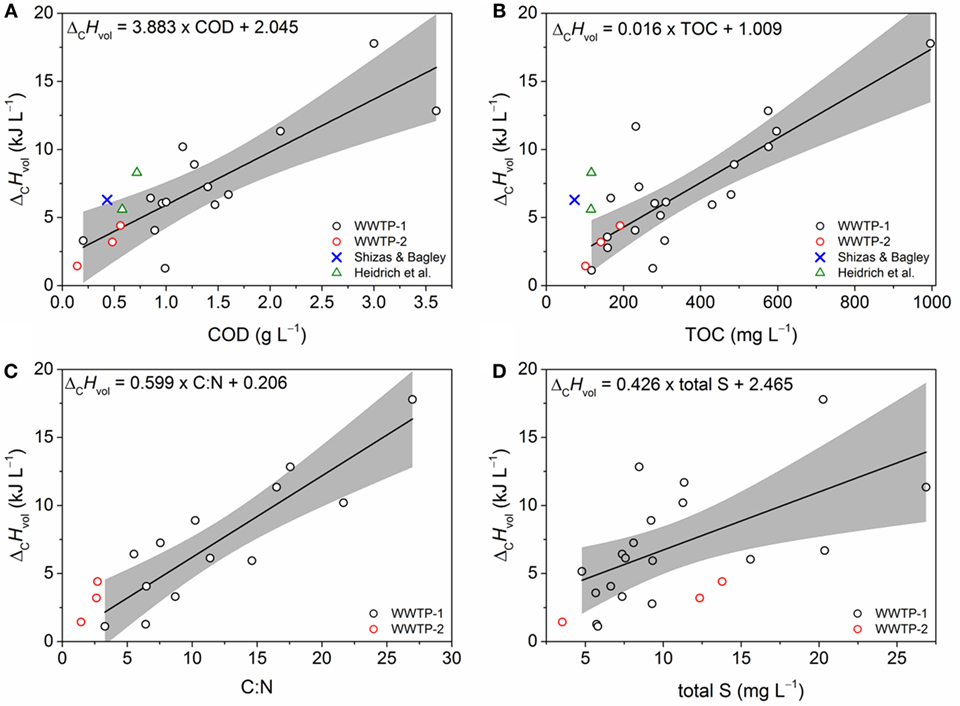
Figure 2. Correlation plots of ΔCHvol and wastewater parameters. The plots are based on data from wastewater treatment plant (WWTP)-1 (black circles) and with projected data points from WWTP-2 (red circles), Heidrich et al. (2011) (olive triangles), and Shizas and Bagley (2004) (blue crosses). (A) Chemical oxygen demand (COD) (n = 14, R2 = 0.65), (B) total organic carbon (TOC) (n = 19, R2 = 0.66), (C) C:N (n = 13, R2 = 0.75), and (D) total S (n = 18, R2 = 0.32), respectively. Correlations were calculated according to Pearson. The gray shaded areas represent the 95% confidence bands of each correlation for the data set of WWTP-1.
Results
Determining the Heat of Combustion of Wastewater
The DS of 38 wastewater samples from WWTP-1 was collected and analyzed on their heat of combustion for one year. The DS of all samples was gained by conventional oven drying (see Drying of Wastewater). Six samples were additionally freeze-dried to evaluate the material loss during the drying processes (see Drying of Wastewater). Combustion calorimetry resulted in an average gravimetric heat of combustion ΔCHgrav for oven-dried and freeze-dried samples (Table 2). The respective dry weights for oven-dried and freeze-dried samples were determined to normalize heat of combustion to wastewater volume (ΔCHvol, for samples from January to July 2014,). Furthermore, heat of combustion was related to COD of raw wastewater. Table 2 summarizes the obtained energetic parameters on raw wastewater and DS from this study and from previous studies. Shizas and Bagley and Heidrich et al. analyzed one and two WWTPs, respectively, by applying similar methods (Table 2). All energetic parameters determined in this study are in accordance with the respective values from previously conducted analyses (Table 2).
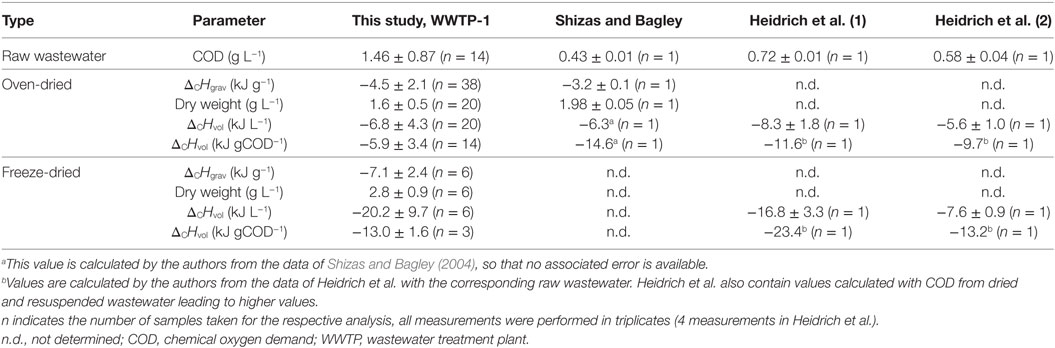
Table 2. Summarizing the heat of combustions and COD of wastewater derived from this and previous studies.
Correlation Analysis of the Determined Wastewater Parameters
Subsequently, a correlation analysis with ΔCHvol and all determined abiotic wastewater parameters of WWTP-1 (see Wastewater Parameters) for the time period January–July 2014 was performed. ΔCHvol correlates with COD, TOC, the ratio of TOC and inorganic nitrogen (C:N), and total sulfur content (total S, Figure 1). The correlation between ΔCHvol and COD and TOC, respectively, was not experimentally proven so far. But particularly the relation between ΔCHvol and TOC seems reasonable if it is considered that CxHyOz compounds represent the major fraction in wastewater and outnumber other energy-rich substances like organohalogens (usually appearing only in traces in municipal wastewater) (Heidler and Halden, 2009) or ammonia (Henze and Comeau, 2008). An analysis of the combustion enthalpy of several sulfur containing molecules revealed that the increase in ΔCHvol with increasing sulfur amounts is also reasonable (S4 in Supplementary Material). Several non-energetic parameters (e.g., pH and TWW) correlated as expected. For instance, the negative correlation between TWW and pH (Figure 1) can be assigned to higher microbial activity due to higher wastewater temperature. The increased degradation of organic compounds by microorganisms led to an increased release of protons and subsequently to a pH drop. The rise in microbial activity also decreased the concentration of dissolved CxHyOz compounds detectable by TOC measurements (Figure 1). As wastewater from breweries is usually acidic (Brito et al., 2007), the pH of the WWTP-1 expectably decreased with increased load originating from a local brewery (Figure 1).
Verifying the Encountered Correlations between ΔCHvol and Abiotic Wastewater Parameters
For verifying the encountered correlations between heat of combustion and COD, TOC, C:N ratio, and total S, three additional wastewater samples from a second WWTP (WWTP-2, June–July 2016) were analyzed and compared to the data from WWTP-1. To ensure comparability, sample treatment and measurement were identical. A regression analysis of the WWTP-1 data set for ΔCHvol revealed satisfactory coefficients of determination for COD, TOC, and C:N ratio (R2 > 0.65) (Figure 2). The correlation coefficient is considerably lower for total S (R2 = 0.32). Afterwards, data from WWTP-2, Shizas and Bagley, and Heidrich et al. were projected in the respective plots (Figure 2). The analysis shows that only the COD and TOC data from the WWTP-2 is in accordance to the prior data set as the measurement points are within the 95% confidence band of the regression analysis of COD and TOC (Figures 2A,B). In contrast, an analysis of total sulfur content revealed that the data points from the WWTP-2 do not correspond to the correlation as they systemically underestimate ΔCHvol (Figure 2D). Interpretation of the C:N ratio data is questionable as all data points from WWTP-2 are beyond the range of the data from WWTP-1 contributing to the 95% confidence interval (Figure 2C).
Figure 2 also shows projected data points for the COD and TOC correlation that were calculated from Heidrich et al. and Shizas and Bagley. Whereas the TOC data from both publications are located outside the 95% confidence interval (Figure 2B), the COD data from Heidrich et al. partly match the derived COD–ΔCHvol correlation (Figure 2A) slightly indicating a more general applicability. No data were available to plot the C:N ratio and total sulfur content from Heidrich et al. and Shizas and Bagley in the respective correlations.
Discussion
Assessing the Plausibility of the Derived Heat of Combustion Data Set
All determined energetic wastewater parameters (dry weight, ΔCHgrav, and ΔCHvol) considerably vary during the course of one year (S2 in Supplementary Material). This finding was expected as the wastewater inflow characteristics exhibit seasonal fluctuations (Martin and Vanrolleghem, 2014). The calculated volumetric heats of combustion of the oven-dried as well as the freeze-dried samples are in the same order of magnitude than previous estimations (Table 2). The differences between energetic values obtained for oven-dried and freeze-dried samples for all three wastewater parameters (dry weight, ΔCHgrav, and ΔCHvol) illustrate that the freeze drying process decreases the loss of volatiles (e.g., acetate, propionate, and n-butyrate) which represent a considerable share of wastewater compounds (Koch et al., 2014). Thus, freeze drying is the superior method as it was suggested by Heidrich et al. (2011). Nevertheless, independent from the drying procedures used in this study, a substantial amount of volatiles from wastewater is always lost. Thus, energy-rich compounds are always removed from drying wastewater before the heat of combustion measurement leading to a systematic underestimation of the energy content of wastewater. Obviously, the underestimation is in the case of oven-dried samples more distinct compared to freeze-dried samples.
This is further illustrated by comparing ΔCHvol normalized to COD content of wastewater from previous studies and this study. The volumetric heat of combustions normalized to COD content of oven-dried and freeze-dried samples are considerable lower compared to corresponding values from Heidrich et al. and Shizas and Bagley (Table 2). Presumably, this is due to the high COD content of the analyzed wastewater in the present study (Table 2) and illustrates the loss of volatile substances when COD-rich wastewater is dried. Remarkably, ΔCHvol (in kJ gCOD−1) derived from the freeze drying method is also clearly lower than comparable values from the previous studies although the COD content of the wastewater is twice as high (Table 2). This emphasizes that even during the freeze drying process a loss of volatile substances is apparent. The results also indicate that some types of wastewater (particularly COD-rich wastewaters) would need a more specialized sample preparation procedure than the applied freeze drying method (−20°C, 0.1 mbar) to minimize the loss of volatile substances.
Nevertheless, considering the little data fundament so far, the practicability, and measurement capacity, it was concluded to use oven drying for sample preparation although the authors are aware that results from oven drying are more biased than from freeze drying.
Which Indicator Provides the Most Realistic Estimation of the Energy Stored in Wastewater?
As combustion calorimetry is a rather elaborate and time-consuming method, an indicator for predicting the energy content of wastewater is needed that can be measured fast and easy. Although previous studies found no standard relationship between COD and ΔCHvol, the current analysis shows that COD can be exploited to estimate ΔCHvol (Figure 2A). In addition, TOC seems also suitable for serving as reliable measure for ΔCHvol (Figure 2B). The COD and TOC values from WWTP-2 are located at the lower limit of the respective correlation plots generated with data from WWTP-1 (Figures 2A,B). Presumably, this is due to the comparable huge inflow of industrial wastewater (beverage and brewery) in WWTP-1 that is not the case in WWTP-2 resulting in a substantially higher COD (S2 in Supplementary Material) and probably higher TOC values. Both parameters are well established in wastewater analysis and have similar advantages and disadvantages. Therefore, the question arises if either parameter is better for describing biologically degradable energy carriers or if both parameters are equally suitable for evaluating the energy stored in wastewater. TOC does not capture the energy stored in non-CxHyOz molecules, bound non-carbon elements, and inorganics that are oxidized by COD measurements. Probably, ammonia is here the most important contributor, as it is steadily released by the hydrolysis of urea in municipal wastewater. The degree of reduction of wastewater compounds is also excluded by TOC tests—a parameter linked to the bacterial energy harvest and growth yields (Heijnen and Kleerebezem, 2010). Roels described a positive relationship between degree of reduction and heat of combustion for various organic compounds (Roels, 1987). The degree of reduction (i.e., ratio between COD and TOC) of the wastewater samples remained in a fairly constant range (S3 in Supplementary Material) for the tested time period and did not show this established correlation with ΔCHvol normalized to moles of consumed oxygen for oven-dried samples (S5 in Supplementary Material). However, the lack of a positive relationship between degree of reduction and ΔCHvol is probably due to the complex composition of wastewater and/or the loss of volatile organic substances during the drying process (see also Determining the Heat of Combustion of Wastewater). Although COD and TOC possess certain drawbacks and pitfalls, both parameters seem robust enough to represent predictors for ΔCHvol as the samples from WWTP-2 are located within the respective confidence intervals based on WWTP-1 data (Figures 2A,B).
Implications
An improved data basis on the energy content of wastewater is provided by using combustion calorimetry with oven-dried and freeze-dried samples. It was shown for oven-dried samples that ΔCHvol exhibit robust correlations with COD (ΔCHvol = −3.883 × COD − 2.045) and TOC (ΔCHvol = −0.016 × COD − 1.009) that were not proven before. Noteworthy, the correlations were established for one WWTP (with high industrial inflow and thus high COD) and could be successfully transferred to a second (low inflow COD). Nevertheless, for now it can only be assumed that the correlations can be further transferred to WWTPs with similar characteristics (e.g., WWTP size and inflow characteristics). To provide a more comprehensive picture and especially to analyze if there are correlations that can be generalized, we recommend the following: wide spanning, long-term studies including WWTPs of different sizes, with differing types and ratios of municipal and industrial wastewater and being located in different climate conditions need to be performed. It is recommended to use highly standardized protocols, especially in terms of sample storage and sample preparation, and to perform ring-tests to assure data comparability. For minimizing the loss of volatiles during the drying process and deriving a more realistic picture of the energetic value of wastewater, it is advisable to exclude oven drying approaches and to only harness freeze drying protocols. For this purpose, new combustion calorimeters needing only small amounts of sample are required. Furthermore, the sampling time should also be coordinated as diurnal variations affect the organic load of wastewater and subsequently also the calorimetric measurements (Martin and Vanrolleghem, 2014). High attention should be paid on the experimental setup to assure similar drying conditions (i.e., temperature and drying time) with the respective drying process. Preferentially, wastewaters with comparable high COD content may require specialized treatment processes to minimize loss of volatiles. These studies may also allow answering the question, if there exists, in a given framework, a correlation between gravimetric and volumetric energy density. Moreover, future analyses should take into account the method of energetic or material exploitation by microorganisms (e.g., via METs, anaerobic digestion, microbial synthesis or microbial conversion) for evaluating the share of compounds that can be utilized by the respective process.
Author Contributions
BK established experimental methods, analyzed the data, prepared figures, and edited the manuscript. SG provided guidance on data analysis, prepared figures, and edited the manuscript. FH and TM conceived the study, provided guidance on the experimental design as well as data analysis, and edited the manuscript.
Conflict of Interest Statement
The authors declare that the research was conducted in the absence of any commercial or financial relationships that could be construed as a potential conflict of interest.
Acknowledgments
The authors acknowledge Dr. L. F. M. Rosa for discussion, M. Wunderlich and Dr. S. Mothes for performing ion chromatography, C. Süring for WWTP sampling, K. Lange for performing combustion calorimetry and the operators of both wastewater treatment plants for providing wastewater samples and the respective data sets.
Funding
The authors acknowledge financial support of this work by the BMBF (Research Award “Next generation biotechnological processes—Biotechnology 2020+”) and the Helmholtz-Association (Young Investigators Group). This work was supported by the Helmholtz-Association within the Research Program Renewable Energies.
Supplementary Material
The Supplementary Material for this article can be found online at https://www.frontiersin.org/article/10.3389/fenrg.2017.00023/full#supplementary-material.
References
Ardern, E., and Lockett, W. T. (1914). Experiments on the oxidation of sewage without the aid of filters. J. Chem. Soc. 33, 523–539.
Brito, A. G., Peixoto, J., Oliveira, J. M., Oliveira, J. A., Costa, C., Nogueira, R., et al. (2007). “Brewery and winery wastewater treatment: some focal points of design and operation,” in Utilization of By-Products and Treatment of Waste in the Food Industry, 1st Edn, eds V. Oreopoulou, and W. Russ (New York: Springer US), 109–131.
Deutsches Institut für Normung e.V. (2000). Bestimmung des Brennwertes mit dem Bombenkalorimeter und Berechnung des Heizwertes. Berlin.
Förster, J. (2014). Statistics in Focus: Environment and Energy. Water Use in Industry – Cooling for Electricity Production Dominates Water Industry. Luxembourg City: Eurostat.
Günther, S., Faust, K., Schumann, J., Harms, H., Raes, J., and Müller, S. (2016). Species-sorting and mass-transfer paradigms control managed natural metacommunities. Environ. Microbiol. 18, 4862–4877. doi: 10.1111/1462-2920.13402
Heidler, J., and Halden, R. U. (2009). Fate of organohalogens in US wastewater treatment plants and estimated chemical releases to soils nationwide from biosolids recycling. J. Environ. Monit. 11, 2207–2215. doi:10.1039/b914324f
Heidrich, E. S., Curtis, T. P., and Dolfing, J. (2011). Determination of the internal chemical energy of wastewater. Environ. Sci. Technol. 45, 827–832. doi:10.1021/es103058w
Heijnen, J. J., and Kleerebezem, R. (2010). “Bioenergetics of microbial growth,” in Encyclopedia of Industrial Biotechnology: Bioprocess, Bioseparation, and Cell Technology, ed. M. C. Flickinger (Hoboken: John Wiley & Sons, Inc.), 1–24.
Henze, M., and Comeau, Y. (2008). “Wastewater characterization,” in Biological Wastewater Treatment: Principles Modelling and Design, 1st Edn, eds M. Henze, M. C. M. Van Loosdrecht, G. A. Ekama, and D. Brdjanovic (London: IWA Publishing), 33–52.
Jenicek, P., Bartacek, J., Kutil, J., Zabranska, J., and Dohanyos, M. (2012). Potentials and limits of anaerobic digestion of sewage sludge: energy self-sufficient municipal wastewater treatment plant? Water Sci. Technol. 66, 1277–1281. doi:10.2166/wst.2012.317
Kharasch, M. S. (1929). Heats of Combustion of Organic Compounds. Gaithersburg: National Bureau of Standards, 359–430.
Koch, C., Popiel, D., and Harnisch, F. (2014). Functional redundancy of microbial anodes fed by domestic wastewater. ChemElectroChem 1, 1923–1931. doi:10.1002/celc.201402216
Logan, B. E. (2009). Exoelectrogenic bacteria that power microbial fuel cells. Nat. Rev. Microbiol. 7, 375–381. doi:10.1038/nrmicro2113
Martin, C., and Vanrolleghem, P. A. (2014). Analysing, completing, and generating influent data for WWTP modelling: a critical review. Environ. Model. Softw. 60, 188–201. doi:10.1016/j.envsoft.2014.05.008
McCarty, P. L., Bae, J., and Kim, J. (2011). Domestic wastewater treatment as a net energy producer – can this be achieved? Environ. Sci. Technol. 45, 7100–7106. doi:10.1021/es2014264
Meggers, F., and Leibundgut, H. (2011). The potential of wastewater heat and exergy: decentralized high-temperature recovery with a heat pump. Energy Build. 43, 879–886. doi:10.1016/j.enbuild.2010.12.008
Morgan-Sagastume, F., Valentino, F., Hjort, M., Cirne, D., Karabegovic, L., Gerardin, F., et al. (2014). Polyhydroxyalkanoate (PHA) production from sludge and municipal wastewater treatment. Water Sci. Technol. 69, 177–184. doi:10.2166/wst.2013.643
Ødegaard, H. (2016). A road-map for energy-neutral wastewater treatment plants of the future based on compact technologies (including MBBR). Front. Env. Sci. Eng. 10(4):2. doi:10.1007/s11783-016-0835-0
Pabi, S., Amarnath, A., Goldstein, R., and Reekie, L. (2013). Electricity Use and Management in the Municipal Water Supply and Wastewater Industries. Denver: Water Research Foundation, Electric Power Research Institute.
Rabaey, K., and Rozendal, R. A. (2010). Microbial electrosynthesis – revisiting the electrical route for microbial production. Nat. Rev. Microbiol. 8, 706–716. doi:10.1038/nrmicro2422
Roels, J. A. (1987). “Thermodynamics of growth,” in Basic Biotechnology, eds J. Bu’lock, and B. Kristiansen (London: Academic Press), 57–74.
Shizas, I., and Bagley, D. (2004). Experimental determination of energy content of unknown organics in municipal wastewater streams. J. Energy Eng. 130, 45–53. doi:10.1061/(ASCE)0733-9402(2004)130:2(45)
Shoener, B. D., Bradley, I. M., Cusick, R. D., and Guest, J. S. (2014). Energy positive domestic wastewater treatment: the roles of anaerobic and phototrophic technologies. Environ. Sci. Process Impacts 16, 1204–1222. doi:10.1039/c3em00711a
Sinicropi, P. (2012). Wastewater Treatment Facilities Energy Potential in Wastewater. Washington: National Association of Clean Water Agencies.
World Health Organization (WHO). (2017). Safely Managed Drinking Water – Thematic Report on Drinking Water 2017. Geneva: WHO Press.
World Health Organization (WHO) and United Nations Children’s Fund (UNICEF). (2013). Progress on Sanitation and Drinking-Water – 2013 Update. Geneva: WHO Press.
Keywords: chemical oxygen demand, combustion calorimetry, heat of combustion, energy resources, wastewater analysis, wastewater treatment
Citation: Korth B, Maskow T, Günther S and Harnisch F (2017) Estimating the Energy Content of Wastewater Using Combustion Calorimetry and Different Drying Processes. Front. Energy Res. 5:23. doi: 10.3389/fenrg.2017.00023
Received: 03 July 2017; Accepted: 28 August 2017;
Published: 19 September 2017
Edited by:
S. Venkata Mohan, CSIR-Indian Institute of Chemical Technology, IndiaReviewed by:
Shunni Zhu, Guangzhou Institute of Energy Conversion (CAS), ChinaMohanakrishna Gunda, Flemish Institute for Technological Research, VITO, Belgium
Copyright: © 2017 Korth, Maskow, Günther and Harnisch. This is an open-access article distributed under the terms of the Creative Commons Attribution License (CC BY). The use, distribution or reproduction in other forums is permitted, provided the original author(s) or licensor are credited and that the original publication in this journal is cited, in accordance with accepted academic practice. No use, distribution or reproduction is permitted which does not comply with these terms.
*Correspondence: Falk Harnisch, falk.harnisch@ufz.de