On the Assessment of the CO2 Mitigation Potential of Woody Biomass
- 1Industrial Process and Energy Systems Engineering, École Polytechnique Fédérale de Lausanne, Lausanne, Switzerland
- 2Energy Center, École Polytechnique Fédérale de Lausanne, Lausanne, Switzerland
Woody biomass, a renewable energy resource, accumulates solar energy in form of carbon hydrates produced from atmospheric CO2 and H2O. It is, therefore, a means of CO2 mitigation for society as long as the biogenic carbon released to the atmosphere when delivering its energy content by oxidation can be accumulated again during growth of new woody biomass. Even when considering the complete life cycle, usually, only a small amount of fossil CO2 is emitted. However, woody biomass availability is limited by land requirement and, therefore, it is important to maximize its CO2 mitigation potential in the energy system. In this study, we consider woody biomass not only as a source of renewable energy but also as a source of carbon for seasonal storage of solar electricity. A first analysis is carried out based on the mitigation effect of woody biomass usage pathways, which is the avoided fossil CO2 emissions obtained by using one unit of woody biomass to provide energy services, as alternative to fossil fuels. Results show that woody biomass usage pathways can achieve up to 9.55 times the mitigation effect obtained through combustion of woody biomass, which is taken as a reference. Applying energy system modeling and multi-objective optimization techniques, the role of woody biomass technological choices in the energy transition is then analyzed at a country scale. The analysis is applied to Switzerland, demonstrating that the use of woody biomass in gasification–methanation systems, coupled with electrolysers and combined with an intensive deployment of PV panels and efficient technologies, could reduce the natural gas imports to zero. Electrolysers are used to boost synthetic natural gas production by hydrogen injection into the methanation reaction. The hydrogen used is produced when there is excess of solar electricity. The efficient technologies, such as heat pumps and battery electric vehicles, allow increasing the overall efficiency of the energy system while generating demand for the solar electricity.
1. Introduction
Biomass is the oldest energy resource used by mankind. It has been used since the discovery of fire and is still today the most exploited renewable resource in the world. Its use amounts to 50 EJ/year,1 a small fraction of its estimated global sustainable potential (about 350 EJ/year) (WWF International, 2011). However, most of its usage is in inefficient boilers or fireplaces to produce heat, which does not capture the full exergetic potential of biomass resources. In particular, biomass has the unique capability amongst renewable energy sources to be able to produce a variety of energy services (heat, electricity, transport fuel). By substituting the use of fossil fuels, biomass is increasingly considered as a key renewable resource to mitigate CO2 emissions in transport, industry, and households.
Thanks to the biogenic origin of its carbon content using biomass as energy source is carbon neutral, as long as the resource is managed in a sustainable way. Being a limited resource, a rational and efficient use of biomass is necessary for maximizing its fossil CO2 mitigation potential. However, determining the best use of biomass is a complex question. It is complex because there is a large variety of biomass types (from woody biomass to sludges from waste water treatment plants, through agricultural waste, etc.) which can all be transformed into a range of final products (heating oil, transport fuel, electricity), through a multitude of conversion pathways. In addition, the answer to the question will depend on the specific context, as different regions have different energy consumption profiles and different biomass resource available.
The question is even more intricate because several approaches may be used to assess the performance of bioenergy pathways, which may yield different answers.
Life Cycle Assessment (LCA) is widely used in literature to asses fossil CO2 abatement potential of bioenergy when substituting fossil fuels (McKechnie et al., 2011; Steubing et al., 2012; Gerber et al., 2013; Menten et al., 2013, 2015; Martin et al., 2015). There are two approaches to calculate the potential of biomass to abate fossil CO2 through LCA: attributional and consequential.
The attributional approach considers the fossil products that biomass can substitute. For example 1 MJ of biodiesel can replace 1 MJ of conventional fossil diesel. The abatement potential is calculated as the avoided fossil CO2 emissions due to the displacement of the conventional fossil diesel minus the fossil CO2 emitted in the generation of the biofuel (McKechnie et al., 2011; Menten et al., 2013). This approach focuses on the mass, energy, and CO2 balance of the biomass conversion process, assuming that it does not affect the outside world (the energy system as a whole) (Martin et al., 2015). Instead of considering the substitution at the product level (e.g., the fuel) it is also possible to estimate the displacement at the energy service level (e.g., electricity, mobility, and heating). In this case, an energy service provided by a biomass conversion pathway replaces an energy service coming from a fossil fuel conversion pathway. By modifying the comparison point, the efficiency of the whole biomass conversion pathway is taken into consideration in the abatement potential calculation, allowing to identify the biomass conversion pathways maximizing the fossil CO2 mitigation effect. The attributional approach does not, however, allow for a systemic approach at regional level.
The consequential approach for LCA allows precisely for a systemic approach. In a consequential approach, the use of biomass is considered in large-scale energy systems, such as countries, regions, or cities. The biomass conversion processes are then embedded into models covering the whole energy system. The energy system therefore “reacts” to the mass and energy flows of the biomass conversion process, which gives a more realistic overview on the impact of biomass usage than the allocation approach. Resources, as well as environmental or economic constraints can be integrated in the consequential approach (Steubing et al., 2012; Gerber et al., 2013). However, the consequential approach is more difficult to implement than the attributional one, as it requires the use of region-wide energy models.
This article evaluates and compares the CO2 abatement potential of woody biomass using both the attributional and consequential LCA approaches. The case of Switzerland is used to contextualize the analysis. The model for the Swiss energy system is based on the modeling framework presented in Codina Gironès et al. (2015). The goal is to quantify the possible role of woody biomass in the Swiss energy transition.
The article is structured as follows. A review of woody biomass chemical conversion technologies and how they combined into bioenergy pathways is first presented in section 2. In section 4, the results for the attributional approach are presented. The substitution of the fossil resource use is done at the level of the energy services in order to take into account the energy efficiency of the complete biomass conversion pathways. In section 5, the implementation of the consequential approach is presented in the form of an impact assessment for the use of woody biomass in Switzerland. A Special focus is given on the combination of biomass conversion and solar photovoltaics to produce for the production of fuel as a way to store excess renewable electricity.
2. Woody Biomass Conversion Technologies
Woody biomass conversion technologies convert the woody biomass resource into energy services or into energy carriers (liquid or gaseous fuels, or electricity).
2.1. Gasification and Methanation for Bio-SNG Production
This pathway combines two thermo-chemical technologies, gasification and methanation, to produce bio-based synthetic natural gas (bio-SNG) and CO2 from woody biomass. Equation (1) represents the overall chemical reaction stoechiometry. A drying step is needed before the gasification process for decreasing the humidity below 20%, in order to ensure the proper functioning of the gasification. The gasification process, which takes place at 800–900°C in an oxygen restrained environment (Gassner and Maréchal, 2009; Gassner et al., 2009), decomposes the biomass into syngas, a mixture of CH4, H2, CO, CO2, and H2O. The syngas is then cleansed before being converted to CH4 (SNG) and CO2 by the methanation process in a catalytic reactor (using nickel catalysts) at 300–400°C. Depending on the biomass composition and the specific gasification technology, the output of the reactor will contain between 40 and 50% volume of methane (CH4), which has to be separated from the CO2 and the remaining H2 if one wish to inject it in the natural gas grid (Gassner and Maréchal, 2009; Gassner et al., 2009). The complete process is depicted in Figure 1. The fuel efficiency of the complete process (EnergyOutputSNG/EnergyInputBiomass) is expected to range from 39 to 75% (Gassner and Maréchal, 2012), depending on the biomass composition and moisture content.
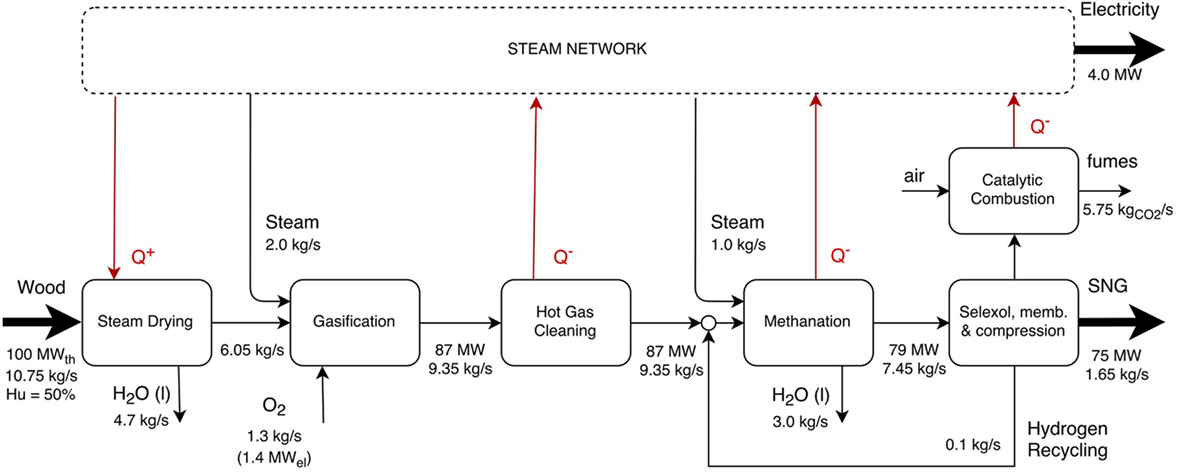
Figure 1. Flow diagram of a 100 MWth,wood gasification plant without cogeneration based on directly heated pressurized gasification system (Gassner and Maréchal, 2012).
The critical part of this pathway is the methanation step. Although the 2-stage process feasibility has been demonstrated in pilot plant scale, like the one in Guessing (Austria) producing 1 MWSNG, the technology has not yet reached commercial status (Iskov, 2013). The Swedish project GOBIGAS in Göteborg expects commissioning of the world’s first large-scale commercial methanation plant supplying 100 MWSNG by 2020.2
2.1.1. Power-to-Gas for Bio-SNG Production
A variant of the gasification–methanation pathway consists in combining it with a power-to-gas (PtG) process. Renewable electricity is used to produce hydrogen (H2) in an electrolyzer. The hydrogen is then injected in the methanation reactor to increase the CH4 output (see Figure 2). As shown in equation (3), the use of H2 does indeed increase the CH4 yield while reducing the CO2 emissions of the bio-SNG production process. This combined biomass gasification pathway is particularly relevant as a mean to store electricity in regions that have excess production of renewable electricity.
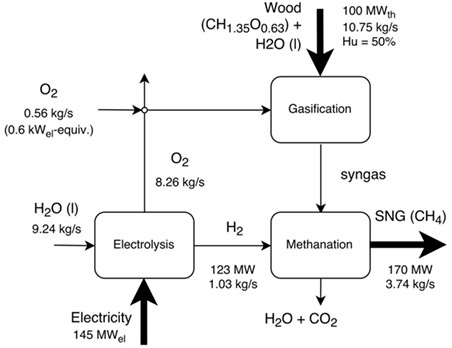
Figure 2. Integration pathway of the electrolysis in the directly heated gasification–methanation system. The mass and energy flows correspond to the system design in Gassner and Maréchal (2008), which maximizes the bio-SNG production.
This variant of the methanation process increases the energy content per unit of biogenic carbon in the input from 21.5 MJLHV/kgCinput for the process without electrolysis to 52.8 MJLHV/kgCinput for the conversion process integrating the electrolysis. Thus woody biomas serves as a carbon source for electricity storage into synthetic fuel, with an electricity-to-fuel efficiency of 68%. This efficiency compares the increase on the SNG production to additional electricity consumption. Equation (4) shows the way it is defined, where Fuel is the energy content (LHV based) of the produced biofuel, InElec is the electricity input, OutElec is the electricity output, Elec and NoElec are the subscripts for the technology with a without electrolysis, respectively. An alternative to the use of wood as carbon source consists in capturing the CO2 directly from the atmosphere, but the electricity-to-fuel efficiency then drops to 52% (Parra et al., 2017).
2.2. Hydrothermal Gasification (HTG) for Bio-SNG Production
Hydrothermal gasification (HTG) is a promising technology for the production of bio-SNG from wet woody biomass or any biomass with moisture content between 50 and 80% (Gassner et al., 2011). As for the gasification/methanation process, HTG fully converts the energy content of the biomass into gas, electricity, and heat. Its main advantage over other conversion processes lies in the fact that the biomass is treated in supercritical water, thus avoiding the energy consuming drying step. Under supercritical conditions, the biomass macromolecules are hydrolyzed and become accessible to the catalyst for the conversion into CH4 and CO2. In addition, the supercritical conditions require less energy for heating up the water to the operating conditions.
Up to date, only lab-scale HTG facilities have been built (Waldner et al., 2007; Kruse, 2009). The performances in Table 1 are based on models, which have been calibrated with data from laboratory experiments, in order to be able to calculate the efficiencies of an integrated industrial process.
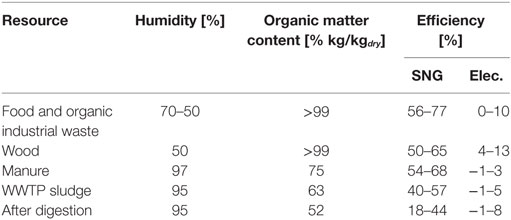
Table 1. Performances for the hydrothermal gasification with dry matter content of 20% (Gassner et al., 2011).
As shown in Table 1, the performance of the HTG process highly depends on the properties of the feedstock. In addition, the process heat demand is fairly sensitive to the level of dilution of the organic matter in the water. In this respect, hydrothermal gasification is in direct competition with bio-methanation (anaerobic digestion). In some cases these two technologies can actually complement each other as HTG can treat in a post-process the non-digested output from the bio-methanation reactor.
2.3. Fischer-Tropsch (FT) Process for Producing Synthetic Liquid Fuels
The biomass to liquids (BTL) conversion pathway considered in this study consists in the synthesis of Fischer-Tropsch fuels from lignocellulosic biomass. The first step of the process is the pretreatment by which raw biomass (35% moisture content) is dried, torrefied, and ground into fine particles. The biomass particles are then gasified in a pressurized (30 bar) steam-oxygen blown entrained flow gasifier. The synthesis gas produced, consisting mainly of H2, CO, and CO2, is cooled by a water quench and cleaned in a scrubber. A water gas shift (WGS) reactor is used to adjust the H2 to CO ratio and CO2 is removed by amine scrubbing in order to satisfy the requirements of the FT synthesis by which the liquid hydrocarbon fuels are produced. This process is described in detail in Emanuela (2015), as a reference process using entrained flow gasification with “most conventional technologies” and converting 200 MWth (on a LHV daf basis) of lignocellulosic biomass.
FT fuels can be blended to diesel fuel. Methanol production is an alternative BTL conversion pathway with similar conversion to the FT fuel pathway. Methanol can be blended with gasoline (Peduzzi et al., 2013).
2.3.1. Power-to-Gas (PtG) for FT Liquid Fuel Production
In the above Fischer–Tropsch (FT) process, as an alternative to the water gas shift reaction, steam electrolysis can be used to provide the required amount of H2 to reach the needed H2/CO2 ratio. The addition of H2 increases the amount of carbon that is converted into liquid fuel. As in the gasification/methanation and electrolysis combination discussed above, the use of hydrogen from electrolysis serves as a long-term storage option for excess renewable electricity.
The integration of steam electrolysis in the FT-process increases the energy content per unit of biogenic carbon in the input, rising from 13.4 MJLHV/kgCinput for the process using the water gas shift reaction to 26.1 MJLHV/kgCinput for the conversion process with the electrolysis. The marginal efficiency of the conversion of electricity into FT fuel is 78%. Equation (4) defines the marginal efficiency.
2.4. Biomass Integrated Gasification Combined Cycle (BIGCC) for Electricity Production
A biomass integrated gasification combined cycle (BIGCC) uses a pressurized gasifier to convert woody biomass into synthesis gas (syngas), which consists mainly of H2, CO, and CO2. The syngas is then cleansed from impurities prior to entering a gas turbine to generate electricity. In order to maximize the electrical efficiency, the heat content of the flue gas is then used in a boiler for producing steam, which subsequently expands in a bottoming steam turbine to further produce electricity. A BIGCC is identical to a natural gas combined cycle, in which gasified biomass substitutes natural gas as input to the gas turbine.
2.5. Integrated Gasifier–SOFC–GT System for Electricity Production
This integrated system converts woody biomass to electricity with a maximum efficiency of 71% (Caliandro et al., 2014). The biomass is first dried to 10–25% moisture content. The dry wood then enters a directly heated fluidized bed gasifier (CFB) to produce syngas, which fuels a solid oxide fuel cell (SOFC)–gas turbine (GT) hybrid cycle. Prior to injection into the hybrid cycle the syngas produced in the gasifier is sent to the hot cleansing unit to remove particulates, sulfur and tar, in order to reach the required syngas purity specifications required by the SOFC. The SOFC outlet stream is at high temperature and still contains some syngas. Thus it has a high exergy content, which is exploited in a gas turbine to produce additional electricity (Facchinetti et al., 2011). If the combustion in the gas turbine is made with pure oxygen, the flue gases only contain CO2 and water vapor. The water vapor can be condensed to separate the CO2 which can be compressed for its transport and storage (carbon capture and storage). A detailed description of the system is available in Caliandro et al. (2014).
2.6. Torrefaction As a Biomass Pretreatment
Torrefaction is a thermo-chemical process carried out at 200–300°C, with low heat-up rates (less than 50°C of temperature increase per minute), and long reaction time (about 1 h). It may be used as pretreatment process to upgrade woody biomass or other kinds of lignocellulosic biomass. It completely dries and reduces the hygroscopic nature of biomass, meaning that only 1–6% moisture content may be regained during storage. In comparison to raw woody biomass, torrefied biomass has a higher heating value and energy density. In addition, torrefied biomass has better grindability and better properties for injection when used in boilers or gasifier, as it is a more homogeneous fuel than raw biomass. These characteristics make torrefied woody biomass a suitable substitute of coal in co-firing or gasification facilities, with a minimal efficiency penalty even in equipments designed for coal. Furthermore, because of the low hygroscopic nature and higher energy density transportation costs can be reduced (Peduzzi et al., 2014).
3. Methodology to Assess the CO2 Mitigation Potential of Biomass
Bioenergy pathways can produce solid, liquid, or gaseous biofuels, which can substitute fossil fuel in almost all applications and avoid their associated fossil CO2 emissions. Biomass chemical conversion processes suffer from high conversion losses, hence the importance of energy efficiency optimization. In order to measure the CO2 mitigation potential of biomass, the complete conversion chain, from raw biomass to final energy service, has to be evaluated.
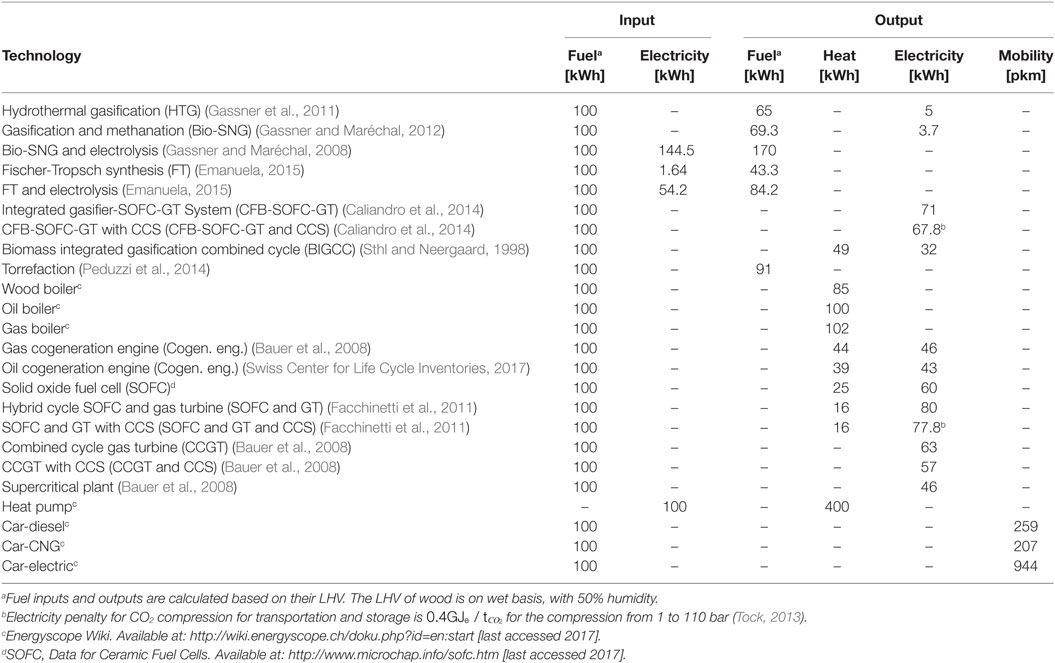
The CO2 performance of bioenergy pathways is assessed using the attributional life cycle analysis (LCA) approach. The production of chemicals or food products from biomass is not considered, although bio-products may have much higher mitigation impact than the energy use (Celebi et al., 2015). The CO2 mitigation potential of bioenergy pathways in producing the following energy services are compared: space heating, electricity and mobility. Both mature technologies (e.g., biomass boiler) and the future technologies discussed in section 3 that are expected to become mature by 2035 are considered. The list of bioenergy technologies considered together with their respective conversion efficiencies are listed in Table 2. The conventional fossil-based technologies that are substituted by the bioenergy pathways are also listed in Table 2.
In order to study the CO2 emissions abatement potential of woody biomass, the different bioenergy pathways are evaluated in replacement to fossil fuels technologies. The abatement potential depends on the fossil pathway that is replaced. The CO2 performance of the different bioenergy pathways is compared in order to identify those with highest CO2 mitigation potential. The aim is to identify for which energy services and with which conversion technologies biomass should be used to maximize CO2 emission reduction. The study is limited to woody biomass but it could be extended to any other type of biomass.
Carbon Capture and Storage (CCS) is included in the study, whereby CO2 emissions originating from the combustion of fossil fuels or biofuels are captured and stored. When CCS is combined to a biomass conversion process it captures biogenic CO2 emissions that are neutral in terms of Greenhouse Gas (GHG) emissions (Reijnders, 2006). Biomass-based pathways combined with CO2 capture, therefore, act as CO2 sinks that correspond to net negative values of CO2 emissions.
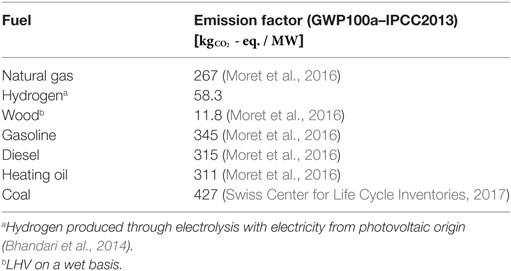
Table 3 contains the emission factors for the substituted fossil fuels and the consumed wood. The emission factors are calculated with a LCA approach and based on the “IPCC 2013–Global Warming Potential (GWP) 100 years” impact assessment method. They include the emissions from the extraction, conditioning, distribution, and combustion of the fuels. The electricity consumed by the electrolysers is assumed to be of photovoltaic origin, its impact factor is (3 kWe polycrystalline PV panels on flat roof in Switzerland (Swiss Center for Life Cycle Inventories, 2017)). The impact for the production and construction of the technologies in the conversion pathways have not been considered, since it represents a low fraction of the total impact. For example, the impacts for the production and installation of a wood and natural gas boilers are 28.9 and (Swiss Center for Life Cycle Inventories, 2017), respectively. If they are added to the impact related to the fuels consumption, they only represent the 1.55 and 0.03% of the total value.
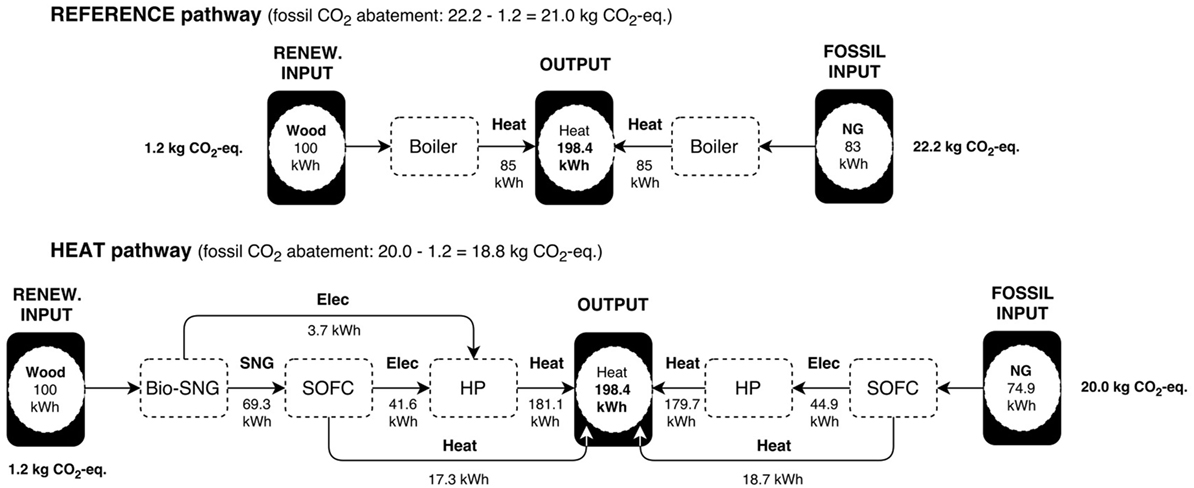
The biomass and fossil pathways are each represented by a series of conversion technologies to produce the energy service considered. For each energy service, a reference pathway, made of conventional technologies, serves the purpose of reference point for emission reduction potential. Figure 3 gives an example for a space heating both for the reference pathway using boiler (upper part of Figure 3) and a future pathway combining the use of advanced technologies (gasification, fuel cells, and heat pumps) (lower part of Figure 3).
The CO2 abatement potential is given by the difference between the CO2 emissions of the fossil fuel combustion in the fossil pathway and the emissions of the woody biomass and photovoltaic electricity usage in the woody biomass pathway, based on an attributional LCA basis. The fossil fuel consumption of the fossil pathway is equal to the required amount to supply the same quantity of space heating as the woody biomass pathway (see Figure 3).
4. Results: Woody Biomass for Energy Services and CO2 Mitigation
4.1. Biomass for Space Heating
This section analyses the fossil CO2 abatement obtained when replacing a fossil-fueled technology by a woody biomass pathway to supply space heating only, or space heating and electricity (cogeneration).
The different pathways that deliver space heating are made of 1, 2 or 3 consecutive conversion technologies. The first one is the “Biomass to Fuel” technology, by which woody biomass is transformed into a gaseous or liquid biofuel, and possibly electricity as a by-product. The second technology “Fuel to X” converts the biofuel into heat and/or electricity. It is worth noting that some technologies, such as the Biomass Integrated Gas Combined Cycle (BIGCC), combine both steps as they directly convert the woody biomass into electricity and/or heat. The third possible technology is heat pump which converts the electricity produced along the pathway (if any) into space heating. The fossil pathways which are substituted also integrate heat pumps if electricity production along the pathway, so that the comparison is fair. Figure 3 contains an example for such as “HEAT pathway.”
Results are shown in Table 4. The fossil CO2 emissions reduction obtained when 1 kWh of woody biomass is used for space heating in different bioenergy pathways as a substitution for natural gas (NG) pathways. Values in the same row represent the CO2 abatement potentials of a given bioenergy pathway depending on the displaced natural gas pathways.
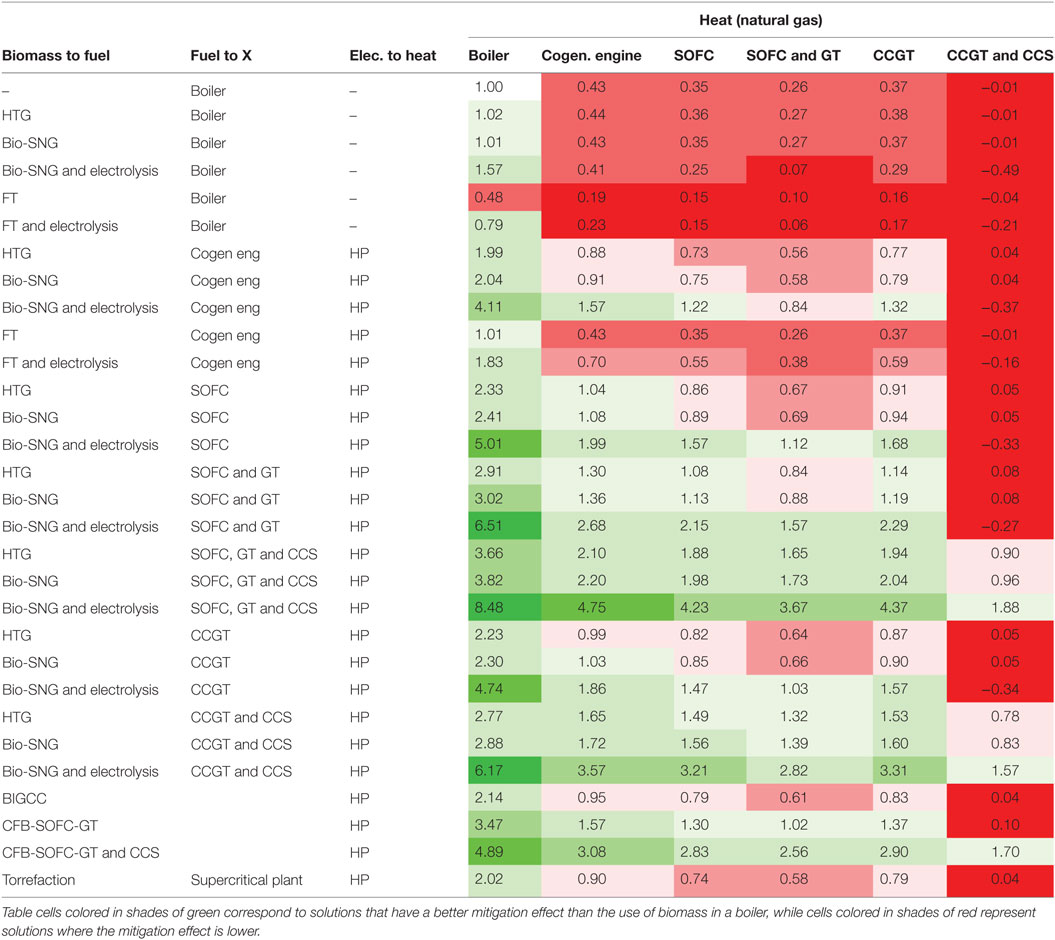
Table 4. Normalized fossil CO2 emissions reduction through the substitution of natural gas pathways by biomass pathways for space heating (reference value: ).
The values in Table 4 are normalized considering the emission reduction obtained if the biomass was used in a wood boiler that substitutes heat from a natural gas boiler (see reference pathway in Figure 3). A value of 1 in Table 4 corresponds to a reduction of . The higher the values, the higher the CO2 abatement potential of the biomass pathway. Negative values reflect situations where the biomass pathway actually generates more lifecycle CO2 emissions than the fossil pathway that is substituted.
The results in Table 4 indicate that the mitigation potential depends greatly both on the biomass pathway considered and on the fossil pathway it substitutes. For instance, the first line in Table 4 shows that the CO2 mitigation of a wood boiler ranges from 1, when the substituted technology is a natural gas boiler (reference pathway), to −0.01, if the substituted fossil pathway is a heat pump driven by electricity produced by a combined cycle gas turbine (CCGT) with carbon capture and storage (CCS).
The worst case scenario (negative values of −0.49 in Table 4) corresponds to the following case: a “Bio-SNG and Electrolysis–Boiler” biomass pathway substitutes a heat pump driven by electricity that is generated by a CCGT plant with CCS (see Figure 4). The biomass pathway produces 12.3 kg CO2-eq. (on a life cycle basis), while the emissions from the fossil pathway are only 2.0 kg CO2-eq, thanks to the use of a heat pump and because the CO2 emitted by the CCGT plant is captured and sequestrated.
The biomass pathway offering the highest emission reduction potential is the “Bio-SNG and Electrolysis–SOFC, GT and CCS–HP” pathway, which could lead to 8.48 times the emissions savings of the reference pathway (only biomass boiler). In this pathway, the bio-SNG and electrolysis system produces bio-SNG from woody biomass and hydrogen produced from renewable electricity. The bio-SNG is then used in a solid oxide fuel cell (SOFC) with bottoming gas turbine (GT), combined with carbon capture and storage (CCS) and where the electricity produced by the fuel cell is used to drive a heat pump. Given the CO2 sequestrated by the CCS is of biogenic origin, the system acts as a carbon sink, removing CO2 from the atmosphere.
4.2. Biomass for Space Heating and Electricity Production
The pathways that deliver heat and electricity are composed of two technologies: “Biomass to Fuel” and “Fuel to X.” Figure 5 contains an example for such “HEAT and ELECTRICITY” pathway.
Results are shown in Table 5 which gives the CO2 emissions reduction obtained when 1 kWh of woody biomass is used for supplying space heating and electricity, in replacement for fossil pathways offering the same energy services. The reference value for normalization is the same as in Table 4 .
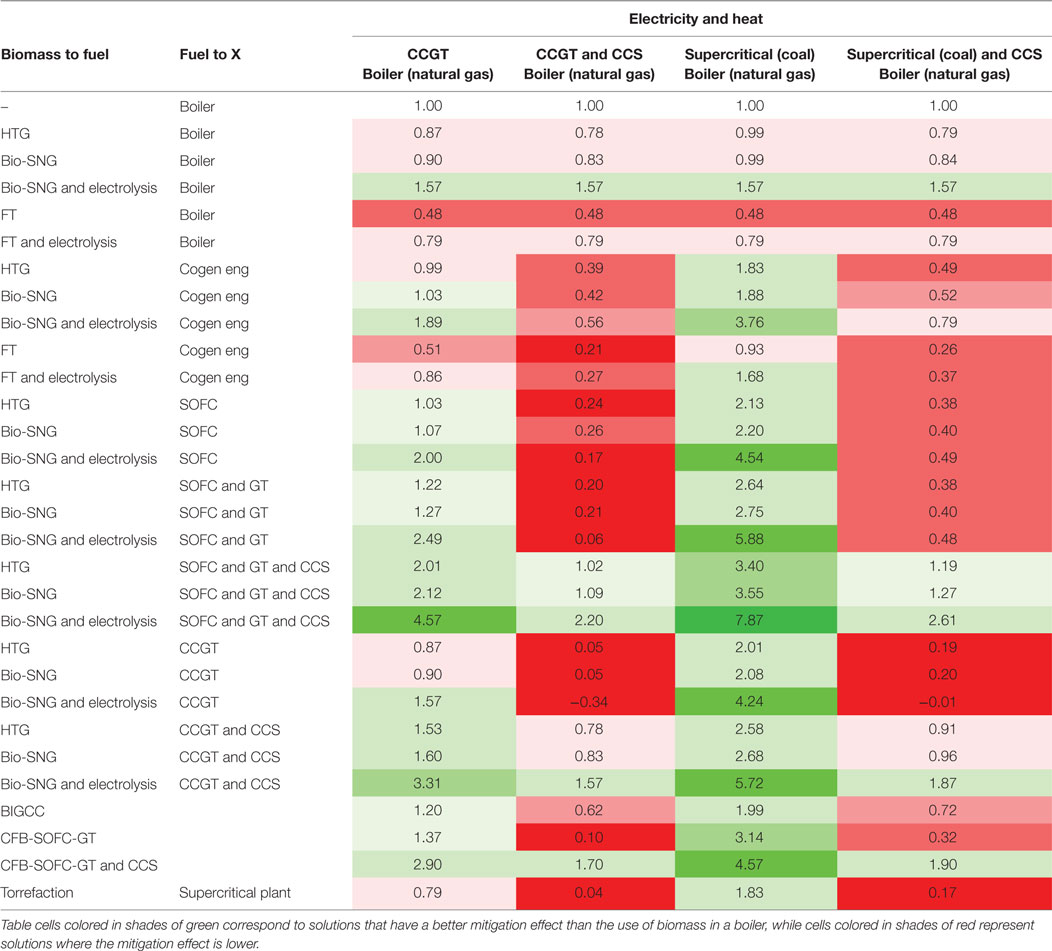
Table 5. Fossil CO2 emissions reduction through the substitution of fossil fuels by biomass usage pathways for space heating and electricity supply (reference value: ).
The woody biomass pathway in the first row of Table 5 is composed by only a boiler for heat-only production, and serves as a reference pathway. Its abatement potential is thus constant along the row, as the different fossil-based electricity supply technologies are not used, since the woody biomass pathway only supplies space heating.
The highest CO2 abatement potentials are obtained when supercritical coal power plants for electricity generation are substituted, due to the low efficiency of the coal technology and the high emission factor of coal in comparison to the natural gas based CCGT technology (see Tables 2 and 3). Actually the combination of CCGT and CCS technologies is the most efficient fossil pathway and, thus, presents the lowest abatement potential for biomass pathways (Table 5). The worst case is obtained when the “Bio-SNG and Electrolysis → CCGT” pathway replaces the “CCGT and CCS + Boiler (Natural gas)” fossil pathway. In this case, the fossil CO2 abatement is even negative (−0.34), which reflects the fact that the fossil pathway emits less fossil CO2 on a life cycle basis than the woody biomass pathway thanks to the use of the CCS technology.
As for space heating only (Table 4), the highest abatement potential (7.87) is given by the biomass pathway in which the bio-SNG and electrolysis and SOFC, GT, and CCS technologies are combined together (Table 5). In addition, comparing the results in these two tables indicates that substituting fossil fuels for space heating brings slightly higher mitigation impact than displacing fossil electricity.
4.3. Biomass for Space Heating and Mobility
If biomass is converted into a fuel, it can be used to substitute the corresponding conventional fossil fuel used in transportation. When considering a 2035 horizon, it is, however, critical to consider both the possible fuel substitution but also the expected fuel efficiency increase of vehicles. It is in particular necessary to take into account the full electrification and hybridization of power trains. Table 2 defines the efficiencies of different power trains in cars that are used in this study.
The pathway transforming the energy content of woody biomass into mobility service can be formed by up to three technologies: “Biomlass to Fuel,” “Fuel to X,” and “Elec. to Transport.” “Biomass to Fuel,” and “Fuel to X” play the same role as in the pathways analyzed above for space heating and electricity production (Tables 4 and 5), with the added possibility for “Fuel to X” to be a private passenger vehicle. The “Elec. to Transport” technology is a battery electric car using all electricity production of the pathway for mobility.
Table 6 shows the fossil CO2 emissions reduction obtained if the primary energy source for mobility and space heating is biomass instead of fossil fuels. The biomass pathways that produce heat are used to replace the use of natural gas boilers for space heating, see the “HEAT and MOBILITY” pathway example in Figure 6. As in the previous Tables 4 and 5, the reference value for normalization is .
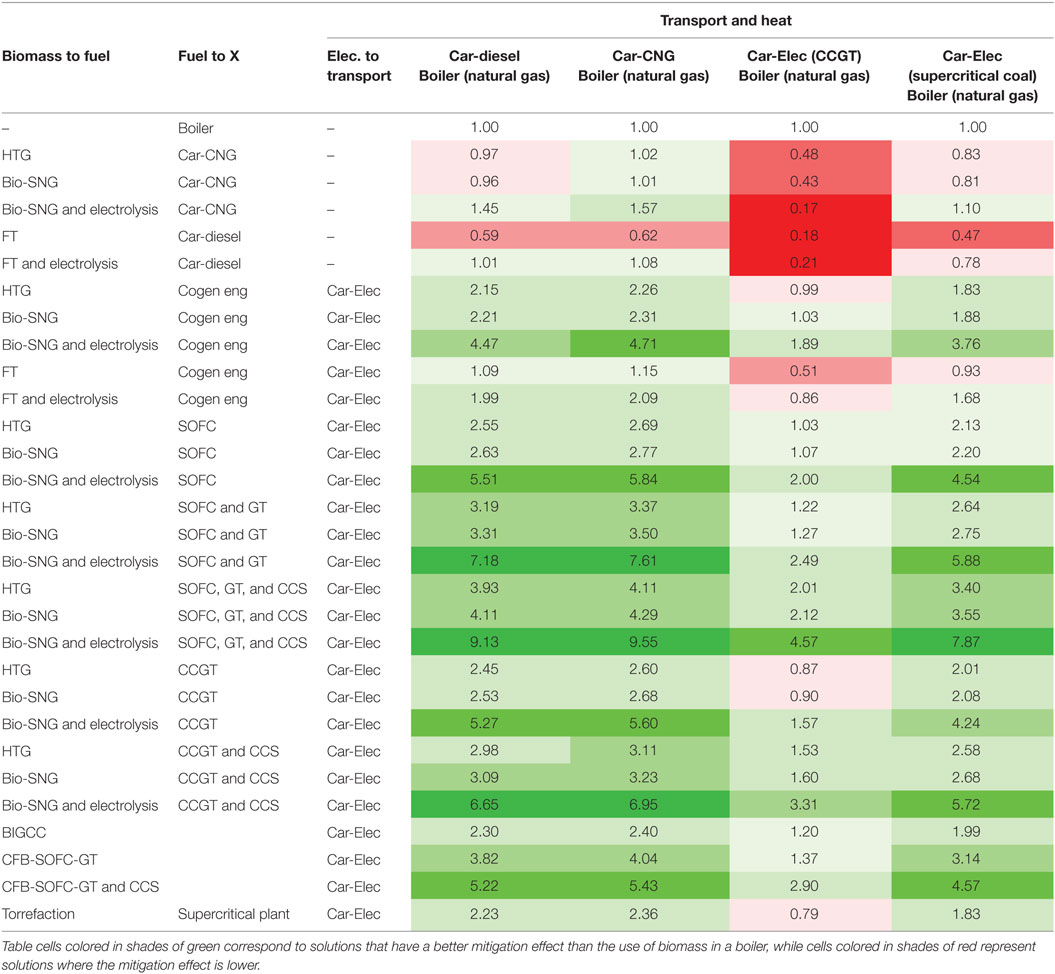
Table 6. Fossil CO2 emissions reduction through the substitution of natural gas by biomass usage pathways for space heating and mobility (reference value: ).
The highest fossil CO2 emissions reduction (9.55) is achieved when woody biomass is used in the “Bio-SNG and Electrolysis → SOFC, GT, and CCS → Car-Elec” pathway to replace cars fueled by compressed natural gas (CNG) (see Figure 7). In this pathway, there is also a small amount of heat production (16% thermal efficiency) from SOFC, GT, and CCS, which substitutes natural gas boilers for space heating.
Interestingly, there are no negative values in Table 6, which indicate that all substitution pathways do bring CO2 emissions reductions. The reason for this lies in the fact that battery electric vehicles are about 3 times more energy efficient than diesel cars (see Table 2). Hence, using electric cars that run on renewable electricity instead of diesel cars will bring higher abatement potential than substituting fossil-based heaters of power plants by biomass-based technologies. Comparing the results from Tables 4–6 shows that the “space heating and mobility” pathways offer the highest mitigation potentials.
The difference on efficiencies between fossil fuel cars and battery electric cars is such as that it brings a higher CO2 mitigation to replace a diesel or CNG car by an electric car running on biomass electricity than a battery electric car running on electricity from supercritical coal power plant. A diesel car emits 0.122 kg CO2-eq./pkm, while a battery electric car using electricity generated from coal has an impact of 0.100 CO2-eq./pkm (based on emission factors and efficiencies reported in Tables 3 and 2).
5. Results: Relevance of Woody Biomass Pathways for the Swiss Energy Transition
The analysis of section 4 shows that the choice of the substitution pathway impacts significantly on the CO2 abatement potential. It also highlights the importance of biomass thermo-chemical conversion processes as a mean to store renewable electricity, as the highest fossil CO2 abatement potentials are reached with the woody biomass pathways that integrate electrolysis for increasing their yield. Now, the results of section 4 assume that the biomass conversion process continuously receives the electricity from photovoltaic panels. In this sense, it does not take into account any supply constraints of either biomass or renewable electricity. To address the question from a systemic point of view, it is necessary to extend the system boundary to a region-wide energy system in order to consider the available biomass potential and the amount of excess renewable electricity that need to be stored. To do this, the analysis must be contextualized. In this section, the case of Switzerland is considered and the system boundary is extended to the Swiss energy system in the year 2050. The CO2 mitigation potential is then calculated based on a consequential life cycle analysis (LCA).
5.1. Biomass Potential in Switzerland
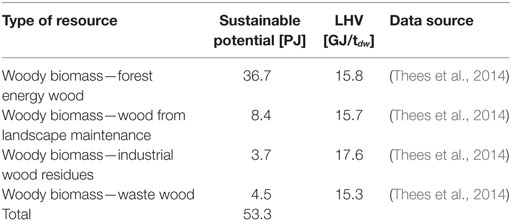
Biomass potential in Switzerland has been evaluated by Steubing et al. (2010) later updated by Thees et al. (2014). Table 7 presents the sustainable potential for woody biomass by type of resource with the corresponding LHV per ton of dry matter (tdw). The sustainable potential represents the total potential, including the present use of biomass, which amounts to about 51%. The total sustainable potential is 53.3 PJ. Today, biomass covers a mere 5% of the primary energy demand of Switzerland. By comparison, Austria which has a similar topography and forestry surface to Switzerland, supplies 17% of its primary energy demand with biomass (Vuille et al., 2015b). When considering the “New Energy Policies” (NEP) transition scenario for 2050 of the Swiss confederation (Prognos, 2012), the woody biomass potential of Switzerland corresponds to 9.7% of the overall energy needs.
Thinking of the carbon capture effect of photosynthesis, the woody biomass potential corresponds to a biogenic source of carbon that has captured up to 5,353 corresponding to 12% of the actual emissions of Switzerland (Codina Gironès et al., 2015).
5.2. Potential for Seasonal Electricity Storage in Switzerland
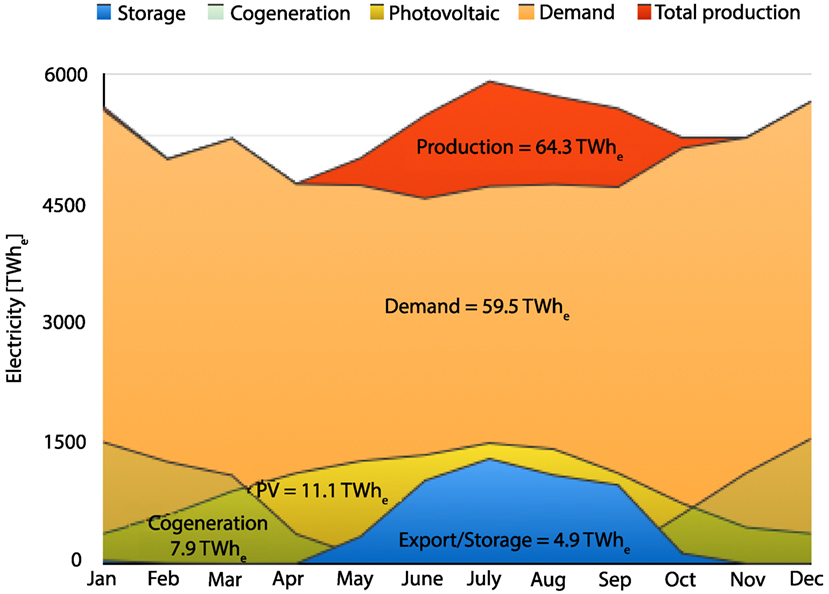
The characterization of the future Swiss energy system is based on the New Energy Policy (NEP) scenario in 2050 (Prognos, 2012) that the Swiss government uses as a basis to its Energy Strategy 2050. Figure 8 presents the monthly profiles of the electricity production for the NEP scenario in 2050. The per capita electricity production and demand are 811 and 750 Wyear/inhab., respectively. This NEP scenario is based on a relatively high penetration of renewable electricity sources. The annual photovoltaic electricity production is increased to 140 Wyear/inhab. The monthly profiles show the contributions of cogeneration in the winter months and the excess electricity produced in summer. It also takes into account an increase of the height of certain dams which allows shifting around 30 Wyear/inhab. from summer to winter months (Schleiss, 2012). In this scenario, around 4.9 TWh (62.3 Wyear/inhab.) corresponding to 7.7% of the annual production has to be stored or curtailed, as it cannot a priori be exported as neighboring countries will experience the same excess production. It also represents 44.5% of the electricity produced by photovoltaic panels considered in the scenario.
This future summer excess corresponds to the current winter deficit that Switzerland covers with imports. Hence, seasonal storage would enable substituting the winter imports and increase significantly the energy independence of Switzerland while reducing the carbon footprint of its electricity. However, in the NEP scenario, it is planned that cogeneration is used to bridge the winter deficit, thanks to its capacity to jointly produce power and heat when both products are actually needed. In the NEP scenario, there is no more electricity deficit, and hence no need for seasonal storage.
5.3. Preferred Biomass Pathway for Switzerland
Given that seasonal storage of electricity will a priori not be needed in Switzerland in 2050, an alternative use of its future excess electricity produced in the summer has to be found. In this context, biomass chemical conversion technologies combined with electrolysis are a good option for transforming the excess summer electricity into biofuels. This is the case for the wood-based bio-SNG and electrolysis pathway (see section 2.1), as well as the Fischer-Tropsch (FT) and electrolysis pathway (see sections 2.3).
The electricity-to-fuel efficiency of the FT and electrolysis pathway is higher than that of the bio-SNG and electrolysis process, 78% against 68%. However, the later process is able to store more electricity per unit of biomass energy input (1.44 kWhe/kWhBiomass) than the FT and electrolyisis (0.54 kWhe/kWhBiomass). Therefore, the bio-SNG and electrolysis process is the best option as the amount of available biomass is limited. In addition, it is the chemical conversion pathway, included in the pathways described in section 4, with the highest fossil CO2 abatement potential. The bio-SNG and electrolysis pathway as a system for electricity storage is analyzed in detail in the following paragraphs as well as in section 5.4.
Based on the results presented in Gassner and Maréchal (2008), absorbing 4.9 TWh of excess electricity in the Swiss NEP energy transition scenario requires a 1.21 GWWoodInput (0.13 kW/inhab.) bio-SNG and electrolysis facility with a 1.76 GWe (0.20 kW/inhab.) electrolyzer. The annual woody biomass consumption of such a facility is 10.6 TWh (134 Wyear/inhab.), while its bio-SNG production is 10.1 TWh (127 Wyear/inhab.).
For calculating the values in the previous paragraph, the bio-SNG and electrolysis system is sized by considering the month with the highest surplus of electricity with the objective to use the entire surplus electricity in the electrolyzer. The ratio between the electricity input in the electrolyzer (Elecin) and the wood input in the gasifier (Woodin) takes the maximum value presented in Gassner and Maréchal (2008) for the directly heated gasification system: Elecin/Woodin = 1.445. The wood input power is assumed to be constant along the year, thus the Elecin/Woodin is lower for the other months. The gas output for month i (Gasout,i) is calculated using Eq. 5. The necessary data for defining Eq. 5 are available in Gassner and Maréchal (2008) (directly heated gasification system case). Figure 9 shows the behavior of the system for 1 MJ of wood being gasified in 1 year. The Swiss electricity production and consumption profiles in the NEP scenario for 2050 are used to determine the electricity surplus profile.
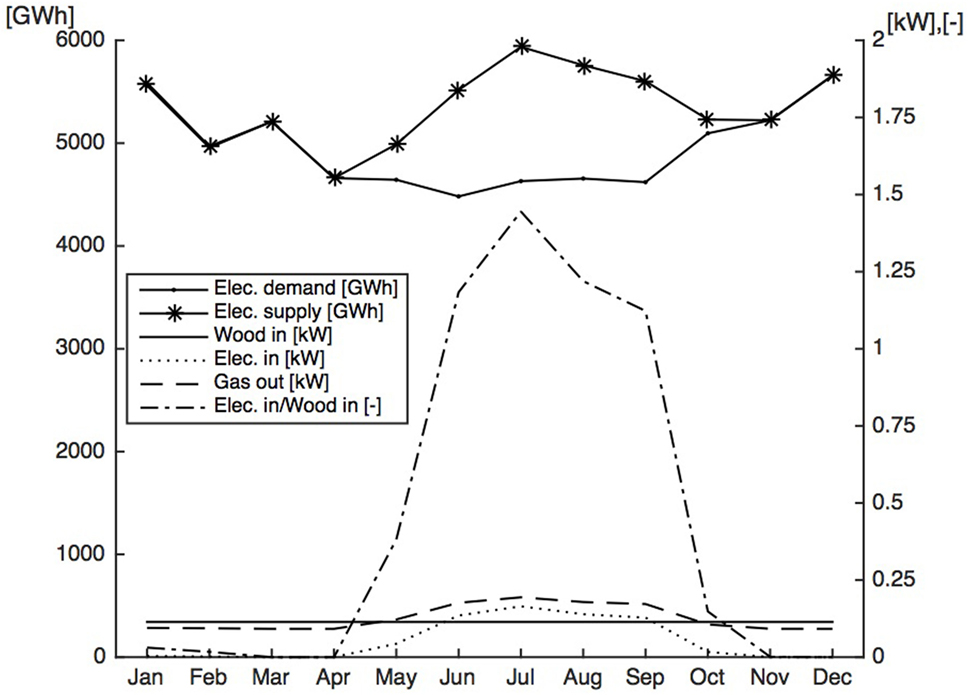
Figure 9. Behavior of the bio-SNG and electrolysis system considering electricity supply and demand profiles in the NEP scenario in 2050.
5.4. Alternative Scenarios for the Swiss Energy System
As discussed in section 5.3, the bio-SNG and electrolysis pathway is a priori the preferred one for Switzerland. However, the implementation of this pathway in the Swiss NEP scenario is constrained by the fact that almost 90% of the woody biomass resources are already used by other existing pathways, mainly wood boilers and cogeneration units for heat and electricity production (Prognos, 2012). The untapped biomass potential is only about 6 PJ, which is significantly below the amount required for storing all the excess electricity during summer: 38 PJ of woody biomass. Therefore, it is necessary to define alternative scenarios to the NEP scenario in order to assess the impact of the implementation of this biomass pathway in the Swiss energy system in 2050.
Two alternative scenarios are proposed: the “gasification scenario” and the “photovoltaic scenario.” These two scenarios, which are presented in sections 5.4.1 and 5.4.2, have been designed using the Energyscope energy model (Codina Gironès et al., 2015). The Energyscope model has seven input variable categories: socio-economics, efficiency, transport, heating and combined heat and power, renewable electricity, non-renewable electricity, and cost (Codina Gironès et al., 2015). In the two alternative scenarios, all the inputs are kept identical to those in the NEP scenario, except for the technology mix for distributed heating (heating and combined heat and power category), and the composition of the vehicle fleet (transport category). These are the decision variables of the optimization problem to generating these alternative scenarios. The technology mix for distributed heating is composed of seven different technologies (see Table 8). Their role is to supply space heating and sanitary hot water to the households, industry, and service sectors. The weight of each technology within the mix is expressed as a percentage of the total installed power for distributed heating.
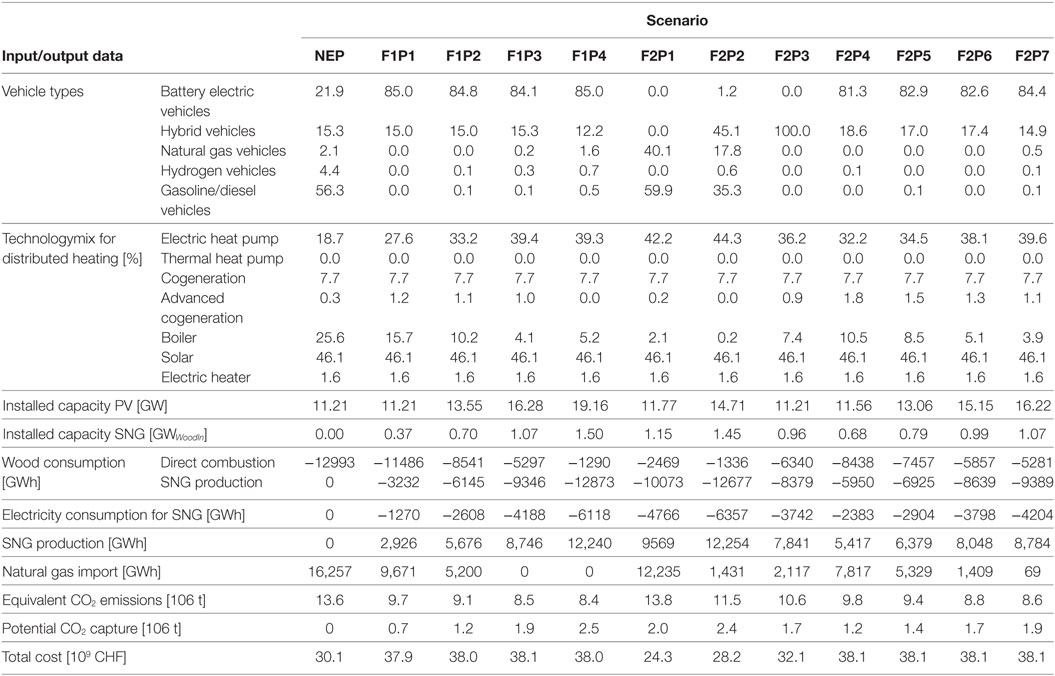
Table 8. Input and output data for the NEP scenario and the highlighted scenarios in Figures 10 and 11 for 2050.
In the two alternative scenarios, the possibility of storing the CO2 in the output of the methanation process is evaluated. The use of hydrogen for increasing the bio-SNG yield decreases the amount of CO2 that can be captured, as the hydrogen uses the carbon from the CO2 for the production of methane (see 2.1). The CO2 stored can represent up to 30% of the equivalent CO2 emissions of the Swiss energy system (point F1P4 in Table 8).
5.4.1. The “Gasification” Scenario
The gasification scenario is designed by solving an optimization problem, the objective function of which is the minimization of the equivalent CO2 emissions under the assumption that no import of woody biomass is allowed. The scenario is based on the gasification of woody biomass rather than direct combustion. To have more woody biomass available for gasification, the proportion of existing boilers in the technology mix for distributed heating is reduced, in favor of heat pumps (see Table 8, where NEP and F1P1 are the NEP and “Gasification” scenarios, respectively). The percentage of solid oxide fuel cells (SOFC) combined with gas turbines (GT), called “advanced cogeneration” in the Energyscope model, is increased to compensate part of the increase in electricity demand due to the higher use of heat pumps. The share of the other technologies in the distributed heating mix (thermal heat pump, cogeneration, solar, and electric heater) remains the same as in the NEP scenario.
In this gasification scenario, excess electricity is also produced in the summer period (1,270 GWh), which is assumed to be converted into bio-SNG (5,676 GWh) thanks to the bio-SNG and electrolysis pathway.
The results show that the “Gasification scenario” has 29% lower equivalent CO2 emissions in comparison to the NEP scenario with a slightly lower overall woody biomass consumption. In addition, it decreases the energy dependency of Switzerland as compared to the NEP scenario by 40% thanks to the new bio-SNG production.
5.4.2. The Photovoltaic Scenario
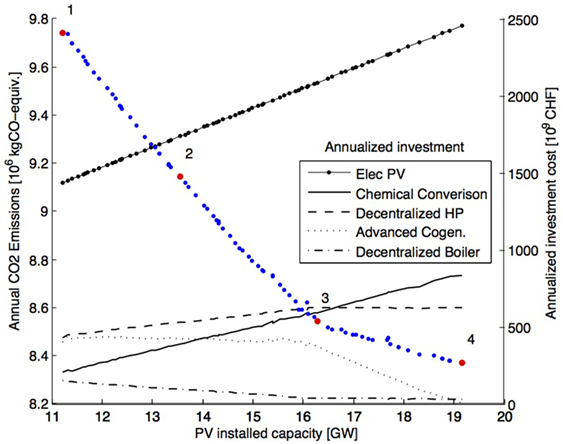
With a technical potential estimated to 24 TWh (Vuille et al., 2015a), solar photovoltaics is the renewable electricity source with the highest untapped potential in Switzerland. In both the NEP and in the “Gasification” scenarios less than half of this potential is actually exploited (11 TWh). An increase in the photovoltaic installed capacity combined with a mix of technologies consuming or transforming the photovoltaic electricity would reduce the energy dependency of the country. This translates into a significant reduction of the CO2 emissions. Figure 10 shows how the annual equivalent CO2 emissions change if the PV installed capacity is higher than the one considered in the NEP scenario. For generating the scenarios, the optimization problem described in section 5.4.1 is solved for four level of PV installed capacity between 11 and 19 TWh (Figure 10).
5.5. Results from the Optimization Problem
Table 8 contains the decision variables and output values of the highlighted points in Figure 10. From Figure 10, it can be directly concluded that the higher the PV penetration, the lower the CO2 emissions. The electricity supplied by the additional installed capacity is used both to drive decentralized heat pumps and to feed electrolysers for increasing the production of bio-SNG. This use is compatible with the fact that Switzerland is expected to have no electricity deficit in 2050 (according to the NEP scenario), and that electricity export is not possible as neighboring countries will experience the same production peaks such as Switzerland. To meet these constraints, it is necessary to invest 0.3 Swiss Francs (CHF) in decentralized heat pumps and 0.6 CHF in the bio-SNG and electrolysis technologies for every CHF invested in PV capacity. The linear relation between investments is extracted from Figure 10.
The previously described strategy rises the consumption of woody biomass of the bio-SNG production facility, so the amount of woody biomass consumed by direct combustion technologies is decreased, under the assumption that no wood is imported. The extra amount of bio-SNG injected into the system replaces the fossil natural gas until the PV installed capacity reaches approximately 16.3 GW (point 3 in Figure 10). At this deployment level the decentralized heat pumps reach their maximum weight in the distributed heating mix. At this point, decentralized heat pumps cannot be the electricity sink for additional photovoltaic electricity. As there is no other technology being able to consume electricity whose capacity can be modified by the optimizer, the only option is to decrease the electricity production from other sources in order to accommodate the additional photovoltaic electricity. For this reason, the installed capacity of advanced cogeneration decreases (from 1% in point 3 to 0% in point 4). When reducing the installed capacity of advanced cogeneration, the optimizer then reacts by increasing the amount of CNG vehicles (from 0.2% in point 3 to 1.6% in point 4) and decentralized boilers (from 4.1% in point 3 to 5.2% in point 4) in order to consume all the bio-SNG produced by the biomass pathway, since we have set the constraint that no natural gas export is allowed. This explains the change on the slopes of the investment curves in Figure 10.
The annual total cost of the energy system (capital and operational cost) is calculated under the assumption that the complete energy system is rebuilt in 2050 with the efficiencies and the specific investment cost of the technologies in 2050. All the information and sources regarding efficiencies and cost can be found in footnote.3 For this analysis, the cost of the private passenger vehicles has been added into the model. The number of cars in Switzerland is assumed to grow linearly with population. As the number of cars per inhabitant has remained almost constant for the last 10 years (0.51 in 2005 vs. 0.53 in 2015), so the expected number of cars in 2050 is 4.79 millions for a 9.04 million inhabitants (0.53 car/inhabitant) (Section Mobil, 2015). Table 9 contains the considered investment cost for the types of cars. The cost taken into account into the model is the difference between the chosen vehicle fleet and 100% gasoline/diesel vehicle fleet.
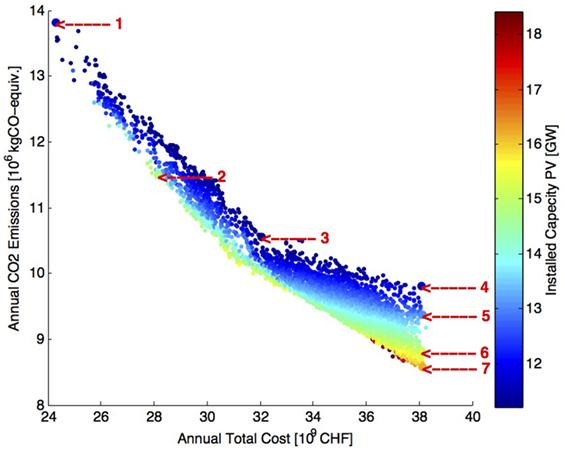
Figure 11 shows the annual equivalent CO2 emissions against the total cost of the energy system. The colors of the points indicate the level of installed PV capacity. The decision variables and output values for the marked points are given in Table 8.
It can be concluded that the vehicle fleet composition has a significant impact on both the CO2 emissions and total cost of the Swiss energy system. F2P3 (point 3 in Figure 11) corresponds to an energy scenario in which the vehicle fleet is only composed by hybrid vehicles (70% plug-in hybrid and 30% hybrid vehicles). The scenarios with lower CO2 emissions than F2P3 have a vehicle fleet with a high percentage of battery electric vehicles. F2P3 is the inflection point where the slope of the graph is modified due to the increasing penetration of battery electric vehicles.
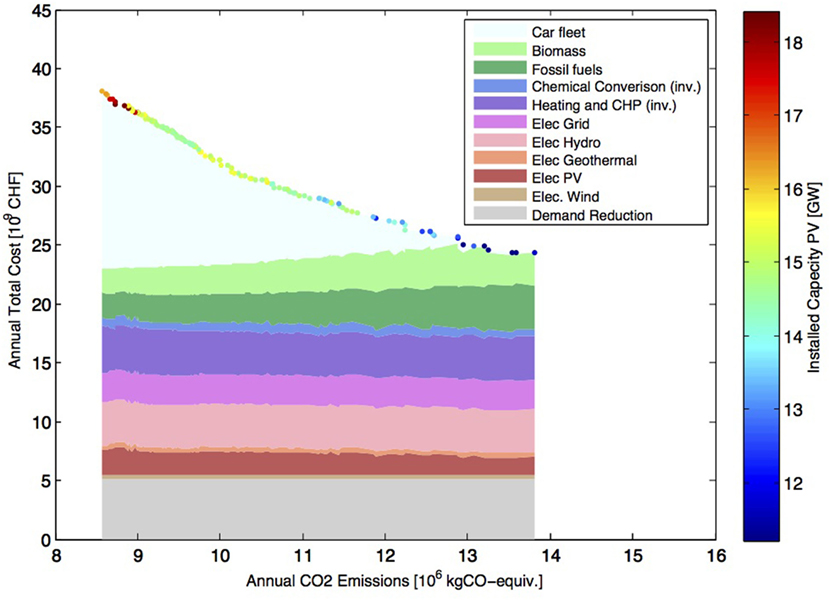
Figure 12 shows the cost composition of the pareto front points of Figure 11. In the pareto front the increase in installed PV panels is linked to an increase in the investment in the vehicle fleet, which corresponds to an increased penetration of plug-in hybrid and battery electric vehicles. The consumption of biofuels and fossil fuels decreases with increasing penetration of PV panels, which reflects the electrification of the vehicle fleet. The other of the cost categories do not show any strong relationship with the installed capacity of PV panels.
The points F2P4–F2P7 (points 4–7 in Figure 11) represent energy scenarios with similar CO2 emissions but different costs. The difference in total cost of the energy system can be explained by the level of deployment of PV. The higher the PV penetration, the lower the total cost of the energy system. The excess electricity from PV is used to produce bio-SNG according to the bio-SNG and electrolysis pathway (see section 2.1.1), which results in lower cost of natural gas imports. Therefore, the deployment of PV panels in this scenario allows to reduce the CO2 emissions and the dependency over imports, while maintaining the total energy system cost constant. This is a conclusion with far reaching implications for energy policy making.
6. Conclusion
This paper evaluates the impact on CO2 emissions and energy system cost of Switzerland of using woody biomass for different energy services: space heating, space heating and electricity, and space heating and mobility. The woody biomass pathways are considered to substitute the same amount of energy service supplied by fossil fuel pathways. Thus, the CO2 abatement potential of the woody biomass is directly proportional to the amount of fossil fuel displaced by the woody biomass. The biomass pathway that offers the highest CO2 saving is the “Bio-SNG and Electrolysis → SOFC, GT, and CCS → Car-Elec,” which displaces CNG cars and a natural gas boilers. A description of this scenario is provided in Figure 7. The CO2 abatement potential is almost 10 times higher in this scenario than the reduction that would be obtained when natural gas boilers are simply substituted by wood boilers.
However, it is shown that the CO2 abatement potential is highly dependent on the biomass and fossil pathways considered. Some woody biomass pathways actually generate more equivalent fossil CO2 per unit of delivered service than their equivalent fossil pathway, when considered on a life cycle basis. For instance, the “Bio-SNG and Electrolysis–Boiler” pathway, which delivers only space heating, generates more CO2 emissions than a fossil pathway composed of heat pumps driven by electricity from CCGT plant with carbon capture and storage (CCS) (Figure 4). Our analysis highlights the importance of considering the entire energy system with the substitution of services generated by fossil pathways. Focusing on the sole conversion efficiency of the biomass pathway may lead to unefficient solutions.
The results also show the potential of the gasification–methanation technology combined with an electrolyzer to store excess renewable electricity into bio-SNG. This pathway enables to entirely cover the natural gas demand of the Switzerland, thus reducing massively its reliance on gas imports. In the best scenario, a reduction of 38% of the Swiss CO2 emissions can be achieved beyond the reduction already planned in the Swiss Energy Strategy 2050 represented by the New Energ Policy (NEP) scenario of the Swiss government, which is itself already very ambitious as it reduces the CO2 emissions by 50% compared to the 1990 baseline. Finally, the penetration of photovoltaics can be increased significantly beyond the scenario of the Swiss Energy Strategy 2050 without impacting on the total cost of the Swiss energy system, while significantly reducing CO2 emissions and reliance on imports.
The conclusions of this study have been reached for the case of Switzerland, but it can be argued that the learnings do would apply to all countries with similar energy systems and biomass availability. These conclusions have far reaching consequences on energy policy making in terms of energy security, energy independence, climate policy, and economics of the energy sector.
Author Contributions
This research presented on the paper was done by VG and EP, under the supervision of FV and FM.
Conflict of Interest Statement
The authors declare that the research was conducted in the absence of any commercial or financial relationships that could be construed as a potential conflict of interest.
Funding
The research work for this paper was in financially supported by the Swiss Competence Center for Energy Research BIOSWEET—Biomass for Swiss Energy Future.
Footnotes
- ^Technology Roadmap – Bioenergy for Heat and Power. Technical Report. Paris: International Energy Agency. Available at: https://www.iea.org/publications/freepublications/publication/2012_Bioenergy_Roadmap_2nd_Edition_WEB.pdf [last accessed 2012].
- ^GoBiGas. Available at: http://gobigas.goteborgenergi.se/English_version/Start [last accessed 2017].
- ^Swiss Energyscope Wiki Pages. Available at: http://stisrvm11.epfl.ch/swiss-energyscope/doku/doku.php?id=start [last accessed 2017].
References
Bauer, C., Heck, T., Dones, R., Mayer-Spohn, O., and Blesl, M. (2008). Final Report on Technical Data, Costs, and Life Cycle Inventories of Advanced Fossil Power Generation Systems. Technical Report.
Bhandari, R., Trudewind, C. A., and Zapp, P. (2014). Life cycle assessment of hydrogen production via electrolysis a review. J. Cleaner Prod. 85, 151–163. doi: 10.1016/j.jclepro.2013.07.048
Caliandro, P., Tock, L., Ensinas, A. V., and Maréchal, F. (2014). Thermo-economic optimization of a solid oxide fuel cell gas turbine system fuelled with gasified lignocellulosic biomass. Energy Convers. Manag. 85, 764–773. doi:10.1016/j.enconman.2014.02.009
Celebi, A. D., Viana Ensinas, A., Peduzzi, E., and Maréchal, F. (2015). Computational platform for optimal design of biorefineries using energy and mass integration. Available at: https://infoscience.epfl.ch/record/211069?ln=en
Codina Gironès, V., Moret, S., Maréchal, F., and Favrat, D. (2015). Strategic energy planning for large-scale energy systems: a modelling framework to aid decision-making. Energy 90(Part 1), 173–186. doi:10.1016/j.energy.2015.06.008
Dimitrova, Z. K. (2015). Environomic Design of Vehicle Integrated Energy Systems. Ph.D. thesis. Available at: http://infoscience.epfl.ch/record/213648/files/EPFL_TH6775.pdf
Emanuela, P. (2015). Biomass To Liquids: Thermo-Economic Analysis and Multi-Objective Optimisation. Ph.D. thesis, EPFL, Lausanne. Available at: http://infoscience.epfl.ch/record/204975
Facchinetti, E., Favrat, D., and Marechal, F. (2011). Innovative hybrid cycle solid oxide fuelcell-inverted gas turbine with CO2 separation. Fuel Cells 11, 565–572. doi:10.1002/fuce.201000130
Gassner, M., Baciocchi, R., Maréchal, F., and Mazzotti, M. (2009). Integrated design of a gas separation system for the upgrade of crude SNG with membranes. Chem. Eng. Process. 48, 1391–1404. doi:10.1016/j.cep.2009.07.002
Gassner, M., and Maréchal, F. (2008). Thermo-economic optimisation of the integration of electrolysis in synthetic natural gas production from wood. Energy 33, 189–198. doi:10.1016/j.energy.2007.09.010
Gassner, M., and Maréchal, F. (2009). Thermo-economic process model for thermochemical production of synthetic natural gas (SNG) from lignocellulosic biomass. Biomass Bioenergy 33, 1587–1604. doi:10.1016/j.biombioe.2009.08.004
Gassner, M., and Maréchal, F. (2012). Thermo-economic optimisation of the polygeneration of synthetic natural gas (SNG), power and heat from lignocellulosic biomass by gasification and methanation. Energy Environ. Sci. 5, 5768–5789. doi:10.1039/C1EE02867G
Gassner, M., Vogel, F., Heyen, G., and Maréchal, F. (2011). Optimal process design for the polygeneration of SNG, power and heat by hydrothermal gasification of waste biomass: thermo-economic process modelling and integration. Energy Environ. Sci. 4, 1726–1741. doi:10.1039/C0EE00629G
Gerber, L., Fazlollahi, S., and Maréchal, F. (2013). A systematic methodology for the environomic design and synthesis of energy systems combining process integration, life cycle assessment and industrial ecology. Comput. Chem. Eng. 59, 2–16. doi:10.1016/j.compchemeng.2013.05.025
Iskov, H., and Rasmussen, N. B. (2013). Global Screening of Projects and Technologies for Power-to-Gas and Bio-SNG. Horsholm: Project Report, Danish Gas Technology Centre.
Kruse, A. (2009). Hydrothermal biomass gasification. J. Supercrit. Fluids 47, 391–399. doi:10.1016/j.supflu.2008.10.009
Martin, E. W., Chester, M. V., and Vergara, S. E. (2015). Attributional and consequential life-cycle assessment in biofuels: a review of recent literature in the context of system boundaries. Curr. Sustain. Renew. Energy Rep. 2, 82–89. doi:10.1007/s40518-015-0034-9
McKechnie, J., Colombo, S., Chen, J., Mabee, W., and MacLean, H. L. (2011). Forest bioenergy or forest carbon? Assessing trade-offs in greenhouse gas mitigation with wood-based fuels. Environ. Sci. Technol. 45, 789–795. doi:10.1021/es1024004
Menten, F., Chze, B., Patouillard, L., and Bouvart, F. (2013). A review of LCA greenhouse gas emissions results for advanced biofuels: the use of meta-regression analysis. Renew. Sustain. Energ. Rev. 26, 108–134. doi:10.1016/j.rser.2013.04.021
Menten, F., Tchung-Ming, S., Lorne, D., and Bouvart, F. (2015). Lessons from the use of a long-term energy model for consequential life cycle assessment: the BTL case. Renew. Sustain. Energ. Rev. 43, 942–960. doi:10.1016/j.rser.2014.11.072
Moret, S., Peduzzi, E., Gerber, L., and Maréchal, F. (2016). Integration of deep geothermal energy and woody biomass conversion pathways in urban systems. Energy Convers. Manag. 129, 305–318. doi:10.1016/j.enconman.2016.09.079
Parra, D., Zhang, X., Bauer, C., and Patel, M. K. (2017). An integrated techno-economic and life cycle environmental assessment of power-to-gas systems. Appl. Energy 193, 440–454. doi:10.1016/j.apenergy.2017.02.063
Peduzzi, E., Boissonnet, G., Haarlemmer, G., Dupont, C., and Maréchal, F. (2014). Torrefaction modelling for lignocellulosic biomass conversion processes. Energy 70, 58–67. doi:10.1016/j.energy.2014.03.086
Peduzzi, E., Tock, L., Boissonnet, G., and Maréchal, F. (2013). Thermo-economic evaluation and optimization of the thermo-chemical conversion of biomass into methanol. Energy 58, 9–16. doi:10.1016/j.energy.2013.05.029
Reijnders, L. (2006). Conditions for the sustainability of biomass based fuel use. Energy Policy 34, 863–876. doi:10.1016/j.enpol.2004.09.001
Schleiss, A. (2012). Talsperrenerhöhungen in der Schweiz: energiewirtschaftliche Bedeutung und Randbedingungen, Lausanne.
Steubing, B., Zah, R., and Ludwig, C. (2012). Heat, electricity, or transportation? The optimal use of residual and waste biomass in Europe from an environmental perspective. Environ. Sci. Technol. 46, 164–171. doi:10.1021/es202154k
Steubing, B., Zah, R., Waeger, P., and Ludwig, C. (2010). Bioenergy in Switzerland: assessing the domestic sustainable biomass potential. Renew. Sustain. Energ. Rev. 14, 2256–2265. doi:10.1016/j.rser.2010.03.036
Sthl, K., and Neergaard, M. (1998). IGCC power plant for biomass utilisation, Vrnamo, Sweden. Biomass Bioenergy 15, 205–211. doi:10.1016/S0961-9534(98)00025-7
Swiss Center for Life Cycle Inventories. (2017). Ecoinvent Database. Available at: http://www.ecoinvent.ch/
Thees, O., Lemm, R., Erni, M., and Ballmer, I. (2014). The potential, opportunities and risks of using energy wood: the role of wood in Switzerland’s energy system. Forum für Wissen 2014, 29–42.
Tock, L. (2013). Thermo-Environomic Optimisation of Fuel Decarbonisation Alternative Processes for Hydrogen and Power Production. Ph.D. thesis, EPFL, Lausanne.
Vuille, F., Favrat, D., and Erkman, S. (2015a). Comprendre la transition énergétique Suisse. Comprendre pour choisir: 100 questions-réponses, 1st Edn. Lausanne: Presses polytechniques et universitaires romandes.
Vuille, F., Favrat, D., and Erkman, S. (2015b). Les enjeux de la transition énergétique suisse. Comprendre pour choisir: 100 questions-réponses, 1st Edn. Lausanne: Presses polytechniques et universitaires romandes.
Waldner, M. H., Krumeich, F., and Vogel, F. (2007). Synthetic natural gas by hydrothermal gasification of biomass: selection procedure towards a stable catalyst and its sodium sulfate tolerance. J. Supercrit. Fluids 43, 91–105. doi:10.1016/j.supflu.2007.04.004
WWF International. (2011). The Energy Report. 100% Renewable Energy by 2050. Technical Report, WWF International. Available at: http://www.ecofys.com/files/files/ecofys-wwf-2011-the-energy-report.pdf
Keywords: energy systems, biomass conversion, power to gas, biomass integration, optimal use of biomass resources
Citation: Codina Gironès V, Peduzzi E, Vuille F and Maréchal F (2018) On the Assessment of the CO2 Mitigation Potential of Woody Biomass. Front. Energy Res. 5:37. doi: 10.3389/fenrg.2017.00037
Received: 16 July 2017; Accepted: 19 December 2017;
Published: 24 January 2018
Edited by:
Uwe Schröder, Technische Universitat Braunschweig, GermanyReviewed by:
Sheikh Adil Edrisi, Banaras Hindu University, IndiaAo Xia, Chongqing University, China
Copyright: © 2018 Codina Gironès, Peduzzi, Vuille and Maréchal. This is an open-access article distributed under the terms of the Creative Commons Attribution License (CC BY). The use, distribution or reproduction in other forums is permitted, provided the original author(s) or licensor are credited and that the original publication in this journal is cited, in accordance with accepted academic practice. No use, distribution or reproduction is permitted which does not comply with these terms.
*Correspondence: Víctor Codina Gironès, victor.codinagirones@epfl.ch
 Víctor Codina Gironès
 Emanuela Peduzzi1
 François Maréchal