Nanometrology of Biomass for Bioenergy: The Role of Atomic Force Microscopy and Spectroscopy in Plant Cell Characterization
 Anne M. Charrier
 Aude L. Lereu
 Rubye H. Farahi
 Brian H. Davison4
  Ali Passian
- 1Aix Marseille Univ, CNRS, CINaM, Marseille, France
- 2Aix Marseille Univ, CNRS, Centrale Marseille, Institut Fresnel, Marseille, France
- 3Quantum Information Science, Computational Sciences and Engineering Division, Oak Ridge National Laboratory, Oak Ridge, TN, United States
- 4BioEnergy Science Center (BESC), Biosciences Division, Oak Ridge National Laboratory, Oak Ridge, TN, United States
- 5Department of Chemical and Biomolecular Engineering, University of Tennessee, Knoxville, TN, United States
- 6Department of Physics, University of Tennessee, Knoxville, TN, United States
Ethanol production using extracted cellulose from plant cell walls (PCW) is a very promising approach to biofuel production. However, efficient throughput has been hindered by the phenomenon of recalcitrance, leading to high costs for the lignocellulosic conversion. To overcome recalcitrance, it is necessary to understand the chemical and structural properties of the plant biological materials, which have evolved to generate the strong and cohesive features observed in plants. Therefore, tools and methods that allow the investigation of how the different molecular components of PCW are organized and distributed and how this impacts the mechanical properties of the plants are needed but challenging due to the molecular and morphological complexity of PCW. Atomic force microscopy (AFM), capitalizing on the interfacial nanomechanical forces, encompasses a suite of measurement modalities for nondestructive material characterization. Here, we present a review focused on the utilization of AFM for imaging and determination of physical properties of plant-based specimens. The presented review encompasses the AFM derived techniques for topography imaging (AM-AFM), mechanical properties (QFM), and surface/subsurface (MSAFM, HPFM) chemical composition imaging. In particular, the motivation and utility of force microscopy of plant cell walls from the early fundamental investigations to achieve a better understanding of the cell wall architecture, to the recent studies for the sake of advancing the biofuel research are discussed. An example of delignification protocol is described and the changes in morphology, chemical composition and mechanical properties and their correlation at the nanometer scale along the process are illustrated.
1. Introduction
An important scientific focus and challenge of the 21st century is to achieve non-food biofuel mass production and thus replace fossil fuels (Lynd et al., 2008; Sannigrahi et al., 2010; Mohapatra et al., 2017). Significant research is being dedicated to ethanol production using extracted cellulose from the plant cell walls (PCW). Due to the complex structure of the PCW, which contain a variety of organic components (cellulose, hemicellulose, lignin, pectin, etc.), and the phenomenon of recalcitrance, cellulose extraction is challenging. Overcoming the chemical and structural properties that have evolved in biomass to form strong and cohesive structures hence requires a deep understanding of how the molecular composition and organization in PCW impacts the mechanical properties of the plants. Indeed, the correlation between the molecular traits of the cell walls and its morphological and mechanical characteristics is ultimately expressed in the plant response. Due to their hierarchical structure, the macroscopic appearance and performance of plants have been shown to be inevitably linked to their structure at the micro- and nanometer scales (Gibson, 2012). However, the nanoscale behavior of many physical quantities, such as elasticity and plasticity, intimately connected with such a correlation, is largely unknown or poorly understood. Fundamentally, this inevitably leads to questioning the relationship between chemistry, structural organization and mechanical properties and how such molecular scale variations in the physical quantities of the cell walls translate into the bulk level and on to the whole organism level. From a practical point of view, this leads to questioning how cell wall chemical composition can be altered to intrinsically modify wood properties (Gindl and Gupta, 2002; Pilate et al., 2002), for example, to better suit various applications. Such complexity and heterogeneity of the plant systems therefore question the relevance of macroscopic and microscopic measurements. Often, these can only give an average description of the properties of the considered object. In recent years, many mechanical studies, primarily addressing the cell and cell wall level of plant body, have enlightened important structure–property and structure–function relationships (Fratzl and Weinkamer, 2007). Such advances in biomechanics have been possible due to the development of new technologies allowing mechanical and chemical analysis of surfaces with submicronic or nanometric lateral resolution (Gindl and Schoberl, 2004; Beecher et al., 2009; Tetard et al., 2011; Burgert and Keplinger, 2013). Such methodologies used to map the various properties of plants at the submicron scale are reported in Table 1.
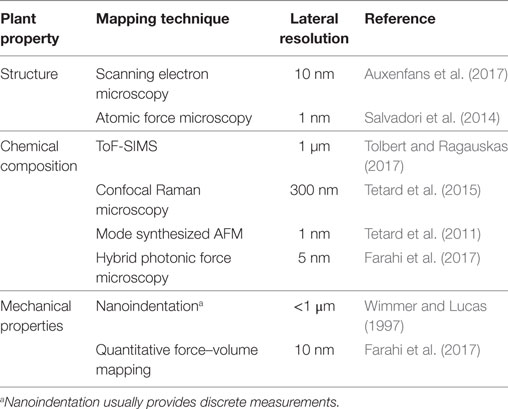
Table 1. Available methodologies for mapping the structure, the chemical composition, and the mechanical properties of plants at the submicron scale.
As an example, the method of nanoindentation has proven to be very useful in providing important mechanical information (Gindl and Gupta, 2002; Zickler et al., 2006). This technique pushes a microscopic indenter with a known shape into a material surface while continuously measuring the response of the tip-sample system: the loading and unloading forces, the penetration depth, and the surface restoration to the indentation. Since forces ranging from tens of nanonewtons to millinewtons with submicrometer lateral resolutions can be precisely applied, the nanoindentation testing cycle can be highly sensitive to the mechanical properties of the material. The extent of the material restoration following the penetration into the surface is a measure of the material’s elasticity, which is generally quantified by the elastic modulus or Young’s modulus (E). Likewise, if any permanent indentation occurs, the material displays plasticity, which is quantified by the plasticity index (PI). The pull-off force when the tip is retreated from the surface is related to the adhesion energy, which are due to attractive van der Waals and electrostatic forces and other attractive forces acting between the tip and sample. In one of the first nanoindentation experiments, Wimmer and Lucas (1997) explored the relationship between hardness and Young’s moduli for the secondary cell wall and cell corner middle lamella in spruce wood. They reported that the mechanical properties of secondary walls along their longitudinal direction is correlated with the presence of organized unidirectional cellulosic fibrils (Wimmer et al., 1997) while the reduced elastic modulus in the lignin-rich middle lamella was associated with the absence of cellulose in the region (Wimmer and Lucas, 1997). It was also demonstrated that the elastic modulus in the secondary walls decreased with microfibril angle therefore showing the importance of molecular organization (Gindl et al., 2004). These studies were the first to demonstrate the relationship between chemical composition, molecular organization and mechanical properties. However, in addition to requiring sample processing (polishing) and embedding into a polymeric material to avoid distortion of the measurements due to surface roughness (Konnerth et al., 2008; Burgert and Keplinger, 2013; Wagner et al., 2014; Youssefian et al., 2017), nanoindentation is ultimately limited by the resolution of the apparatus. Furthermore, the measurements are discrete, and do not allow mapping of mechanical properties.
More recently, atomic force microscopy (AFM) and its derivative techniques have emerged as the method of choice to resolve cell wood properties at the nanometer scale. The first force measurements with AFM also invoked a nanoindenter, but with an improved lateral resolution down to a few nanometers (Kirby, 2011; Fernandes et al., 2012). More recently, quantitative force–volume mapping (QFM) was adapted to plant cell wall measurements utilizing continuous force curve recording and therefore solving the problem of heterogeneity observation by imaging the topography with the associated E and PI mappings. Studies on Arabidopsis thaliana reported different characteristic modes of deformation and a spatial distribution of the elastic moduli across the surface (Yakubov et al., 2016), while Radotic et al. (2012) showed the changes in stiffness of the cell walls at different phases of growth. In addition, new innovative AFM techniques such as mode synthesized AFM (MSAFM) (Tetard et al., 2010, 2011) and hybrid photonic force microscopy (HPFM) (Tetard et al., 2015) have been developed. The MSAFM was utilized to obtain the subsurface nanomorphological properties of wood cell walls with structural changes along the delignification process of poplar (Tetard et al., 2010, 2011), while the HPFM correlated the structural changes with chemical composition (Tetard et al., 2015).
This manuscript aims at demonstrating the input of nanometrology using AFM in understanding how the molecular distribution and organization impacts the mechanical strength and cohesion of PCW to better develop cellulose extraction protocols through delignification. Therein, the different applications of AFM modes for plant cell characterization are reviewed within the context of biofuel research. In Section 2, an example of chemical protocol leading to delignification starting from a cryotomed young poplar is described. In Section 3, the operating principle of AM-AFM, QFM, MSAFM/HPFM modes are described and their use to extract structural, mechanical, and chemical information through the process of delignification is illustrated through examples.
2. Delignification Processes
The extraction of cellulose, while abundant in the secondary plant cell walls, is particularly hindered by the presence of lignin. Lignin is a complex organic polymer widely recognized for playing a role in the structural integrity of plants. As a compound, it is mostly inert and nonreactive, and thus makes a good material candidate for manufacturing and industrial applications (e.g., see lignin-based carbon fibers and nanofibers; Fang et al., 2017). Lignin removal has been a central key issue where a whole variety of complex processes, also referred to as delignification processes, have been developed (Singh et al., 2014). Controlling this process requires the understanding of the relationship between the chemical composition, the structural aspect, the biological infrastructure, and the mechanical properties of the PCW. The many delignification strategies have been based on various approaches (Singh et al., 2014) such as (1) physical treatments including mechanical (Cadoche and Lopez, 1989), pyrolysis (Chen et al., 2016), and steam processes (Tian et al., 2017), (2) chemical using organosolv (Erdocia et al., 2014), acid and alkaline hydrolysis (Singh et al., 2015; Carlos Martinez-Patino et al., 2017), or saccharification and fermentation (Healey et al., 2015), and (3) biological (Asina et al., 2016) and enzymatic (Al-Zuhair et al., 2015; Tian et al., 2017) treatments. To illustrate the complexity of delignification, an example based on a multistep chemical protocol, is given in Figure 1, resulting in a set of samples to be investigated using AFM techniques (Farahi et al., 2017).
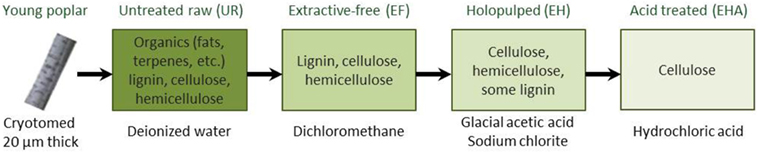
Figure 1. Chemical steps for delignification process starting from a cryotomed young poplar. AFM studies are carried out at each step of the process, i.e., on untreated raw (UR), extractive-free (EF), holopulped (EH), and acid-treated (EHA) samples (adapted from Farahi et al. (2017)).
The chemical processing of the biomass, here in the form of cross-sections (left image of Figure 1), was intended to remove lignin and other compounds to facilitate a more efficient extraction of the cellulose. The samples were received, frozen, and sectioned into 20 µm thick sections with a cryotome using a disposable blade that allowed minimal structural damage. For the untreated samples, the cross-section were washed with deionized (DI) water and dried between glass slides, referred as the untreated raw biomass or fresh Populus (UR). Next the extractive-free (EF) Populus were prepared by removing extractives (inorganics: K, Ca, Mg, P, F, Na, Si, S, Mn, etc. and organics: terpenes, fats, waxes, flavanoids, tannins, stilbenes, etc.) by refluxing with dichloromethane and then dried between glass slides to preserve the morphology of the sample and avoid contaminations. The removal of extractives allowed for the cellulose and lignin to be detected with less contamination on the surface when using ToF-SIMS, Raman, AFM, and other characterization methods (Farahi et al., 2017). The EF sample is then subject to glacial acetic acid combined with sodium chlorite resulting in the extractive free holopulped (EH) sample with most of the lignin removed. Finally, hydrochloric acid treatment is imposed on the EH sample to keep only the cellulose by removing hemicellulose and residuals of lignin (EHA sample). See details of the protocols in Farahi et al. (2017). The presented delignification process results in sets of four samples to be investigated.
3. Delignification Investigation by Atomic Force Microscopy
3.1. Amplitude Modulation AFM (AM-AFM): Structural Properties
AFM is based on measuring the interaction between a sharp tip (radius of curvature of a few nanometers), mounted on a cantilever spring (0.01 N/m < k < 150 N/m), and a surface; when the tip is raster-scanned across the surface, a high spatial resolution topographical image may be obtained (Binnig et al., 1986). As the tip comes near the surface, interaction forces induce a bending of the cantilever, which for small amplitudes follows Hooke’s law. Depending on the environment, the tip/sample distance and the mode of utilization, the forces associated with AFM include van der Waals, electrostatic, magnetic, capillary, contact mechanical forces, chemical bonding, etc. Forces as small as few tens of piconewton have been measured. AFM offers the possibility of imaging the surface of any material (hard, soft, insulators, heterogeneous) in a variety of environments (solution, air, vacuum, or gas). Among the basic modalities of AFM, amplitude-modulation atomic force microscopy (AM-AFM) (Martin et al., 1987; Zhong et al., 1993; Garcia and Perez, 2002; Garcia et al., 2007), also called tapping mode, has provided large improvements to soft materials imaging in general due to its non-invasive and non-destructive operation, and molecular resolution. Lateral resolution is mostly determined by the tip radius of curvature while subnanometric vertical resolution is provided by the piezoelectric modulus and feedback regulation used to control vertical displacements. In AM-AFM, the cantilever is mechanically excited near or at its intrinsic resonant frequency (typically in the range from a few tens to a few hundreds of kHz) with a given amplitude. When the tip is brought to within a few nanometers above the surface, the tip-sample interaction changes the resonance frequency of the cantilever and leads to a decrease of its oscillation amplitude whether the forces involved are attractive or repulsive. To measure the force intensity and its nature (attractive or repulsive), a laser beam (in most systems) is generally positioned at the apex of the cantilever and reflected to a position-sensing photodiode. The bending of the cantilever induces a deflection of the laser resulting in a displacement of the reflected beam on the photodiode. The new position is then used to apply a retroactive feedback to maintain the amplitude of oscillations (referred as a setpoint) of the cantilever.
AM-AFM has been successful in characterizing biomass (Kirby et al., 1996; Salvadori et al., 2014; Farahi et al., 2017) and in particular the architecture of plant cell walls at the molecular level which in turn is essential in improving lignocellulosic feedstock properties (Zhang et al., 2013b, 2017; Keplinger et al., 2014; Torode et al., 2018). AM-AFM mapping of cellulose topography revealed the right-handed twisted nature of microfibrils and the periodic distribution of glucose and fiber unit along the microfibrils (Hanley et al., 1997). Near-atomic resolution of the cellulose structure was reached, revealing the triclinic structure of Iα crystal phase (Baker et al., 2000). AM-AFM has also been useful in measuring surface morphology and roughness changes after treatment (Medeiros et al., 2007; Zhang et al., 2013a; Nanda et al., 2015).
In Figures 2A–D, the structural changes (morphology and wall thickness) undergone by the PCW were revealed at each chemical step of the delignification process detailed above. The sharper and well-contrasted PCW appearance after exposure to dichloromethane (EF image of Figure 2B) could be explained by the removal of organics, leaving the sample surface cleaned (Farahi et al., 2017). The UR and EF samples appeared very similar with well-defined PCW preserving the cell structure and having an average thickness of 3 µm. However, the structures of EH and EHA samples underwent considerable changes with an average PCW thickness around 2 µm. With the lignin content removed in EHA, the PCW started to collapse and the overall cell sizes became smaller and compressed. The decrease in the average thickness of PCW (Figure 2E, gray) along the process was in agreement with the lignin removal.
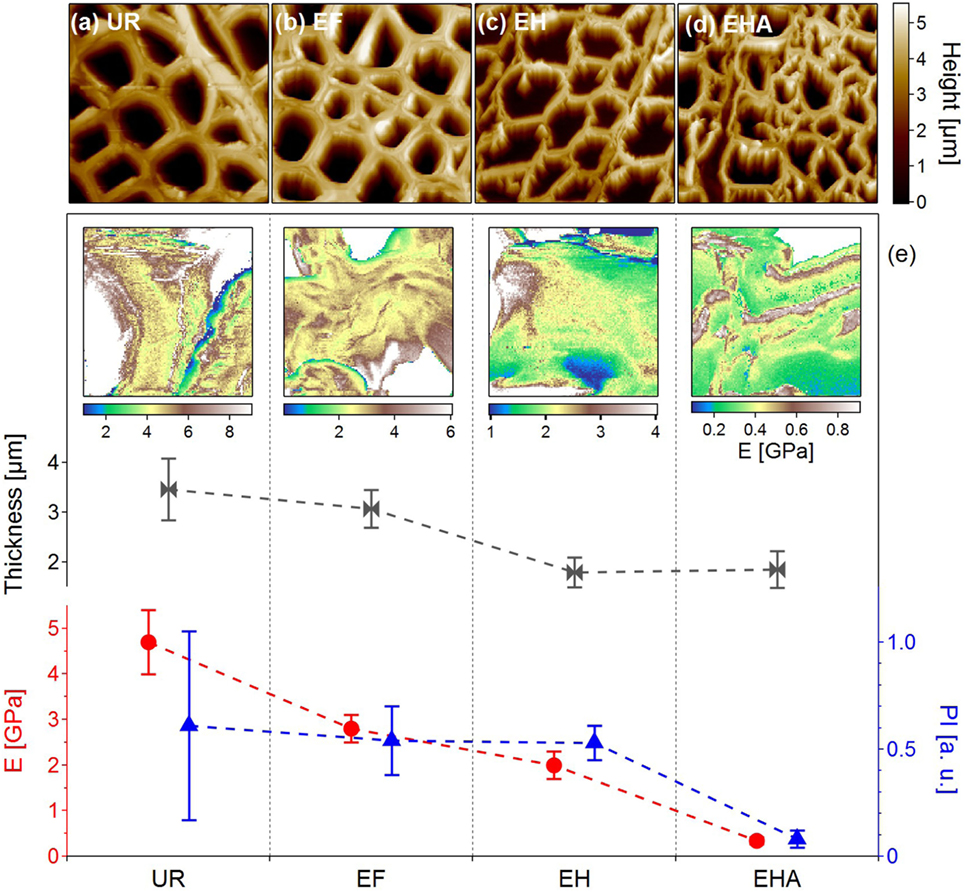
Figure 2. Examination of poplar samples through the delignification process steps. (A–D) AM-AFM topographic images of untreated raw (UR), extractive-free (EF), holopulped (EH) and acid-treated (EHA) samples showing the structural changes along the delignification process (image size 50 × 50 µm2). The average PCW thicknesses extracted from the topographic images are plotted in (E) (gray curve). (e) Images: Young’s modulus (GPa) mappings for each type of samples extracted from quantitative force–volume mappings. Image size is 5 µm × 5 µm. The corresponding average Young’s moduli values (E) are reported in red. Blue triangles: Average values of the plasticity index (PI) extracted from the quantitative force–volume mapping. Data from Farahi et al. (2017), revisited.
3.2. Quantitative Force–Volume Mapping (QFM): Mechanical Properties
Force measurements using AFM (Zdunek and Kurenda, 2013) and derivative technologies such as quantitative force–volume mapping (QFM) (Radmacher et al., 1996) and peak-force (Adamcik et al., 2011) allow nanomechanical mapping with nanometer scale lateral resolution, and measurements of forces down to few piconewtons. These techniques are currently used for mechanical characterization in cell biology (living cells) and structural biology, including testing of cartilage (Heu et al., 2012), bones (Spitzner et al., 2015), soft tissues (Burgert and Keplinger, 2013), and wood (Farahi et al., 2017). Similar to nanoindentation, the main principle of force measurements is to calculate hardness and elastic modulus from a load–displacement curve recorded during a local indentation (Figures 3B,D–F).
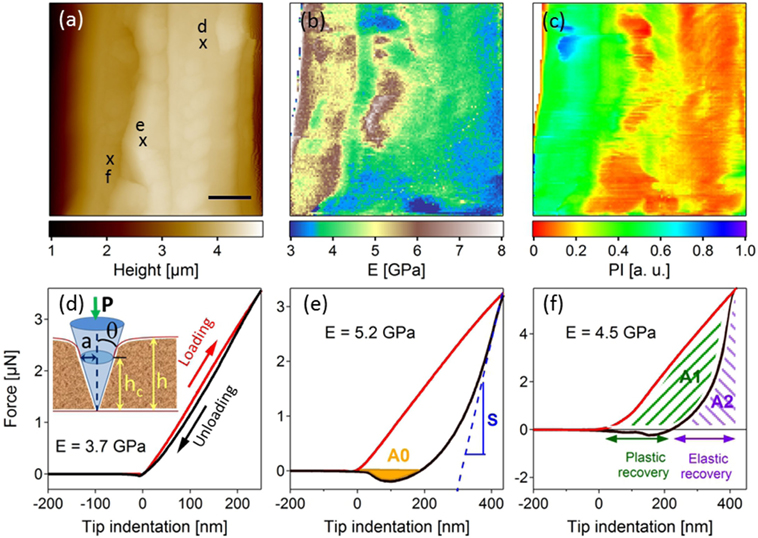
Figure 3. Topographic (A) and associated mechanical imaging (B,C) (Young’s modulus (E) and plastic index (PI) mappings) (scale bar 1 µm) obtained on an untreated raw poplar cell wall. (D–F) Discrete force curves extracted at the marked localizations on the topographic image (A). Red and black curves correspond to the loading and unloading during tip indentation [inset (D)], respectively. (D) gives an illustration of elastic behavior and (E) of plasticity with adhesion (A0). S, the slope obtained by fitting the beginning of the unloading curve, is used to calculate the Young’s modulus. A1 and A2 in (F) are two parameters used to access the plasticity index. Data from Farahi et al. (2017), revisited.
In a single force curve, a local force measurement is realized at a given position, corresponding to one pixel of the image, by only recording the corresponding loading and unloading curves. In quantitative force–volume mapping (Radmacher, 1997), single force curves are measured at points on a 2D grid. Tip-sample force is controlled by discrete force triggering at each point. Peak-force is an advanced version of QFM in which the force curves are acquired simultaneously with the topography mapping (Adamcik et al., 2011; Durkovic et al., 2014).
During an indentation measurement, laser deflection versus vertical (z) displacement is recorded continuously. In order to extract useful quantities, the data are converted into force versus tip/sample distance curves. The cantilever is approximated as a linear elastic spring and its bending, D(z), is related to the applied loading force of the indentation, P, and k the spring constant of the cantilever according to Hooke’s law, P = −kD(z).
Nanomechanical information extracted from analysis of force curve measurements include elastic and dissipative components. Young’s modulus, E, can be calculated from the slope of the unloading curve (Pharr et al., 1992) (Figure 3E) using a suitable model, which depends on the tip shape and dimensions (Bulichev and Alekhin, 1987), sample dimensions (flat, spherical) and whether or not dissipative components such as plastic deformation, adhesion, or viscosity are present (Johnson et al., 1971; Derjaguin et al., 1975; Butt et al., 2005). Dissipative components such as plastic deformation and adhesion hysteresis are included in the force measured in quasi-static equilibrium and can be extracted from a force–distance curve. Determination of non-conservative or velocity-dependent components requires dynamic force measurements (Herruzo et al., 2014).
In addition to the Young’s modulus, a plasticity index (PI), including plasticity and viscosity components, can be extracted. From each indentation curve, the area comprised between the loading and the unloading curves above the zero force line, A1, is a measure of the energy needed for the deformation and dissipated into the sample, whereas the sum A1 + A2 is the maximal energy that could be stored in the sample during the indentation (Butt et al., 2005), with A2 being the area below the unloading curve (see Figure 3F). The plasticity index can then be defined as PI = A1/(A1 + A2) and can be used to discriminate components with different viscoplasticity. If PI = 1, the material is fully viscoplastic. If PI = 0, it indicates a perfectly elastic behavior. Finally, adhesion energy can also be extracted for the unloading curve as illustrated in Figure 3E, where the A0 area shows the presence of adhesion between the surface and the AFM probe.
Examples of E (Figure 3B) and PI (Figure 3C) mappings extracted from an untreated raw poplar sample were correlated with the topography image in Figure 3A (Farahi et al., 2017). The E mapping showed strong Young’s modulus heterogeneity. Force curves shown in Figures 3D–F are discrete curves measured at the marked points in Figure 3A. They were chosen at three regions of the sample to illustrate different mechanical behaviors. In Figure 2D, the loading and unloading curves were superimposed showing a perfectly elastic behavior. In Figures 3E,F, the unloading curve is below the loading curve, translating into viscoplastic properties. In addition, adhesion between the tip and the surface during unloading (orange region) was observed in Figure 3E. The PI values in the mapping of Figure 3C varied between 0 and 1, therefore indicating regions with strong elastic or viscoplastic behaviors.
Quantitative force–volume mapping has been used to study the nanomechanical properties of plant cell walls at every step of the delignification process (Peaucelle, 2014; Farahi et al., 2017). As illustrated in Figure 2, the Young’s moduli varied toward lower values as the lignin was removed with a decrease from 4.7 ± 0.7 GPa for UR to 0.34 ± 0.07 GPa for EHA therefore suggesting total removal of the hemicellulose and lignin from the sample. Interestingly, the average values of PI (blue curve in Figure 2E) evolving around 0.5 for the UR, EF, and EH samples, revealed an important difference after acid treatment (EHA) showing a nearly perfect elastic behavior which did not seem to be directly related to delignification but mainly to the removal of hemicellulose.
3.3. Mode Synthesizing Atomic Force Microscopy (MSAFM) and Hybrid Photonic Force Microscopy (HPFM): Chemical Composition
Chemical composition is another sought-after parameter when investigating plant cell walls or biological samples. Simultaneous mechanical and chemical mapping have been obtained using mode synthesizing atomic force microscopy (MSAFM) (Tetard et al., 2008, 2010, 2011) and the additional spectroscopic capabilities of hybrid photonic nanomechanical force microscopy (HPFM) (Tetard et al., 2015; Farahi et al., 2017). Capitalizing on the nonlinear probe-sample forces, microscopy with MSAFM offers a way to image soft samples and probe nanostructures that are below their surfaces (subsurface imaging). Briefly, in MSAFM multiple mechanical excitations (e.g., with megahertz frequencies) introduce small mechanical actuations within the sample and the probe, resulting in a coupled probe-sample dynamics. This intended coupled dynamics assumes that the system possesses suitable mechanical dispersion and supports a propagation mode in the megahertz spectrum. In a typical example such as considered here, two forcings, that is, driving forces with frequencies ω1 and ω2, respectively, are delivered to the probe via piezoelectric elements driven by waveform generators (Farahi et al., 2017). In both MSAFM and HPFM, the specific type of driving of the sample and the probe is selected based upon the specific application and the need for accessing subsurface, topographical, or chemical information. In general, both the probe and sample can be driven (Tetard et al., 2008) via any number and combination of waveform. In either case, the probe-sample interaction via the van der Waals force allows for synthesis of new oscillation modes in the system. For the case considered, two modes in the first order coupling are generated: a sum frequency of ω+ = ω1 + ω2 and a difference frequency of ω− = |ω1 − ω2|. The response signal at ω− is of greater interest since it can be set in the kHz range and be readily monitored with phase-locked loop techniques. In general, from the effect of various interactions (elastic, dissipative, etc.), a measurement of the amplitude and phase properties of the probe at the difference frequency, ω− (or other selected frequencies), high-resolution subsurface images formed by the contrast due to the variations in elasticity, mechanical losses, etc., of the surface and subsurface material domains are constructed. Thus, the contrast measured from the dynamics of the probe can be used to obtain morphological and chemical distinctions in the examined materials. To achieve specific compositional information, HPFM introduces amplitude modulated infrared light with a wavelength λ to the sample at the difference frequency, creating yet another mechanical actuation based on the photothermal absorption of the sample. Mid-IR quantum cascade lasers (QCL) are useful excitation sources since they can be modulated and set at a wavelength to maximize composition-dependent absorption. The induced photothermal effect is exploited, where the absorption of light decays into heat, which in turn is conducted away as it dissipates. The resulting thermal expansion and relaxation is the source of a third mechanical actuation by photonic excitation at ωQCL → ω–, which is associated with the absorption properties of the sample.
HPFM and MSAFM were used in conjunction with confocal Raman microscopy to characterize the distribution of chemical species at the nanoscale on poplar cross-sections (Tetard et al., 2015). Confocal Raman microscopy was first performed over the cell wall to spatially identify the cellulose-rich and lignin-rich regions (Figure 4A). Simultaneous AFM (Figure 4B), MSAFM (Figure 4C), and HPFM (Figure 4D) were then carried out over the same region. With the MSAFM image, new detail was found in the lignin-rich region compared to the AFM image, such as the structures within the dashed circled regions. The MSAFM signal was also able to detect substructures in the cellulose-rich region. The cellular ultrastructure was further revealed with HPFM with the addition of modulated infrared light at λ = 10,200 nm at ωQCL → ω− = 26 kHz. Cellulose and lignin both absorb light at λ = 10,200 nm, but at different absorption intensities, resulting in contrasted signal (Figure 4D). The surface and subsurface structures disclosed remarkable detail, especially in the cellulose-rich region and the small grain-like structures outlined in black were interpreted to be cellulosic microfibril aggregates (globules), which are known to be located in the secondary cell wall (Salmén, 2004). MSAFM was also used to study the effect of holopulping treatment on holocellulose poplar sections. It was reported that the holopulping process, intended to oxidatively remove the lignin network in the cell, appeared to affect mostly the middle lamella as well as the cell corner regions (Tetard et al., 2011).
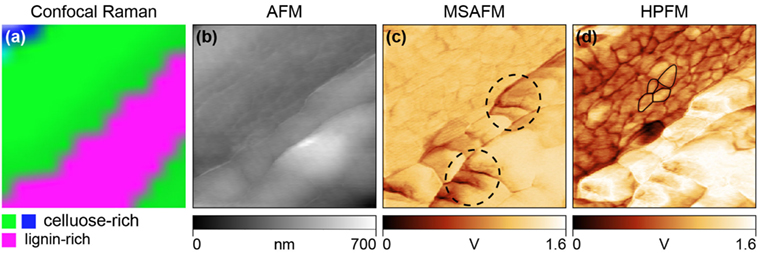
Figure 4. Demonstration of HPFM compared to confocal Raman, AFM, and MSAFM on EF (extractive-free) poplar cell wall. (A) Confocal Raman image showing lignin-rich (pink) and cellulose-rich (blue, green) regions. (B) Simultaneous AFM image showing only topography. (C) MSAFM image at difference frequency, ω− = 26 kHz, brings additional clarity to the lignin structures indicated by the dashed circled regions. (D) HPFM image at photonic actuation, ωQCL → ω_ = 26 kHz, reveals additional detail of the near-surface cellulosic globules shown outlined. Adapted from Tetard et al. (2015).
4. Conclusion
From the review of the reported case studies, we conclude that the AFM based measurement science and technology for exploring, manipulating, understanding, and relating the different properties of plant cell walls constitutes an emerging area of research within the plant biological material characterization. Given the current state of the understanding of the plant cells, there is a tremendous need for innovative approaches to microscopy and spectroscopy that can aid, for example, the development of efficient protocols for polysaccharides extraction in plants and further bioethanol production. From the considered studies to date, it is not difficult to form the opinion that understanding how the different molecular components of the plant cell walls are intermingled and distributed and how these impacts the mechanical properties of the plants will help in developing optimized process for overcoming recalcitrance. Indeed, the AFM techniques, being nondestructive and amenable to operation under ambient conditions with specimens in their native states, provide a unique opportunity to relate the chemistry (HPFM) to the structure (AFM and MSAFM) and the mechanical properties (QFM and Peak-force) of the same regions at the nanometric scale. Understanding how cell wall chemical composition can be altered to intrinsically modify wood properties is also a highly promising issue; for example to increase the proportion of cellulose in plant cell walls, to reduce the lignin content, or to make delignification an easier process by reducing the elastic modulus of the plant cell walls. With the results reported thus far on plant cell imaging with a resolution of ~5 nm, and on cell wall Young’s modulus and plastic index with typical values in the ranges 0.3–5 GPa and 0–0.5, respectively, quantitative biomass characterization is only at its debut. Considering the potential of the emerging AFM-based configurations of MSAFM and HPFM for high-resolution physical and chemical studies of the subsurface domains of the plant cells, we envision that novel and targeted studies based on innovative AFM modalities will continue to play an important role in establishing the basic characteristics of the plant cells as well as contribute to streamlining of biofuel production.
Author Contributions
All authors contributed to the manuscript.
Conflict of Interest Statement
The authors declare that the research was conducted in the absence of any commercial or financial relationships that could be construed as a potential conflict of interest.
The reviewer, MR, and handling editor declared their shared affiliation.
Acknowledgments
We would like to thank David Graham at ORNL for reviewing the manuscript. This work was sponsored by the BioEnergy Science Center (BESC) of the Oak Ridge National Laboratory (ORNL). The BESC is a US Department of Energy (DOE) Bioenergy Research Center supported by the Office of Biological and Environmental Research in the DOE Office of Science. ORNL is managed by UT-Battelle, LLC, for the US DOE under contract DE-AC05-00OR22725.
References
Adamcik, J., Berquand, A., and Mezzenga, R. (2011). Single-step direct measurement of amyloid fibrils stiffness by peak force quantitative nanomechanical atomic force microscopy. Appl. Phys. Lett. 98, 193701. doi: 10.1063/1.3589369
Al-Zuhair, S., Abualreesh, M., Ahmed, K., and Razak, A. A. (2015). Enzymatic delignification of biomass for enhanced fermentable sugars production. Energy Technol. 3, 121–127. doi:10.1002/ente.201402138
Asina, F., Brzonova, I., Voeller, K., Kozliak, E., Kubatova, A., Yao, B., et al. (2016). Biodegradation of lignin by fungi, bacteria and laccases. Bioresour. Technol. 220, 414–424. doi:10.1016/j.biortech.2016.08.016
Auxenfans, T., Cronier, D., Chabbert, B., and Paes, G. (2017). Understanding the structural and chemical changes of plant biomass following steam explosion pretreatment. Biotechnol. Biofuels 10, 36. doi:10.1186/s13068-017-0718-z
Baker, A., Helbert, W., Sugiyama, J., and Miles, M. (2000). New insight into cellulose structure by atomic force microscopy shows the i-alpha crystal phase at near-atomic resolution. Biophys. J. 79, 1139–1145. doi:10.1016/S0006-3495(00)76367-3
Beecher, J. F., Hunt, C. G., and Zhu, J. Y. (2009). “Tools for the Characterization of Biomass at the Nanometer Scale,” in The Nanoscience and Technology of Renewable Biomaterials, eds L. A. Lucia, and O. J. Rojas (Wiley-Blackwell), 61–90.
Binnig, G., Quate, C. F., and Gerber, C. (1986). Atomic force microscope. Phys. Rev. Lett. 56, 930–933. doi:10.1103/PhysRevLett.56.930
Bulichev, S., and Alekhin, V. (1987). Method of kinetic hardness and microhardness in testing impression by an indentor. Ind. Lab. 53, 1091–1096.
Burgert, I., and Keplinger, T. (2013). Plant micro- and nanomechanics: experimental techniques for plant cell-wall analysis. J. Exp. Bot. 64, 4635–4649. doi:10.1093/jxb/ert255
Butt, H., Cappella, B., and Kappl, M. (2005). Force measurements with the atomic force microscope: technique, interpretation and applications. Surf. Sci. Rep. 59, 1–152. doi:10.1016/j.surfrep.2005.08.003
Cadoche, L., and Lopez, G. (1989). Assessment of size-reduction as a preliminary step in the production of ethanol from lignocellulosic wastes. Biol. Wastes 30, 153–157. doi:10.1016/0269-7483(89)90069-4
Carlos Martinez-Patino, J., Ruiz, E., Romero, I., Cara, C., Carlos Lopez-Linares, J., and Castro, E. (2017). Combined acid/alkaline-peroxide pretreatment of olive tree biomass for bioethanol production. Bioresour. Technol. 239, 326–335. doi:10.1016/j.biortech.2017.04.102
Chen, X., Li, H., Sun, S., Cao, X., and Sun, R. (2016). Effect of hydrothermal pretreatment on the structural changes of alkaline ethanol lignin from wheat straw. Sci. Rep. 6, 39354. doi:10.1038/srep39354
Derjaguin, B., Muller, V., and Toporov, Y. (1975). Effect of contact deformations on adhesion of particles. J. Colloid Interface Sci. 53, 314–326. doi:10.1016/0021-9797(75)90018-1
Durkovic, J., Kardosova, M., and Lagana, R. (2014). Imaging and measurement of nanomechanical properties within primary xylem cell walls of broadleaves. Bio-protocol 4, 1360. doi:10.21769/BioProtoc.1360
Erdocia, X., Prado, R., Angeles Corcuera, M., and Labidi, J. (2014). Effect of different organosolv treatments on the structure and properties of olive tree pruning lignin. J. Ind. Eng. Chem. 20, 1103–1108. doi:10.1016/j.jiec.2013.06.048
Fang, W., Yang, S., Wang, X.-L., Yuan, T.-Q., and Sun, R.-C. (2017). Manufacture and application of lignin-based carbon fibers (LCFs) and lignin-based carbon nanofibers (LCNFs). Green Chem. 19, 1794–1827. doi:10.1039/C6GC03206K
Farahi, R., Charrier, A., Tolbert, A., Lereu, A., Ragauskas, A., Davison, B., et al. (2017). Plasticity, elasticity, and adhesion energy of plant cell walls: nanometrology of lignin loss using atomic force microscopy. Sci. Rep. 7, 152. doi:10.1038/s41598-017-00234-4
Fernandes, A. N., Chen, X., Scotchford, C. A., Walker, J., Wells, D. M., Roberts, C. J., et al. (2012). Mechanical properties of epidermal cells of whole living roots of Arabidopsis thaliana: an atomic force microscopy study. Phys. Rev. E Stat. Nonlin. Soft. Matter. Phys. 85, 1. doi:10.1103/PhysRevE.85.021916
Fratzl, P., and Weinkamer, R. (2007). Nature’s hierarchical materials. Prog. Mater. Sci. 52, 1263–1334. doi:10.1016/j.pmatsci.2007.06.001
Garcia, R., Magerle, R., and Perez, R. (2007). Nanoscale compositional mapping with gentle forces. Nat. Mater. 6, 405–411. doi:10.1038/nmat1925
Garcia, R., and Perez, R. (2002). Dynamic atomic force microscopy methods. Surf. Sci. Rep. 47, 197–301. doi:10.1016/S0167-5729(02)00077-8
Gibson, L. J. (2012). The hierarchical structure and mechanics of plant materials. J. R. Soc. Interface 9, 2749–2766. doi:10.1098/rsif.2012.0341
Gindl, W., and Gupta, H. (2002). Cell-wall hardness and young’s modulus of melamine-modified spruce wood by nano-indentation. Compos. Part A Appl. Sci. Manuf. 33, 1141–1145. doi:10.1016/S1359-835X(02)00080-5
Gindl, W., Gupta, H., Schoberl, T., Lichtenegger, H., and Fratzl, P. (2004). Mechanical properties of spruce wood cell walls by nanoindentation. Appl. Phys. A Mater. Sci. Process. 79, 2069–2073. doi:10.1007/s00339-004-2864-y
Gindl, W., and Schoberl, T. (2004). The significance of the elastic modulus of wood cell walls obtained from nanoindentation measurements. Compos. Part A Appl. Sci. Manuf. 35, 1345–1349. doi:10.1016/j.compositesa.2004.04.002
Hanley, S., Revol, J., Godbout, L., and Gray, D. (1997). Atomic force microscopy and transmission electron microscopy of cellulose from Micrasterias denticulata; evidence for a chiral helical microfibril twist. Cellulose 4, 209–220. doi:10.1023/A:1018483722417
Healey, A. L., Lee, D. J., Furtado, A., Simmons, B. A., and Henry, R. J. (2015). Efficient eucalypt cell wall deconstruction and conversion for sustainable lignocellulosic biofuels. Front. Bioeng. Biotechnol. 3:190. doi:10.3389/fbioe.2015.00190
Herruzo, E. T., Perrino, A. P., and Garcia, R. (2014). Fast nanomechanical spectroscopy of soft matter. Nat. Commun. 5, 3126. doi:10.1038/ncomms4126
Heu, C., Berquand, A., Elie-Caille, C., and Nicod, L. (2012). Glyphosate-induced stiffening of hacat keratinocytes, a peak force tapping study on living cells. J. Struct. Biol. 178, 1–7. doi:10.1016/j.jsb.2012.02.007
Johnson, K., Kendall, K., and Roberts, A. (1971). Surface energy and contact of elastic solids. Proc. R. Soc. Lond. Ser. A Math. Phys. Sci. 324, 301. doi:10.1098/rspa.1971.0141
Keplinger, T., Konnerth, J., Aguie-Beghin, V., Rueggeberg, M., Gierlinger, N., and Burgert, I. (2014). A zoom into the nanoscale texture of secondary cell walls. Plant Methods 10, 1. doi:10.1186/1746-4811-10-1
Kirby, A. R. (2011). Atomic force microscopy of plant cell walls. Methods Mol Biol 715, 169–178. doi:10.1007/978-1-61779-008-9_12
Kirby, A., Gunning, A., Waldron, K., Morris, V., and Ng, A. (1996). Visualization of plant cell walls by atomic force microscopy. Biophys J 70, 1138–1143. doi:10.1016/S0006-3495(96)79708-4
Konnerth, J., Harper, D., Lee, S.-H., Rials, T. G., and Gindl, W. (2008). Adhesive penetration of wood cell walls investigated by scanning thermal microscopy (SThM). Holzforschung 62, 91–98. doi:10.1515/HF.2008.014
Lynd, L. R., Laser, M. S., Bransby, D., Dale, B. E., Davison, B., Hamilton, R., et al. (2008). How biotech can transform biofuels. Nat. Biotechnol. 26, 169–172. doi:10.1038/nbt0208-169
Martin, Y., Williams, C., and Wickramasinghe, H. (1987). Atomic force microscope force mapping and profiling on a sub 100-a scale. J. Appl. Phys. 61, 4723–4729. doi:10.1063/1.338807
Medeiros, R. G., Silva, L. P., Azevedo, R. B., Silva, F. G. Jr., Ximenes, F., and Filho, E. (2007). The use of atomic force microscopy as a tool to study the effect of a xylanase from Humicola grisea var. thermoidea in kraft pulp bleaching. Enzyme Microb. Technol. 40, 723–731. doi:10.1016/j.enzmictec.2006.06.004
Mohapatra, S., Mishra, C., Behera, S. S., and Thatoi, H. (2017). Application of pretreatment, fermentation and molecular techniques for enhancing bioethanol production from grass biomass – a review. Renew. Sustain. Energ. Rev. 78, 1007–1032. doi:10.1016/j.rser.2017.05.026
Nanda, S., Maley, J., Kozinski, J. A., and Dalai, A. K. (2015). Physico-chemical evolution in lignocellulosic feedstocks during hydrothermal pretreatment and delignification. J. Biobased Mater. bioenergy 9, 295–308. doi:10.1166/jbmb.2015.1529
Peaucelle, A. (2014). Afm-based mapping of the elastic properties of cell walls: at tissue, cellular, and subcellular resolutions. J Vis Exp 24, e51317. doi:10.3791/51317
Pharr, G., Oliver, W., and Brotzen, F. (1992). On the generality of the relationship among contact stiffness, contact area, and elastic-modulus during indentation. J. Mater. Res. 7, 613–617. doi:10.1557/JMR.1992.0613
Pilate, G., Guiney, E., Holt, K., Petit-Conil, M., Lapierre, C., Leple, J., et al. (2002). Field and pulping performances of transgenic trees with altered lignification. Nat. Biotechnol. 20, 607–612. doi:10.1038/nbt0602-607
Radmacher, M. (1997). Measuring the elastic properties of biological samples with the afm. IEEE Eng. Med. Biol. Mag. 16, 47–57. doi:10.1109/51.582176
Radmacher, M., Fritz, M., Kacher, C., Cleveland, J., and Hansma, P. (1996). Measuring the viscoelastic properties of human platelets with the atomic force microscope. Biophys. J. 70, 556–567. doi:10.1016/S0006-3495(96)79602-9
Radotic, K., Roduit, C., Simonovic, J., Hornitschek, P., Fankhauser, C., Mutavdzic, D., et al. (2012). Atomic force microscopy stiffness tomography on living Arabidopsis thaliana cells reveals the mechanical properties of surface and deep cell-wall layers during growth. Biophys. J. 103, 386–394. doi:10.1016/j.bpj.2012.06.046
Salmén, L. (2004). Micromechanical understanding of the cell-wall structure. C. R. Biol. 327, 873–880. doi:10.1016/j.crvi.2004.03.010
Salvadori, M. R., Oller Nascimento, C. A., and Correa, B. (2014). Nickel oxide nanoparticles film produced by dead biomass of filamentous fungus. Sci. Rep. 4, 6404. doi:10.1038/srep06404
Sannigrahi, P., Ragauskas, A. J., and Tuskan, G. A. (2010). Poplar as a feedstock for biofuels: a review of compositional characteristics. Biofuels Bioprod. Biorefin. 4, 209–226. doi:10.1002/bbb.206
Singh, R., Shukla, A., Tiwari, S., and Srivastava, M. (2014). A review on delignification of lignocellulosic biomass for enhancement of ethanol production potential. Renewable Sustain. Energy Rev. 32, 713–728. doi:10.1016/j.rser.2014.01.051
Singh, S., Cheng, G., Sathitsuksanoh, N., Wu, D., Varanasi, P., George, A., et al. (2015). Comparison of different biomass pretreatment techniques and their impact on chemistry and structure. Front. Energy Res. 2:62. doi:10.3389/fenrg.2014.00062
Spitzner, E.-C., Roeper, S., Zerson, M., Bernstein, A., and Magerle, R. (2015). Nanoscale swelling heterogeneities in type I collagen fibrils. ACS Nano 9, 5683–5694. doi:10.1021/nn503637q
Tetard, L., Passian, A., Farahi, R. H., Davison, B. H., Jung, S., Ragauskas, A. J., et al. (2011). Nanometrology of delignified populus using mode synthesizing atomic force microscopy. Nanotechnology 22, 465702. doi:10.1088/0957-4484/22/46/465702
Tetard, L., Passian, A., Farahi, R. H., Thundat, T., and Davison, B. H. (2015). Opto-nanomechanical spectroscopic material characterization. Nat. Nanotechnol. 10, 870–877. doi:10.1038/nnano.2015.168
Tetard, L., Passian, A., and Thundat, T. (2010). New modes for subsurface atomic force microscopy through nanomechanical coupling. Nat. Nanotechnol. 5, 105–109. doi:10.1038/nnano.2009.454
Tetard, L., Passian, A., Venmar, K. T., Lynch, R. M., Voy, B. H., Shekhawat, G., et al. (2008). Imaging nanoparticles in cells by nanomechanical holography. Nat. Nanotechnol. 3, 501–505. doi:10.1038/nnano.2008.162
Tian, D., Chandra, R. P., Lee, J.-S., Lu, C., and Saddler, J. N. (2017). A comparison of various lignin-extraction methods to enhance the accessibility and ease of enzymatic hydrolysis of the cellulosic component of steam-pretreated poplar. Biotechnol. Biofuels 10, 157. doi:10.1186/s13068-017-0846-5
Tolbert, A., and Ragauskas, A. J. (2017). Advances in understanding the surface chemistry of lignocellulosic biomass via time-of-flight secondary ion mass spectrometry. Energy Sci. Eng. 5, 5–20. doi:10.1002/ese3.144
Torode, T. A., O’Neill, R., Marcus, S. E., Cornuault, V., Pose, S., Lauder, R. P., et al. (2018). Branched pectic galactan in phloem-sieve-element cell walls: Implications for cell mechanics. Plant Physiol 176, 1547–1558. doi:10.1104/pp.17.01568
Wagner, L., Bader, T. K., and de Borst, K. (2014). Nanoindentation of wood cell walls: effects of sample preparation and indentation protocol. J. Sci. Mater. 49, 94–102. doi:10.1007/s10853-013-7680-3
Wimmer, R., and Lucas, B. (1997). Comparing mechanical properties of secondary wall and cell corner middle lamella in spruce wood. IAWA J. 18, 77–88. doi:10.1163/22941932-90001463
Wimmer, R., Lucas, B., Tsui, T., and Oliver, W. (1997). Longitudinal hardness and young’s modulus of spruce tracheid secondary walls using nanoindentation technique. Wood Sci. Technol. 31, 131–141. doi:10.1007/BF00705928
Yakubov, G. E., Bonilla, M. R., Chen, H., Doblin, M. S., Bacic, A., Gidley, M. J., et al. (2016). Mapping nano-scale mechanical heterogeneity of primary plant cell walls. J. Exp. Bot. 67, 2799–2816. doi:10.1093/jxb/erw117
Youssefian, S., Jakes, J. E., and Rahbar, N. (2017). Variation of nanostructures, molecular interactions, and anisotropic elastic moduli of lignocellulosic cell walls with moisture. Sci. Rep. 7, 2054. doi:10.1038/s41598-017-02288-w
Zdunek, A., and Kurenda, A. (2013). Determination of the elastic properties of tomato fruit cells with an atomic force microscope. Sensors (Basel) 13, 12175–12191. doi:10.3390/s130912175
Zhang, M., Chen, G., Kumar, R., and Xu, B. (2013a). Mapping out the structural changes of natural and pretreated plant cell wall surfaces by atomic force microscopy single molecular recognition imaging. Biotechnol. Biofuels 6, 147. doi:10.1186/1754-6834-6-147
Zhang, M., Wang, B., and Xu, B. (2013b). Measurements of single molecular affinity interactions between carbohydrate-binding modules and crystalline cellulose fibrils. Phys. Chem. Chem. Phys. 15, 6508–6515. doi:10.1039/c3cp51072g
Zhang, T., Vavylonis, D., Durachko, D. M., and Cosgrove, D. J. (2017). Nanoscale movements of cellulose microfibrils in primary cell walls. Nat. Plants 3, 17056. doi:10.1038/nplants.2017.56
Zhong, Q., Inniss, D., Kjoller, K., and Elings, V. (1993). Fractured polymer silica fiber surface studied by tapping mode atomic-force microscopy. Surf. Sci. 290, L688–L692. doi:10.1016/0039-6028(93)90582-5
Keywords: AFM, QFM, MSAFM, HPFM, plant cell walls, lignin, biofuel, bioenergy
Citation: Charrier AM, Lereu AL, Farahi RH, Davison BH and Passian A (2018) Nanometrology of Biomass for Bioenergy: The Role of Atomic Force Microscopy and Spectroscopy in Plant Cell Characterization. Front. Energy Res. 6:11. doi: 10.3389/fenrg.2018.00011
Received: 26 October 2017; Accepted: 22 February 2018;
Published: 19 March 2018
Edited by:
Abdul-Sattar Nizami, King Abdulaziz University, Saudi ArabiaReviewed by:
Héctor A. Ruiz, Universidad Autónoma de Coahuila, MexicoMohammad Rehan, King Abdulaziz University, Saudi Arabia
Copyright: © 2018 Charrier, Lereu, Farahi, Davison and Passian. This is an open-access article distributed under the terms of the Creative Commons Attribution License (CC BY). The use, distribution or reproduction in other forums is permitted, provided the original author(s) and the copyright owner are credited and that the original publication in this journal is cited, in accordance with accepted academic practice. No use, distribution or reproduction is permitted which does not comply with these terms.
*Correspondence: Ali Passian, passianan@ornl.gov