Measurement for Surface Tension of Aqueous Inorganic Salt
 Jiming Wen
 Kaiyi Shi
 Qiunan Sun1
- 1Fundamental Science on Nuclear Safety and Simulation Technology Laboratory, Harbin Engineering University, Harbin, China
- 2Department of Chemistry and Chemical Engineering, LiuPanshui Normal University, LiuPanshui, China
Bubble columns are effective means of filtration in filtered containment venting systems. Here, the surface tension has a significant influence on bubble size distribution and bubble deformation, which have a strong impact on the behavior of the bubble column. The influence of aqueous inorganic compounds on the surface tension depends on the electrolytic activity, Debye length, entropy of ion hydration, and surface deficiencies or excess. In this work, the surface tensions of same specific aqueous solutions have been measured by different methods including platinum plate method, platinum ring method, and maximum bubble pressure method. The measured surface tensions of both sodium hydroxide and sodium thiosulfate are less than that of water. As solution temperature ranges from 20 to 75°C, the surface tension of 0.5 mol/L sodium hydroxide solution decreases from 71 to 55 mN/m while that of 1 mol/L solution decreases from 60 to 45 mN/m. Similarly during the same temperature range, the surface tension of 0.5 mol/L sodium thiosulfate decreases from 70 to 38 mN/m, and that of 1 mol/L sodium thiosulfate is between 68 and 36 mN/m. The analysis for the influence mechanism of aqueous inorganic on surface tension is provided. In addition, experimental results show that the surface tension of solid aerosol suspension liquid has no obvious difference from that of distilled water.
Introduction
Containment, as the last shield, plays a crucial role in protecting nuclear power plant (NPP), whose integrity defines the success of the safe strategy of NPP in severe accident. However, once a serious accident such as the lost of coolant accident occurred, the pressure in containment would rise persistently. When the containment pressure rose beyond the threshold pressure, rupture or crevasse of some parts in containment could appear. One strategy for solving this problem is to discharge the gas in containment automatically when the pressure of containment is close to the threshold pressure (OECD/NEA/CSNI, 2014). The gas to be vented is composed of not only air and steam but also various kinds of high-dose radioactive material. The representative radioactive materials that can do serious harm to the people and environment near NPP are iodine, aerosol, and methyl iodide. Filter containment venting systems (FCVS) are designed to filter radioactive materials when the gas within containment needs to be vented. After Fukushima Daiichi nuclear disaster, many countries, such as Japan and Korea, have made a specialized schedule of installing FCVS. Owning to the ability of enlarging specific transfer area and prolonging bubble resident time in solution, bubble column possesses a potential capability of filtering methyl iodide (Smith, 1991; Zhang and Fan, 2003; Gumulya et al., 2016).
The work performance of bubble column has relation with the bubble size distribution on which the surface tension of washing solution has significant effect (Kazakis et al., 2008). Surface tension is one force suppressing bubble detachment, so bubble detachment volume increases with surface tension (Loimer et al., 2004). The interface area between gas and liquid phases is influenced by the bubble deformation, which becomes more serious as surface tension decreases (Celata et al., 2007). It has been proved by many researchers that bubble coalescence probability increases with inorganic ions concentration. When inorganic ions’ concentration is above the critical value, bubble coalescence even disappears (Jamialahmadi and Müller-Steinhagen, 1992; Ruzicka et al., 2008; Cachaza et al., 2011). One reason for this phenomenon is that the surface tension of washing solution increases due to the existence of inorganic ions. In practical application, the washing solution in bubbling filtration installation is added with sodium hydroxide and sodium thiosulfate, which are used to consume methyl iodide and iodine persistently (Wen et al., 2017). In addition, an amount of aerosols is suspended in washing solution. These kinds of materials may have influence on the surface tension of solution. The existing study pays major attention on the surface tension of high concentration inorganic solution (Li and Lu, 2001; Dutcher et al., 2010). But the concentration of inorganic ions in the washing solution of filtered containment venting system is below 1 mol/L. In this work, the surface tensions of aqueous solutions containing different materials are measured, and some applicable analyses have been given out.
Experimental Procedure
The inorganic reagents are the analytical pure, which are produced by Sigma-Aldrich. As shown in Table 1, because the concentrations of sodium hydroxide and sodium thiosulfate in practical application are 0.5 and 0.2 wt%, respectively, which both belong to low concentration inorganic solution, their concentrations range 0–1 mol/L in this work. To avoid the influence of evaporation on the solution concentration, the temperature range of solution chosen as 15–75°C. In this work, barium sulfate and titanium dioxide are employed to simulate the radioactive aerosol, and the concentration is 0–1 g/L (Zhou et al., 2014). During the experimental process, all glassware are cleaned in chromic acid and then rinsed at least five times to eliminate the organic contamination.
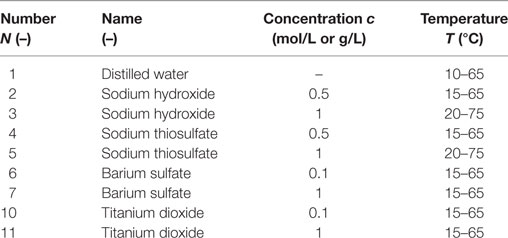
Table 1. Concentration and temperature range of different solutions.
The surface tension is measured by different measurement methods. Most experimental points are conducted by K100 of KRÜSS GmbH. The instrument can use both the platinum plate and platinum ring methods to complete the measurements. The measurement principle of platinum plate method is expressed by Eq. 1. Platinum plate method possesses the advantage of short measurement period. The measurement principle of platinum ring method is expressed as Eq. 2. The measurement period of platinum ring method is obviously longer than that of platinum plate method, but the measured results of platinum ring method possess more perfect repeatability. To avoid the possible instrument error, some experiment points of inorganic solution are conducted back to back by SFZL-U of Innuo. For a few special experimental points, the surface tension is measured by BP100 of KRÜSS GmbH, which employs maximum bubble pressure method. The measurement principle of maximum bubble pressure method is expressed as Eq. 3.
The measure precision of the instrument K100 is tested by measuring the surface tension of distilled water as shown in Figure 1. It shows that the measured results of distilled water are consistent basically to the values measured by Abramzon (1994), which are accepted by many researchers. Before each point is conducted, the surface tension of distilled water is measured and compared with the standard value to guarantee no impurities contamination. The temperature can be measured by the resistance temperature detector assembled in the measurement instruction. The measurement precision of thermal resistant is verified by the second order accuracy mercury thermometer as shown in Figure 2. At each measurement point, it is pledged that the temperature remains constant for 5 min,
where σ is the measured value of surface tension, Wt1 is the total weight of platinum plate and the solution adhering to the plate, Wp1 is the net weight of platinum plate, and 2l is the wetted perimeter of platinum plate.
where Wt2 is the total weight of platinum ring and the solution adhering to the ring, Wr2 is the net weight of platinum ring, and R is the diameter of the platinum ring.
where r is bubble radius, which is obtained by calculating bubble volume according to the total amount of gas in a bubble and ΔPmax is the maximum additional pressure caused by surface tension.
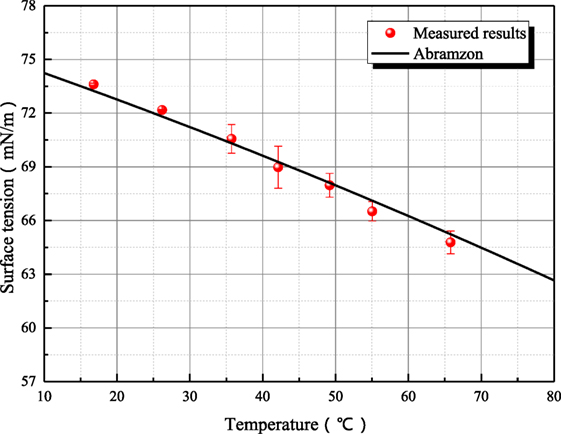
Figure 1. The precision verification for surface tension of distilled water.
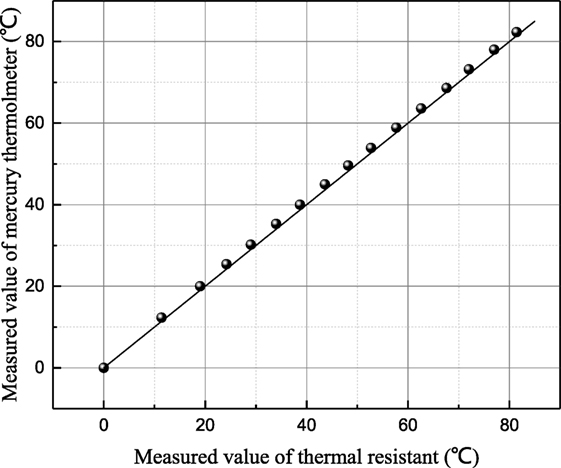
Figure 2. The relationship of measured temperature value by thermal resistant and mercury thermometer.
Results and Discussion
The influence mechanism of inorganic ions on surface tension is very complicated. According to Weissenborn and Pugh (1996), surface tension decreases with increasing ions concentration when surface excess concentration or adsorption of the solute at the interface between liquid and gas is positive. Vice versa, surface tension increases for negative surface excess concentration or adsorption of the solute at the interface. As shown in Figure 3, the surface tension of 1 mol/L aqueous sodium thiosulfate solution has been measured six times at 20°C. The time interval between two adjacent measurements is around 15 min. The all measured surface tensions of sodium thiosulfate solution are smaller than the one of distilled water at the same temperature. This result suggests that the cation and anion in aqueous sodium thiosulfate can result in surface deficiency. However, the measured surface tensions of sodium thiosulfate solution for the latter three measurements are larger than those for the former three measurements. This is because platinum plate is rinsed and roasted during the former three measurements. The ions adsorbed on platinum result in the ion lost, but the ions’ concentration retrieval rate is slow near the solution surface, so the ion concentration at the interface between gas and liquid phases decreases, and the surface tension of solution approaches the value of water. Then, the latter three measurements are conducted to verify this point. During these three measurements, platinum plate is not processed at all. After one measurement, another measurement is conducted with that. As shown in Figure 3, the surface tension of aqueous sodium thiosulfate recovers to the initial value gradually. This phenomenon suggests that the ions’ concentration reaches the equilibrium value gradually. Due to the adsorption characteristic between sodium thiosulfate and platinum, platinum ring method is employed to measure surface tension, and the measured results are shown in Figure 4. Because the contact area between platinum ring and solution is smaller, the influence of adsorption on the interface ion concentration can be neglected. The surface tension measured by platinum ring has good repeatability. Therefore, the surface tension of other solutions is measured with platinum ring.
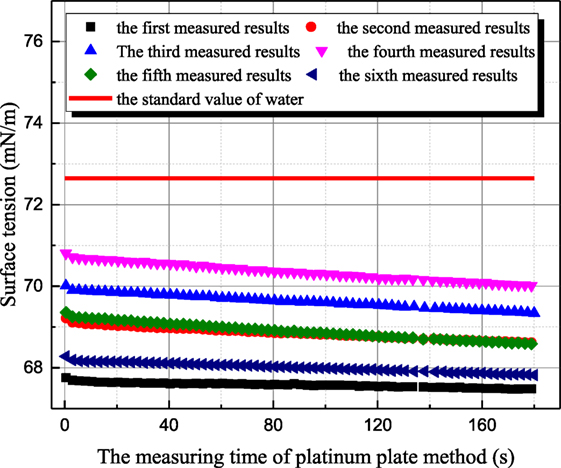
Figure 3. The history of measured surface tension of sodium thiosulfate by platinum plate method (sodium thiosulfate concentration is 1 mol/L; solution temperature is 20°C).
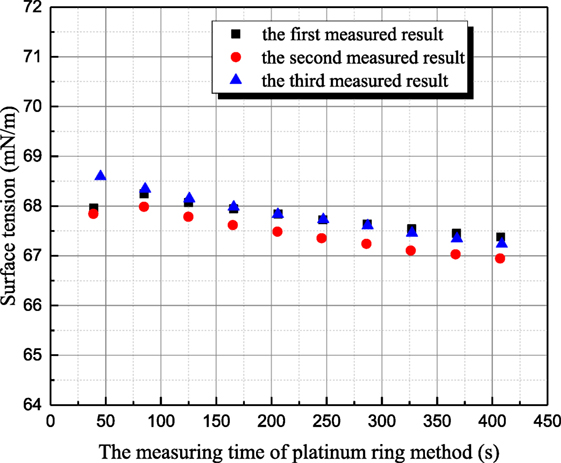
Figure 4. The history of measured surface tension of sodium thiosulfate by platinum ring method (sodium thiosulfate concentration is 1 mol/L; solution temperature is 20°C).
Figure 5 shows the measured results for 1 mol/L sodium hydroxide solution at 35°C. Because the measurement period of platinum ring is long, the time interval between adjacent measurements is 30–40 min. The surface tension of 20°C sodium hydroxide solution is 59.36 mN/m, but the former two measured surface tensions of 35°C solution are larger than that of 20°C solution as first and second measured results in Figure 5. This phenomenon goes against the principle of entropy increase. To verify whether this anomaly phenomenon is caused by contamination, the surface of solution is scraped to eliminate the impurity resulting possibly from air. Then, three more measurements (third–fifth in Figure 5) are conducted, but the surface tension increases drastically. Then, the aqueous sodium hydroxide is placed in clean environment for 8 h. Three more measurements (sixth–eighth in Figure 5) are conducted, and the measured results are consistent to the principle of entropy increase compared with the value at 20°C. Therefore, the surface tension variance is not caused by the contamination but the standing time of aqueous sodium hydroxide. To verify this judgment, another set of experiments are conducted. Maximum bubble pressure method is adapted because this method is less affected by impurity. In Figure 6, the surface tension of 1 mol/L sodium hydroxide is measured at 20 and 35°C. The bubble formation time can be altered from 0.05 to 200 s by adjusting gas flow rate. It can be seen that the measured surface tension by maximum bubble pressure method maintains almost constant. The maximum bubble formation time 200 s is enough compared with the enrichment time of active impurity (Kretzschmar and Miller, 1991). So the phenomenon in Figure 5 is not caused by the contamination of active agent. It can be concluded that the surface tension decreases resulted from sodium hydroxide is self characteristic of solution. According to Meng (2011), hydroxyl ion clusters has significant influence on the molecular structure of water. The binging energy of hydrogen bond clusters is higher than the one of hydroxyl ion clusters. Because of hydronium existence, more hydroxyl ion clusters form, and the surface tension decreases. As the solution temperature is room temperature, the thermal motion of molecule is relatively weak, so the formation time of hydroxyl ion clusters is long. When the equilibrium state is destroyed, it will spend long time to retrieval.
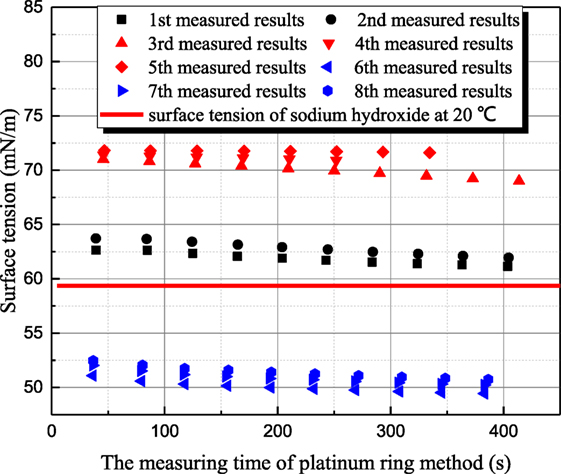
Figure 5. The history of measured surface tension of sodium thiosulfate by platinum ring method (sodium hydroxide concentration is 1 mol/L; solution temperature is 35°C).
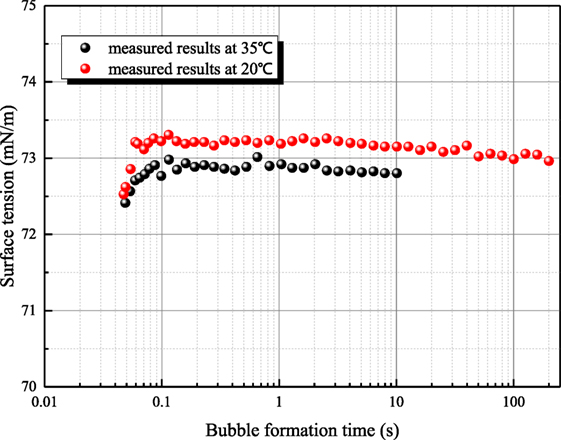
Figure 6. The relationship of measured surface tension by maximum bubble pressure method (sodium hydroxide concentration is 1 mol/L).
Some further experiments have been conducted to study the variance characteristic of surface tension of sodium hydroxide. Figures 7 and 8 both reflect the influence of agitation on surface tension. In Figure 7, the surface tension of 1 mol/L aqueous sodium hydroxide is measured under the condition where aqueous sodium hydroxide has been in equilibrium state, and the measured point at 35°C is employed to study the influence of agitation on surface tension because this measured point is locate at middle of temperature range and the thermal motion of molecule is not too strong. As shown in Figure 7, the surface tension after agitation at 40°C is obviously larger than the surface tension at other temperatures, because the experiments are conducted as solution temperature increases. The agitation has influence on the measured surface tension at higher temperature so that the surface tension at 50°C is larger than the value before agitation at 40°C. Different from the situation at 20°C, the retrieval rate of hydroxyl ion clusters at 40–50°C is faster. Then, the influence of agitation on surface tension is studied at 73°C as shown in Figure 8. The dynamic variance of surface tension after agitation can be observed during one measurement period. At 73°C, the time for complete retrieval is about 3 min. It can be concluded that the retrieval rate of hydroxyl ion clusters increases with solution temperature.
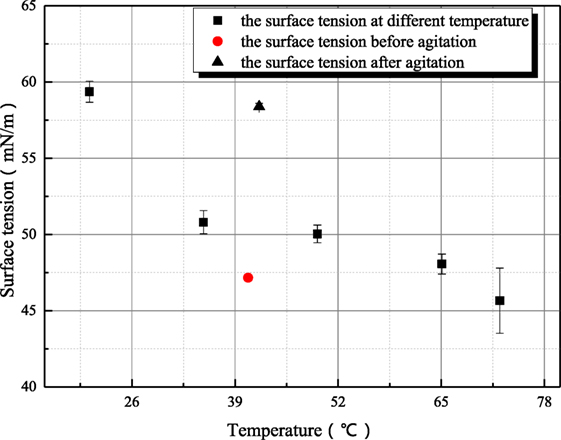
Figure 7. The influence of agitation on the surface tension of sodium hydroxide (sodium hydroxide concentration is 1 mol/L).
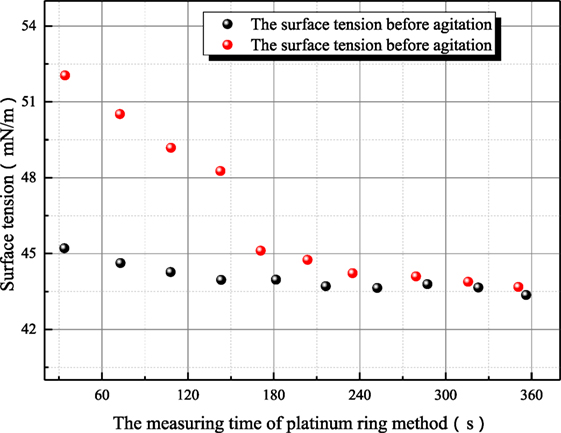
Figure 8. The influence of agitation on the surface tension of sodium hydroxide (sodium hydroxide concentration is 1 mol/L; solution temperature is 73°C).
Because sodium thiosulfate belongs to the salt of strong alkali weak acid, the thiosulfate radical hydrolysis can produce hydroxyl ion. However as shown in Figure 9, the influence of agitation on the surface tension of sodium thiosulfate is weak. This is because the hydroxyl ion concentration is low and the influence of hydroxyl ion on surface tension can be ignored.
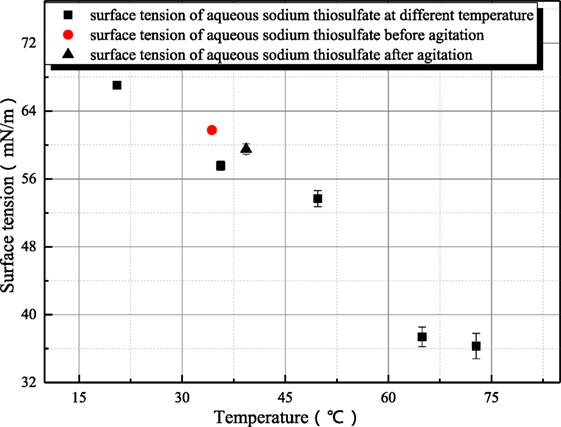
Figure 9. The influence of agitation on the surface tension of sodium thiosulfate (sodium hydroxide concentration is 1 mol/L).
Because the surface tensions of aqueous sodium hydroxide and sodium thiosulfate are sensitive to the measurement operation, the possible steps that affect surface tension are conducted carefully to make sure that the steady surface tension can be measured accurately. As shown in Figure 10, the surface tension/electrolyte concentration gradients are both negative for aqueous sodium hydroxide and sodium thiosulfate. The surface tension/electrolyte concentration gradients of aqueous sodium hydroxide are larger than the one of aqueous sodium thiosulfate. Besides aqueous inorganic, the surface tensions of different aerosol suspension liquid have been measured. The surface tensions of barium sulfate and titanium dioxide are shown in Figure 11. It is seen that the surface tension of solid suspension liquid is close to the one of water. Although it has been reported that aerosol can reduce the interface energy of liquid (Vafaei et al., 2009), the measured surface tension is statical variable. The aerosol particle is much larger than the liquid molecule or ion cluster, so the surface tension is not altered obviously by solid aerosol. The only exception is 0.1 g/L titanium dioxide suspension liquid whose surface tension is significantly smaller than the value of water. This is because the particle size of titanium dioxide is smaller, and the hydrophobicity of aerosol particle makes the liquid molecule structure loose. However, as the mass portion of titanium dioxide increases, the aerosol particle agglomerates, and the influence of aerosol on surface tension disappears.

Figure 10. The relationship of the surface tension of aqueous inorganic and temperature.
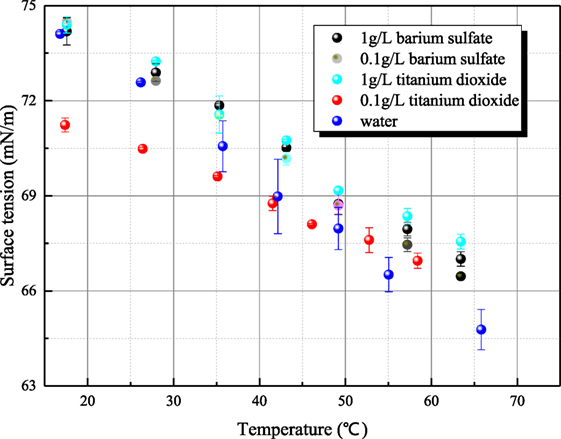
Figure 11. The relationship of the surface tension of solid aerosol suspension liquid and temperature.
Conclusion
The surface tensions of aqueous sodium hydroxide, aqueous sodium thiosulfate, and solid aerosol suspension liquid have been measured mainly by platinum ring method. The surface tension/electrolyte concentration gradients of aqueous sodium thiosulfate are negative, which proves that surface excess concentration or adsorption of the solute at the interface between liquid and gas is positive. Because sodium thiosulfate is easily adsorbed on platinum material, it is applicable to employ platinum ring for measuring aqueous sodium thiosulfate and other similar solution. Due to the formation of hydroxyl ion clusters, the surface tension of aqueous sodium hydroxide is smaller than the value of water. The retrieval time of hydroxyl ion clusters is much smaller than the one of active agent and decreases with temperature increase. Due to large particle diameter and agglomeration phenomenon, the surface tension of solid aerosol suspension liquid has no obvious difference from the surface tension of water.
Author Contributions
HG provides guidance for this study. ZS and KS subsidize this research work.
Conflict of Interest Statement
The authors declare that the research was conducted in the absence of any commercial or financial relationships that could be construed as a potential conflict of interest.
Funding
These authors are profoundly grateful to the financial supports of the Fundamental Research Funds for the Central Universities (Grant Nos. HEUCF171502). This work is also supported by Key Supported Discipline of Guizhou Provence (Qian Xuewei He Zi ZDXK[2016]24), 2011 Collaborative Innovation Center of Guizhou Province (Qian Jiao He Xietongchuangxin Zi [2016]02).
References
Cachaza, E. M., Díaz, M. E., Montes, F. J., and Galán, M. A. (2011). Unified study of flow regimes and gas holdup in the presence of positive and negative surfactants in a non-uniformly aerated bubble column. Chem. Eng. Sci. 66, 4047. doi: 10.1016/j.ces.2011.05.036
Celata, G. P., Annibale, F. D., Marco, P. D., Memoli, G., and Tomiyama, A. (2007). Measurements of rising velocity of a small bubble in a stagnant fluid in one- and two-component systems. Exp. Therm. Fluid Sci. 31, 609. doi:10.1016/j.expthermflusci.2006.06.006
Dutcher, C. S., Wexler, A. S., and Clegg, S. L. (2010). Surface tensions of inorganic multicomponent aqueous electrolyte solutions and melts. J. Phys. Chem. A 114, 12216. doi:10.1021/jp105191z
Gumulya, M. M. G. C., Joshi, J. B., Utikar, R. P., Evans, G. M., and Pareek, V. (2016). Bubbles in viscous liquids: time dependent behaviour and wake characteristics. Chem. Eng. Sci. 144, 298. doi:10.1016/j.ces.2016.01.051
Jamialahmadi, M., and Müller-Steinhagen, H. (1992). Effect of alcohol, organic acid and potassium chloride concentration on bubble size, bubble rise velocity and gas hold-up in bubble columns. Chem. Eng. J. 50, 47.
Kazakis, N. A., Mouza, A. A., and Paras, S. V. H. P. (2008). Coalescence during bubble formation at two neighbouring pores: an experimental study in microscopic scale. Chem. Eng. Sci. 63, 5160. doi:10.1016/j.ces.2008.07.006
Kretzschmar, G., and Miller, R. (1991). Dynamic properties of adsorption layers of amphiphilic substances at fluid interfaces. Adv. Colloid Interface Sci. 36, 65. doi:10.1016/0001-8686(91)80029-J
Li, Z., and Lu, C. Y. (2001). Surface tension of aqueous electrolyte solutions at high concentrations — representation and prediction. Chem. Eng. Sci. 56, 2879. doi:10.1016/S0009-2509(00)00525-X
Loimer, T. T. L. T., Machu, G., and Schaflinger, U. (2004). Inviscid bubble formation on porous plates and sieve plates. Chem. Eng. Sci. 59, 809. doi:10.1016/j.ces.2003.10.020
Meng, X. (2011). Theoretical Study on Hydronium Ion Clusters and Hydroxyl Ion Clusters. Master’s thesis.
Ruzicka, M. C. R. I., Vecer, M. M., Orvalho, S., and Drahoš, J. (2008). Effect of surfactant on homogeneous regime stability in bubble column. Chem. Eng. Sci. 63, 951. doi:10.1016/j.ces.2007.10.015
Smith, J. (1991). Bubble Wake Dynamics in Liquids and Liquid—Solid Suspensions: by Liang-Shih Fan and Katsumi Tsuchiya, Published by Butterworth—Heinemann, 1990. Powder Technol. 105. doi:10.1016/0032-5910(91)80089-2
Vafaei, S., Purkayastha, A., Jain, A., Ramanath, G., and Borcatasciuc, T. (2009). The effect of nanoparticles on the liquid-gas surface tension of Bi2Te3 nanofluids. Nanotechnology 20, 185702. doi:10.1088/0957-4484/20/18/185702
Weissenborn, P. K., and Pugh, R. J. (1996). Surface tension of aqueous solutions of electrolytes: relationship with ion hydration, oxygen solubility, and bubble coalescence. J. Colloid Interface Sci. 184, 550. doi:10.1006/jcis.1996.0651
Wen, J., Gu, H., Sun, Z., and Zhou, Y. (2017). A theoretical model and experiment validation on filtration characteristics of methyl iodide in bubble column. Int. J. Heat Mass Transfer 114, 1263. doi:10.1016/j.ijheatmasstransfer.2017.07.023
Zhang, J., and Fan, L. S. (2003). On the rise velocity of an interactive bubble in liquids. Chem. Eng. J. 92, 169. doi:10.1016/S1385-8947(02)00189-4
Keywords: surface tension, aqueous inorganic, solid aerosol suspension liquid, filtered contain venting system, bubble column
Citation: Wen J, Shi K, Sun Q, Sun Z and Gu H (2018) Measurement for Surface Tension of Aqueous Inorganic Salt. Front. Energy Res. 6:12. doi: 10.3389/fenrg.2018.00012
Received: 12 November 2017; Accepted: 26 February 2018;
Published: 12 March 2018
Edited by:
Uwe Schröder, Technische Universitat Braunschweig, GermanyReviewed by:
Daniell Tincher, Virginia Commonwealth University, United StatesKeyou Mao, Purdue University, United States
Yago Rivera, Universidad Politécnica de Valencia (UPV), Spain
Copyright: © 2018 Wen, Shi, Sun, Sun and Gu. This is an open-access article distributed under the terms of the Creative Commons Attribution License (CC BY). The use, distribution or reproduction in other forums is permitted, provided the original author(s) and the copyright owner are credited and that the original publication in this journal is cited, in accordance with accepted academic practice. No use, distribution or reproduction is permitted which does not comply with these terms.
*Correspondence: Haifeng Gu, guhaifeng@hrbeu.edu.cn