Microbial Community Pathways for the Production of Volatile Fatty Acids From CO2 and Electricity
 Jorge Wenzel1*
 Erika Fiset2,3
 Pau Batlle-Vilanova4
 Angela Cabezas1
 Claudia Etchebehere1
 María D. Balaguer2
 Jesús Colprim2
  Sebastià Puig2
- 1Microbial Ecology Laboratory, Microbial Biochemistry and Genomics Department, Biological Research Institute “Clemente Estable”, Montevideo, Uruguay
- 2LEQUIA, Institute of the Environment, University of Girona, Girona, Spain
- 3Center for Microbial Ecology and Technology (CMET), Ghent University, Ghent, Belgium
- 4Department of Innovation and Technology, FCC Aqualia, Barcelona, Spain
This study aims at elucidating the metabolic pathways involved in the production of volatile fatty acids from CO2 and electricity. Two bioelectrochemical systems (BES) were fed with pure CO2 (cells A and B). The cathode potential was first poised at −574 mV vs. standard hydrogen electrode (SHE) and then at −756 mV vs. SHE in order to ensure the required reducing power. Despite applying similar operation conditions to both BES, they responded differently. A mixture of organic compounds (1.87 mM acetic acid, 2.30 mM formic acid, 0.43 mM propionic acid, 0.15 mM butyric acid, 0.55 mM valeric acid, and 0.62 mM ethanol) was produced in cell A while mainly 1.82 mM acetic acid and 0.23 mM propionic acid were produced in cell B. The microbial community analysis performed by 16S rRNA gene pyrosequencing showed a predominance of Clostridium sp. and Serratia sp. in cell A whereas Burkholderia sp. and Xanthobacter sp. predominated in cell B. The coexistence of three metabolic pathways involved in carbon fixation was predicted. Calvin cycle was predicted in both cells during the whole experiment while Wood-Ljungdahl and Arnon-Buchanan pathways predominated in the period with higher coulombic efficiency. Metabolic pathways which transform organic acids into anabolic intermediaries were also predicted, indicating the occurrence of complex trophic interactions. These results further complicate the understanding of these mixed culture microbial processes but also expand the expectation of compounds that could potentially be produced with this technology.
Introduction
Burning of fossil and biomass fuels is currently the primary energy source responsible for the increment of carbon gaseous emissions that arise during the industrialization period. In this regard, a variety of mitigation strategies have been implemented at different levels, from carbon fixation in planted forests to fine chemicals production (Mikkelsen et al., 2010). Bioelectrochemical systems (BES) have been proposed for CO2 capture and transformation (Nevin et al., 2010). BES technology exploits the ability of certain microorganisms to exchange electrons with an electrode, under an applied electric potential or current, catalyzing either oxidation (at the anode) or reduction (at the cathode) reactions. In BES, CO2 is reduced by electrotrophic microbial communities. These communities harbor microorganisms capable of performing extracellular electron transfer (EET) to obtain electrons from the surface of the electrode (Choi and Sang, 2016). The electrons are transferred directly from the electrode by extracellular protein structures called nanowires or by cell wall cytochromes [direct electron transfer (DET)] as demonstrated for Geobacter and Shewanella genera, respectively. Alternatively, this transfer could be done by redox intermediaries such as molecular hydrogen or formate [mediated electron transfer (MET)] under an applied electric potential (Sharma et al., 2014).
Bioelectrochemical systems technology for CO2 capture was first demonstrated by Nevin et al. (2010). CO2 was transformed into acetate (up to 10 mM) using a pure culture of Sporomusa ovata. The production of acetate was explained by the fact that S. ovata performs Wood-Ljundahl pathway (WLP) to fix CO2 probably using electrons directly from the cathode without intermediaries (Breznak, 2006). More recently, Marshall et al. (2012, 2013) demonstrated acetate production using mixed cultures (max. 175 mM) in two subsequent studies. Acetobacterium sp. was the predominant microorganism within the microbial community in the biocathode when the acetate production rate and concentration were maximum. As well as for Sporomusa ovata, it had already been shown that the genus Acetobacterium is capable of performing the WLP to fix CO2, which explained acetate production (Ljungdahl, 1986). Ganigué et al. (2015) demonstrated for the first time that chain elongation could extend the product range to butyrate with small concomitant production of ethanol and butanol. Recently, the concept of fixing CO2 in BES using a continuous system was tested on a small scale with promising results (Arends et al., 2017). Arends et al. obtained an acetate titer of up to 91 mM in long operation periods with isopropanol and butyrate as value-added coproducts. In this work, the genus Acetobacterium was also predominant.
Several previous investigations have been performed to elucidate the electronic transfer mechanisms between electrodes and bacteria (Tremblay et al., 2017). However, scarce information appears in the literature about the microbial carbon fixation pathways involved in BES as well as the microbial pathways and interactions that further transform the primary carbon fixation products. More recently, Marshall et al. (2017) went a step forward demonstrating acetate production through the Arnon Buchanan Cycle (ABC) (Evans et al., 1966) and also proposing a new pathway for CO2 fixation, involving a formate dehydrogenase and cytochromes. In addition to this cycle other unreported carbon fixation pathways, such as 3-hydroxypropionate or the Calvin cycle are still unnoticed. The main products of these pathways are the internal metabolites pyruvate (Herter et al., 2002) and glyceraldehyde-3-phosphate (G3P) (Yeates et al., 2008). Meanwhile, Arends et al. (2017), Batlle-Vilanova et al. (2017), and Raes et al. (2017) also contributed to elucidate the microbial pathways proposing the route of reverse beta oxidation for the production of butyrate and isopropanol from acetyl CoA. However, there is still a lack of information on the metabolic routes and microorganisms that can convert short chain acids produced by carbon fixation to more complex (reduced or medium to long-chain) compounds. For example, the three mechanisms for propionate production (Reichardt et al., 2014) from short chain fatty acids as well as glycogen intermediates production through the glyoxylate cycle (Berg et al., 2002) remain unexplored in BES. The knowledge increase on metabolic potentials of cathode microbial communities will contribute to more accurate carbon fixation control strategies in BES and to the investigation of other alternative products, expanding the applications of this technology.
This study focused on elucidating the metabolic pathways associated with autotrophic bioelectrosynthesis of organic compounds in BESs inoculated with mixed cultures. The non-autotrophic metabolic pathways for propionate production and acetate uptake (glyoxylate cycle) were also evaluated. For that, two microbial electrosynthesis cells (MECs) fed with CO2 and inoculated with adapted biomass were operated in parallel and the microbial communities developed were analyzed by 16S rRNA gene high throughput sequencing. Based on these datasets, the main metabolic pathways were predicted. This work also aimed to explain the bioelectrosynthesis performance of both MECs through its microbial community composition and its predicted metabolic pathways.
Materials and Methods
BES Setup
Experiments were conducted in two-chambered H-type MECs (cells A and B) consisting of two 150 mL bottles (anodic and cathodic chambers) connected via a glass tube. The chambers were separated by a cationic exchange membrane (CMI-7000, Membranes International Inc., USA) to allow proton migration from the anode to the cathode and to prevent product diffusion into the anodic chamber. A modified carbon cloth with nitrogen functional groups was used as the cathode to improve the wettability of the material. To introduce nitrogen groups, the initial carbon cloths (3 cm × 3 cm) (NuVant’s ELATs LT2400W, FuelCellsEtc, USA) were treated with melamine in methanol (20 g of melamine in 100 mL of methanol) and stirred at room temperature for 5 h. Then, the suspension was boiled to evaporate the alcohol and the carbon cloths were dried at 120°C. Carbon rods (5 mm in diameter and 100 mm in length) (Mersen Ibérica, Spain) were used as anodes. A mineral growth medium (100 mL) was used as electrolyte and supplied to the cells as described by Batlle-Vilanova et al. (2015). A methanogenic inhibitor (2-bromoethanesulfonate) was added to the medium at a concentration of 20 mM. The initial pH of the medium was set to 6.8. The cathode (working electrode) potential was controlled and monitored with a potentiostat (BioLogic, Model VSP, France) in a three-electrode arrangement cell with Ag/AgCl [+197 mV vs. standard hydrogen electrode (SHE); RE-5B, BASI, UK] as the reference electrode. A carbon rod placed in the anode chamber was set as the counter electrode.
MEC Operation
Both cells were operated under similar conditions. The cathodes were inoculated at 5% (in 100 mL of cathode working volume) with a mixed microbial community dominated by species of the genus Clostridium obtained from the cathode bulk solution of a parent MEC (Ganigué et al., 2015). The product composition in the parent MEC at inoculum extraction time was 9.80 mM of acetate, 0.05 mM of propionate, and 0.40 mM butyrate. To provide a mineral carbon source and achieve anaerobic conditions in the chambers, CO2 (99.9%, Praxair, Spain) was bubbled in the chamber for 20 min at the beginning of the experiment and then periodically when the observed current demand stopped increasing.
Cathode potentials of −574 mV vs. SHE were set from days 1 to 44 and from days 1 to 47 for cells A and B, respectively. As the response of the cells was not satisfactory, the availability of reducing power in the cathodes was increased by lowering the poised potential to −756 mV vs. SHE until the end of the experiment. The desired pH was adjusted using phosphoric acid (1 M) or NaOH (1 M) stock solutions. The cells were thermostatically controlled at 35°C.
During the experimental period, 10 mL of bulk cathode suspension were sampled periodically through two sampling ports in each chamber. After sampling, the same volume of fresh medium was added to the chamber. The pH was determined using a pH meter. After that, samples were centrifuged at 5,000 g, 5 min. The pellets were stored at −20°C for microbiological analysis and volatile fatty acids (VFAs) concentration was determined in the supernatant as described in Section “Chemical Analysis.” At the end of the experiments, the electrodes were removed for microbiological analysis of the biofilm and stored at −20°C.
Chemical Analysis
Volatile fatty acid and alcohols in the samples were determined with a 7890A gas chromatograph (Agilent, USA) equipped with a DB-FFAP column (Agilent, USA) and a flame ionization detector. Prior to the analysis, samples were acidified with orthophosphoric acid (85%, Scharlau, Spain), and an internal standard (crotonic acid) was added. The composition of the gas phase (CH4, H2, CO2, and O2) was monitored daily using the same equipment in a second channel equipped with a HP-Molsieve column (Agilent, USA) and a thermal conductivity detector. Formate was quantified by ion chromatography using a Dionex CS-5000 DP (Thermo-Fisher Inc., USA).
Coulombic Efficiency (CE)
Current density was continuously monitored using EC-Lab software (Biologic, France). The CE was calculated as the ratio of the total charge delivered to the organic products obtained (VFA and alcohols). The charge in coulombs provided to the cathode by the potentiostat was calculated according to Batlle-Vilanova et al. (2015).
Cyclic Voltammetry (CV)
Cyclic voltammetry was performed at experimental periods II and VI after CO2 bubbling, in experiments with the same three-electrode arrangement described in Section “BES Setup,” to identify changes in the “bioelectrocatalysis” over time using an EC-Lab software controlled potentiostat (BioLogic, VSP model, France). The CV performed at the beginning of the experiment with fresh mineral medium was used as an abiotic control (pH 6.8). The scan window of the CV was from 400 to −600 mV vs. SHE when the poised potential was set in −547 mV and from 200 to −1,000 mV vs. SHE when the applied potential was shifted to −756 mV vs. SHE. Three voltamperometric cycles were performed in each routine at a scan rate of 1 mV/s. The cathode potentials from the CVs were corrected according to the pH and temperature conditions when the assay was performed using the Nernst equation.
Microbial Community Analysis
For DNA extraction from the biofilm attached to the carbon cloth, electrodes were washed exhaustively with sterile physiological serum (9 g/L NaCl in deionized water) to remove remaining planktonic cells. Aliquots of 250 mg of the finely chopped carbon cloth electrodes were used for DNA extraction. On the other hand, 150 mg of wet pellets were used for DNA extractions from the bulk biomass. The extractions were performed using the Power Soil DNA Kit (Mo Bio laboratories, Carlsbad, CA, USA) according to the manufacturer’s instructions. After checking the extracted DNAs quality by agarose gel electrophoresis, it was dehydrated with 95% ethanol and sent to the Institute for Agrobiology Rosario (INDEAR, Argentina). The 16S rRNA genes were amplified using the primer sets V3-357F and V5-923R (Sim et al., 2012) and sequenced using a Roche Genome Sequencer FLX Titanium system. The raw sequences were analyzed using the QIIME software (Caporaso et al., 2010). De novo chimera detection was performed with Usearch 6.1 software (Edgar, 2010). De novo operational taxonomic units (OTUs) were chosen and their taxonomy assigned using the UClust tool on the basis of 97% sequence identity with Greengenes1 reference sequences dataset. Sequence alignments were performed with PyNAST. To compare the microbial communities between samples a phylogenetic diversity index and a jackknifed (weighted and unweighted) UniFrac (Hamady et al., 2010) analysis were performed with QIIME software tools. Phylogenetic affiliations of the most prevalent OTUs obtained by the QIIME software were confirmed by the construction of a phylogenetic tree with reference sequences. The phylogenetic reconstructions were made using MEGA 6.0 software (Tamura et al., 2011).
The metabolic capabilities on a metagenomic scale were predicted with the PICRUSt software (Langille et al., 2013). This method uses the genomic information of the closest relative of the OTUs whose genome has been sequenced, annotated and deposited in the KEGG database.2
The sequences obtained were deposited at the National Center for Biotechnology Information SRA database (NCBI)3 under the accession number SAMN04550871.
Results and Discussion
Bioproduction of Carbon-Neutral Chemicals from CO2 and Renewable Electricity
Several carbon chemicals were produced in both cells (Table 1). Initially, the cathode potential was set at −547 mV vs. SHE to promote DET mechanisms (Nevin et al., 2010). Formate and acetate were produced in both cells (Table 1) achieving similar maximum concentrations of formate (2.3 mM). The CEs during this period were 18.4 and 7.3% for cells A and B, respectively (Table 1). Neither hydrogen nor methane were detected in the headspace. The product profiles obtained with the same microbial source in the parent MEC were not achieved, probably due to the lower reducing potential applied in the parent MEC (−800 mV vs. SHE) (Ganigué et al., 2015). In that work, a concentration of 3.8 mM of butyrate together with ethanol and acetate was achieved after 19 days of operation.
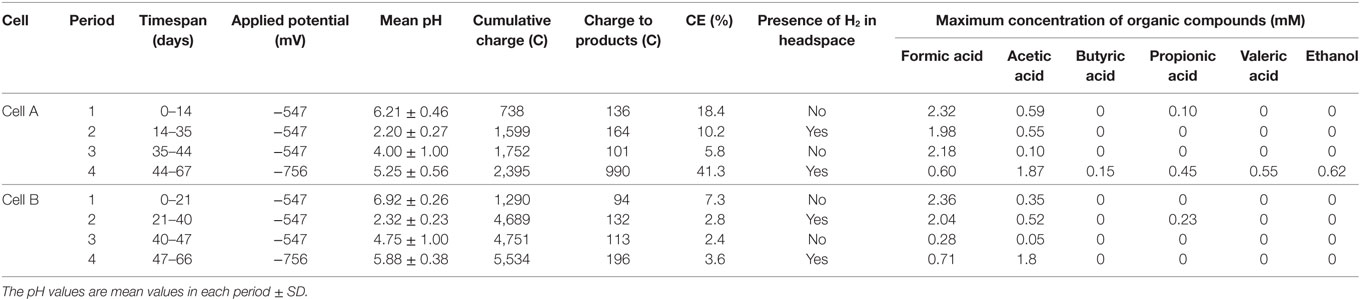
Table 1. Summary of the applied potential and response variables of cells A and B in each experimental period.
In order to reach product diversification according to the mentioned study by acidifying the cells, we decided to decrease the pH during the second operation period. The low buffer capacity of the medium made the pH control difficult and pH plummeted from 6.21 ± 0.46 and 6.92 ± 0.26 to 2.2 ± 0.3 and 2.3 ± 0.2 for cell A and B, respectively. As expected, at this low pH, hydrogen was detected in the cells headspace (Table 1) and carbon production ceased. During this period, CVs were performed for both cells. An increase was detected in the catalytic capability of the bioelectrode compared to the abiotic control, at the applied potential (Figure 1). The shape of the reductive current limit at low potential is usually reported as hydrogen evolution in non-noble electrodes, and the catalytic improvement is commonly linked to biofilm development in the electrode surface (Batlle-Vilanova et al., 2014).
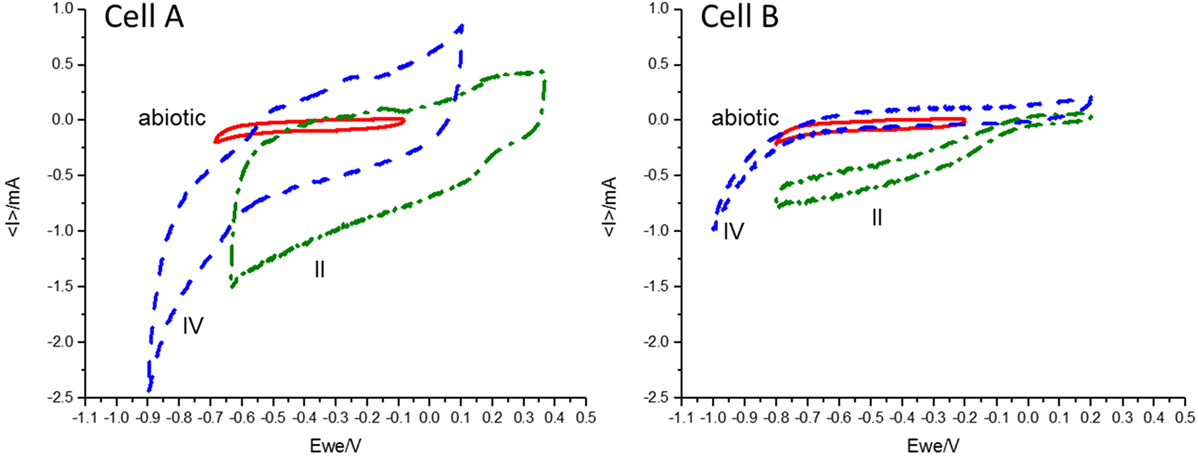
Figure 1. Cyclic voltammetry results performed in the abiotic control (red, solid line), the second period (II, green dashed-dotted line) and the fourth period (IV, blue dashed line) for cells A and B at a scan rate of 1 mV/s under turnover conditions. Differences in the catalytic current for the different periods and between cells A and B at each potential can be observed.
As mentioned, hydrogen production was observed as well as an increase in the current limit at the applied potential, but the proton consumption was not enough to raise the pH. Therefore, NaOH was added, increasing the pH to mean values of 4.0 ± 1.0 and 4.8 ± 1.0 in cells A and B, respectively. In both cells, mainly formate was produced (up to 2.20 mM in cell A and 0.31 mM in cell B) with concomitant acetate production. The CE in this period decreased to 5.8 and 2.4% for cells A and B, respectively, and no hydrogen production was detected (Table 1).
During the fourth period, the applied potential was decreased to −756 mV vs. SHE. This strategy was used to convert the hydrogen ion excess to molecular hydrogen which would increase the pH. The presence of hydrogen explained the additional increase in the absolute reductive current limit at low potentials observed in the CVs (Figure 1). During this period, a diversification of organic compounds (1.87 mM acetate, 0.21 mM formate, 0.15 mM butyrate, 0.43 mM propionate, 0.55 mM valerate, and 0.62 mM ethanol were measured in the richest sample) as well as an increase in acetate concentration was observed in cell A. This organic compound production profile was in accordance to the inoculum potential demonstrated in the parent MEC (Ganigué et al., 2015). In cell B, acetic and formic acids were produced in a stable way, but did not exceed the amounts observed during earlier periods. An important improvement of the CE to a value of 41.3% was only observed in cell A (Table 1).
During the whole period, the organic acid production and the modification in the catalytic capability of the cathodes suggested the development of an electroactive community responsible for the bioelectrosynthesis of the organic compounds.
Microbiological Analysis
Microbial Community Structure and Diversity
Bulk solution samples from cathode chambers during experimental periods I, II, and IV were analyzed by 16S rRNA gene pyrosequencing, together with samples from the biofilm attached to the cathodes at the end of experiments. A total of 101,344 high quality reads were obtained and grouped at 95% similarity into 63 and 146 OTUs in average for cells A and B, respectively. Rarefaction curves show that most of the sample diversity was contained in the datasets as the phylogenetic diversity index stabilized with increasing sample size (Figure S1 in Supplementary Material). The sample taken at day 34 from cell B presented higher diversity than the other samples as shown in the rarefaction curves. This sample contained a large number of sequences classified within minority microbial groups as will be seen further in the OTU level analysis. The sample taken during period I for cell B was not included in the analysis as no DNA was obtained probably due to low biomass concentration.
Principal component analysis (PCA) show that the microbial communities of cell A and cell B evolved divergently during operation time even though they were operated under similar conditions (Figure 2). This is in accordance with the differences observed in the VFA production profiles between both cells. Microbial communities attached to the cathodes and from bulk suspensions grouped together when PCA was performed without including OTU relative abundance (unweighted-UniFrac). This indicates a close phylogenetic relationship between microbial communities of both samples (suspension and biofilm) (Figure 2A). Differences in OTUs abundances were relevant as when including this variable in the analysis (weighted-UniFrac) the same samples from cell A did not group closely (Figure 2B). This allows us to point out that the phylogenetic groups associated with the attached biofilm are very similar to those that remain in suspension being the main difference their relative abundance.
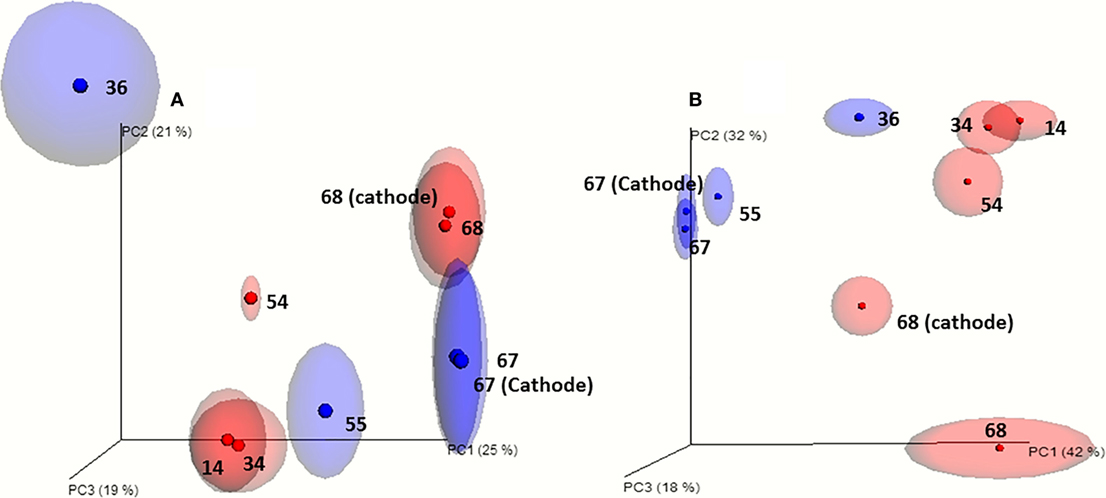
Figure 2. Beta diversity analysis of the microbial communities based on the 16S rRNA gene pyrosequencing results. (A) Jack-knifed (even 500) unweighted-UniFrac and principal component analysis. (B) Jack-knifed (even 500) weighted-UniFrac and principal component analysis. Ellipses indicates the dispersion obtained for the Jack-knife analysis (red: cell A; blue: cell B). The samples obtained from the bulk solution are indicated by the day of sampling and the samples taken from the biofilm of the cathodes at the end of the experiments are indicated by the day of sampling and the word cathode.
The OTU level analysis showed that even though the microbial communities presented many OTUs, only a few OTUs were predominant, ranging from four to eight in the different samples (Figure 3). Moreover, high dominance of one, two, or three OTUs was observed in most of the samples as previously reported (Marshall et al., 2013, 2017; Arends et al., 2017). Although several OTUs were shared by both cells, their relative abundance was different explaining the divergence observed in the PCA. A very high dominance of OTUs 792 and 793 was detected in samples from cell B, especially at the end of the operation. On the contrary, samples taken from cell A presented codominace of OTUs 792, 960, and 834. The biofilm and bulk communities in cell B closely resemble each other. In contrast, in cell A the dominance between OTUs 792 and 960 changed; OTU 792 dominated the biofilm while OTU 960 dominated the bulk solution.
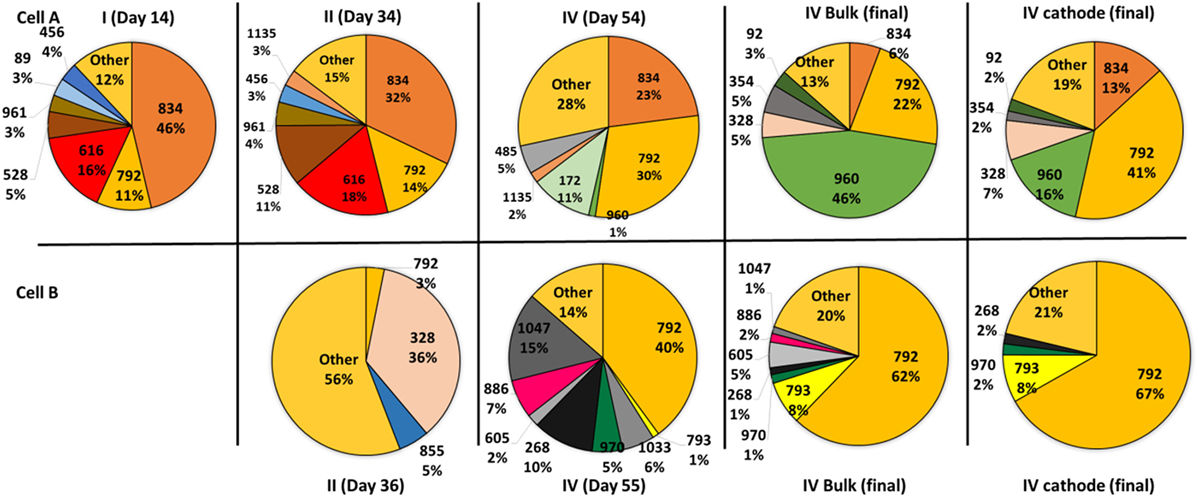
Figure 3. Pie charts showing the relative abundance of the operational taxonomic units that contribute more than 1% to the total community according to 16S rRNA gene pyrosequencing analysis. The samples were taken during the four periods from the suspended cells. At the end of the operation, samples from the biofilm attached to the cathodes were also analyzed. The samples obtained from the bulk solution are indicated by the day of sampling and the samples taken from the biofilm of the cathodes at the end of the experiments are indicated by the day of sampling and the word cathode. The sample from cell B taken during the first period could not be analyzed due to the low biomass content.
Classification of Predominant OTUs and Metabolic Potential of the Detected Microorganisms
Operational taxonomic unit sequences were classified mainly within the phyla Firmicutes, Proteobacteria, Bacteroidetes, and Actinobacteria (Figure S2 in Supplementary Material) with a high abundance of Proteobateria. According to the analysis at genus level, sequences from the most abundant OTUs were closely related to sequences from the genera Clostridium, Burkholderia, and Serratia in cell A and Burkholderia and Xanthobacter in cell B (Table 2; Figures S3 and S4 in Supplementary Material).
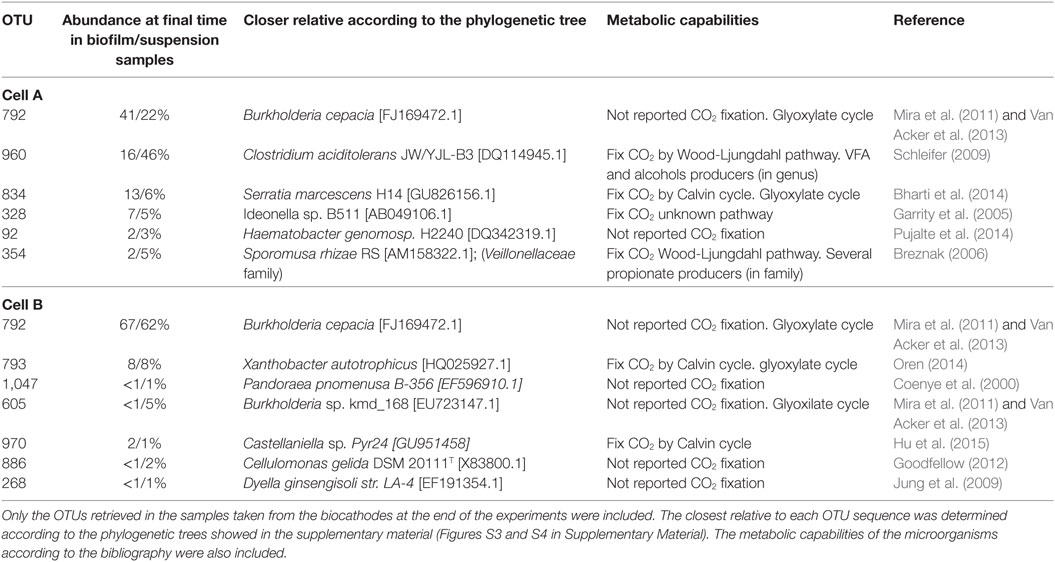
Table 2. Classification of the predominant OTUs in the microbial communities according to 16S rRNA gene sequences analysis.
A literature review regarding the metabolic capabilities of the closest relatives of the predominant OTUs was performed. In relation to carbon fixation, the closest relatives presented known capacity to perform the WLP like Clostridium (OTU 960) (Schleifer 2009) in cell A and Calvin cycle (Table 2) like Serratia (OTU 834) (Octavia et al., 2014) in cell A, Xanthobacter (OTU 793) (Oren, 2014) and Castellaniella (OTU 970) in cell B. Interestingly, the most prevalent OTU in both cells was affiliated to the Burkholderia genus (OTU 792). Microorganisms belonging to this genus have the capability of short chain fatty acid uptake through the Glyoxylate cycle under microaerophilic conditions producing glycogenic intermediary compounds (Mira et al., 2011; Van Acker et al., 2013) (Table 2). The presence of microaerophilic microorganisms might be helpful to decrease oxygen levels produced by diffusion from the anode chamber (Marshall et al., 2017). On the other hand, the production of propionic acid in cell A could be explained by the presence of organisms from the Clostridium genus and to the Veillonellaceae family. Both groups present species with the capacity to produce propionic acid (Tholozan et al., 1992; Reichardt et al., 2014). These groups were not found in high proportion in cell B where stable propionic production was not observed which then suggests that these microorganisms were involved in propionic acid production in cell A.
The WLP has been frequently reported and discussed in this type of systems. However, as far as we know, this is the first time in which the presence of microorganisms capable of performing the Calvin cycle in MECs is reported. The primary product of this pathway is G3P, a compound found in the intermediary metabolism (Bharti et al., 2014). G3P can be further oxidized to pyruvate by glycolysis and then fermented to 2,3-butanediol, succinate, lactate, formate, glycerol, acetate, or acetoin by some Serratia species (Imhoff, 2005). G3P can also serve as a substrate for anabolic pathways such as gluconeogenesis, as well as for reserve product biosynthesis, such as polyhydroxyalcanoates or long chain fatty acids, in organic carbon limiting cultures (Lugg et al., 2008). The production of these compounds might contribute to explain the low CE observed in both cells during the whole experimental period.
In this context, glyoxylate cycle performing micoorganisms, like Burkholderia cepacia (OTU 792), might utilize acetate or formate produced by other microorganisms in the cell, suggesting interactions between primary producers (carbon fixing microorganisms) and organic acid consumers. The same behavior was observed by Hu et al. (2015) and the authors suggest that these trophic interactions were favorable for the carbon fixation flux rate.
Up to this point, the analysis has been based on the previous literature reporting the metabolic capabilities of the closest related microorganisms of those detected in the cells. These reports were based on experimental assays performed using cultured microorganisms. Nevertheless, not all metabolic pathways of the cultured microorganisms have been studied experimentally. The potential to perform these pathways could be found in the genomes of phylogenetically related microorganisms. Therefore, we decided to use a different approach to study the metabolic pathways involved in the production of organic compounds through bioelectrosynthesis.
Metabolic Capabilities at Community Level
The metabolic pathways were predicted from the 16S rRNA gene sequencing data using the tool PICRUSt. This tool enables to link 16S rRNA gene sequences with metabolic capabilities found in microbial genomes deposited in the KEGG database. The analysis was focused on searching key enzymes previously described in the literature for carbon fixation, propionic acid production and the Glyoxylate cycle (Table 3).
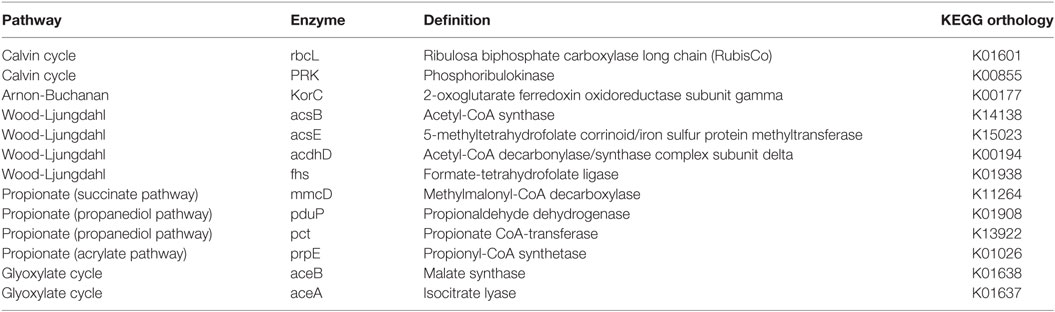
Table 3. Metabolic pathways (key enzymes) evaluated via PICRUSt.
This approach showed that, in addition to the WLP and ABC reported in other MECs (Arends et al., 2017; Marshall et al., 2017), the Calvin cycle was also potentially relevant in the electrochemically assisted carbon fixation through the intermediary metabolism reactions, as suggested by Rabaey et al. (2011) (Figure 4). Calvin cycle was predicted in all samples in both cells without large differences in relative abundances over time, with the exception of the sample taken at day 36 (period II) from cell B, in which the Calvin cycle predicted genes presented very high abundance (Figure 4). The OTUs that strongly contribute to Calvin cycle were classified within the Serratia and Xanthobacter genera. In contrast, the WLP was absent at the beginning of the experiments in both cells, and became prevalent in cell A at the end of the experimental period where a diversification of the organic acids produced was observed. The main OTUs that contribute to the prediction of this pathway were classified within the Clostridium genus. A similar behavior was observed for the ABC (Figure 5), in which the OTUs contributing to this pathway, by its predicted content in KorC gene, were classified mainly within the Clostridiaceae family, particularly within the Clostridium genus, and the Veillonellaceae family, in cell A. In the case of cell B, OTUs that represented individually less than 1% of the total amount of ARNr 16S gene sequences contributed to this pathway and were classified within Spirochaetaceae and Peptococcaceae families (OTU table, Table S1 in Data Sheet 2 in Supplementary Material). Interestingly, the ABC had not been previously reported in bioelectrosynthesis until the metagenomics approach of Marshall et al. (2017) and was confirmed by Arends et al. (2017) and by this study.
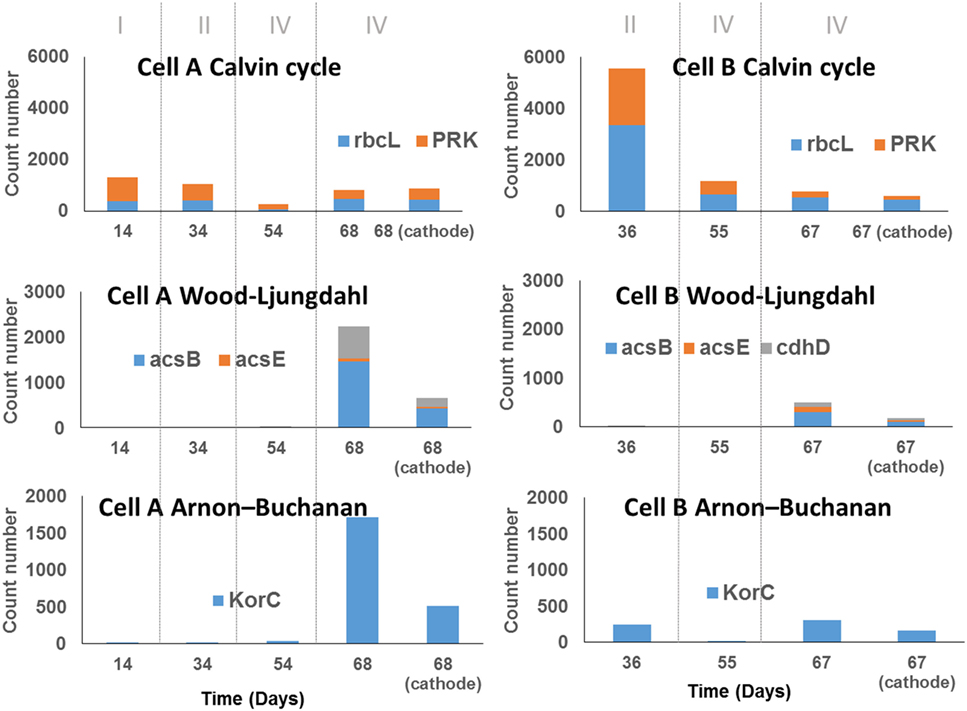
Figure 4. Abundance of genes encoding key enzymes of three carbon fixation pathways according to PICRUSt analysis prediction. The samples taken from the biomass in the bulk solution are indicated by the day of sampling. The sample taken from the biocathodes at the end of the experiment were indicate as the day of sampling and the word cathode. The count number was calculated as the sum of the number of reads that were assigned to the species that contain the particular gene, divided by the number of copies of the gene encoding the 16S rRNA reported for the species to which the read was assigned and multiplied by the gene replicates number in the annotated genome of the closest relative.
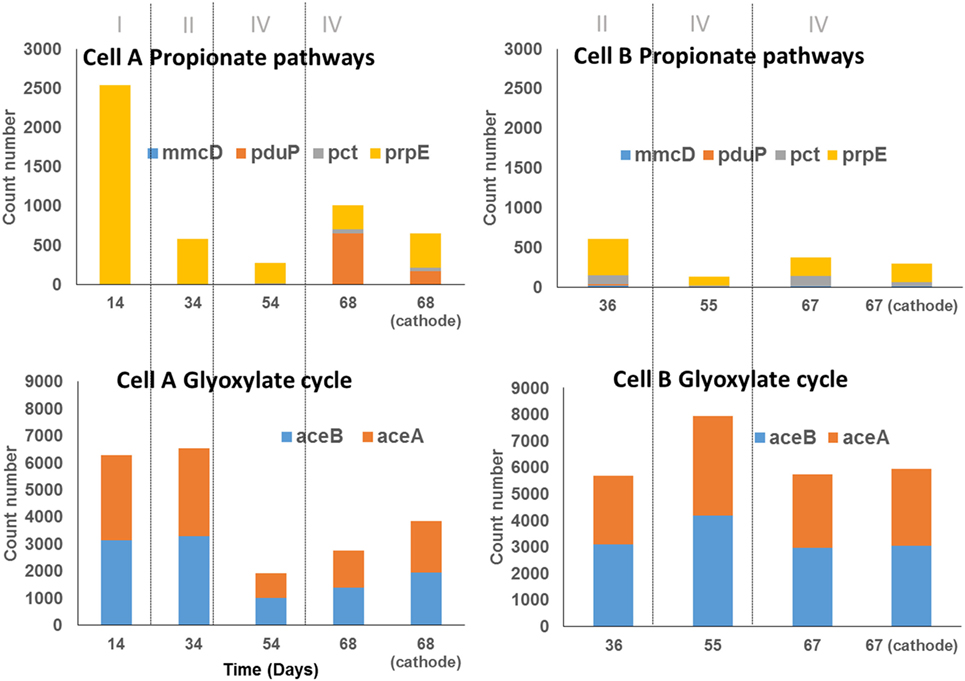
Figure 5. Abundance of genes encoding key enzymes for propionate production and short-chain fatty acid uptake (glyoxylate cycle) in samples of cells A and B according to PICRUSt analysis. The samples taken from the biomass in the bulk solution are indicated by the day of sampling, the sample taken from the biocathodes at the end of the experiment were indicate as the day of sampling and the word cathode. The count number was calculated as the sum of the number of reads that are assigned to the specie that contains the particular gene, divided by the number of copies of the gene encoding the 16S rRNA reported for the specie to which read was assigned and multiplied by the gene replicates number in the annotated genome of the closest relative.
In summary, the results from the PICRUSt prediction suggest that at least three CO2 fixing mechanisms reported for Bacteria coexist in the cells. At the end of the experiment, where a diversification of the organic compounds production occurred, the WLP and ABC seemed to be more prevalent than the Calvin cycle, which was present in all periods.
The mechanisms by which propionic acid is produced in MECs remain unclear. In order to understand this process, the same approach was used. The key genes for the three reported pathways of propionic acid production were explored using PICRUSt (Table 3). Key genes of the propanediol pathway (pct and pduP) were predicted in all samples (Figure 5). The propanediol pathway allows bacteria to transform 2,3-propanediol, produced from sugars, lactate, or dihydroxyacetone phosphate (a glycogenic intermediary), into propionate and propanol (Reichardt et al., 2014). Specifically, the gene pduP was predicted in high abundance in the two samples taken during period IV in cell A, in which propionic acid production was observed. The OTUs that mainly contributed to this predicted gene abundance in the samples were classified within the Clostridium genus in cell A and within the Propionibacterium genus in cell B, although in low abundance in the last case (within OTUs with less than 1% sequence abundances, Table S1 in Data Sheet 2 in Supplementary Material). Regarding the acrylate pathway for propionate production, the key gene prpE was also predicted in all samples but in low abundance. This pathway is characteristic of members belonging to the Clostridium genus and Veillonellaceae family allowing the utilization of lactate to produce propionate (Reichardt et al., 2014). Indeed, the OTUs found by PICRUSt which contribute with the prpE gene were classified within those phylogenetic groups. The succinate pathway uses succinate or lactate as inputs to produce propionate. The gene selected for this pathway (mmcD) was predicted in low proportion in all the samples, but interestingly, the OTUs that contributed to this gene abundance were classified in the Burkholderia genus.
Our results show that the organic acids produced might also be consumed producing glycogenic intermediates or reserve compounds by the Glyoxylate pathway. The Glyoxylate cycle was explored through this methodology focusing on two key genes: aceA and aceB (Table 3). These genes were predicted with high abundance in all samples (Figure 5). OTUs classified within Burkholderia genus found in both cells contributed strongly to this pathway, as well as Serratia, only in cell A, where the presence of both genes was predicted. In cell B, OTUs classified within Xantomonadaceae family and Actinobacteria phylum (including the OTUs classified as Xantomonas and Cellulomonas) also contributed to this pathway prediction. The presence of the glyoxylate pathway suggests that acetate transformation (produced by carbon fixation) into glycogenic intermediaries, gives the possibility for the fixed carbon to take anabolic or catabolic biochemical pathways. A metabolomics approach could contribute to elucidate the fixed carbon destination at community level. Interestingly, some observed OTUs for which a contribution to Calvin cycle was predicted, also contribute to the glyoxylate cycle. That is the case of the OTUs classified within the Serratia genus and the Xantomonadaceae family.
Based on the results obtained from the microbial community analysis, complex metabolic trophic interrelationships could be inferred (Figure 6). At least three pathways might be involved in carbon fixation (WLP, ABC, and Calvin cycle). The WLP and ABC have acetate or acetil-CoA as a primary product, whereas Calvin cycle brings a glycogenic intermediary as G3P. This compound has the potential to be biologically converted to a wide range of intermediary metabolism compounds. The short chain fatty acids and alcohols observed during the primary production could be further converted to different organic compounds through different pathways by the same carbon fixing microorganisms or from their excretion products by other secondary microorganisms (Arends et al., 2017; Marshall et al., 2017; Raes et al., 2017). For example, in this work, a combination of propionic production pathways was predicted, and each one uses different simple substrates. In addition, short chain acid consumption through glyoxylate cycle was predicted suggesting, a complex process. It has to be taken into account that the analysis performed in this work was based on a 16S rRNA gene approach and has several limitations, such as bias in the PCR and the errors associated with the OTUs classification method. Moreover, this analysis was performed using DNA, and the activity of the microorganisms detected is not guaranteed. Therefore, the results presented should be taken as a first step, and further analysis should be carried out to fully understand the complexity of these systems. These results highlight the need of a deeper understanding of microbial processes in this type of systems in order to design control strategies and look for novel applications. For technical reasons, only two biological replicates were made in this study. Since the results for the two replicas differed, some hypotheses that emerge from the analysis should be elucidated with further biological replicates in future works.
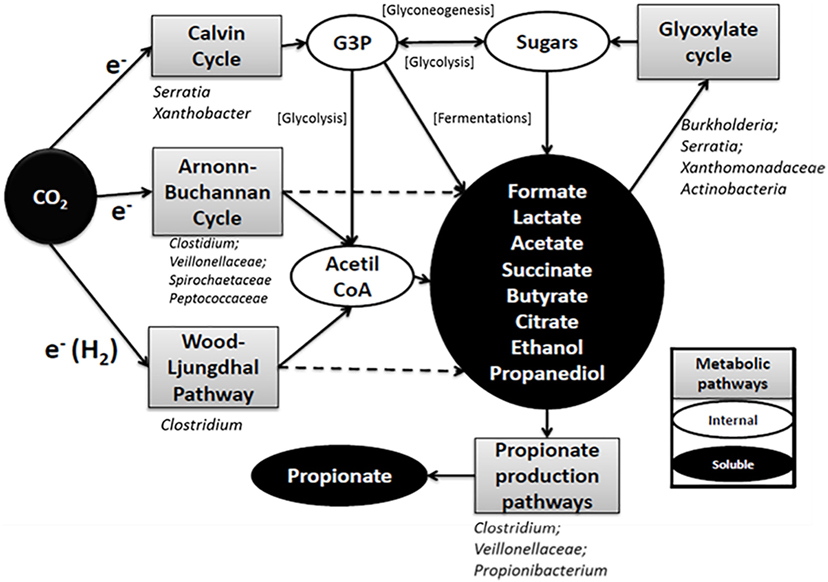
Figure 6. General scheme of the metabolic pathways involved in the production of organic compounds in the electrosynthesis cells according to PICRUSt analysis. Bacterial groups included under the pathway boxes are groups of microorganisms who contribute to the predicted genes in the PICRUSt analysis according to the operational taxonomic units classification. Some groups of microorganisms contributed to the abundance of particular genes but their abundance in the community was less than 1% (Table S1 in Data Sheet 2 in Supplementary Material).
In the last years, intense efforts have been done to improve the variety and quantity of products obtained in MECs with mixed cultures, as well as to elucidate the mechanisms of EET (Bajracharya et al., 2017). Elucidating EET mechanisms escapes the aim of this work, but our results have shown that a better MEC performance when the applied potential allowed electrochemical production of molecular hydrogen (Period 4). This fact allows us to speculate that electrochemically produced hydrogen served as electron shuttle for a Clostridium genera microorganism (OTU 960) that probably performs WLP using a MET mechanism. However, we cannot rule out the coexistence of DET in the systems, since both experimental devices showed organic compounds production at lower potentials in absolute terms (Period 1). This could be supported by previous reports that prove that some gram positive microorganisms have the capability to perform the DET mechanism (Choi and Sang, 2016). Improving experimental strategies in the future will allow elucidating the predominating EET mechanisms in this process.
However, there are very few works that emphasize on the knowledge of the metabolic pathways involved, in the trophic interactions between the microorganisms involved in the process based on the primary production of organic compounds from CO2. This work contributes, together with the works of Marshall et al. (2017) and Arends et al. (2017), with different approaches to start to elucidate the complex intra or interspecies interactions, demonstrating metabolic pathways and possible products derived from currently unidentified metabolic and trophic interactions. Deepening into the biocatalyic processes present in these systems will contribute to develop the potential to exploit metabolic pathways and produce previously unexplored products.
Likewise, the understanding of the role of microorganisms present in these systems will provide, in the future, indicators of the functional status of this type of systems.
Conclusion
A mixture of volatile organic compounds was produced from CO2 and electricity. Although the experiments were performed in similar conditions different behaviors were observed. Whereas a complex mixture of organic compounds was produced in cell A, only acetic and formic acids were produced in cell B. The differences between the performances of the cells were successfully explained through the analysis of the microbial communities present in the cathode biofilm and in the bulk solution.
Using the PICRUSt tool, three different metabolic pathways involved in carbon dioxide fixation were predicted. While the Calvin cycle was observed during the whole experiment, the WLP and the ABC predominated in the period with the highest CE and product diversification. Different pathways for propionate production coexist in these artificial environments.
Microorganisms that could indicate low performance were found, such as Burkholderia genus or the pathway such as glyoxylate cycle, but its detrimental role is relative regarding the target product of the system. These microorganisms might help to produce different highly reduced organic compounds in MECs.
The knowledge of the metabolic pathways present in MECs provides a better understanding about the biochemical reactions occurring and which products are feasible to achieve in this kind of systems.
Author Contributions
JW assembled the experimental devices, executed the operations with the experimental devices, performed all the physicochemical, electrochemical and microbiological tests, analyzed, and integrated the results and wrote the manuscript. EF made the modified carbon felt anodes, contributed with the experimental design, collaborated in analytical workflow, discussed the results, and collaborated in the manuscript writing. PB-V contributed to the experimental design, collaborated in the analytical workflow, discussed the results, and collaborated in the manuscript writing. AC contributed to the microbial community analysis with microbial ecology tools, discussed the results, and collaborated in the manuscript writing. CE directed the analysis of microbial communities, discussed the results, and collaborated with the writing of the manuscript. MB contributed with the experimental design, discussed the results, and collaborated in the manuscript writing. JC advised in the experimental procedures, discussed the results, and critically read the manuscript. SP designed and directed the experiments and collaborated in manuscript writing.
Conflict of Interest Statement
The authors declare that the research was conducted in the absence of any commercial or financial relationships that could be construed as a potential conflict of interest.
Acknowledgments
This research was financially supported by the Spanish Government (CTQ 2014-53718-R) and the National Agency of Research and Innovation of Uruguay (ANII; FSE6437 and FSE102488). JW was funded by the ANII-PhD grant (SNB). LEQUIA has been recognized as a consolidated research group by the Catalan Government under the code 2014-SGR-1168. The authors also wish to thank Dr. Hector Romero for a critical reading of the manuscript.
Supplementary Material
The Supplementary Material for this article can be found online at https://www.frontiersin.org/articles/10.3389/fenrg.2018.00015/full#supplementary-material.
Footnotes
- ^http://greengenes.lbl.gov (Accessed: September, 2015).
- ^http://www.genome.jp/kegg/ (Accessed: September, 2015).
- ^www.ncbi.nlm.nih.gov (Accessed: September, 2015).
References
Arends, J. B. A., Patil, S. A., Roume, H., and Rabaey, K. (2017). Continuous long-term electricity-driven bioproduction of carboxylates and isopropanol from CO2 with a mixed microbial community. J. CO2 Util. 20, 141–149. doi: 10.1016/j.jcou.2017.04.014
Bajracharya, S., Srikanth, S., Mohanakrishna, G., Zacharia, R., Strik, D. P. B. T. B., and Pant, D. (2017). Biotransformation of carbon dioxide in bioelectrochemical systems: state of the art and future prospects. J. Power Sources 356, 256–273. doi:10.1016/j.jpowsour.2017.04.024
Batlle-Vilanova, P., Puig, S., Gonzalez-Olmos, R., Vilajeliu-Pons, A., Bañeras, L., Balaguer, M. D., et al. (2014). Assessment of biotic and abiotic graphite cathodes for hydrogen production in microbial electrolysis cells. Int. J. Hydrogen Energy 39, 1297–1305. doi:10.1016/j.ijhydene.2013.11.017
Batlle-Vilanova, P., Ganigué, R., Ramió-Pujol, S., Bañeras, L., Jiménez, G., Hidalgo, M., et al. (2017). Microbial electrosynthesis of butyrate from carbon dioxide: production and extraction. Bioelectrochemistry 117, 57–64. doi:10.1016/j.bioelechem.2017.06.004
Batlle-Vilanova, P., Puig, S., Gonzalez-Olmos, R., Dolors Balaguer, M., and Colprim, J. (2016). Continuous acetate production through microbial electrosynthesis from CO2 with microbial mixed culture. J. Chem. Technol. Biotechnol. 91(4), 921–927. doi:10.1002/jctb.4657
Berg, J. M., Tymoczko, J. L., and Stryer, L. (2002). “Section 17.4 The glyoxylate cycle enables plants and bacteria to grow on acetate,” in Biochemistry, 5th Edn (New York: W H Freeman), 723–725.
Bharti, R. K., Srivastava, S., and Thakur, I. S. (2014). Proteomic analysis of carbon concentrating chemolithotrophic bacteria Serratia Sp. for sequestration of carbon dioxide. PLoS ONE 9:e91300. doi:10.1371/journal.pone.0091300
Breznak, J. A. (2006). “The Genus Sporomusa,” in The Prokaryotes, eds M. Dworkin, S. Falkow, E. Rosenberg, KH. Schleifer, and E. Stackebrandt, (New York, NY: Springer US), 991–1001.
Caporaso, J. G., Kuczynski, J., Stombaugh, J., Bittinger, K., Bushman, F. D., Costello, E. K., et al. (2010). QIIME allows analysis of high-throughput community sequencing data. Nat. Methods 7, 335–336. doi:10.1038/nmeth0510-335
Choi, O., and Sang, B. I. (2016). Extracellular electron transfer from cathode to microbes: application for biofuel production. Biotechnol. Biofuels 9, 11. doi:10.1186/s13068-016-0426-0
Coenye, T., Falsen, E., Hoste, B., Ohlen, M., Goris, J., Govan, J., et al. (2000). Description of Pandoraea Gen. Nov. with Pandoraea apista Sp. Nov., Pandoraea pulmonicola Sp. Nov., Pandoraea pnomenusa Sp. Nov., Pandoraea sputorum Sp. Nov. and Pandoraea norimbergensis Comb. Nov. Int. J. Syst. Evol. Microbiol. 50, 887–899. doi:10.1099/00207713-50-2-887
Edgar, R. C. (2010). Search and clustering orders of magnitude faster than BLAST. Bioinformatics 26, 2460–2461. doi:10.1093/bioinformatics/btq461
Evans, M. C., Buchanan, B. B., and Arnon, D. I. (1966). A new ferredoxin-dependent carbon reduction cycle in a photosynthetic bacterium. Proc. Natl. Acad. Sci. U.S.A. 55, 928–934. doi:10.1073/pnas.55.4.928
Ganigué, R., Puig, S., Batlle-Vilanova, P., Balaguer, M. D., and Colprim, J. (2015). Microbial electrosynthesis of butyrate from carbon dioxide. Chem. Commun. 51, 3235–3238. doi:10.1039/C4CC10121A
Garrity, G. M., Bell, J. A., and Lilburn, T. (2005). “Class II. Betaproteobacteria Class. Nov,” in Bergey’s Manual® of Systematic Bacteriology eds D.J. Brenner, N.R. Krieg, and J.T. Staley (Boston, MA: Springer US), 609–620.
Goodfellow, M. (2012). “Phylum XXVI. Actinobacteria Phyl. Nov,” in Bergey’s Manual of Systematic Bacteriology, Vol. 3, 33–34.
Hamady, M., Lozupone, C., and Knight, R. (2010). Fast UniFrac: facilitating high-throughput phylogenetic analyses of microbial communities including analysis of pyrosequencing and PhyloChip data. ISME J. 4, 17–27. doi:10.1038/ismej.2009.97
Herter, S., Fuchs, G., Bacher, A., and Eisenreich, W. (2002). A bicyclic autotrophic CO2 fixation pathway in Chloroflexus aurantiacus. J. Biol. Chem. 277, 20277–20283. doi:10.1074/jbc.M201030200
Hu, J., Wang, L., Zhang, S., Xi, X., Le, Y., Fu, X., et al. (2015). Interactions between autotrophic and heterotrophic strains improve CO2 fixing efficiency of non-photosynthetic microbial communities. Appl. Biochem. Biotechnol. 176, 1459–1471. doi:10.1007/s12010-015-1657-4
Imhoff, J. F. (2005). “Enterobacteriales,” in Bergey’s Manual® of Systematic Bacteriology, eds D. J. Brenner, N. R. Krieg, J. T. Staley, G. M. Garrity, D. R. Boone, P. De Vos, et al. (Boston, MA: Springer US), 587–850.
Jung, H.-M., Ten, L. N., Kim, K.-H., An, D. S., Im, W.-T., and Lee, S.-T. (2009). Dyella ginsengisoli Sp. Nov., isolated from soil of a ginseng field in South Korea. Int. J. Syst. Evol. Microbiol. 59, 460–465. doi:10.1099/ijs.0.64514-0
Langille, M. G., Zaneveld, J., Caporaso, J. G., McDonald, D., Knights, D., Reyes, J. A., et al. (2013). Predictive functional profiling of microbial communities using 16S rRNA marker gene sequences. Nat. Biotechnol. 31, 814–821. doi:10.1038/nbt.2676
Ljungdahl, L. G. (1986). The autotrophic pathway of acetate synthesis in acetogenic bacteria. Annu. Rev. Microbiol. 40, 415–450. doi:10.1146/annurev.mi.40.100186.002215
Lugg, H., Sammons, R. L., Marquis, P. M., Hewitt, C. J., Yong, P., Paterson-Beedle, M., et al. (2008). Polyhydroxybutyrate accumulation by a Serratia Sp. Biotechnol. Lett. 30, 481–491. doi:10.1007/s10529-007-9561-9
Marshall, C. W., Ross, D. E., Fichot, E. B., Norman, R. S., and May, H. D. (2012). Electrosynthesis of commodity chemicals by an autotrophic microbial community. Appl. Environ. Microbiol. 78, 8412–8420. doi:10.1128/AEM.02401-12
Marshall, C. W., Ross, D. E., Fichot, E. B., Norman, R. S., and May, H. D. (2013). Long-term operation of microbial electrosynthesis systems improves acetate production by autotrophic microbiomes. Environ. Sci. Technol. 47, 6023–6029. doi:10.1021/es400341b
Marshall, C. W., Ross, D. E., Handley, K. M., Weisenhorn, P. B., Edirisinghe, J. N., Henry, C. S., et al. (2017). Metabolic reconstruction and modeling microbial electrosynthesis. Sci. Rep. 7, Article number: 8391. doi:10.1038/s41598-017-08877-z
Mikkelsen, M., Jørgensen, M., and Krebs, F. C. (2010). The teraton challenge. A review of fixation and transformation of carbon dioxide. Energy Environ. Sci. 3, 43–81. doi:10.1039/B912904A
Mira, N. P., Madeira, A., Sílvia Moreira, A., Coutinho, C. P., and Sá-Correia, I. (2011). Genomic expression analysis reveals strategies of Burkholderia cenocepacia to adapt to cystic fibrosis patients’ airways and antimicrobial therapy. PLoS ONE 6(12): e28831. doi:10.1371/journal.pone.0028831
Nevin, K. P., Woodard, T. L., and Franks, A. E. (2010). Microbial electrosynthesis: feeding microbes electricity to convert carbon dioxide and water to multicarbon extracellular organic. Am. Soc. Microbiol. 1, 1–4. doi:10.1128/mBio.00103-10.Editor
Octavia, S., and Lan, R. (2014). “The family Enterobacteriaceae,” in The Prokaryotes eds E. Rosenberg, E. F. DeLong, S. Lory, E. Stackebrandt and F. Thompson (Berlin, Heidelberg: Springer), 226–273.
Oren, A. (2014). “The family Xanthobacteraceae,” in The Prokaryotes eds E. Rosenberg, E. F. DeLong, S. Lory, E. Stackebrandt, and F. Thompson (Berlin, Heidelberg: Springer), 709–726.
Pujalte, M. J., Lucena, T., Ruvira, M. A., Arahal, D. R., and Macián, M. C. (2014). “The family Rhodobacteraceae,” in The Prokaryotes eds E. Rosenberg, E. F. DeLong, S. Lory, E. Stackebrandt, and F. Thompson (Berlin, Heidelberg: Springer), 439–512.
Rabaey, K., Girguis, P., and Nielsen, L. K. (2011). Metabolic and practical considerations on microbial electrosynthesis. Curr. Opin. Biotechnol. 22, 371–377. doi:10.1016/j.copbio.2011.01.010
Raes, S. M. T., Jourdin, L., Buisman, C. J. N., and Strik, D. P. B. T. B. (2017). Continuous long-term bioelectrochemical chain elongation to butyrate. ChemElectroChem 4, 386–395. doi:10.1002/celc.201600587
Reichardt, N., Duncan, S. H., Young, P., Belenguer, A., McWilliam, LC, Scott, K. P., et al. (2014). Phylogenetic distribution of three pathways for propionate production within the human gut microbiota. ISME J. 8, 1323–1335. doi:10.1038/ismej.2014.14
Schleifer, K. H. (2009). “Phylum XIII. Firmicutes Gibbons and Murray 1978, 5 (Firmacutes [sic] Gibbons and Murray 1978, 5),” in Bergey’s Manual® of Systematic Bacteriology, ed. P. De Vos (New York, NY: Springer), 734–828.
Sharma, M., Bajracharya, S., Gildemyn, S., Patil, S. A., Alvarez-Gallego, Y., Pant, D., et al. (2014). A critical revisit of the key parameters used to describe microbial electrochemical systems. Electrochim. Acta 140, 191–208. doi:10.1016/j.electacta.2014.02.111
Sim, K., Cox, M. J., Wopereis, H., Martin, R., Knol, J., Li, M. S., et al. (2012). Improved detection of bifidobacteria with optimised 16S rRNA-gene based pyrosequencing. PLoS ONE 7:e32543. doi:10.1371/journal.pone.0032543
Tamura, K., Peterson, D., Peterson, N., Stecher, G., Nei, M., and Kumar, S. (2011). MEGA5: molecular evolutionary genetics analysis using maximum likelihood, evolutionary distance, and maximum parsimony methods. Mol. Biol. Evol. 28, 2731–2739. doi:10.1093/molbev/msr121
Tholozan, J. L., Touzel, J. P., Samain, E., Grivet, J. P., Prensier, G., and Albagnac, G. (1992). Clostridium neopropionicum Sp. Nov., a strict anaerobic bacterium fermenting ethanol to propionate through acrylate pathway. Arch. Microbiol. 157, 249–257. doi:10.1007/BF00245158
Tremblay, P. L., Angenent, L. T., and Zhang, T. (2017). Extracellular electron uptake: among autotrophs and mediated by surfaces. Trends Biotechnol. 35, 360–371. doi:10.1016/j.tibtech.2016.10.004
Van Acker, H., Sass, A., Bazzini, S., De Roy, K., Udine, C., Messiaen, T., et al. (2013). Biofilm-grown Burkholderia cepacia complex cells survive antibiotic treatment by avoiding production of reactive oxygen species. PLoS ONE 8:e58943. doi:10.1371/journal.pone.0058943
Keywords: bioelectrochemical systems, carbon fixation pathways, 16S rRNA gene community analysis, PICRUSt, metagenome prediction
Citation: Wenzel J, Fiset E, Batlle-Vilanova P, Cabezas A, Etchebehere C, Balaguer MD, Colprim J and Puig S (2018) Microbial Community Pathways for the Production of Volatile Fatty Acids From CO2 and Electricity. Front. Energy Res. 6:15. doi: 10.3389/fenrg.2018.00015
Received: 08 December 2017; Accepted: 02 March 2018;
Published: 13 April 2018
Edited by:
Youngjune Jason Park, Gwangju Institute of Science and Technology (GIST), South KoreaReviewed by:
Francisco Jesus Fernandez Morales, Universidad de Castilla-La Mancha, SpainLucinda Elizabeth Doyle, Nanyang Technological University, Singapore
Copyright: © 2018 Wenzel, Fiset, Batlle-Vilanova, Cabezas, Etchebehere, Balaguer, Colprim and Puig. This is an open-access article distributed under the terms of the Creative Commons Attribution License (CC BY). The use, distribution or reproduction in other forums is permitted, provided the original author(s) and the copyright owner are credited and that the original publication in this journal is cited, in accordance with accepted academic practice. No use, distribution or reproduction is permitted which does not comply with these terms.
*Correspondence: Jorge Wenzel, jwenzel@iibce.edu.uy