Does the Circular Economy Grow the Pie? The Case of Rebound Effects From Smartphone Reuse
 Tamar Makov
 David Font Vivanco
- 1School of Forestry and Environmental Studies, Yale University, New Haven, CT, United States
- 2UCL Institute for Sustainable Resources, University College London, London, United Kingdom
The environmental benefits of the circular economy (CE) are often taken for granted. There are, however, reasons to believe that rebound effects may counteract such benefits by increasing overall consumption or “growing the pie.” In this study, we focus on two main rebound mechanisms: (1) imperfect substitution between “re-circulated” (recycled, reused, etc.) and new products and (2) re-spending due to economic savings. We use the case study of smartphone reuse in the US to quantify, for the first time, rebound effects from reuse. Using a combination of life cycle assessment, sales statistics, consumer surveying, consumer demand modeling, and environmentally-extended input-output analysis, we quantify the magnitude of this rebound effect for life-cycle greenhouse gas emissions. We find a rebound effect of 29% on average, with a range of 27–46% for specific smartphone models. Moreover, when exploring how rebound might play out in other regions and under different consumer behavior patterns, we find that rebound effects could be higher than 100% (backfire effect). In other words, we estimate that about one third, and potentially the entirety, of emission savings resulting from smartphone reuse could be lost due to the rebound effect. Our results thus suggest that there are grounds to challenge the premise that CE strategies, and reuse in particular, always reduce environmental burdens.
Introduction
The circular economy (CE) aims to minimize resource use and emissions by slowing, closing, and narrowing material and energy flow loops (Bocken et al., 2016). Key CE strategies include green design, remanufacturing, recycling, and reuse (Geissdoerfer et al., 2017). While some evidence supports the environmental benefits of the CE (Ghisellini et al., 2016; Cooper and Gutowski, 2017) concerns have been raised regarding potential undesirable outcomes of a CE. These include the physical and economic limits of recycling activities (Reck and Graedel, 2012; Allwood, 2014) the environmental desirability of reused products (Gutowski et al., 2011; Skelton and Allwood, 2013; Ovchinnikov et al., 2014; Zink et al., 2014), and the so-called rebound effect (Zink and Geyer, 2017). Rebound effects commonly relate to behavioral and systemic responses to technical change, such as the increased energy demand in response to energy efficiency improvements (Jevons, 1865; Khazzoom, 1980; Brookes, 1990). More broadly, rebound effects can be associated with changes in environmental efficiency, such as less resource inputs for delivering a given function (Font Vivanco et al., 2016b).
CE strategies can lead to rebound via re-spending effects from price reductions and/or by failing to effectively compete with primary production (imperfect substitution) (Zink and Geyer, 2017), the result of both being an overall increase in demand and environmental burdens. Regarding re-spending effects, CE strategies, such as recycling and reuse, can lower the costs of products, parts or materials. For example, prices of used goods (e.g., second hand or remanufactured) are typically lower than their new counterparts. This is true across product categories, and holds even in cases where the used units are functionally equivalent to the new ones (e.g., refurbished electronics) (Thomas, 2003; Frota Neto et al., 2016; Makov et al., submitted). Much like any other economic saving, lower expenditure means that consumers increase their effective income and thus have additional spending power. Consumers typically react to this by purchasing additional goods and services, investments and/or savings.
CE strategies can also lead to imperfect substitution when these do not avoid demand and production of new product units on a 1:1 basis. For example, while it appears that firms and governments believe that sales of used products cannibalize sales of new ones, research suggests that such displacement is likely limited (Thomas, 2003; Guide and Li, 2010; Frota Neto et al., 2016; Cooper and Gutowski, 2017). As a result, the production of new units is only partly displaced by CE products and thus the overall production increases (Thomas, 2003; Ghose et al., 2006; Geyer and Doctori Blass, 2010; Guide and Li, 2010). In fact, some studies suggest that reuse may stimulate new production, for example by allowing consumers to sell their older products and use the earnings toward the purchase of new units (Waldman, 2003; Cooper and Gutowski, 2017). While such surplus consumption might have social benefits (Ovchinnikov et al., 2014; Raz et al., 2017) it is likely to increase overall environmental burdens.
While theoretical and empirical research on rebound effects is extensive, only few studies have specifically examined CE-related rebound. Scheepens et al. (2016) analyzed the environmental implications of CE business models, and discussed the possibility that such models would also consider re-spending rebound effects. Zink and Geyer (2017) focused on CE-related rebound effects, and stressed the importance of economic effects, such as re-spending and substitution effects, in shaping the outcome of CE strategies. The authors suggested that, while increasing the circularity of economic flows might displace some primary production, CE strategies will most likely result in increased overall production. Similarly, Ovchinnikov et al. (2014), demonstrate that, under certain economic conditions, product reuse could increase overall environmental burdens by facilitating higher demand for new energy intensive services (in their case, cloud computing). While these and other studies, such as those from Korhonen et al. (2018), Thomas (2003), and Ghose et al. (2006), highlight the possibility that rebound effects may offset potential benefits of transitioning to a CE, to the best of our knowledge, no study offers quantitative estimates of the rebound's magnitude. In some cases, limitations in method design hamper capturing such effects, for instance when assuming constant GDP and 1:1 substitution (Cooper and Gutowski, 2017), or when the life cycle environmental consequences are ignored (Font Vivanco and van der Voet, 2014). There is thus a need to holistically assess whether, and to what extent, rebound effects undermine the environmental performance of CE strategies.
In this paper, we aim to address this gap by quantifying rebound effects related to product reuse. We use the case of reused smartphones sold through second-hand markets in the United States. According to the Ellen MacArthur Foundation (2013), reuse that involves little repair, remanufacturing or alteration of products represents one of the most environmentally beneficial paths of the CE. Reuse is indeed a key CE strategy (Bocken et al., 2016), and it is commonly understood as the extension of an existing product's life through, for instance, green design, repair, reconditioning, technical upgrading, market solutions, and/or a combination of these (Stahel, 1994; Cooper and Gutowski, 2017; Makov et al., submitted). While the environmental benefits from reuse have been widely praised, such benefits have also been put into question (Gutowski et al., 2011; Skelton and Allwood, 2013; Ovchinnikov et al., 2014; Zink et al., 2014). For one, reusing products might limit the ability to benefit from technological improvements incorporated into newer models (e.g., improved energy efficiency). On the other hand, it remains unclear to what extent pre-owned products (e.g., used and refurbished) actually displace new products and reduce demand for primary production. Past work suggests that consumers tend to view pre-owned products as inferior compared to their new counterparts, and may even feel strong aversion and disgust toward them (Abbey et al., 2015, 2017). As a result, for a sizeable segment of consumers (more than 35% by some estimates) pre-owned products are not even “non-perfect substitutes” for new products (Guide and Li, 2010; Abbey et al., 2015). Specifically, in the case of mobile phones, estimates suggest that, at best, purchase of pre-owned phones prevents up to 5% of new unit sales (Zink et al., 2014).
While some consumers would not consider a pre-owned product at any discount rate, others are more indifferent between new and pre-owned products and would consider switching from one to the other for an appropriate discount (Guide and Li, 2010; Abbey et al., 2015). Indeed, past work demonstrates that willingness to pay (WTP) for pre-owned products is typically lower than that of new identical products, with the discount magnitude varying based on product condition. While remanufactured products and those described in “like new condition” are sold at discounts of 15–21%, products in worse condition may entail a larger discount (Ghose et al., 2006; Guide and Li, 2010; Frota Neto et al., 2016; Makov et al., submitted). Abbey et al. (2017) link this lower WTP for pre-owned goods to the consumers' belief that used products are more likely to have functional and/or cosmetic defects. Thus, consumers who are open to purchasing second-hand goods balance out cost savings (i.e., discount compared to the price of new goods) with perceived risk (Abbey et al., 2015). Such cost saving could however lead to re-spending rebound effects.
Addressing reuse rebound effects is critical for assessing the full environmental benefits of reuse and CE strategies in general (Zink and Geyer, 2017). In this paper, we examine some of the unintended environmental consequences of the CE by quantifying rebound effects from both imperfect substitution and re-spending effects arising from direct market reuse of smartphones (i.e., resale via a secondary market). We use official life cycle assessment (LCA) reports as a basis for comparative environmental assessment. We then use data for over 6,500 sales of used Apple smartphones on eBay.com to calculate economic savings based on actual resale prices. The associated re-spending rebound effects are then calculated using a household demand model and environmentally-extended input output analysis. We then combine these results with survey data on the degree of substitution between new and used smartphones to calculate the effects of imperfect substitution. The results are presented in terms of life-cycle greenhouse gas emissions (GHG) or carbon footprint, a widespread indicator of environmental sustainability which is highly correlated with other indicators such as ecological and material footprints (Simas et al., 2017).
Materials and Methods
We first describe in section Case Study, Data Collection, and Modeling Assumptions the case study, modeling assumptions, and the data sources for the LCA and price data. Following, section Environmental Rebound Effect presents the method to calculate the rebound effect from reusing smartphones.
Case Study, Data Collection, and Modeling Assumptions
The case study examines the environmental implications of smartphone reuse in the US. Specifically, we focus exclusively on Apple smartphones since it is the only major manufacturer to publish official LCA reports for specific models (e.g., iPhone 6 128GB). Apple presents results in terms of absolute GHG emissions for a specific model and capacity, including a breakdown of relative contribution attributed to each life cycle stage, namely extraction, production, use, transport, end of life (EoL, assumed to be recycling). Apple does not, however, fully disclose its assumptions, life cycle inventory data, nor information on the environmental impact methods used to estimated GHG emissions.
To allow for substitution between used and new devices, we limit our analysis to four iPhone models that were available for sale directly from the manufacturer during the time of data collection, namely the iPhone 6, iPhone 6 Plus, iPhone 6s, and iPhone 6s Plus models. Estimates for GHG emissions related to each of the four iPhone models were taken from Apple's official LCA reports (https://www.apple.com/environment/reports).
Retail price data for the four iPhone models corresponds to official Apple prices at the time of product launch (www.apple.com). Price data for used units of the same models was collected directly from the eBay website (www.ebay.com) using a software agent over a 10-day period in April 2016. The database contained all sales of used iPhone 6, iPhone 6 Plus, iPhone 6s, and iPhone 6s Plus, all with a capacity of 128GB, completed through the platform within US borders, between January and March 2016. Listings that offered more than one smartphone for sale, or those that described items as broken, in need of repair, and the like were excluded, leaving 6,576 units for analysis. For each listing or sale, the sale price, shipping cost and specific phone model were extracted from the title, text description, and/or related HTML file.
To quantify the life cycle GHG emissions associated with each model, both new and used, we applied the following assumptions in accordance with the ISO 14040:2006 standard. First, in accordance with Apple's LCA reports, we assume that an iPhone's overall lifespan is 36 months. Second, for our comparison, we define the functional unit as owning and using a specific iPhone model for 12 months. Third, we estimate resale-related transportation emissions on the basis of shipping costs, using GHG emissions coefficients from the “post and telecommunications” sector from EXIOBASE 3 (see section Re-spending Effect). Fourth, the alternative to a given used model corresponds to its new counterpart in the case of perfect substitution, and a mix of alternatives (based on a consumer survey) in the case of imperfect substitution (see section Imperfect Substitution Effect). Following the mainstream approach, we assume that demand for new product is the main driver for primary production. Under this prism, reuse merely extends the product's use phase, yet does not affect any of the other lifecycle stages, since these would have accrued anyway (Zink et al., 2014; Frota Neto et al., 2016; Cooper and Gutowski, 2017). Hence, we assume that primary production, transport, and EoL of each phone is associated with its first use (i.e., to a new unit sale), and attribute only the burdens related to the phones' secondary life (i.e., collection, redistribution, secondary use phase, and rebound) to reuse. Since our case study focuses on smartphones sold “as is,” in what sellers define as “used” condition, we assume these devices did not undergo any major alterations or remanufacturing prior to resale.
Environmental Rebound Effect
To refer to rebound effects that go beyond direct energy use and technical efficiency changes relating to the input/output ratio, we speak of the “environmental rebound effect” (ERE) (Font Vivanco et al., 2016b). The ERE is a broader interpretation of the traditional rebound effect, which allows consideration of multiple environmental pressures, the life cycle of products, and broader changes in environmental efficiency (Font Vivanco and van der Voet, 2014). The ERE concept is more appropriate for our case study because (1) the reuse of smartphones goes beyond a simple technical change in the ratio between inputs (e.g., energy) and outputs (use of a given smartphone), and (2) we express the rebound effect in terms of life cycle GHG emissions. We calculate the ERE through the following formula (Font Vivanco et al., 2014):
Where PS are the potential environmental savings (in our case, expressed as CO2-equivalent [CO2e] emissions) without considering systemic and behavioral responses (e.g., re-spending) and AS are the actual savings when including such responses. The ERE can thus be understood as the percentage of potential environmental savings that are offset.
We further assume that the rebound effect emanates only from two independent effects: (1) a re-spending effect associated with the economic savings associated with buying a second-hand smartphone (described in section Re-spending Effect), and (2) a substitution effect from the failure of reused smartphones to fully substitute new smartphones (described in section Imperfect Substitution Effect). We do not consider other rebound effects, for instance those from changes in socio-psychological costs (Santarius and Soland, 2018) or macro-economic variables (Jenkins et al., 2011).
Re-spending Effect
To calculate the re-spending effect, we use a single re-spending model which treats all consumption categories equally (Murray, 2013). We therefore do not differentiate between the direct (additional demand for smartphones) and indirect (additional demand for other goods and services) effects. We further assume a fixed individual income and no long-term savings, so all saved money is spent. Re-spending is approached through marginal budget shares (w), or the share of total savings that will be allocated to each consumption category i (e.g., food or housing). The w are calculated using the linear specification of the Almost Ideal Demand System (AIDS), a popular consumer demand model introduced by Deaton and Muellbauer (1980) with properties that makes it preferable to competing models (Deaton and Muellbauer, 1980; Chitnis et al., 2012). Using the AIDS model, the w for a given time period can be calculated as
where x is total expenditures, P is defined here as the Stone's price index, p is the price of a given category and α (constant coefficient), β (slope coefficient associated with total expenditure) and γ (slope coefficient associated with price) are the unknown parameters. The Stone's price index is defined as
Additionally, and in order to comply with consumer demand theory, three constraints are imposed: adding-up, homogeneity and symmetry (Deaton and Muellbauer, 1980).
Data on personal consumption expenditure (PCE) and price indices for PCE by type of product for the period 1997–2016 and for the US was obtained via the Bureau of Economic Analysis (https://www.bea.gov/national/consumer_spending.htm). From all the reported product categories, 17 were selected for computational ease (see Table S1 in Supplementary Material).
Once the MBS are calculated, the next step is to determine the life cycle (footprint) GHG emissions coefficients c (emissions per economic unit), so that GHG emissions from re-spending (e) are calculated as
where g is the total economic savings from purchasing a reused smartphone (see section Case Study, Data Collection, and Modeling Assumptions).
The GHG emission coefficients are calculated using the standard demand-pull Leontief input-output model as (Miller and Blair, 2009)
where s is an 1 × n vector of direct GHG emissions per unit of economic output, being n the number of industries z, A is an n × n matrix of technical coefficients indicating the inter-industry inputs required to supply one unit of output, I is an n × n identity matrix, y is a given n × 1 final demand vector, and L is the Leontief inverse containing the multipliers for the direct plus indirect inter-industry inputs required to satisfy one unit of final demand. In this case, y contains only the final domestic demand of US households for product i (being i the output of the corresponding industry z).
All the necessary input-output data was obtained from the environmentally-extended global multi-regional input-output database EXIOBASE 3 (Stadler et al., 2018) for the year 2014, the latest year available. Because of the mismatch between the BEA's Personal Consumption Expenditure (PCE) classification system and EXIOBASE classification, a correspondence was built between the two when necessary (see Table S2 in Supplementary Material). For example, BEA's ‘household utilities’ corresponds in this case to the distribution of electricity, gas, water, etc. in EXIOBASE. Consequently, y was built by means of weighting according to final demand shares. GHG emissions were calculated according to global warming potential characterisation factors for the time horizon 100 years (GWP100) described by the IPCC (Pachauri and Reisinger, 2007).
Imperfect Substitution Effect
Used products could, in theory, substitute new products and reduce demand for primary production. In the case of smartphones, however, research suggests that it is highly unlikely that such substitution occurs on a 1:1 basis (Geyer and Doctori Blass, 2010; Zink et al., 2014; Cooper and Gutowski, 2017). Specifically, it is suggested that the existence of a secondary market can lead to an overall increase in consumption resulting in a consumption surplus, with consumers purchasing used units in addition to new ones. Therefore, assuming that each used phone sale displaces the production of one new phone would result in overestimation of the impact avoided due to reuse.
Moreover, in practice, consumers might view a mix of alternative used and new units as reasonable substitutes for the used smartphone, and not only the exact same model new. For example, a consumer interested in purchasing a used iPhone 6s, might not be interested in new devices at all, but consider both the new iPhone 6s and a used iPhone 6s Plus as potential alternatives to the preferred model. Since each of these alternatives incurs different GHG emissions, the avoided emissions associated with reuse would vary based on what the reused smartphone is assumed to be displacing (e.g., the purchase of a new smartphone, or the purchase of a different, used smartphone). Similarly, since each of the alternatives has a different price, the economic savings (and subsequently the effective income available to re-spend) would also change depending on the substitution assumptions.
Therefore, to better estimate avoided emissions, and the re-spending resulting from smartphone reuse, we conducted an online survey among consumers who stated they had previously bought a used smartphone (see Table S4 in Supplementary Material). Specifically, we asked participants what they would have done if the used phone they bought had not been available. The options were: (1) the same model new, (2) another cheaper new model, (3) another cheaper used model, (4) buy nothing, and (5) other. A total of 700 participants were recruited via the crowd sourcing platform Amazon MechanicalTurk, in exchange for a small monetary compensation. Out of the 700 participants who took our survey, 50.8% stated they had bought a used phone in the past. Out of those, all participants who failed an attention check and those who did not complete the survey were excluded leaving 341 (Mage = 33.1; Female−46.9%) cases for analysis. We then built on our survey results to formulate a substitution mix for each of the four iPhone models examined (see Table S5 in Supplementary Material).
Results
Our results show that the ERE from both re-spending and imperfect substitution entails a noteworthy reduction in the life cycle GHG emission savings resulting from reusing the selected iPhone models. As shown in Figure 1 (imperfect substitution results), the magnitude of the ERE is 29% on average (all models weighted by sales volume), and ranges from 27 to 46% for specific models. In other words, our results suggest that, in some cases, the ERE could offset nearly half of the benefits of smartphone reuse. As expected, the re-spending effect generates additional GHG emissions. Specifically, the reuse of the four iPhone models examined entails an average economic saving of $101, and up to $112 for a single model. Such savings generate on average about 24 kg CO2e, double the 12 kg CO2e associated with the smartphone's use phase. The higher impacts associated with re-spending are due to the fact that one dollar spent on marginal consumption entails 0.23 kg CO2e, while a dollar spent on a used phone entails only 0.02 kg CO2e. As a result, even such modest economic savings can exceed the relatively low use phase emissions of used phones. Moreover, a dollar spent on the mix of alternatives to purchasing a used phone (i.e., buying a new phone, buying another used phone, and buying nothing, weighted according to our survey results), is associated with 0.09 kg CO2e. Therefore, the avoided emissions of displacing these alternatives with a reused phone are relatively low, which means re-spending rebound can easily offset the benefits resulting from reuse. The higher emissions associated with re-spending are related mostly to purchases of food (6% from total marginal consumption and 25% from total emissions), nondurable goods (8 and 24%) and transportation services (3 and 7%) (see Table S3 in Supplementary Material for the complete set of results).
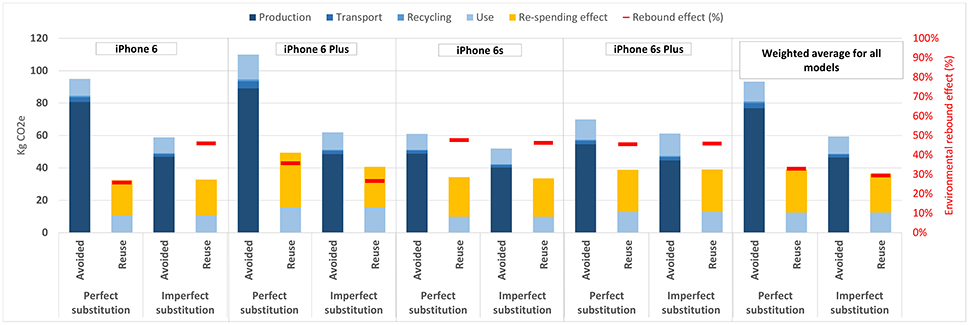
Figure 1. Life cycle greenhouse gas (GHG) emissions (in CO2e, left axis) and environmental rebound effect (in %, right axis) for smartphone reuse, by iPhone model and substitution scenario (perfect vs. imperfect). Perfect substitution scenario assumes 1:1 substitution ratio between used and new phones of identical model and make. Imperfect substitution assumes a mix of alternative substitutes (including new and used smartphones as well as avoided purchases) weighted by our survey results. “Reuse” emissions are those associated with reusing a smartphone, whereas “avoided” emissions are those associated with its alternative(s). GHG emissions are broken down according to the production, transport, recycling, and use phases. Re-spending corresponds to emissions resulting from the economic savings of purchasing a used smartphone instead of its corresponding alternative(s). The “average” model represents a weighted average of all four iPhone models by their eBay sales volume. The rebound effect is expressed as the % of GHG emission savings that are offset due to re-spending.
Our results also suggest that considering a mix of alternative substitutes (imperfect substitution) instead of a 1:1 substitution of new phones (perfect substitution) leads to a slight decrease in the ERE, from 33 to 29% on average. Hence, in this case, following the common approach of assuming perfect substitution between new and reused phones slightly overestimates the magnitude of the ERE. This is true on average but not for all models, as the iPhone 6 and 6sp result in larger ERE with imperfect substitution. In the case of the iPhone 6, the difference is striking, going from 26 (perfect substitution) to 78% (imperfect substitution). This increase in due to the fact that the re-spending effect is almost equal while the avoided emissions associated with the imperfect substitution alternative mix (see Equation 1) decrease considerably due to the substitution of new for used phones. These changes are partly explained by the savings associated with the alternative mix. While substituting a given used model with its new counterpart entails $114 saved on average, the alternative mix entails lower savings of $102. Specifically, according to our survey, only 20% of respondents prefer to buy the same model new, 38% prefer buying a new phone in the same price range ($57 saved), 36% prefer buying a cheaper used model ($37), and 6% would not buy any other model otherwise ($704).
Overall, these findings illustrate that the overall magnitude of the ERE, and ultimately whether the strategy of reusing smartphones yields environmental benefits, is largely driven by two key variables: the GHG emissions per dollar spent on marginal consumption and the avoided emissions associated with the alternatives to buying the used phone (e.g., buying new, buying nothing, etc.) Therefore, in the following subsection we further examine the sensitivity of the ERE to these two variables.
Sensitivity to Emissions From Marginal Consumption
Because our case study is based on data of used smartphones sold within US borders, we assumed that additional spending from economic savings corresponds to goods and services purchased within the US. It merits noting, however, that the GHG emissions per dollar spent on marginal consumption in the US (0.23 kg of CO2e) are significantly lower than the global average of 0.39 kg CO2e for marginal consumption from households. Thus, assessing re-spending rebound in another geographical context could yield significantly different results. To test this hypothesis, we replicate our analysis with imperfect substitution, using the marginal consumption emissions factor for the global economy (0.39 kg CO2e per economic unit) and China (0.19 kg CO2e), which is second only to the US in terms of iPhone sales (Richter, 2017). For China, we estimate the marginal expenditure through the average expenditure from the latest year available (i.e., 2016) (NBSC, 2018) due to the unavailability of the necessary data to run the proposed AIDS model. For the global economy, and also due to unavailability of data, we use US expenditure patterns.
The results of our sensitivity analysis demonstrate that the previously estimated ERE would change notably in response to changes in the marginal consumption GHG emissions factor used. As Figure 2 illustrates, the ERE would be about 50% for average global marginal spending and about 24% for China, namely a 68% increase and a 18% decrease, respectively, compared to the US-specific ERE. More importantly, the ERE for some models would be almost 80% (e.g., iPhone 6s for the global economy) and thus close to offset any benefits of avoided emissions.
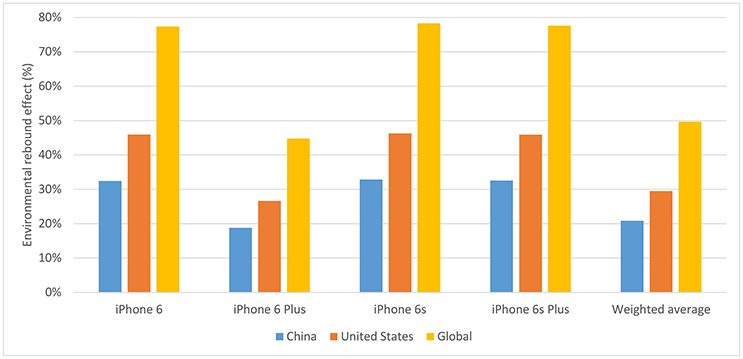
Figure 2. Environmental rebound effect (ERE) magnitude of reusing a smartphone for selected iPhone models and economies with imperfect substitution. The “average” model corresponds to a weighted average of all four iPhone models by their eBay sales volume. The ERE is expressed as the % of avoided GHG emission that are offset due to re-spending.
Sensitivity to the Mix of Alternatives
The composition of the alternative mix plays a key role in determining the magnitude of the ERE, since it affects both the amount of economic savings and the reference for avoided emissions. On the one hand, the amount of economic savings determines the additional emissions from re-spending and so the actual (i.e., considering consumer behavior) emission savings (numerator in Equation 1). That is, the less the actual savings, the higher the ERE. On the other hand, the reference of avoided emissions represents the baseline to which the ERE is measured against (denominator in Equation 1). That is, the lower the reference, the higher the ERE. To test the effects of changes in the mix of alternatives, we construct two scenarios and calculate the ERE for each. The scenarios are the following:
• 5% Displacement:
According to Zink et al. (2014), the purchase of used phones displaces production of new units only 5% of the time. In this context, we set the alternatives “cheaper new” and “same new” to a maximum of 5% from the total, keeping their original relative proportions. The remaining displacement is allocated to “cheaper used.” The new mix is thus: “cheaper new” (3%), “same new” (2%), “nothing” (6%), and “cheaper used” (89%).
• No Surplus Consumption:
As mentioned previously, research has shown that trade in used goods can result in an overall increase in consumption (Thomas, 2003; Ghose et al., 2006; Raz et al., 2017). Such surplus consumption suggests that, if prices and transaction costs in secondary markets were to become unattractive (i.e., as a result of the platform charging excessive commissions, or following regulatory changes), some consumers would refrain of buying the used good. Indeed, according to our survey, 18% of respondents bought a used smartphone not to be utilized as their main phone but as a secondary or “spare” phone (see Table S5 in Supplementary Material). In this scenario, we simulate a situation in which there is no surplus consumption. Consequently, no spare phones are bought, and the 18% of respondents that only bought the used phone as a spare, now “buy nothing.” The new mix is thus: “cheaper new” (29%), “same new” (17%), “nothing” (23%), and “cheaper used” (31%).
The results of our hypothetical scenarios illustrate that the ERE is very sensitive to the exact alternative mix chosen to represent consumer behavior and calculate imperfect substitution. As Figure 3 illustrates, in the “5 % displacement” scenario, the average ERE is 22% lower, while the “no surplus consumption” scenario increases the ERE by 108%. In the later, the increase in the ERE is largely driven by the notable rise in economic savings, mostly from consumers who avoid purchasing a used phone altogether and spend that income instead on marginal consumption. As noted previously, the embedded GHG emissions per dollar of the studied smartphones are relatively low, and so the additional marginal consumption can easily offset avoided emissions.
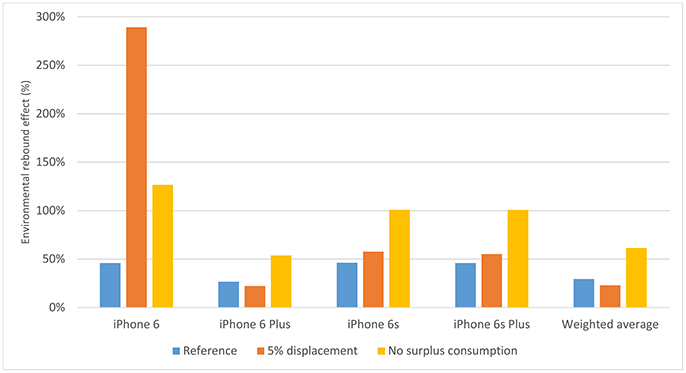
Figure 3. Environmental rebound effect (ERE) magnitude of reusing a smartphone for selected iPhone models and scenarios with imperfect substitution. The “average” model corresponds to a weighted average of all four iPhone models by their eBay sales volume. The ERE is expressed as the % of avoided GHG emission that are offset due to re-spending.
Specifically, the average second hand cost of the studied smartphones is about 704$, which entail about 165 kgCO2e of GHG emissions. This value contrasts with the total emissions (including those from re-spending) of purchasing a cheaper new (110 kg), same new (120 kg), and cheaper used (20 kg) unit. Lastly, the majority of models in the “no surplus consumption” scenario have an ERE higher than 100%, a case known as “backfire effect” (Saunders, 2000) where purchasing such models would have overall negative effects in terms of GHG emissions. A considerable backfire of 290% is also observed in the “5% displacement” scenario for the iPhone 6. This result is mostly explained by the fact that this model had no cheaper used alternative (iPhone 5 was excluded from our analysis since it could not be purchased new from Apple), so the same model was used and this set a low avoided emissions reference point given the large proportion of “cheaper used” option comprising the alternative mix.
Discussion
Our results show that, in the context of imperfect substitution, the average ERE for the studied smartphone models would be around 30%. To the best of our knowledge, this work presents the first attempt to quantify the rebound effect resulting from reuse of durable consumer goods via secondary markets. Estimated rebound effects resulting from technical changes in terms of GHG emissions, report similar results (Font Vivanco et al., 2016c). For example, rebound effects from energy efficiency investments in households have been estimated to be 16–20% in the US (Thomas and Azevedo, 2013), 41–78% in the UK (Chitnis and Sorrell, 2015), and 22% in China (Lin et al., 2013). In any case, a 30% ERE suggests that only 70% of the GHG emissions reductions are effectively achieved. This systemic inefficiency could have grave implications for reaching GHG emission targets (Meinshausen et al., 2009), especially if one considers marginal GHG emission abatement costs (Kuik et al., 2009).
When looking across specific models and regions, and considering various hypothetical assumptions, our results offer a wide range of ERE magnitudes, some of which reach the so-called “backfire effect.” Though here we focused on smartphone reuse within the US, research suggests that, in many cases, used phones are sold via secondary markets in developing countries (Geyer and Doctori Blass, 2010; Zink et al., 2014; Cooper and Gutowski, 2017). As our sensitivity analysis demonstrates, under global marginal GHG emissions from consumption, the ERE of three out of four models examined in this study would be almost 80%. Since re-spending effects tend to be higher in developing countries, where cleaner technologies have diffused less and there is unsaturated demand for energy-intensive products (e.g., personal transport and heating) (Hymel et al., 2010; Antal and van den Bergh, 2014; Chitnis et al., 2014), it is likely that smartphone reuse might lead to backfire. This premise, together with the fact that smartphone ownership rates have skyrocketed in recent years in emerging economies (e.g., Turkey, Malaysia and Brazil) (Poushter, 2016) suggest not only that our current estimates for rebound from smartphone reuse are conservative, but also that this rebound can increase in the future.
An often-neglected aspect of the rebound effect is the importance of considering a life cycle perspective of the studied product. This means considering not only the environmental burdens, but also the economic costs of capital, product expenditures, EoL, etc. Among these, capital and product expenditures usually play a big role (Mizobuchi, 2008). Smartphones are a special case because, when considering their life cycle, their GHG emissions per economic unit are relatively low compared to other products. Consequently, economic savings that are shifted toward other products through re-spending entail high emissions and large rebound effects. Similar examples can be found in the case of electric cars (Font Vivanco et al., 2014, 2016c) and clothing (Wood et al., 2017). It remains to be seen, however, whether and to what extent other reused products present similar characteristics.
Here we only considered cases where used smartphones substitute other smartphones. It is possible, however, that the used market allows consumers who would have otherwise bought a regular mobile phone to upgrade to a smartphone. In such cases, the use phase impacts associated with reuse would be different compared to the buy new option. Specifically, while before it was only charging, now consumers also use cloud services, streaming and the like, which come with their own environmental costs (Ovchinnikov et al., 2014). In addition, in many cases, secondary markets are in other countries. This means that use phase impacts might differ based on the carbon intensity of the local grid. Moreover, countries where secondary markets are strong might lack advanced recycling technologies and be equipped to handle such electronic waste (Osibanjo and Nnorom, 2008). It remains unclear if such impacts associated with global trend in used goods would offset the advantages of smartphone reuse.
Conclusions
In this paper, we quantified the environmental rebound effect (ERE) resulting from smartphone reuse via second hand markets in terms of life cycle GHG emissions. We assumed that the ERE arose from both re-spending and imperfect substitution. Departing from life cycle assessment (LCA) and price data for various iPhone models, we first estimated the re-spending effect by calculating marginal expenditures with a household demand model and their associated emissions with environmentally-extended input-output analysis. To consider imperfect substitution between new and used smartphones, we conducted a survey on consumers who had previously bought a used phone. Our results show that the magnitude of the ERE is 29% on average, and ranges from 27 to 46% for specific iPhone models. Moreover, when replicating our results for different regions and under various hypothetical assumptions, the ERE shows a wider range of magnitudes, including above 100% or backfire effect. In other words, we estimate that about one third, and potentially the entirety, of emission savings could be lost due to the rebound effect.
This study is the first of its kind to quantify rebound effects from reuse, and so our results can shed novel insights into the environmental performance of reuse and broader circular economy (CE) strategies. As suggested in the literature (Zink and Geyer, 2017), re-spending and imperfect substitution effects can be expected in other CE strategies such as recycling and refurbishment. For example, when recycled materials offer similar value at a lower price or when cheaper refurbished products allow new consumers to enter the market. It seems clear, both from the literature and from our results, that CE strategies will increase the “circularity” of economies at the expense of “growing the pie,” but the real question is how large is the CE rebound for the global economy. In cases where the rebound effect is high, for instance when substitutability between used and new products is low and/or economic savings are high, CE strategies may not be the best path to achieve sustainable development goals. In this sense, while offering a transformative blueprint that could well revolutionize production and consumption systems, we believe CE strategies must remain under scrutiny until further research is carried out.
There are various ways to mitigate detrimental rebound effects (Font Vivanco et al., 2016a), such as taxes (Brännlund et al., 2007; Small and Van Dender, 2007) and promoting behavioral change (Griskevicius et al., 2010; Ozkan and Popp, 2011). These tools can be applied to mitigate rebound effects from reuse, recycling, etc. For example, via internalizing environmental externalities into the prices (e.g., carbon tax) and improving the social perception of used/recycled products to make them more functionally comparable to their new counterparts. In the case of technological products, also by discouraging users to buy spare products via green design. For example, by allowing multiple SIM cards in smartphones and facilitating repair (Riisgaard et al., 2016). In any case, it bears noting that rebound effects can have social benefits, especially for low-income groups (Ürge-Vorsatz and Tirado Herrero, 2012; Galvin, 2015), and so such tools must consider an asymmetrical distribution of economic burdens/benefits (Font Vivanco, 2016).
While insightful, our work is not short of limitations. For example, allocating all embedded environmental burdens to the first user might underestimate the impacts of the products' second life. Much like the price and demand for products in primary markets affect secondary markets, prices and supply of products in secondary markets might also play a role in driving primary consumption. For example, consumers might buy products in anticipation of later selling them on to secondary consumers. As a result, they might be less sensitive to upfront purchase costs, or might shift their preference toward products that have higher demand in secondary markets. Alternatively, consumers might use prices and demand in secondary markets as quality assurance signals to help navigate choices in primary markets. Either way, as markets for used products grow, more attention is likely to focus on ways to refine allocation between a products' different life cycles. In addition, the survey methodology employed here targets used smartphone consumers in general, and so a more personalized and detailed survey, for instance by gathering responses for each reused smartphone sale just after the transaction, could allow a more sophisticated and accurate design of the alternative mix. To carry out such an analysis, however, the full range of possible alternatives would need to be described in terms of their associated life cycle environmental and economic costs. Also, the inclusion of socio-economic data when approaching marginal consumption, in particular income levels, would allow to calculate more accurate patterns of marginal expenditure for each buyer. Lastly, our study focuses on life-cycle GHG emissions, which are an imperfect proxy of environmental sustainability (Laurent et al., 2012). Therefore, expressing the ERE using other environmental indicators (e.g., water and metal use) could yield even more extreme rebound magnitudes (Freire-González and Font Vivanco, 2017).
Despite the limitations of this study, it offers novel insights into the environmental benefits of reuse and CE strategies in general. While further research on rebound and other unintended effects from systemic changes and consumer behavior is needed, our results suggest that there are grounds to challenge the premise that a CE would always lead to environmental benefits. The inceptive stage of CE strategies, however, presents the opportunity to use this information to adopt accompanying measures to mitigate such unintended effects.
Author Contributions
TM and DF contributed equally to the design and implementation of the research, to the analysis of the results, and to the writing of the manuscript.
Conflict of Interest Statement
The authors declare that the research was conducted in the absence of any commercial or financial relationships that could be construed as a potential conflict of interest.
The reviewer, JS, and handling Editor declared their shared affiliation.
Acknowledgments
TM acknowledges funding from the Sobotka research grant, from the center for Business and the Environment at Yale University. DF acknowledges funding from the European Commission (Marie Skłodowska-Curie Individual Fellowship [H2020-MSCA-IF-2015], grant agreement no. 702869).
Supplementary Material
The Supplementary Material for this article can be found online at: https://www.frontiersin.org/articles/10.3389/fenrg.2018.00039/full#supplementary-material
References
Abbey, J. D., Kleber, R., Souza, G. C., and Voigt, G. (2017). The role of perceived quality risk in pricing remanufactured products. Prod. Oper. Manag. 26, 100–115. doi: 10.1111/poms.12628
Abbey, J. D., Meloy, M. G., Guide, V. D. R., and Atalay, S. (2015). Remanufactured products in closed-loop supply chains for consumer goods. Prod. Oper. Manag. 24, 488–503. doi: 10.1111/poms.12238
Allwood, J. M. (2014). “Squaring the Circular Economy,” in Handbook of Recycling, eds E. Worrell and M. A. Reuter (Amsterdam: Elsevier), 445–477.
Antal, M., and van den Bergh, J. C. J. M. (2014). Re-spending rebound: a macro-level assessment for OECD countries and emerging economies. Energy Policy 68, 585–590. doi: 10.1016/j.enpol.2013.11.016
Bocken, N. M. P., de Pauw, I., Bakker, C., and van der Grinten, B. (2016). Product design and business model strategies for a circular economy. J. Ind. Prod. Eng. 33, 308–320. doi: 10.1080/21681015.2016.1172124
Brännlund, R., Ghalwash, T., and Nordström, J. (2007). Increased energy efficiency and the rebound effect: effects on consumption and emissions. Energy Econ. 29, 1–17. doi: 10.1016/j.eneco.2005.09.003
Brookes, L. (1990). The greenhouse effect: the fallacies in the energy efficiency solution. Energy Policy 18, 199–201. doi: 10.1016/0301-4215(90)90145-T
Chitnis, M., and Sorrell, S. (2015). Living up to expectations. Estimating direct and indirect rebound effects for UK households. Energy Econ. 52, S100–S116. doi: 10.1016/j.eneco.2015.08.026
Chitnis, M., Sorrell, S., Druckman, A., and Firth, S. (2012). The rebound effect: to what extent does it vary with income? Guildford: Centre for Environmental Strategy, University of Surrey.
Chitnis, M., Sorrell, S., Druckman, A., Firth, S. K., and Jackson, T. (2014). Who rebounds most? Estimating direct and indirect rebound effects for different UK socioeconomic groups. Ecol. Econ. 106, 12–32. doi: 10.1016/j.ecolecon.2014.07.003
Cooper, D. R., and Gutowski, T. G. (2017). The environmental impacts of reuse: a review. J. Ind. Ecol. 21, 38–56. doi: 10.1111/jiec.12388
Ellen MacArthur Foundation (2013). Towards the Circular Economy. Available online at: https://www.ellenmacarthurfoundation.org/assets/downloads/publications/Ellen-MacArthur-Foundation-Towards-the-Circular-Economy-vol.1.pdf.
Font Vivanco, D. (2016). The Rebound Effect Through Industrial Ecology's Eyes: The Case of Transport Eco-Innovation. Leiden: Institute of Environmental Sciences (CML), Faculty of Science, Leiden University.
Font Vivanco, D., Freire-González, J., Kemp, R., and Van der Voet, E. (2014). The remarkable environmental rebound effect of electric cars: a microeconomic approach. Environ. Sci. Technol. 48, 12063–12072. doi: 10.1021/es5038063
Font Vivanco, D., Kemp, R., and van der Voet, E. (2016a). How to deal with the rebound effect? A policy-oriented approach. Energy Policy 94, 114–125. doi: 10.1016/j.enpol.2016.03.054
Font Vivanco, D., McDowall, W., Freire-González, J., Kemp, R., and van der Voet, E. (2016b). The foundations of the environmental rebound effect and its contribution towards a general framework. Ecol. Econ. 125, 60–69. doi: 10.1016/j.ecolecon.2016.02.006
Font Vivanco, D., Tukker, A., and Kemp, R. (2016c). Do methodological choices in environmental modeling bias rebound effects? A case study on electric cars. Environ. Sci. Technol. 50, 11366–11376. doi: 10.1021/acs.est.6b01871
Font Vivanco, D., and van der Voet, E. (2014). The rebound effect through industrial ecology's eyes: a review of LCA-based studies. Int. J. Life Cycle Assess. 19, 1933–1947. doi: 10.1007/s11367-014-0802-6
Freire-González, J., and Font Vivanco, D. (2017). The influence of energy efficiency on other natural resources use: an input-output perspective. J. Clean. Prod. 162, 336–345. doi: 10.1016/j.jclepro.2017.06.050
Frota Neto, J. Q., Bloemhof, J., and Corbett, C. (2016). Market prices of remanufactured, used and new items: evidence from eBay. Int. J. Prod. Econ. 171, 371–380. doi: 10.1016/j.ijpe.2015.02.006
Galvin, R. (2015). The rebound effect, gender and social justice: a case study in Germany. Energy Policy 86, 759–769. doi: 10.1016/j.enpol.2015.08.026
Geissdoerfer, M., Savaget, P., Bocken, N. M. P., and Hultink, E. J. (2017). The circular economy – a new sustainability paradigm? J. Clean. Prod. 143, 757–768. doi: 10.1016/j.jclepro.2016.12.048
Geyer, R., and Doctori Blass, V. (2010). The economics of cell phone reuse and recycling. Int. J. Adv. Manuf. Technol. 47, 515–525. doi: 10.1007/s00170-009-2228-z
Ghisellini, P., Cialani, C., and Ulgiati, S. (2016). A review on circular economy: the expected transition to a balanced interplay of environmental and economic systems. J. Clean. Prod. 114, 11–32. doi: 10.1016/j.jclepro.2015.09.007
Ghose, A., Smith, M. D., and Telang, R. (2006). Internet exchanges for used books: an empirical analysis of product cannibalization and welfare impact. Inf. Syst. Res. 17, 3–19. doi: 10.1287/isre.1050.0072
Griskevicius, V., Tybur, J. M., and Van den Bergh, B. (2010). Going green to be seen: status, reputation, and conspicuous conservation. J. Pers. Soc. Psychol. 98, 392–404. doi: 10.1037/a0017346
Guide, V. D. R. Jr., and Li, J. (2010). The potential for cannibalization of new products sales by remanufactured products*. Decis. Sci. 41, 547–572. doi: 10.1111/j.1540-5915.2010.00280.x
Gutowski, T. G., Sahni, S., Boustani, A., and Graves, S. C. (2011). Remanufacturing and energy savings. Environ. Sci. Technol. 45, 4540–4547. doi: 10.1021/es102598b
Hymel, K. M., Small, K. A., and Van Dender, K. (2010). Induced demand and rebound effects in road transport. Transp. Res. B Methodol. 44, 1220–1241. doi: 10.1016/j.trb.2010.02.007
Jenkins, J., Nordhaus, T., and Shellenberger, M. (2011). Energy Emergence: Rebound and Backfire as Emergent Phenomena. Oakland, CA: Breakthrough Institute.
Jevons, W. S. (1865). The Coal Question. An Inquiry Concerning the Progress of the Nation and the Probable Exhaustion of our Coal-Mines. Cambridge, UK: Macmillan and co.
Khazzoom, J. D. (1980). Economic implications of mandated efficiency in standards for household appliances. Energy J. 1, 21–40.
Korhonen, J., Honkasalo, A., and Seppälä, J. (2018). Circular economy: the concept and its limitations. Ecol. Econ. 143, 37–46. doi: 10.1016/j.ecolecon.2017.06.041
Kuik, O., Brander, L., and Tol, R. S. J. (2009). Marginal abatement costs of greenhouse gas emissions: a meta-analysis. Energy Policy 37, 1395–1403. doi: 10.1016/j.enpol.2008.11.040
Laurent, A., Olsen, S. I., and Hauschild, M. Z. (2012). Limitations of carbon footprint as indicator of environmental sustainability. Environ. Sci. Technol. 46, 4100–4108. doi: 10.1021/es204163f
Lin, B., Yang, F., and Liu, X. (2013). A study of the rebound effect on China's current energy conservation and emissions reduction: measures and policy choices. Energy 58, 330–339. doi: 10.1016/j.energy.2013.06.018
Meinshausen, M., Meinshausen, N., Hare, W., Raper, S. C. B., Frieler, K., Knutti, R., et al. (2009). Greenhouse-gas emission targets for limiting global warming to 2 °C. Nature 458, 1158–1162. doi: 10.1038/nature08017
Miller, R. E., and Blair, P. D. (2009). Input-Output Analysis: Foundations and Extensions. Cambridge, UK: Cambridge University Press.
Mizobuchi, K. (2008). An empirical study on the rebound effect considering capital costs. Energy Econ. 30, 2486–2516. doi: 10.1016/j.eneco.2008.01.001
Murray, C. K. (2013). What if consumers decided to all “go green”? Environmental rebound effects from consumption decisions. Energy Policy 54, 240–256. doi: 10.1016/j.enpol.2012.11.025
NBSC (2018). China Statistical Yearbook 2016. Available online at: http://www.stats.gov.cn/tjsj/ndsj/2016/indexeh.htm.
Osibanjo, O., and Nnorom, I. C. (2008). Material flows of mobile phones and accessories in Nigeria: environmental implications and sound end-of-life management options. Environ. Impact Assess. Rev. 28, 198–213. doi: 10.1016/j.eiar.2007.06.002
Ovchinnikov, A., Blass, V., and Raz, G. (2014). Economic and environmental assessment of remanufacturing strategies for product + Service Firms. Prod. Oper. Manag. 23, 744–761. doi: 10.1111/poms.12070
Ozkan, M., and Popp, M. (2011). Purchaser Preferences on Carbon Labels: Conventional vs. Organic Milk. 1494288. Available online at: http://search.proquest.com/docview/873815112?accountid=12045.
Poushter, J. (2016). Smartphone Ownership and Internet Usage Continues to Climb in Emerging Economies. Available online at: http://assets.pewresearch.org/wp-content/uploads/sites/2/2016/02/pew_research_center_global_technology_report_final_february_22__2016.pdf.
Raz, G., Ovchinnikov, A., and Blass, V. (2017). Economic, environmental, and social impact of remanufacturing in a competitive setting. IEEE Trans. Eng. Manag. 64, 476–490. doi: 10.1109/TEM.2017.2714698
Reck, B. K., and Graedel, T. E. (2012). Challenges in metal recycling. Science 337, 690–695. doi: 10.1126/science.1217501
Richter, F. (2017). Will Apple's China Woes Continue in 2017? Available online at: https://www.statista.com/chart/8578/iphone-sales-by-geography/.
Riisgaard, H., Mosgaard, M., and Zacho, K. O. (2016). Local circles in a circular economy-the case of smartphone repair in Denmark. Eur. J. Sustain. Dev. 5, 109–124. doi: 10.14207/ejsd.2016.v5n1p109
Santarius, T., and Soland, M. (2018). How technological efficiency improvements change consumer preferences: towards a psychological theory of rebound effects. Ecol. Econ. 146, 414–424. doi: 10.1016/j.ecolecon.2017.12.009
Saunders, H. D. (2000). A view from the macro side: rebound, backfire, and Khazzoom-Brookes. Energy Policy 28, 439–449. doi: 10.1016/S0301-4215(00)00024-0
Scheepens, A. E., Vogtländer, J. G., and Brezet, J. C. (2016). Two life cycle assessment (LCA) based methods to analyse and design complex (regional) circular economy systems. Case: making water tourism more sustainable. J. Clean. Prod. 114, 257–268. doi: 10.1016/j.jclepro.2015.05.075
Simas, M., Pauliuk, S., Wood, R., Hertwich, E. G., and Stadler, K. (2017). Correlation between production and consumption-based environmental indicators: the link to affluence and the effect on ranking environmental performance of countries. Ecol. Indic. 76, 317–323. doi: 10.1016/j.ecolind.2017.01.026
Skelton, A. C., and Allwood, J. M. (2013). Product life trade-offs: what if products fail early? Environ. Sci. Technol. 47, 1719–1728. doi: 10.1021/es3034022
Small, K. A., and Van Dender, K. (2007). Fuel efficiency and motor vehicle travel: the declining rebound effect. Energy J. 28, 25–51. doi: 10.5547/ISSN0195-6574-EJ-Vol28-No1-2
Stadler, K., Wood, R., Bulavskaya, T., Södersten, C.-J., Simas, M., Schmidt, S., et al. (2018). EXIOBASE 3: developing a time series of detailed environmentally extended multi-regional input-output tables. J. Ind. Ecol. doi: 10.1111/jiec.12715
Stahel, W. (1994). “The utilization-focused service economy: resource efficiency and product-life extension,” in The greening of industrial ecosystems, eds B. Allenby and D. Richards (Washington, DC: National Academy Press), 178–190.
Thomas, B. A., and Azevedo, I. L. (2013). Estimating direct and indirect rebound effects for U.S. households with input-output analysis Part 1: theoretical framework. Ecol. Econ. Sustain. Urban. A resilient Futur. 86, 199–210. doi: 10.1016/j.ecolecon.2012.12.003
Thomas, V. M. (2003). Demand and dematerialization impacts of second-hand markets. J. Ind. Ecol. 7, 65–78. doi: 10.1162/108819803322564352
Ürge-Vorsatz, D., and Tirado Herrero, S. (2012). Building synergies between climate change mitigation and energy poverty alleviation. Energy Policy 49, 83–90. doi: 10.1016/j.enpol.2011.11.093
Waldman, M. (2003). Durable goods theory for real world markets. J. Econ. Perspect. 17, 131–154. doi: 10.1257/089533003321164985
Wood, R., Moran, D., Stadler, K., Ivanova, D., Steen-Olsen, K., Tisserant, A., et al. (2017). Prioritizing consumption-based carbon policy based on the evaluation of mitigation potential using input-output methods. J. Ind. Ecol. doi: 10.1111/jiec.12702. [Epub ahead of print].
Zink, T., and Geyer, R. (2017). Circular economy rebound. J. Ind. Ecol. 21, 593–602. doi: 10.1111/jiec.12545
Keywords: rebound effect, circular economy, reuse, smartphones, life cycle assessment
Citation: Makov T and Font Vivanco D (2018) Does the Circular Economy Grow the Pie? The Case of Rebound Effects From Smartphone Reuse. Front. Energy Res. 6:39. doi: 10.3389/fenrg.2018.00039
Received: 27 February 2018; Accepted: 23 April 2018;
Published: 09 May 2018.
Edited by:
Marti Rosas-Casals, Universitat Politecnica de Catalunya, SpainReviewed by:
Jordi Segalas, Universitat Politecnica de Catalunya, SpainJay Zarnikau, University of Texas at Austin, United States
Copyright © 2018 Makov and Font Vivanco. This is an open-access article distributed under the terms of the Creative Commons Attribution License (CC BY). The use, distribution or reproduction in other forums is permitted, provided the original author(s) and the copyright owner are credited and that the original publication in this journal is cited, in accordance with accepted academic practice. No use, distribution or reproduction is permitted which does not comply with these terms.
*Correspondence: David Font Vivanco, d.vivanco@ucl.ac.uk