An Assessment of Ambient and Heated Forced Air Drying Pre-treatments for Enhancing the Quality of Various Forest Biomass Feedstocks
 Jay Mak1
  Hubert Landry2 Lorne Grieger1 Joy Agnew2
  Sally Krigstin3* Christopher Helmeste3,4 Suzanne Wetzel4 Sebnem Madrali5 Sylvain Volpé6
- 1Prairie Agricultural Machinery Institute (PAMI), Portage la Prairie, MB, Canada
- 2Prairie Agricultural Machinery Institute (PAMI), Humboldt, SK, Canada
- 3Faculty of Forestry, University of Toronto, Toronto, ON, Canada
- 4Canadian Wood Fibre Centre, Natural Resources Canada, Ottawa, ON, Canada
- 5CanmetENERGY, Natural Resources Canada, Ottawa, ON, Canada
- 6FPInnovations, Pointe-Claire, QC, Canada
Maintaining high quality feedstock storage for sustained bioenergy production continues to be a challenge within the supply chain. Though forestry by-products have the potential to provide a carbon-neutral energy source that can be both economic and environmentally friendly, the heterogeneous nature of woody biomass makes the material challenging to store for long periods of time without material degradation, freezing, and fire concerns if not managed properly. The following study evaluated the scalable use of natural air drying (NAD) with and without supplemental heat on multiple woody biomass feedstocks (hog fuel, sawmill chips, and bark) to determine drying rates and feasibility in Western Canada. Test results demonstrated that NAD has the potential to dry and condition multiple types of woody biomass, while providing a positive net energy gain of 9–32% compared to the original biomass energy content. The use of supplemental heat resulted in an energy gain of 3 to −13% due to the increased heating energy consumption, but may be applicable in some circumstances when faster drying is required, weather conditions are unfavorable and/or alternative low-cost heating sources are available. Therefore, NAD shows promise in providing an alternative low-cost drying option for enhancing woody biomass feedstock in storage.
Introduction
Low-value woody biomass is typically heterogeneous in size and high in moisture content (MC) (e.g., forest harvest residues; Acquah et al., 2016). Dry particulate wood fuels are preferred in many applications because of their relative ease of handling and storage, as well as their advantage in terms of burning efficiency in smaller, less expensive combustion systems. Much research has been devoted to increasing the value of heterogeneous forest biomass by encouraging a decrease in the moisture content during the storage period (Table 1). Since the supply of forest residues is not well-aligned with energy demand, storage is a necessary requirement in the supply chain. Tarps of several material types have been used to cover biomass piles, however the effect on the moisture content of stored biomass is variable (Gigler et al., 2004; Afzal et al., 2010; Wetzel et al., 2017). Numerous studies have shown that pre-treatment of the biomass by natural air drying (NAD) may be a possible alternative that can reduce the MC in green chips/chunks relatively quickly with and without supplemental heat (Table 1).
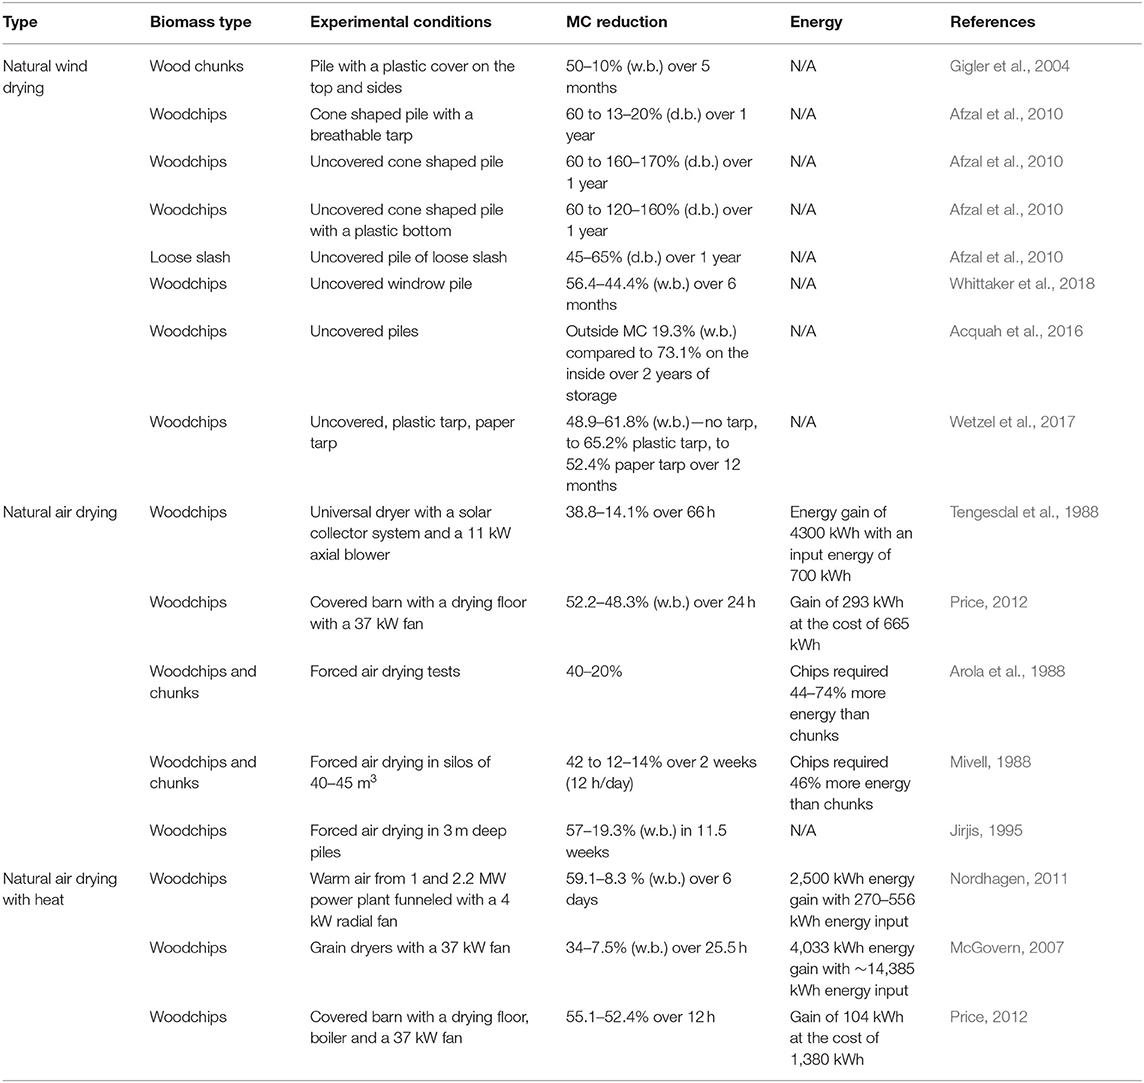
Table 1. Summary of past literature studies displaying natural wind and air drying experimental results with and without supplemental heat.
Studies on ambient air drying of biomass have included using natural wind, as well as forced air (with and without supplemental heat). Natural wind drying relies on the wind to naturally condition the material without any additional energy input. Gigler et al. (2004) investigated natural wind drying of willow chunks and found they could be dried from 50 to 10% MC w.b. over 5 months. They concluded that the factors such as air condition, particle size and pile dimensions all affected the rate of natural wind drying. Afzal et al. (2010) demonstrated that wind drying of white birch chip piles covered with a breathable tarp reduced moisture from 60 to 17% (d.b.) over a 1-year period. However, un-tarped piles in a 2018 study by Whittaker et al. and a 2010 study by Afzal et al. had divergent results, showing a loss of 12% MC (w.b.) to a gain of 110% MC (d.b.), respectively (Afzal et al., 2010; Whittaker et al., 2018). Wetzel et al. (2017) compared the condition of forest residue biomass piled over a 1-year period in New Brunswick, Canada. They found that tarping of piles with a plastic tarp significantly increased the moisture content (+33%) of the stored biomass, while tarping with a paper tarp had no effect on the moisture content. The un-tarped control pile, similar to the plastic tarped material, gained moisture (+25%). These experimental studies have demonstrated some potential for natural wind drying of woody biomass over time, however there are many variables which can influence its effectiveness. Therefore, it is difficult to prescribe conditions and get predictable results.
Biomass can also be dried by using forced ambient air or heated air. In Norway, farmers have adopted drying systems composed of a perforated floor that allows drying in shallow layers (Gislerud, 1990). The roof and walls are commonly used to redirect solar energy to improve the drying performance. The shallow-layer drying with forced air convection has a low airflow resistance, which allows simple axial fans to provide large air volumes with low energy inputs. Tengesdal et al. (1988) conducted a drying experiment that reduced the wood chip moisture content from 38.8 to 14.1% over 4 days, increasing the biomass energy content by 4,300 kWh at a cost of 700 kWh of electrical power, resulting in a net positive energy gain. Other drying trials have not shown such optimistic results but instead found that the energy expended on creating air flow was greater than the energy content increase in the biomass (Price, 2012). Price (2012) noted however that the rate of MC loss may be affected by the high RH during the drying trials.
The cost of drying chipped and chunk material with forced air are similar, and the management decision may well be dictated by the amount of time available between harvest and fuel delivery or fuel processing equipment availability. Various woodchip and/or chunk drying trials illustrated successful results in drying materials to 12–25% MC with various forced air set-ups. Generally, it was found that wood chunks dried faster than woodchips (Arola et al., 1988; Gjølsjø, 1988; Mivell, 1988; Nurmi, 1988; Sturos, 1988; Jirjis, 1995). The chunks, having a lower pressure drop when compared to the chipped material, required less energy for drying to the same MC level. The high airflow resistance of woodchips also results in longer drying times and higher energy costs compared to the lower pressure drop of chunks and lower fan energy requirements.
In some cases, forced air drying systems with supplemental heat can dry biomass faster and when conditions are unfavorable for drying (e.g., low temperature and/or high relative humidity). As an example, fuel chips could be dried to 12% MC during the March-October period in Sweden using unheated air, but would require additional heat to achieve satisfactory drying during the winter months (Gustafsson, 1988). Nordhagen (2011) reported that the gain in calorific value of the biomass with hydroelectricity was greater than the power used for fans, whereas other studies have shown a negative net energy when factoring in the additional heat energy used (McGovern, 2007; Price, 2012). McGovern and Price showed the energy input was 3–4 and 12 times higher when compared to the energy gain in the material. Rinne et al. (2014) and Atnaw et al. (2017) suggested that using solar energy is an alternative to add supplemental heat when drying biomass.
Price (2011) indicated that green wood residues can be dried relatively quickly (2–3 days) to 25–30% MC with minimal energy input using a fan and ambient air. Additional drying is possible with heated air, but several sources indicated that the energy used for drying exceeded the energy gained. The objective of this study was to determine drying rates for woody biomass found in Western Canada and to assess the feasibility of NAD to optimize the bioenergy supply chain. There is limited information available on the use of natural air drying of woody biomass in Canadian climates, specifically the use of supplemental heat, equipment and practices that would be most suitable at a farm- or small-scale enterprise.
Materials and Methods
Test Apparatus
A small-scale test apparatus was developed in Portage la Prairie, Manitoba, consisting of six vertical silos, each suspended on a load cell (Vishay Revere 9363) and equipped with sensors at various heights for real-time weight, temperature and moisture monitoring (Figure 1). Each silo was equipped with a fan (EPM-Papst RG148/1200-3633) and an in-line heater (Omega AHF-14240; supplemental heat trial only) to provide constant airflow and supplemental heat to simulate one-dimensional flow through a pile/windrow of biomass up to 4 m high. The fan pushed the ambient air through the biomass from the bottom and released the air at the top.
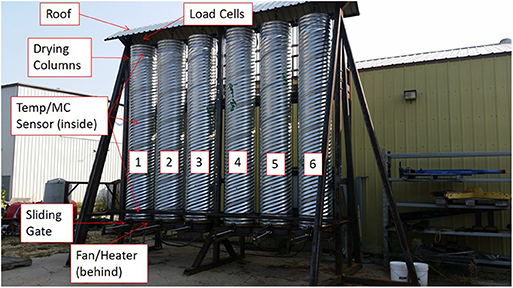
Figure 1. Small-scale natural air drying with real-time monitoring capability, variable fan, and heater test apparatus for six runs.
A total of six fans and six heaters were connected to a variable-rate controller capable of independently varying the airflow rate and heat additions for each column. Each silo was 0.61 m in diameter and 4 m in height, holding ~1.2 m3 of material. Three temperature/humidity sensors (Measurement Specialties HTM2500LF) were used in each silo to monitor the biomass condition. The sensors were secured to a steel cable suspended from the top of the test apparatus and running vertically near the center of each silo. The sensors were vertically located ~0.2, 2, and 3.8 m from the bottom of the silos in the 2017 trial and adjusted to 0.5, 2, and 3.5 m in the 2018 trial. An additional sensor was placed near the fan inlet to monitor ambient air conditions. Other design components included a removable roof to minimize the impact of precipitation and a sliding gate at the bottom of each silo to facilitate the material loading and unloading process.
The drying parameters collected included air temperature and relative humidity (RH), biomass temperature and moisture content, biomass weight, static pressure resistance, energy use, as well as airflow and heating rate. These measurements were used to assess the efficiency and viability of using NAD to dry forestry residues.
Natural Air Drying Trials
A total of four NAD trials were carried out between August to October 2017 and September to November 2018 to evaluate drying rates and energy requirements for three types of woody biomass: (i) hog fuel, (ii) sawmill woodchips, and (iii) bark. The aim of the NAD trials was to reach an average MC of 20–25% in each column, or dry for a maximum of 3 weeks, whichever occurred first. The trials were setup as a 2 × 3 factorial design without replications (Table 2). All three materials were tested with the “Design 1” factorial matrix, which compared starting MCs of 35–45% and 45–55% (w.b.), and airflow rates of 3.3, 13.4, and 26.8 L·s−1 · m−3. The bark was retested to evaluate the effect of supplemental heat, “Design 2” which compared heat treatments of 0, 5, and 10°C above ambient and two airflow rates of 13.4 and 26.8 L·s−1 · m−3.
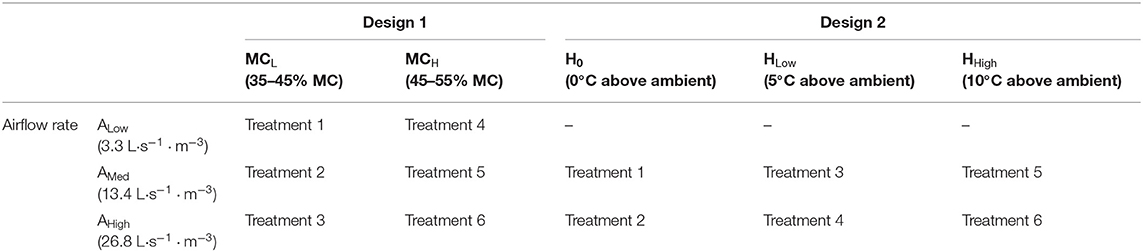
Table 2. NAD factorial design matrix.
Initial moisture content differences were attained by separating the material into two piles. One pile was left outside, unprotected from the environment, while the other was stored inside a well-ventilated building. Depending on the starting MC and the weather conditions, water was either added or removed from one pile to create the MC differential. The materials were mixed and sampled before loading the columns. The airflow rates were obtained by modulating the fans and verifying with a vane anemometer (Omega HHF143B), while the heat treatments were controlled by continuously measuring the temperature differential with two T-type thermocouples between the fan inlet and the heater outlet. The fan speeds (in rpm), weight of the columns, temperature, and RH measurements were logged and stored in the data acquisition system (eDAQ). In addition, the static pressure and energy consumption for the fans and heaters were measured with a manometer (Dwyer 477AV) and energy logger (On-set UX120-018) at the beginning and the end of each trial. The biomass was characterized to determine the initial physical properties in each trial, followed by a 3-week drying period and further characterization to determine any property variations.
Woody Biomass Characterization
The hog fuel consisted of mostly poplar but had varying amounts of spruce, balsam fir, and birch. The sawmill chips and bark were obtained from two different by-product streams when producing dimensional lumber from a pine log in the Manitoba Interlake Plain Region. The woody biomass materials were characterized to determine any change in their physical properties, which included MC, bulk density, porosity, and particle size distribution. Similarly, the bulk properties of the biomass columns were also measured, including the mass, height, in situ bulk density, static pressure, and airflow rate. Monitoring the column properties quantified the effect of NAD over 3 weeks on the biomass material when stacked to a height of 4 m.
Moisture content was measured following the methodology outlined in ISO 18134-1 and EN 14771-1:2009, and the compressed and uncompressed bulk density was obtained according to ISO 17828:2015 and EN 15103:2009. Standard ISO/DIS 18847 uses a buoyancy method; however, this method is only suitable for measuring the porosity of homogenous biofuels such as pellets and briquettes. As there is no confirmed standard for measuring the porosity of heterogeneous solid biofuels, the water pycnometry method from Annan and White (1998) was used. The method consisted of filling a round container with material and slowly adding water to displace the air bubbles between the solid particles. The porosity was determined by calculating the volume of water added against the total container volume. The particle size distribution was measured according to the Standards ISO/FDIS 17827-1, EN15149-1:2010, with recommended sieve sizes from Agnew and Landry (2016).
Equilibrium Moisture Content
The MC of wood depends on the temperature and RH of the surrounding air. Therefore, the biomass MC was determined based on the equilibrium moisture content (EMC) proposed by Simpson (1998). EMC is achieved when the MC of the wood reaches an equilibrium point (with constant relative humidity and temperature over an extended time period). Equations (1)–(5) were used to calculate the EMC of the wood surrounding the individual sensors, where T is temperature (°C), h is relative humidity (decimal), EMC (decimal), and W, K, K1, and K2 are coefficients of an adsorption model by Hailwood and Horrobin (1946).
Drying Performance
The drying performances were measured using two methods. For the first method, the weight of the columns was continually monitored, and drying was determined by calculating the weight loss before and after drying. The second method used the individual sensors within the columns to determine the drying conditions within the column. These sensors monitored a small amount of surrounding biomass and provided an indication of the internal temperature and MC (based on EMC). The NAD energy balance was estimated by calculating the total gain (ΔETotal) between the final (EF) and starting (ES) biomass energy in Equations (6)–(8) without considering the equipment energy consumption. Equations (9) and (10) shows the gain ratio (Gainratio) after deducting the equipment consumption (EC) to illustrate the potential energy gain/loss with respect to the initial energy content. The biomass net calorific value (NCV) was calculated based on the estimated moisture of the material within the column, while the energy consumption was based on the equipment current draw. Theoretically, drying woody biomass will result in a material with a higher energy content since the drier material is closer to the theoretical higher heating value of woody biomass. The weight loss measured within the column was assumed to be equal to the water loss.
Where E = energy (kWh), NCV = net calorific value (MJ/kg), WT = weight (kg), 0.2778 is the conversion factor for MJ to kWh.
Where NCVM = net calorific value at moisture, M (MJ/kg), NCV0 = net calorific value at 0% moisture (19 MJ/kg), and M = Moisture content (w.b.%) (Francescato et al., 2008)
Where EC = equipment energy consumption, V = volt (V), I = current (A) and T = time (hours).
Results and Discussion
Biomass Properties
Three types of biomass materials (hog fuel, sawmill woodchips, and bark) were characterized for MC, uncompressed and compressed bulk density, as well as porosity (Table 3). Depending on the type of biomass and MC, the uncompressed and compressed bulk density ranges were 180–340 kg·m−3 and 260–400 kg·m−3 respectively, and the uncompressed and compressed porosity ranges were 63–71% and 55–66%, respectively. The hog fuel had the lowest compressed to uncompressed bulk density (17–18%), followed by sawmill woodchips at 15–23%, and bark at 36–51%. Since the bark material could pack together more tightly, this may have had a more negative influence on air flow. The bark's ability to compress under load as compared to the other two materials can be seen in Figure 2.
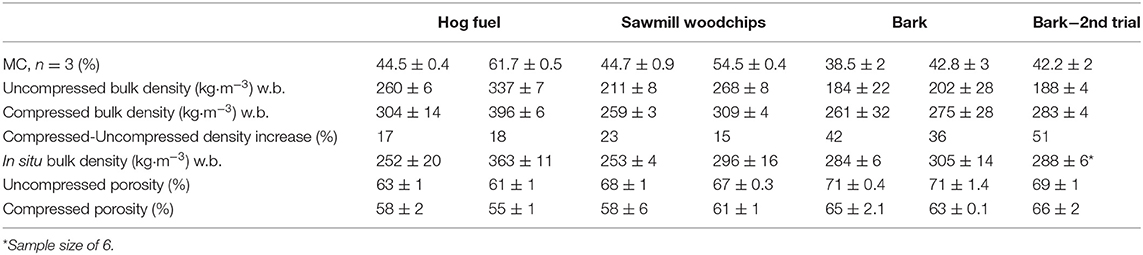
Table 3. Summary of woody biomass physical properties before NAD (sample size of 3 for averaged data).
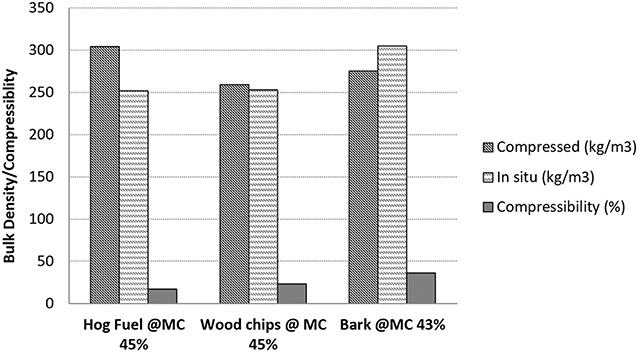
Figure 2. Bulk density and compressibility ratios of green hog fuel, woodchips, and bark with respective moisture contents of 45, 45, and 43%.
The average particle size distribution for the hog fuel, sawmill woodchips, and bark are presented in Table 4. The distribution curve indicated that the hog fuel contained the highest amount of fines, followed by bark and sawmill woodchips. The hog fuel and bark had a more normally distributed particle size distribution over the measured size range as compared to the sawmill woodchips, where over 90% (by weight) were found in the 7.5–44.8 mm size range.
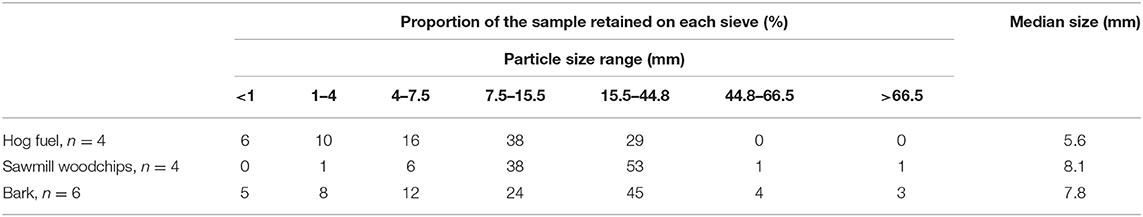
Table 4. Average particle size distribution for the different woody biomass materials.
Biomass Column Characterization
The mass, height, static pressure, and airflow rate of each biomass filled column was measured to determine the drying parameters. Figure 3 shows the static pressure of the drying system plotted against the airflow rate for the four NAD treatments. For the first design matrix (hog fuel, sawmill, and bark-trial 1), the materials have a different resistance to airflow due to their physical properties. At lower airflow rates, the static pressure differences between the materials are almost negligible. At higher airflow rates, the larger particle sizes in the sawmill chips resulted in a lower airflow resistance when providing the same airflow rate, which is in agreement with Arola et al. (1988). This indicates that the material properties will have an impact on how much air can be economically used to dry woodchips.
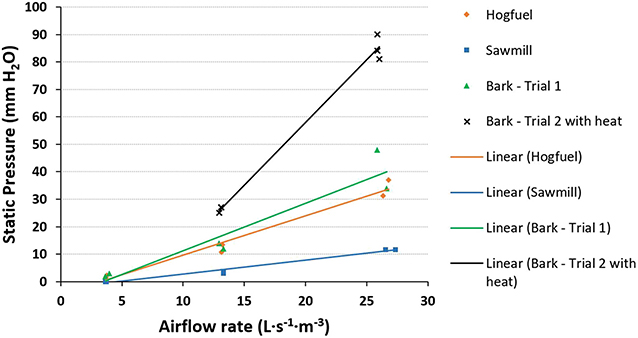
Figure 3. Changes in static pressure with varying airflow rates (3, 13, 27 L s−1·m−3). Displaying results for each natural air drying trial (hog fuel, sawmill woodchips, and bark with and without supplemental heat).
The additional in-line heaters, in “Bark—Trial 2 with heat,” saw an increase in the static pressure compared to the other trials. This indicated that the fan required more energy to provide the same amount of airflow during the heated trials. This is due to the increased distance the air has to travel and airflow restriction from the heater coils. Similarly, this shows that the design of the air duct system will also have an impact on how much energy will be expended to dry woodchips.
Ambient Air Conditions
NAD relies on the drying capacity of the ambient air. The temperature, EMC range and averages for each time period are presented in Table 5 to illustrate the potential drying capacity. The EMC is calculated with Equations (1)–(5), which is based on the ambient temperature, relative humidity, and coefficients of an adsorption model by Hailwood and Horrobin (1946). A lower EMC indicates that the air has a higher capacity to dry biomass due to its ability to absorb more water.
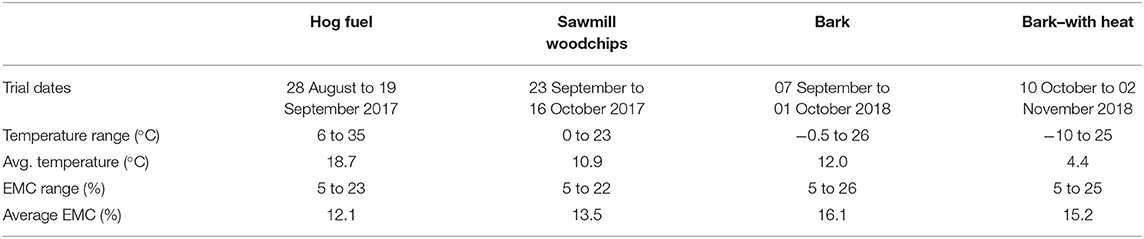
Table 5. Ambient air temperature, equilibrium moisture content (EMC), and drying potential at various time periods.
Drying Analysis
The drying performances of the four trials are shown in Figure 4, which displays the biomass MC and ambient air EMC over 3 weeks. The biomass MC was based on the initial MC samples as well as the continuous weight measurements of each silo. The EMC curve in each figure illustrates the potential drying capability of the ambient air if the biomass was exposed to those conditions for an extended period of time. If the EMC curve is below the biomass MC, the air provided will have a drying effect on the woodchips. The one exception is during the heated trials where the heat added lowered the EMC curve based on the temperature increase.
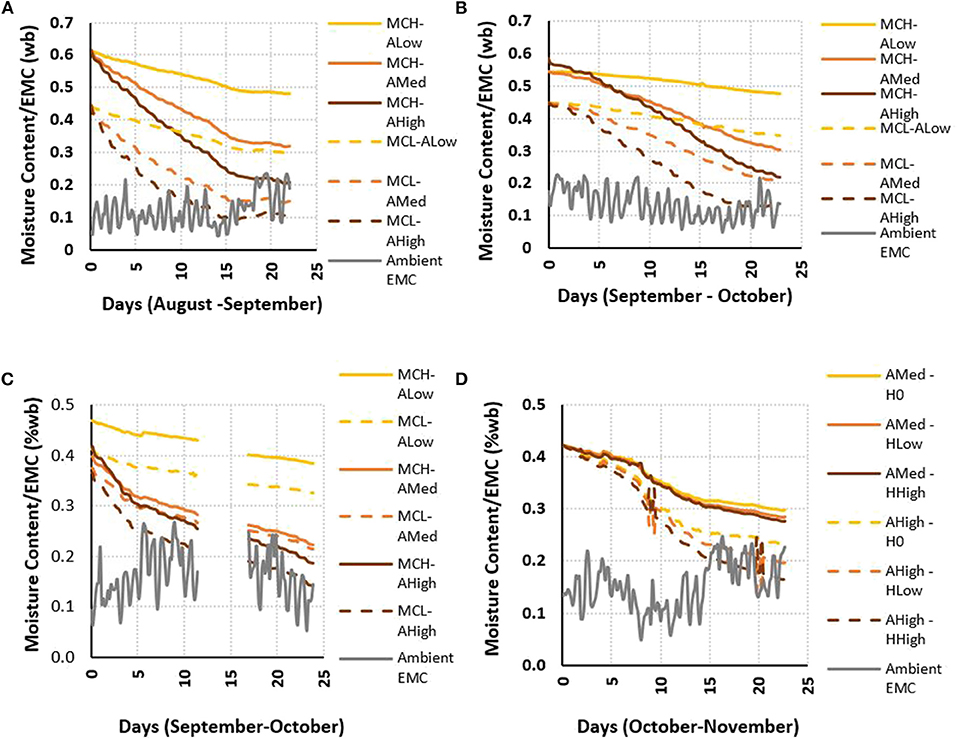
Figure 4. Average biomass drying performance over time for each feedstock material/ trial compared with local ambient equilibrium moisture content (EMC): (A) hog fuel, (B) sawmill woodchips, (C) bark without supplemental heat, and (D) bark with supplemental heat (MCL/H, low/high moisture content; ALow/Med/High, low/medium/high airflow; H0/Low/High, no/low/high heat settings).
Figure 4 illustrates that the NAD trial could successfully dry a variety of biomass materials during the summer and fall months to a moisture level of 25% or below during a 3-week period. All treatments provided some reduction in MC, with the higher air flow trials delivering the best results with moisture levels close to or below 20% in many cases. The average ambient EMC during this period was 12.1% and ranged between 5 and 23% depending on the hourly weather changes. Therefore, the biomass would be continuously dried if it's MC was over 23%. Once the MC fell below 23%, the biomass either gained or lost moisture depending on the ambient conditions. This was observed near the end of the trial (~day 16 with the hog fuel) where the biomass material increased in MC due to an extended high humidity period. To overcome this limitation of the equipment, there is potential to use a control system to maximize the effect of NAD, while minimizing the energy consumption of operating a fan when conditions are unfavorable. This observation was similar to the findings from Price (2012) who indicated that it is common to use hygrometers to trigger grain drying when relative humidity falls below a given threshold in order to improve efficiency.
When comparing the drying rates obtained for the various treatments with hog fuel (Figure 4A), the starting moisture content (MCL & MCH) had a smaller effect compared to the airflow rates (ALow, AMed, and AHigh). The low airflow treatments (ALow) had the lowest average drying performance at around 15% difference, followed by medium airflow (AMed) at 30%, and high airflow (AHigh) at 37% over 22 days. The higher airflow rates indicated a higher drying rate over the entire trial, but the drying rate (% day−1) gradually decreased as the differential between the biomass MC and the ambient EMC decreased. The higher airflow rates (AMed and AHigh) showed a visible diurnal variation in MC, which indicated a different drying potential depending on the day/night. The slope on the drying curve was greater during the warmer temperatures around mid-afternoon and was lower during the night. It is difficult to compare the effect that the individual biomass materials had on the drying rates, due to the various seasonal periods and associated EMC's across the trials.
In summary, the low airflow treatment (ALow, 3.3 Ls−1m−3) in the first three trials with hog fuel, sawmill chips, and bark indicated a low average drying rate of 15, 9, and 9% over 3 weeks, respectively. The medium airflow treatment (AMed, 13.4 Ls−1m−3) resulted in 30, 24, and 17% drying performance where the high airflow treatment (AHigh, 26.8 Ls−1m−3) was 37, 34, and 23%, respectively. The low airflow rates were unable to reach the target MC after a 3-week duration. The “Medium” and “High” airflow rates may therefore be recommended as a starting point to scale the NAD application in a three-dimensional storage system if a similar time-frame and dry-down performance is desired. Secondly, these drying treatment curves could be manipulated (with limitations) to estimate the required airflow and duration during different months to obtain a particular dry-down performance. These drying rates are a snapshot of the potential drying performance of NAD and should not be compared since these trials are influenced by the drying factors (material and weather conditions) suggested by Gigler et al. (2004).
The NAD results with three biomass types indicated that the medium (AMed) and high airflow treatments (AHigh) were capable of removing about 17–30% MC and 23–37% MC over 3 weeks, respectively. When comparing these results with the NAD studies in Table 1, the performance is very similar to the study by Mivell (1988) where the material MC dried about 30% over a 2-week period. The other studies display variable drying periods, as low as 1 day and up to 12 weeks. It is therefore not practical to compare drying performances when the duration is drastically different.
The fourth trial, using bark material, and supplemental heat with two airflow rates, was performed to evaluate if drying could occur when ambient air conditions were not optimal. The medium airflow (AMed) drying rates for no, low, and high heat (H0, HLow, HHigh) were 13, 14, and 15%, respectively. Similarly, the high airflow (AHigh) drying rates were 19, 23, and 26%, respectively. Figure 4D showed a noticeable drying performance difference between the two airflow rates with a smaller effect from the supplemental heat. Each additional heat treatment (5°C above ambient air) increased the drying performance by about 1% for the medium airflow and increased ~3% for the high airflow. This was expected since the heater controls were designed to provide more heat until a target temperature differential was obtained. Therefore, the heaters proportionately added more heat to a higher airflow compared to a lower airflow, thus improving the drying performance.
Preliminary Energy Assessment
For the energy assessment of the trials, the changes in the energy value (kWh) of the biomass before and after drying are shown for each trial without considering the cost of operating the fans and heaters (Equation 6). The net energy gain (%) provided an indication of the gain or loss compared to the initial energy content after deducting the input energy (Equation 9). Overall, a higher positive net balance demonstrated superior treatment performance (Figures 5, 6). These energy calculations were based on a limited number of samples and do not account for all the factors that affect the useful energy content of the materials (i.e., ash content, combustion efficiency of system, etc.).
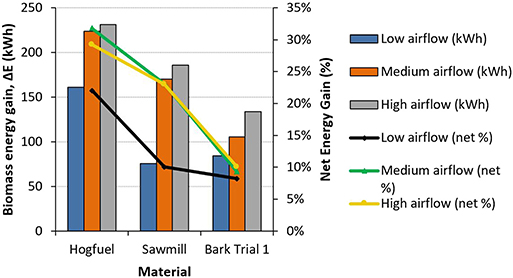
Figure 5. Energy gains (ΔE) (kWh) from natural air drying of biomass without supplemental heat, along with net energy gain (%) (including equipment energy consumption) for hog fuel, woodchips, and bark trials.
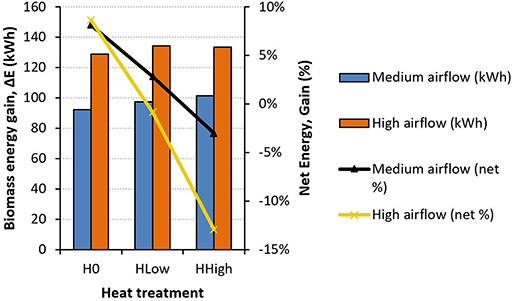
Figure 6. Energy gains (ΔE) (kWh) from natural air drying of bark material with and without supplemental heat along with net energy gain (%) when factoring in equipment energy consumption.
Figure 5 summarizes the potential energy savings for the hog fuel, woodchips, and bark materials when no supplement heat was added. These trials measured an energy gain (ΔE) of 80–230 kWh for each treatment without considering the input energy of 7–35 kWh, while measuring an overall net energy gain ratio of 8–32% when compared to the original biomass energy content. The higher airflow rates led to higher total energy gains in all three materials due to increased water removal. However, the net energy gain ratio showed that the difference between the high and medium air flow rates were minimal after considering the extra energy consumed by the fan operating at a faster speed. This suggested that the highest air flow rate, 26.8 L·s−1 · m−3, has the potential to remove more water only if the increase in energy use is justified. The lowest air flow rate, 3.3 L·s−1 · m−3, provided the lowest energy gain between 8 and 22%, but still managed to provide a positive net energy gain. There is potential to optimize the energy use through controlling the fan activity to a water loss set point. McGovern (2007) reported that there is potential to reduce drying energy by turning off the fans when the drying rate slows or stops. Regardless of the optimum return, these results demonstrate the potential of NAD as an energy-effective method to dry biomass due to the positive net return for all trials.
In comparable drying reports by Tengesdal et al. (1988) and Price (2012) the magnitude of scale, drying duration, climate, material and set-up varied from our study. Tengesdal et al. showed an energy gain of 4,300 kWh with an input energy of 700 kWh, while Price showed a gain of 293 kWh with an input energy of 665 kWh. Price (2012) and Tengesdal et al. (1988) performed the drying analysis over 1 and 3 days, respectively, compared to 3 weeks in this study. Tengesdal et al. also dried woodchips at a shallower depth of 0.75 m compared to the 4 m depth in our study. These differences highlight the importance of optimizing NAD for various user storage requirements where results can be very dependent on equipment setup, biomass volume and protocol design. Supplemental heat could potentially improve drying when ambient air conditions are not adequate for water removal. Figure 6 compares the energy balance when supplemental heat is added to the air flow for drying the bark material. Similar to the trials without supplemental heat, the higher air flow rate had a higher energy gain (ΔE) of 129–134 kWh compared to the medium air flow rate of 92–102 kWh. However, the energy increase to power the fans and heaters of 18–256 kWh eliminated the biomass energy gains and resulted in a 3 to −13% energy gain (Gainratio) when compared to the original biomass energy content. These results showed lower losses compared to McGovern (2007) and Price (2012), while less gains were found compared to Nordhagen (2011). McGovern (2007), Price (2012), and Nordhagen (2011) reported an energy gain and input energy of 4,033 kWh with 14,385 kWh energy use, 104 kWh with 1,380 kWh energy use, and 2,500 kWh with 270–556 kWh energy use, respectively. Due to differences in experimental setup and conditions, the multitude of variables makes it difficult to directly compare these results. For example, McGovern used a grain dryer which used 60°C hot air for 1 day, while Price used a biomass boiler providing 30°C ambient air for half a day. Nordhagen (2011) used the surplus heat from hydroelectric plants to raise the dryer temperature to 15–26°C and was only required to power a fan over a maximum of 6 days. Nonetheless, the trials without supplemental heat treatment provided the highest energy gain ratio of ~8–9% even in the colder climates between October and November in Western Canada. However, the material did not reach the target of 25% MC within a 3-week duration. Heat recovery/self-heat recuperation technology will make the use of supplemental heat much more favorable by minimizing energy losses along with the benefit of decreased drying time. Liu et al. (2014) found that self-heat recuperation dryers may have the potential to reduce energy consumption by 75–85.7% compared to conventional heat dryers. Such improvements to drying systems will greatly decrease the energy costs associated with heat drying but will likely take time to be vastly implemented (especially by smaller bioenergy/biomass storage operations).
Summary
This study found that the energy input without supplemental heat during warmer months in Western Canada can result in an energy gain of 9–32% compared to the original biomass energy content over 3 weeks. The supplemental heat trials indicated an energy gain of 3 to −13% over a 3 week duration due to the additional energy required. Waste heat recuperation would therefore be necessary to make supplemental heat more favorable.
Table 6 displays the total time and energy used for each treatment to either dry to 25% MC or the lowest MC calculated by the end of the 3 week trial. It can be seen that several treatments were able to dry the material to the target goal of 25% MC much faster than others, where drying time could be significantly affected by simple modifications. For example, the hog fuel material (MCL-AMed, MCL-AHigh) showed that the higher airflow was able to shorten the drying time by 3 days with an increase of 1 kWh (Table 6). Thus, in situations where time saving benefits outweigh increased energy costs, higher airflow might be favored (considering energy used will still vary with other factors such as air-drying capacity). Future NAD studies should include a more detailed sensitivity analysis to highlight overall costs and benefits for several woody biomass materials, drying parameters, environmental factors, as well as desired economic and temporal targets.
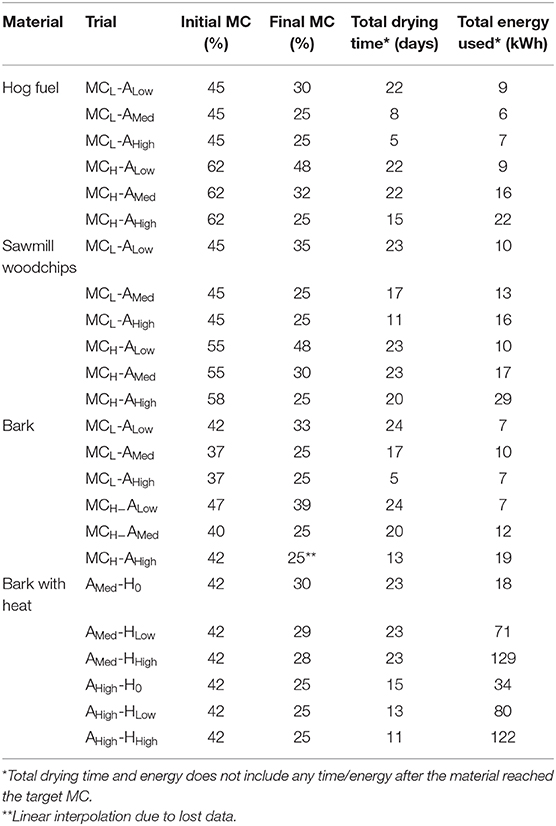
Table 6. Total time and energy used to bring the material to an average of 25% MC or the energy used over the total drying period.
Conclusions
The experimental trials in this study determined that natural air drying (NAD) of woody biomass with and without supplemental heat resulted in net energy gains of 3 to −13% and 9–32%, respectively. NAD was shown to have high potential as a pre-treatment strategy for improving woody biomass storage, however seasonality, forced air speed, and equilibrium moisture content will be important factors to consider when determining possible energy gains. Optimization must also take user storage requirements into consideration since faster drying times may occasionally be desired at a higher energy cost (e.g., increased fan speed). The use of supplemental heat should be carefully evaluated on a case-by-case basis due to the increased energy requirement. Though it has the potential to increase the drying performance of woody biomass, heat recuperation technology will be necessary to increase net energy gains.
Data Availability Statement
The raw data supporting the conclusions of this article will be made available by the authors, without undue reservation, to qualified researchers.
Author Contributions
JA, SM, SK, and SW: conceptualization. LG, JA, SW, and SM: funding acquisition. LG, SK, and JA: supervision. JM, HL, LG, JA, and CH: research and investigation. JM, HL, and LG: writing (original draft). CH, JM, and SK: visualization and writing (review and editing). LG, JA, SM, and SV: resources.
Funding
This research was funded by Natural Resources Canada, Manitoba Agriculture, and PAMI's Applied Bioenergy Centre.
Conflict of Interest
The authors declare that the research was conducted in the absence of any commercial or financial relationships that could be construed as a potential conflict of interest.
Acknowledgments
This research would not have been possible without the contributions of the research team established through the NRCan's ecoEIP program for the technical advice and guidance. Special thanks to the SW, SK, and CH for their contributions toward making this journal a reality. Lastly, we want to acknowledge the generous contributions of local stakeholders that provided the testing materials and inputs on the research program.
References
Acquah, G., Krigstin, S., Wetzel, S., Cooper, P., and Cormier, D. (2016). Heterogeneity of forest harvest residue from eastern Ontario biomass harvests. Forest Prod. J. 66, 3–4. doi: 10.13073/FPJ-D-14-00098
Afzal, M., Bedane, A., Sokhansanj, S., and Mahmood, W. (2010). Storage of comminuted and uncomminuted forest biomass and it's effect on fuel quality. BioResources 5, 55–69. Available online at: https://ojs.cnr.ncsu.edu/index.php/BioRes/article/view/BioRes_05_1_0055_Afzal_BSM_Storage_Comminuted_Biomass/487
Agnew, J., and Landry, H. (2016). Characterizing Woody Biomass for Large-Scale, Low-Cost Drying During Storage. Humboldt: PAMI Report.
Annan, J., and White, R. (1998). “Evaluation of techniques for measuring air filled porosity in composts of municipal biosolids and wood chips,” in Composting in the Southeast-Proceedings of the 1998 Conference (Athens).
Arola, R. A., Sturos, J. B., and Radcliffe, R. C. (1988). “Chunkwood drying research with northern US hardwoods,” in Proceedings of the lEA~BE Conference Task Ill~Activity 6 and 7, ed B.-O. Danielsson (Garpenberg: Department of Operational Efficiency, Swedish University of Agricultural Sciences), 101–119.
Atnaw, S., Bin Che Ku Yahya, C., and Jama Oumer, A. (2017). “Development of solar biomass drying system,” in MATEC Web of Conferences, Vol. 97 (Ho Chi Minh City). doi: 10.1051/matecconf/20179701081
Francescato, V., Antonini, E., and Bergomi, L. C. (2008). Wood Fuels Handbook. Legnaro: AIEL – Italian Agriforestry Energy Association.
Gigler, J. K., van Loon, W. K. P., and Sonnevelda, C. (2004). Experiment and modelling of parameters influencing natural wind drying of willow chunks. Biomass Bioenergy 26, 507–514. doi: 10.1016/j.biombioe.2003.09.004
Gislerud, O. (1990). Drying and storing of comminuted wood fuels. Biomass 22, 229–244. doi: 10.1016/0144-4565(90)90019-G
Gjølsjø, S. (1988). “Comparative studies on storage and drying of chips and chunks in Norway,” in Proceedings of the IEA /BE Conference Task III/Activity 6 and 7, Res. Note No. 134, ed B.-O. Danielsson (Garpenberg: Department of Operational Efficiency, Swedish University of Agricultural Sciences), 47–71.
Gustafsson, G. (1988). “Forced air drying of chips and chunk wood,” in Proceedings of the lEA/BE Conference Task Ill~Activity 6 and 7, Res. Note No. 134, ed B.-O. Danielsson (Grapenberg: Department of Operational Efficiency, Swedish University of Agricultural Sciences), 150–62.
Hailwood, A. J., and Horrobin, S. (1946). Absorption of water by polymers: analysis in terms of a simple model. Trans. Faraday Soc. 42, B084–B092. doi: 10.1039/tf946420b084
Jirjis, R. (1995). Storage and drying of wood fuel. Biomass Bioenergy 9, 181–190. doi: 10.1016/0961-9534(95)00090-9
Liu, Y., Aziz, M., Kansha, Y., Bhattacharya, S., and Tsutsumi, A. (2014). Application of the self-heat recuperation technology for energy saving in biomass drying system. Fuel Process. Technol. 117, 66–74. doi: 10.1016/j.fuproc.2013.02.007
McGovern, R. (2007). Report on Trials of Farm Grain Dryers for Woodchip Moisture Reduction. SAC Consultancy Services Division Report. Aberdeen: Craibstone.
Mivell, T. (1988). “Comparisons of storages of chunkwood and fuel chips in Sweden,” in Proceedings of the lEA~BE Conference Task Ill/Activity 6 and 7, Res. Note No. 134, ed B.-O. Danielsson (Garpenberg: Department of Operational Efficiency, Swedish University of Agricultural Sciences), 90–100.
Nordhagen, E. (2011). Drying of Woodchips with Surplus Heat from TWO Hydroelectric Plants in Norway. Formec Austria.
Nurmi, J. (1988). “Drying of chunkwood – effect of particle size on drying rate,” in Proceedings of the lEA/BE Conference Task Ill/Activity 6 and 7, Res. Note No. 133, ed B.-O. Danielsson. Res. Note no. 134 (Garpenberg: Department of Operational Efficiency, Swedish University of Agricultural Sciences), 39–46.
Price, M. (2012). Active Woodchip Drying Trials – 1. Forestry Commission Job Report 076 – Extended summary.
Rinne, S., Holmberg, H., Myllymaa, T., Kontu, K., and Syri, S. (2014). Wood chip drying in connection with combined heat and power or solar energy in Finland. Eur. Phys. J. Conf. 79:03008. doi: 10.1051/epjconf/20137903008
Simpson, W. T. (1998). Equilibrium Moisture Content of Wood in Outdoor Locations in the United States and Worldwide. Forest Products Laboratory, Forest service, United States Department of Agriculture, Research Note FPL-RN-0268.
Sturos, J. (1988). “Airflow resistance of chunkwood,” in Proceedings of the lEA/BE Conference Task llI/Activity 6 and 7, Res. Note No. 133, ed B. O. Danielsson (Garpenberg: Department of Operational Efficiency, Swedish University of Agricultural Sciences), 181–90.
Tengesdal, G., Fæste, I., and Grønlien, H. (1988). “Wood chips drying in a universal dryer with building solar collector,” in Proceedings of the IEA/BE Conference Tasks III Activity 6 and 7, Res. Note No. 134, ed B. O. Danielsson (Garpenberg: Department of Operational Efficiency, Swedish University of Agricultural Sciences).
Wetzel, S., Volpe, S., Damianopoulos, J., and Krigstin, S. (2017). Can biomass quality be preserved through tarping comminuted roadside biomass piles? Forests 8:305. doi: 10.3390/f8090305
Keywords: natural air drying, woody biomass storage, supplemental heat, moisture content, bioenergy
Citation: Mak J, Landry H, Grieger L, Agnew J, Krigstin S, Helmeste C, Wetzel S, Madrali S and Volpé S (2020) An Assessment of Ambient and Heated Forced Air Drying Pre-treatments for Enhancing the Quality of Various Forest Biomass Feedstocks. Front. Energy Res. 8:7. doi: 10.3389/fenrg.2020.00007
Received: 02 November 2019; Accepted: 10 January 2020;
Published: 28 January 2020.
Edited by:
Timothy A. Volk, SUNY College of Environmental Science and Forestry, United StatesReviewed by:
Muhammad Aziz, The University of Tokyo, JapanCheng Tung Chong, Shanghai Jiao Tong University, China
Copyright © 2020 Mak, Landry, Grieger, Agnew, Krigstin, Helmeste, Wetzel, Madrali and Volpé. This is an open-access article distributed under the terms of the Creative Commons Attribution License (CC BY). The use, distribution or reproduction in other forums is permitted, provided the original author(s) and the copyright owner(s) are credited and that the original publication in this journal is cited, in accordance with accepted academic practice. No use, distribution or reproduction is permitted which does not comply with these terms.
*Correspondence: Sally Krigstin, sally.krigstin@utoronto.ca