Biochar increases soil N2O emissions produced by nitrification-mediated pathways
 María Sánchez-García
 Asunción Roig
 Miguel A. Sánchez-Monedero
 María L. Cayuela
- Department of Soil and Water Conservation and Waste Management, CEBAS-CSIC, Campus Universitario de Espinardo, Murcia, Spain
In spite of the numerous studies reporting a decrease in soil nitrous oxide (N2O) emissions after biochar amendment, there is still a lack of understanding of the processes involved. Hence the subject remains controversial, with a number of studies showing no changes or even an increase in N2O emissions after biochar soil application. Unraveling the exact causes of these changes, and in which circumstances biochar decreases or increases emissions, is vital to developing and applying successful mitigation strategies. With this objective, we studied two soils [Haplic Phaeozem (HP) and Haplic Calcisol (HC)], which showed opposed responses to biochar amendment. Under the same experimental conditions, the addition of biochar to soil HP decreased N2O emissions by 76%; whereas it increased emissions by 54% in soil HC. We combined microcosm experiments adding different nitrogen fertilizers, stable isotope techniques and the use of a nitrification inhibitor (dicyciandiamide) with the aim of improving our understanding of the mechanisms involved in the formation of N2O in these two soils. Evidence suggests that denitrification is the main pathway leading to N2O emissions in soil HP, and ammonia oxidation and nitrifier-denitrification being the major processes generating N2O in soil HC. Biochar systematically stimulated nitrification in soil HC, which was probably the cause of the increased N2O emissions. Here we demonstrate that the effectiveness of using biochar for reducing N2O emissions from a particular soil is linked to its dominant N2O formation pathway.
Introduction
Biochar, a carbonaceous material produced during the pyrolysis of biomass, has been found to decrease N2O emissions from soils (Spokas and Reikosky, 2009; Cayuela et al., 2010; Van Zwieten et al., 2010). A recent meta-analysis of 30 papers (published from 2007 to 2013) revealed a statistically significant reduction of 54% in N2O emissions when soils were amended with biochar (Cayuela et al., 2014). However, a substantial number of studies contradict this result, they reporting no difference or even an increase in soil N2O emissions after biochar application (Clough et al., 2010; Saarnio et al., 2013; Suddick and Six, 2013). A remarkable finding was that the same biochar could lead to opposite effects (increasing or decreasing N2O emissions) depending on the soil to which the biochar was applied (Yoo and Kang, 2012; Malghani et al., 2013).
Soils are a major source of N2O, which is a potent greenhouse gas and contributor to ozone layer destruction. N2O is produced during several soil processes and its release to the atmosphere is almost entirely controlled by microbial activities. Current knowledge suggests five N2O-genic soil microbial sources (Baggs, 2011; Spott et al., 2011). These are the nitrate or nitrite reducing processes of denitrification and dissimilatory nitrate reduction to ammonium (DNRA), and ammonia oxidation (the first step in nitrification, facilitated by ammonia oxidizing bacteria). Nitrifier denitrification, the ability of ammonia oxidizing bacteria to denitrify, is often also seen as a separate process. Finally, codenitrification has also been identified as a relevant N2O formation pathway in soils (Spott et al., 2011). Understanding the mechanisms of the interactions of biochar with soil N2O formation pathways represents a difficult challenge. No evidence has been reported that would serve to unambiguously define the cause for the observed variations (increase or decline) in soil N2O fluxes. This is due to the extremely complex set of reactions leading to N2O formation and consumption in soils and also to the fact that the number of studies which analyze how biochar influences specific N2O formation pathways is still very limited.
In a recent study using the 15N gas flux method, Cayuela et al. (2013) observed a consistent decrease in the N2O/N2 ratio after biochar amendment in 15 agricultural soils, pointing to denitrification as the N2O formation pathway that biochar might be altering. According to this, biochar would enhance the last step of denitrification (i.e., the reduction of N2O–N2). Subsequently, Harter et al. (2014) found that soil biochar amendment increased the relative gene and transcript copy numbers of the nosZ-encoded bacterial N2O reductase, a result which could explain the previous mechanistic findings. Nevertheless, Cayuela et al. (2013) also found contrasting results for the flux of total denitrified N (N2O + N2), which was significantly reduced in the majority of soils (10 out of 15), but highly amplified in others. No conclusive explanation was found for this paradoxical finding.
In this study we aimed to look more closely at the reasons for these contrasting results. Our hypothesis was that, besides denitrification, other microbial processes (e.g., nitrifier-denitrification, dissimilatory nitrate reduction to ammonia, codenitrification) could have led to N2O and N2 formation in these soils, mechanisms that had not been addressed in previous studies. Hence, we studied two soils that, under identical experimental conditions, showed opposite responses to biochar amendment, i.e., whereas biochar addition decreased N2O emissions in one soil, it increased emissions in the other. The main objective was to investigate by 15N gas measurements and the use of nitrification inhibitors, the main pathways leading to N2O formation in these two soils, with the aim of understanding why biochar might be influencing N2O emissions differently.
Materials and Methods
Soils and Biochar Selected for the Experiments
Two agricultural soils were selected for the experiments (Table 1). Soil HP was used as a reference soil, since it had been previously used in numerous studies that proved that denitrification was the major process responsible for N2O emissions (Čuhel et al., 2010). Soil HC was selected from a series of agricultural soils because it was the only one where (under identical optimal denitrifying conditions) the addition of greenwaste biochar increased N2O emissions. The soils were sampled from a depth of 0–0.25 m, air-dried and sieved (<2 mm).
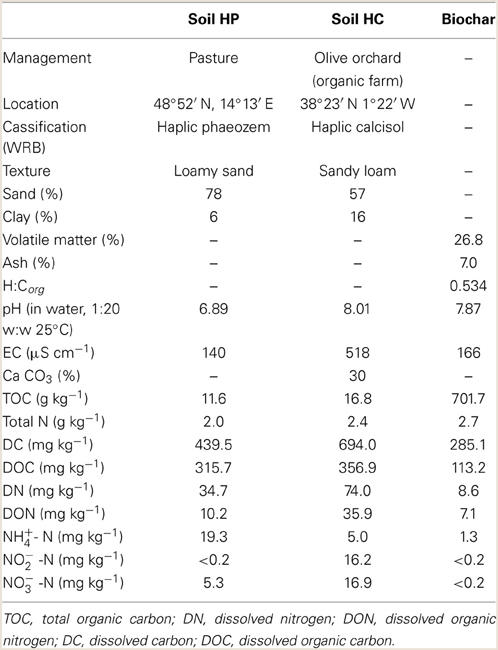
Table 1. Physical and chemical characteristics of soil and biochar samples used in the experiments.
We used a biochar produced by continuous slow pyrolysis of greenwaste at 550°C provided by Pacific Pyrolysis Pty. Ltd. (Australia) (Table 1). Herbaceous and woody biochars have been found to be the most promising for mitigating N2O emissions from soil (Cayuela et al., 2014). Therefore, this biochar was selected for its mitigation potential and as a representative standard biochar commonly used in other studies. The biochar was ground to a particle size <1 mm before soil application.
Microcosms Experiments
The incubation experiments were performed in 250 ml polypropylene jars at optimum conditions for denitrification: 25°C and moisture content of 90% water filled pore space (WFPS). The control treatments consisted of 100 g dry soil and the biochar treatments of 98 g dry soil and 2 g biochar (2% w:w). The biochar was thoroughly mixed with the dry soil to obtain a completely homogeneous mixture. Subsequently deionized water (or a solution containing the appropriate concentration of N fertilizer) was added to reach 90% WFPS (and the required N concentration in the fertilized treatments). The jars were incubated aerobically, covered with a polyethylene sheet that allows gas exchange but minimizes evaporation. Moisture was gravimetrically adjusted every other day with the addition of deionised water for each individual jar. The experiments were laid out as randomized block designs with four replicates per treatment.
Experiment 1. Impact of biochar on soil N2O emissions and mineral N after the addition of different N fertilizers
A set of 48 jars [2 soils (HP/HC) × 2 management treatments (biochar/control) × 3 fertilization treatments (no fertilizer/KNO3/CO(NH2)2) × 4 replicates] was set up for the first experiment. The fertilizers were homogeneously distributed in the soil at a rate of 200 kg N Ha−1 (corresponding to 55 mg N kg−1 based on a plough layer of 25 cm). N2O samples were taken twice a day during the first 2 days decreasing subsequently to daily measurements, then every other day, then three times per week, etc. (see Figure 1). At the end of the incubation (14 days) mineral N (NH+4, NO−3, and NO−2) was extracted and determined in all jars.
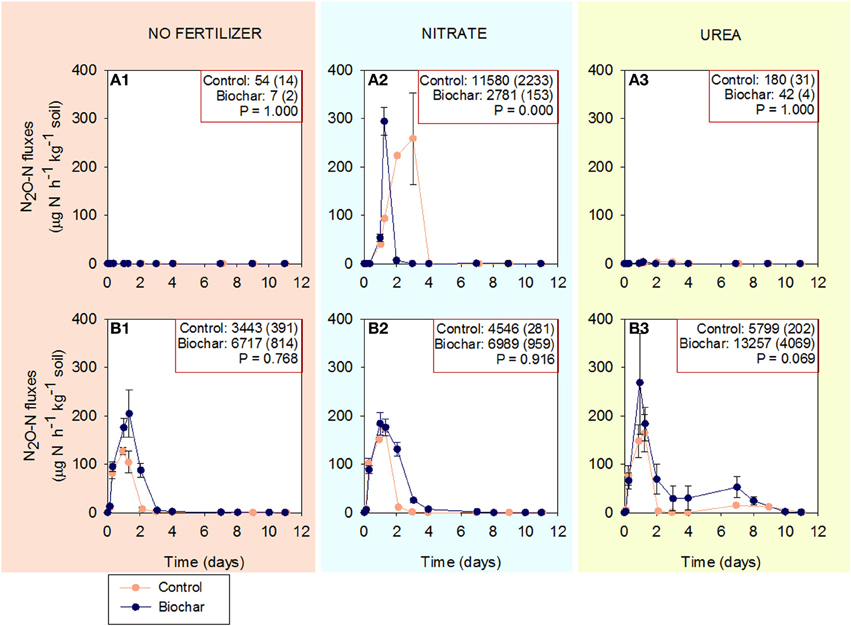
Figure 1. Fluxes of N2O in soils HP and HC in control and biochar treatments (mean ± SE; n = 4). (A1–A3) correspond to soil HP unfertilized, fertilized with KNO3 and fertilized with CO(NH2)2, respectively. (B1–B3) correspond to soil HC unfertilized, fertilized with KNO3 and fertilized with CO(NH2)2, respectively. Cumulative N2O emissions (μg N-N2O kg−1 soil) and standard errors by the end of the incubation are reported in the right-above box for each treatment.
Experiment 2. Isotopic composition of N2O and N2 emitted after application of labeled 15N fertilizers
The following 15N-tracer experiments were performed:
(i) Soil HP + 15NO−3, vs. soil HP + 15NO−3 + biochar,
(ii) Soil HC + 15NO−3 vs. soil HC + 15NO−3 + biochar,
(iii) Soil HC + CO(15NH2)2 vs. Soil HC + CO(15NH2)2 + biochar
Moisture was adjusted to 90% WFPS in each jar by adding the required volume of a solution containing K15NO3 or CO(15NH2)2 (>99% 15N enrichment) at the appropriate concentration to obtain 90% WFPS and exactly 5.5 mg of 15N-per jar. Rewetting the soils in this way guaranteed a homogenous 15N pool. Gas samples for isotopic analysis were taken daily during the first 3 days and on day 10. For each treatment, two gas samples were collected using a 12-ml syringe and needle: one immediately after the screw cap was fitted to the jar (t = 0) and the second after 60 min (t = 60). The gas samples were transferred to 12-ml vials (Labco) previously purged with He and evacuated. Selected samples (a total of 192 samples) were analyzed for the isotope ratios of N2 [29/28 (29R) and 30/28 (30R)] and N2O [45/44 (45R) and 46/44 (46R)] by automated isotope ratio mass spectroscopy [ThermoFinnigan GasBench and PreCon trace gas concentration system interfaced to a ThermoScientific Delta V Plus isotope-ratio mass spectrometer (Bremen, Germany)].
Experiment 3. N2O emissions, mineral N, and N2O isotopic composition after addition of NO−2 in soil HC
Experiments 1 and 2 were reproduced in soil HC with a different source of nitrogen: NaNO2 was added to a set of 8 jars [4 replicates × 2 management treatments (biochar/control)] and homogeneously distributed in the soil at a rate of 200 kg N Ha−1. N2O and final concentrations of mineral N were determined as for Experiment 1 (see Figure 5).
Subsequently, the following 15N tracer experiment was performed: Soil HC +Na15NO2 vs. Soil HC + Na15NO2 + biochar (as for Experiment 2).
Moisture was adjusted to 90% WFPS in each jar by adding the required volume of a solution containing NaNO2 (>98% 15N enrichment) at the appropriate concentration to obtain 90% WFPS and exactly 5.5 mg of 15N-per jar. Gas samples for isotopic analysis were taken daily during the first 3 days and on the 10th day of incubation in the same way as in Experiment 2. A total of 64 gas samples [2 management treatments (biochar/control) × 4 replicates × 4 days (1/2/3/10) × 2 times per day (t = 0/t = 60)] were analyzed.
Experiment 4. N2O emissions and mineral N after addition of dicyandiamide to soil HC
The nitrification inhibitor dicyandiamide (DCD) was applied in combination with N fertilizers in soil HC. DCD inhibits the first stage of nitrification, the oxidation of NH+4 to NH2OH, by rendering the enzyme ammonia monooxygenase (AMO) ineffective. It is not a bactericide, and does not affect other heterotrophs responsible of the soil biological activity (Zacherl and Amberger, 1990).
A set of 24 jars [2 management treatments (biochar/control) × 3 fertilization treatments (no fertilizer/KNO3 /CO(NH2)2) × 4 replicates] was set up for the experiment. DCD was applied at a rate of 30 mg kg−1 soil to ensure its persistence over the entire incubation period (Rajbanshi et al., 1992). The fertilizers were homogeneously distributed in the soil at the same rate as in the previous experiments (200 mg N Ha−1) in the solution including the DCD. N2O samples were taken following the same intervals as in Experiment 1. Mineral N (NH+4, NO−3, and NO−2) was also extracted and determined in all jars at the end of the incubation period.
N2O Sampling and Measurements
For N2O sampling each unit was sealed with gas-tight polypropylene screw caps for an accumulation period of 60 min. The headspace gas was then sampled directly with a membrane air pump (Optimal 250, Schego, Offenbach am Main, Germany), attached to a gas chromatograph (VARIAN CP-4900 Micro-GC, Palo Alto, CA, USA) (Mondini et al., 2010).
N2O fluxes were calculated assuming a linear increase during the accumulation (closed) period, an approach which was verified prior to the experiments. Cumulative N2O was calculated assuming linear changes in fluxes between adjacent measurement points (Velthof et al., 2003).
Chemical-Physical Analyses of Biochar and Soils
Biochar
Proximate analysis was conducted using ASTM D1762-84 Chemical Analysis of Wood Charcoal. Total N and C were analyzed by automatic elemental analysis (FlashEA 1112 Series, Thermo scientific, Madrid, Spain). Water soluble C and N were determined in 1:10 (w/v) water extracts using a Photometer Nanocolor 500 D MACHEREY-NAGEL. Electrical conductivity (EC) and pH were determined in a 1:10 (w/v) water-soluble extract. NH+4 was extracted with 2.0 M KCl at 1:10 (w/v) and determined by a colorimetric method based on Berthelot's reaction. NO−3 and NO−2 were extracted with water at 1:10 (w/v) and determined by ion chromatography (HPLC, model 861, Metrohm AG, Herisau, Switzerland).
Soil
Soil texture was determined using the pipette method according to Kettler et al. (2001). Soils were extracted by shaking four replicates of moist soil (1/10, w/v dry weight basis) with 2.0 M KCl (for NH+4) or water (for NO−3 and NO−2) for 2 h. Extracts were centrifuged (2509 G) and filtered (0.45 μm) before analysis. NH+4 was determined by a colorimetric method based on Berthelot's reaction. NO−3 and NO−2 were determined by ion chromatography (HPLC, model 861, Metrohm AG, Herisau, Switzerland).
15N Calculations
The 15N atomic fraction in N2O was calculated from the 45/44 and 46/44 ratios of N2O. The 15N gas-flux method (Mulvaney and Boast, 1986; Stevens et al., 1993; Stevens and Laughlin, 2001) was used to quantify N2O and N2 emissions from denitrification in soil HP. The molar fraction of 15N-NO−3 (15XN) in the soil pool was calculated from Δ45R and Δ46R according to Stevens and Laughlin (2001). The flux of N2 and N2O was then calculated by the equations given by Mulvaney and Boast (1986). The presence of hybrid nitrous oxide (45N2O) co-metabolically introduced into the reaction pathway of denitrification was tested by the model developed by Spott and Florian Stange (2011). This model considers two different N sources, where each source generates non-hybrid N2O (46N2O and 44N2O) and, simultaneously, both N sources can be combined to form hybrid N2O (45N2O). According to this model, the contribution of each pathway to the total N2O formation can be calculated from the mass distribution of the released N2O and the 15N mole fraction of the labeled N source (Spott and Florian Stange, 2011).
Statistical Analysis
Univariate analysis of variance was used to investigate the significant differences in N2O emissions and mineral N concentrations between biochar and control treatments with IBM SPSS Statistics 21, Sommers, USA.
Results
Experiment 1. Cumulative N2O Emissions and Mineral N in Soils A and B
Soil HP emitted N2O when NO−3 was added but not in the absence of fertilizer or after the addition of urea. In this soil, biochar significantly reduced N2O emissions, by an average of 76% (Figures 1A1–A3).
Soil HC emitted N2O in all treatments: without N fertilization, after the addition of NO−3 and urea. In this soil, biochar consistently increased total cumulative N2O emissions and the average increase was larger in the non-fertilized (95%) and urea (129%) treatments than in the NO−3 treatment (54%), (Figures 1B1–B3).
Comparing treatments without biochar, the addition of NO−3 increased total N2O emissions in soil HP (from 54 to 11580 μg N2O-N kg−1 soil), whereas it increased N2O emissions slightly in soil HC (from 3443 to 4546 μg N2O-N kg−1 soil). The addition of urea had no impact on soil HP, and increased emissions in soil HC (from 3443 to 5799 μg N2O-N kg−1 soil).
Figure 2 shows NH+4-N concentration in soils HP and HC at the end of the experiment. The original concentration of NH+4 in soil HP was 19.3 mg N kg−1 soil. After 14 days of incubation, soil HP underwent a significant increase in NH+4 content for all fertilization treatments (74.5–110.4 mg N kg−1 soil). The highest increase was observed when soil HP was fertilized with urea. Biochar addition did not have a significant impact on the final NH+4 concentration in this soil.
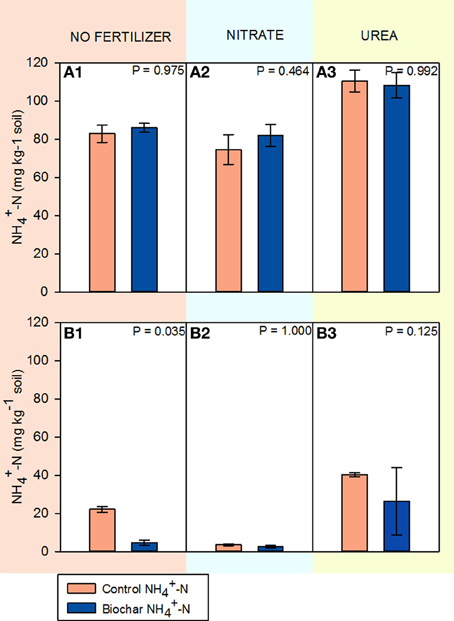
Figure 2. NH+4-N concentrations in soils HP and HC after 14 days of incubation (mean ± SE; n = 4). (A1–A3) correspond to soil HP unfertilized, fertilized with KNO3 and fertilized with CO(NH2)2 respectively. (B1–B3) correspond to soil HC unfertilized, fertilized with KNO3 and fertilized with CO(NH2)2 respectively.
Soil HC similarly increased its NH+4 concentration throughout the incubation (initial concentration: 2.8 mg kg−1 soil), excluding the KNO3 treatment. In this soil biochar significantly decreased the amount of NH+4 by the end of the incubation for the non-fertilized soil. Biochar also decreased mean NH+4 concentration in the urea treatment, although not significantly due to the high variability in the biochar samples.
Figure 3 shows (NO−3 + NO−2)-N concentrations in soils HP and HC. The concentrations of (NO−3 + NO−2)-N in soil HP were very low (<2.0 mg kg−1) for all fertilization treatments and biochar did not have a significant impact. However, NO−2 was detected in biochar amended soils and not in the control. Soil HC had low (NO−3 + NO−2)-N concentrations when no fertilizer was added or after the addition of urea. In contrast, 33.3 mg of NO−3-N kg−1 were found in the KNO3 treatment irrespective of the biochar addition.
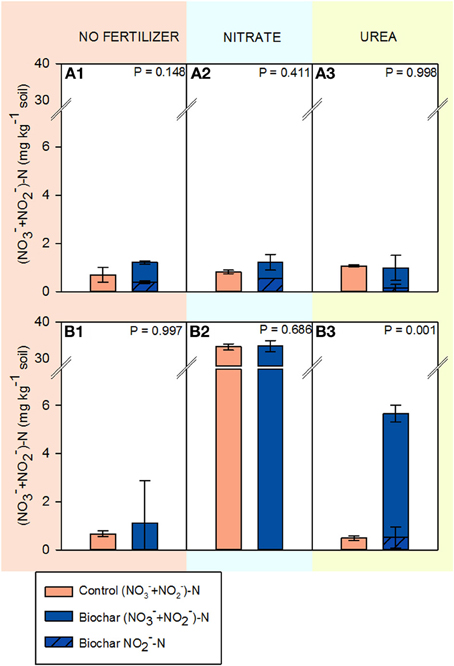
Figure 3. (NO−3 + NO−2)-N concentrations in soils HP and HC after 14 days of incubation (mean ± SE; n = 4). (A1–A3) correspond to soil HP unfertilized, fertilized with KNO3 and fertilized with CO(NH2)2, respectively. (B1–B3) correspond to soil HC unfertilized, fertilized with KNO3 and fertilized with CO(NH2)2, respectively.
Experiment 2. Isotopic Composition of N2O Emitted from Soils A and B
Figure 4 shows the 15N atomic fraction in N2O emitted from soils HP and HC in Experiment 2. When 15NO−3 was added, the initial 15N atomic fraction in N2O emitted from soil HP was 0.74, decreasing gradually to reach 0.04 at day 10 (Figure 4A). In contrast, the 15N isotopic composition in soil HC followed totally different dynamics: the initial 15N atomic fraction in N2O was only 0.18; it increased slightly to 0.33 by day three, and reached a final value of 0.10 by day 10 (Figure 4B1). Biochar altered the isotopic composition of N2O emitted in both soils.
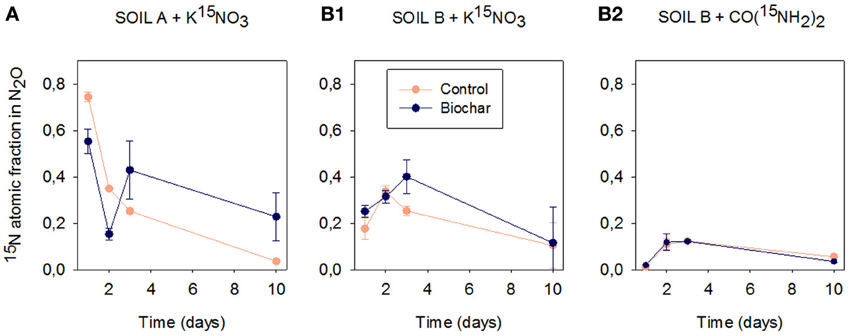
Figure 4. 15N atomic fraction in N2O emitted from soils HP and HC in control and biochar treatments after 1, 2, 3, and 10 days of incubation (mean ± SE, n = 4). (A) corresponds to soil HP fertilized with K15NO3 (>99% enrichment). (B1) and (B2) correspond to soil HC amended with K15NO3 and CO(15NH2)2 respectively (both at >99% enrichment).
When urea was added, soil HP did not emit N2O (Figure 1A3). In soil HC (even when emissions were high) the initial 15N atomic fraction in N2O was zero (Figure 4B2), it successively increased, but always remained beneath 0.15. The biochar and control treatments showed identical 15N-N2O concentration dynamics.
Table 2 shows the molar fraction of 15N-NO−3 and the ratio N2O/(N2 + N2O) calculated by the 15N gas flux method (Mulvaney and Boast, 1986) and the contribution of codenitrification to N2O formation according to Spott and Florian Stange (2011) in soil HP. The ratio N2O/(N2 + N2O) was very high during the first 3 days, which demonstrates that most N was lost as N2O. Biochar decreased the N2O/N2 ratio, particularly at day three (the peak of emissions in the control soil). The contribution of codenitrification was zero (see C in Table 2). This method of calculation could not be applied to soil HC, since other mechanisms than denitrification were operating in this soil and we could not calculate the enrichment of the source [15NO−3 in soil (15XN)] (Mulvaney and Boast, 1986). Nonetheless, we found a high proportion of N2O with a hybrid bond (45N2O) in soil HC.
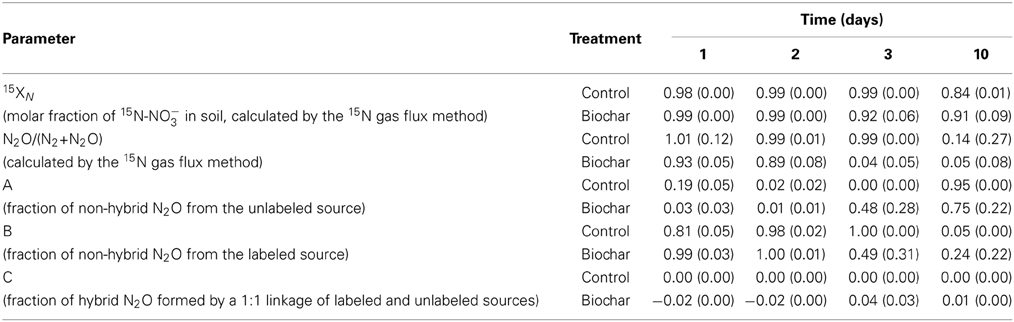
Table 2. Means and standard deviations (n = 4) of 15XN, the ratio N2O/(N2 + N2O) and the three fractions (A, B, C) of hybrid and non-hybrid N2O (Spott and Florian Stange, 2011) in soil HP.
Experiment 3. N2O Emissions, 15N Isotopic Composition and Mineral N after Fertilization of Soil HC with NO−2
Addition of NO−2 to soil HC produced the highest N2O emissions peak monitored in this soil (Figure 5B1); fourfold higher than that of the non-fertilized soil (Figure 1B1). Under these conditions, the biochar amendment did not modify cumulative N2O emissions.
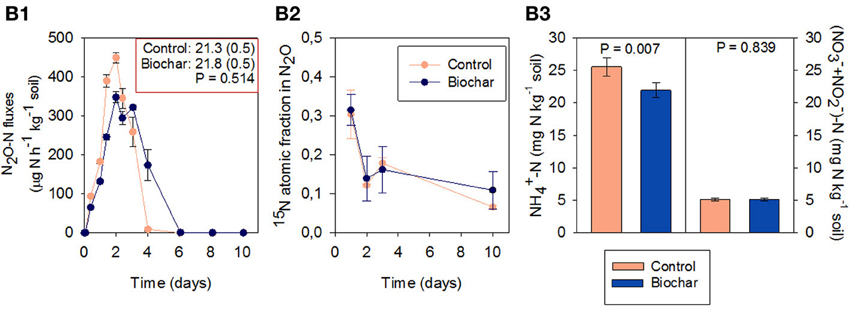
Figure 5. Fluxes of N2O (B1) 15N atomic fraction in N2O at days 1, 2, 3, and 10 (B2) and NH+4-N and NO−3-N concentrations after 14 days of incubation (B3) in soil HC (mean ± SE, n = 4). Soil HC had been fertilized with Na15NO2 (>98% enrichment). Cumulative N2O emission (mg N-N2O kg−1 soil) and standard error by the end of the incubation is reported in the right-above box in B1.
The 15N atomic fraction in N2O (Figure 5B2) followed a different pattern than with 15NO−3 (Experiment 2; Figure 4B1). The initial 15N atomic fraction in the N2O emitted was 0.30, decreasing gradually to reach 0.06 at day 10 (Figure 5B2). Biochar did not significantly modify this pattern.
The biochar amended soil had a significantly lower concentration of NH+4 at the end of the incubation (Figure 5B3). The concentration of NO−3 was low (below 5 mg kg−1 soil) and not affected by biochar addition.
Experiment 4. Impact of the Nitrification Inhibitor Dicyciandiamide (DCD) on N2O Emissions and Mineral N Concentration in Soil HC
N2O emissions almost ceased when DCD was added to soil HC (Figure 6). The highest emissions were observed when the soil was fertilized with NO−3 (Figure 6B2), but still represented less than 0.4% of the added N (compared to 12.7% without DCD (Figure 1B2).
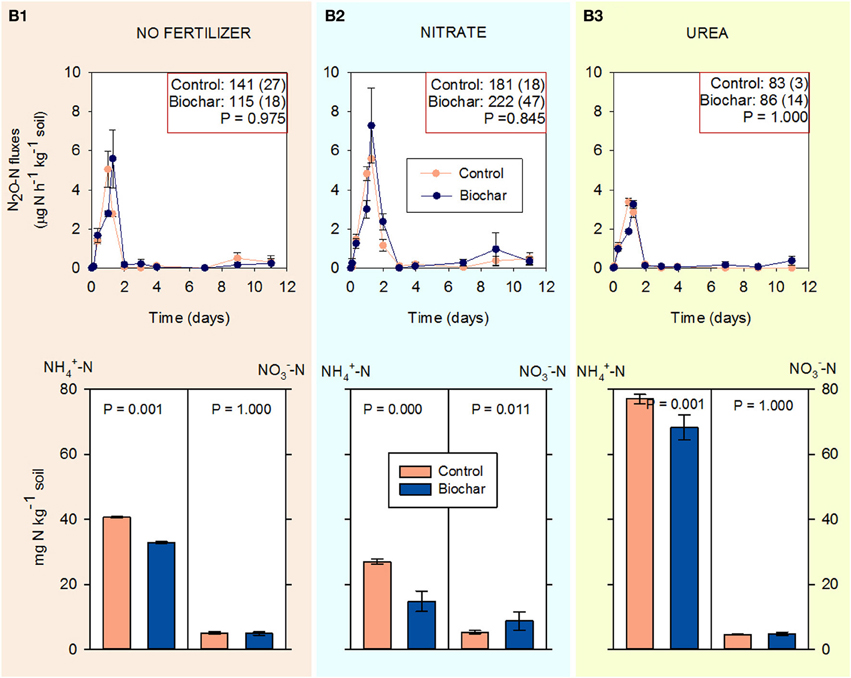
Figure 6. Fluxes of N2O (above) and NH+4-N and NO−3-N concentrations during 14 days of incubation (below) in soil HC containing DCD (30 mg kg−1 soil) in control and biochar treatments (mean ± SE, n = 4). (B1–B3) correspond to unfertilized soil, fertilized with KNO3 and fertilized with CO(NH2)2 respectively. Cumulative N2O emissions (μg N-N2O kg−1 soil) and standard errors by the end of the incubation are reported in the right-above box for each treatment.
The highest NH+4 concentrations were found in the soil amended with urea, followed by the non-fertilized soil and the soil amended with KNO3. Biochar (compared to the control) systematically decreased the concentration of NH+4 by the end of the incubation for all treatments (non-fertilized soil, KNO3, and urea). NO−3 concentration was lower than the original in soil (16.9 mg NO−3-N kg−1 soil).
Discussion
Pre-Dominant N2O Formation Pathways in Soil HP and HC
Nitrous oxide emissions patterns and their response to the addition of different N fertilizers were different in soils HP and HC, which clearly reflected the different N2O production pathways involved.
Figure 7 illustrates the main pathways for N2O formation in soil. Ammonia oxidation takes place in two steps: first NH3 is oxidized to NH2OH, which is then oxidized to NO−2. N2O may be directly released as a by-product of ammonia oxidation (nitrifier-nitrification) (Hooper and Terry, 1979) or it can be produced through a denitrification pathway where NO−2 is reduced to N2O (nitrifier-denitrification) (Kool et al., 2011). The ability to denitrify is a widespread, if not ubiquitous, attribute in ammonia oxidizers (Shaw et al., 2006). Classically, denitrification (from NO−3) has been considered the main N2O formation pathway in soils. However, other pathways that have been systematically overlooked in soil studies could play a more important role than originally estimated (Baggs, 2011; Spott et al., 2011). This is the case for codenitrification, which is potentially a widespread pathway of microbial N transformation in terrestrial environments (Spott et al., 2011) and dissimilatory nitrate reduction to ammonia (DNRA) (Giles et al., 2012). Although our knowledge of microbial N transformation in soil has evolved significantly over the last decades, recent findings show that, even today, our understanding of N2O formation and consumption in soil is still very limited (Sanford et al., 2012; Long et al., 2013).
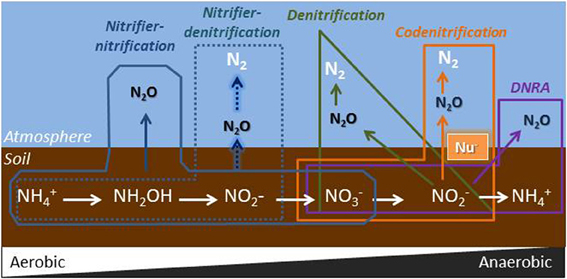
Figure 7. Microbial sources of N2O during transformations of mineral nitrogen in soil. Nu−: nuclophile (e.g., R-NH2, NH+4, amino acids or other organic N compounds). During codenitrification, nitrous acid reacts with a nucleophile in soil through nitrosation reactions forming a hybrid N-N bond (Spott et al., 2011); DNRA, dissimilatory nitrate reduction to ammonium.
In the nearly water-saturated soil conditions used in our experiments (90% WFPS), N2O production is expected to be dominated by denitrification of NO−3. This was the case in soil HP, where emissions were clearly controlled by the conventional denitrification pathway. This can be deduced from the following facts: (i) This soil only emitted N2O after the addition of NO−3 (Figure 1A2); (ii) the 15N atomic fraction of the N2O emitted at day one was 0.74 (Figure 4A), which shows that N2O was primarily produced from the added 15NO−3. The 15N atomic fraction decreased over time, showing the depletion of the labeled source; (iii) given the limited nitrification activity detected in this soil, addition of NO−3 did not increase the final NH+4 concentration (with respect to the non-fertilized soil), which suggests that DNRA was not a relevant pathway, and (iv) applying the equations developed by Spott and Florian Stange (2011), codenitrification was found to be null (Table 2).
As previously found in other soils under analogous optimal denitrifying conditions (Cayuela et al., 2013), biochar significantly decreased total N2O emissions in this soil.
In soil HC, the weak response of N2O emissions to NO−3 addition pointed out to a low contribution of denitrification or DNRA in this soil. Given that the original NO−3 concentration in the soil was 16.9 mg N kg−1 at a natural abundance of 0.364% 15N, and that we added 55 mg N kg−1 of 15NO−3 (>99% enrichment), the 15N-NO−3 enrichment in the soil at the beginning of the incubation was 75.8%. Yet, the 15N atomic fraction in the N2O emitted at day one (Figure 4B1) was only 0.18, which demonstrates that some N2O originated from denitrification, but also that NO−3 was not the only source of N2O. Moreover, the low C:N ratio of this soil and the NH+4 concentration at the end of the incubation in the KNO3 treatment (Figure 2B2) indicates that DNRA was not a major N2O formation route in this soil (Giles et al., 2012). Instead, we hypothesize that N2O formation in soil HC was mainly the result of nitrification-mediated processes. The results supporting this hypothesis can be summarized: (i) The addition of extra NO−3 did not increase N2O emissions in this soil, whereas the addition of extra urea did; (ii) the 15N atomic fraction of the N2O emitted at day one was 17.7% (Figure 4B1), which shows that N2O was not pre-dominantly formed from the added 15NO−3. (iii) The concentration of dissolved organic N in this soil was very high (35.9 mg N kg−1soil), which can explain the low contribution of the labeled urea to the emitted 15N2O (Figure 4B2). However, significant hybrid N2O (45N2O) was produced (data not shown) and we cannot discard the contribution of codenitrification to N2O formation in soil HC.
To better understand which processes (within nitrification-mediated pathways) biochar might be modifying we performed Experiments 3 and 4.
Impact of Biochar in N2O by Nitrification-Mediated Pathways
In Experiment 3 the addition of NO−2 to soil HC showed that, under high moisture conditions, this soil was able to rapidly reduce NO−2 to N2O, which was emitted in large quantities (38% of added NO−2-N). It is very unlikely that the N2O emitted was just the product of the chemical decomposition of NO−2 (chemodenitrification), since this process, largely controlled by soil pH, only occurs in neutral and acidic soils (Bremner, 1997). Instead, NO−2 was most probably used as electron acceptor for microbial respiration (nitrifier-denitrification). The high N2O production in Experiment 3 (21.3 mg N kg−1compared to 3.4 mg N kg−1 in Experiment 1) may be related to enhanced nitrifier-denitrification for detoxifying NO−2 (Jung et al., 2014).
The subsequent tracer experiment with application of 15NO−2, demonstrated that significant nitrite reduction to N2O occurs (the N2O originating from the added 15NO−2 at day one was 31.5%, see Figure 5B2), but also that it could not be the only process leading to N2O emissions. This experiment demonstrated that biochar was not increasing N2O emissions through the nitrifier-denitrification pathway, since N2O emissions in the biochar and control treatments were not statistically different.
In our final experiment (Experiment 4), the high NH+4 and low NO−3 concentrations by the end of the experiment demonstrate the effectiveness of the DCD treatment to inhibit ammonia oxidation, which correlated with a large decrease in N2O emissions for all treatments. We assumed that DCD did not inhibit other possible N2O formation pathways. Although the impacts of DCD on other aspects of microbial N transformation in soil are largely unknown, Bremner and Yeomans (1986) demonstrated that DCD does not inhibit N2O and N2 emissions by denitrification when applied at similar rates to those used in this study. More recently, Wakelin et al. (2013) also demonstrated in a field study that the application of DCD had a minor impact on denitrifying bacteria activity (nirS).
Addition of biochar significantly and consistently decreased the NH+4 concentration in soil HC. These results reinforce our conclusion that the production of N2O in soil HC must be the consequence of nitrification processes (nitrifier-nitrification and associated nitrifier-denitrification). It seems that biochar does not promote the denitrification from NO−2 (as was deduced from Experiment 3), but it does promote the oxidation of ammonia and concomitantly the formation of N2O through nitrifier-nitrification. Clearly, if biochar raises the production of NO−2 in soil, it will intrinsically enhance its denitrification (nitrifier-denitrification) when the soil is under low oxygen conditions (as in our experiments).
Our results are in agreement with recent findings by Prommer et al. (2014), who showed that biochar promotes soil ammonia-oxidizer populations and accelerates gross nitrification rates in a calcareous arable soil. The importance of nitrifier-nitrification and nitrifier-denitrification for N2O production in calcareous soils has been recently documented by Huang et al. (2014), who demonstrated that these processes accounted for 35–53% and 44–58% of total N2O emissions, respectively.
Here we present preliminary evidence that explains how biochar might affect N2O emissions differently depending on the N2O formation pathway operating in the soil. When denitrification was the main N2O formation pathway (soil HP), biochar was found to decrease the N2O/(N2 + N2O) ratio (Table 2), which is in agreement with previous findings (Cayuela et al., 2013). Recent studies have reported that biochar promotes an increase in the abundance of nitrous oxide reductase (nosZ) in soil (Harter et al., 2014), an enzyme that enhances the reduction of N2O to N2 (the last step in denitrification). In contrast, when N2O was produced by nitrification (soil HC), biochar addition might have increased emissions by promoting gross nitrification. To our knowledge, there are not published studies explicitly relating to biochar and nitrification-N2O production.
Another question that arises from this study is: why these two soils under identical experimental conditions follow different N2O formation pathways, which we hypothesize might be linked to different soil microbial communities. In conclusion, predicting which N2O formation pathway pre-dominates in a certain kind of soil will be necessary for guaranteeing the success of biochar as a N2O mitigation strategy.
Conflict of Interest Statement
The authors declare that the research was conducted in the absence of any commercial or financial relationships that could be construed as a potential conflict of interest.
Acknowledgments
We are very grateful to Prof. Miloslav Šimek (University of South Bohemia, Czech Republic) for supplying soil HP and to Pacific Pyrolysis Pty. Ltd (Australia) for providing the biochar used in the experiments. This work was possible thanks to a European Community Marie Curie Fellowship (FP7 PEOPLE-2010-MC-European Reintegration Grants (ERG) #277069). The European Social Fund is acknowledged for co-financing María Luz Cayuela's JAE-Doc contract at CSIC. The authors thank Dr. Sarah K. Wexler, expert in English editing and scientific writing, for her kind help revising this manuscript.
References
Baggs, E. M. (2011). Soil microbial sources of nitrous oxide: recent advances in knowledge, emerging challenges and future direction. Curr. Opin. Environ. Sust. 3, 321–327. doi: 10.1016/j.cosust.2011.08.011
Bremner, J. M. (1997). Sources of nitrous oxide in soils. Nutr. Cycl. Agroecosys. 49, 7–16. doi: 10.1023/A:1009798022569
Bremner, J. M., and Yeomans, J. C. (1986). Effects of nitrification inhibitors on denitrification of nitrate in soil. Biol. Fert. Soils 2, 173–179. doi: 10.1007/BF00260840
Cayuela, M. L., Oenema, O., Kuikman, P. J., Bakker, R. R., and Van Groenigen, J. W. (2010). Bioenergy by-products as soil amendments? Implications for carbon sequestration and greenhouse gas emissions. GCB Bioenergy 2, 201–213. doi: 10.1111/j.1757-1707.2010.01055.x
Cayuela, M. L., Sánchez-Monedero, M. A., Roig, A., Hanley, K., Enders, A., and Lehmann, J. (2013). Biochar and denitrification in soils: when, how much and why does biochar reduce N2O emissions? Sci. Rep. 3:1732. doi: 10.1038/srep01732
Cayuela, M. L., Van Zwieten, L., Singh, B. P., Jeffery, S., Roig, A., and Sánchez-Monedero, M. A. (2014). Biochar's role in mitigating soil nitrous oxide emissions: a review and meta-analysis. Agr. Ecosyst. Environ. 191, 5–16. doi: 10.1016/j.agee.2013.10.009
Clough, T. J., Bertram, J. E., Ray, J. L., Condron, L. M., O'Callaghan, M., Sherlock, R. R., et al. (2010). Unweathered wood biochar impact on nitrous oxide emissions from a bovine-urine-amended pasture soil. Soil Sci. Soc. Am. J. 74, 852–860. doi: 10.2136/sssaj2009.0185
Čuhel, J., Šimek, M., Laughlin, R. J., Bru, D., Chèneby, D., Watson, C. J., et al. (2010). Insights into the effect of soil pH on N2O and N2 emissions and denitrifier community size and activity. Appl. Environ. Microbiol. 76, 1870–1878. doi: 10.1128/AEM.02484-09
Giles, M. E., Morley, N. J., Baggs, E. M., and Daniell, T. J. (2012). Soil nitrate reducing processes – drivers, mechanisms for spatial variation and significance for nitrous oxide production. Front. Microbiol. 3:407. doi: 10.3389/fmicb.2012.00407
Harter, J., Krause, H.-M., Schuettler, S., Ruser, R., Fromme, M., Scholten, T., et al. (2014). Linking N2O emissions from biochar-amended soil to the structure and function of the N-cycling microbial community. ISME J. 8, 660–674. doi: 10.1038/ismej.2013.160
Hooper, A. B., and Terry, K. R. (1979). Hydroxylamine oxidoreductase of nitrosomonas: production of nitric oxide from hydroxylamine. Biochim. Biophy. Acta 571, 12–20. doi: 10.1016/0005-2744(79)90220-1
Huang, T., Gao, B., Hu, X.-K., Lu, X., Well, R., Christie, P., et al. (2014). Ammonia-oxidation as an engine to generate nitrous oxide in an intensively managed calcareous Fluvo-aquic soil. Sci. Rep. 4:3950. doi: 10.1038/srep03950
Jung, M.-Y., Well, R., Min, D., Giesemann, A., Park, S.-J., Kim, J.-G., et al. (2014). Isotopic signatures of N2O produced by ammonia-oxidizing archaea from soils. ISME J. 8, 1115–1125. doi: 10.1038/ismej.2013.205
Kettler, T. A., Doran, J. W., and Gilbert, T. L. (2001). Simplified method for soil particle-size determination to accompany soil-quality analyses. Soil Sci. Soc. Am. J. 65, 849–852. doi: 10.2136/sssaj2001.653849x
Kool, D. M., Dolfing, J., Wrage, N., and Van Groenigen, J. W. (2011). Nitrifier denitrification as a distinct and significant source of nitrous oxide from soil. Soil Biol. Biochem. 43, 174–178. doi: 10.1016/j.soilbio.2010.09.030
Long, A., Heitman, J., Tobias, C., Philips, R., and Song, B. (2013). Co-occurring anammox, denitrification, and codenitrification in agricultural soils. Appl. Environ. Microb. 79, 168–176. doi: 10.1128/AEM.02520-12
Malghani, S., Gleixner, G., and Trumbore, S. E. (2013). Chars produced by slow pyrolysis and hydrothermal carbonization vary in carbon sequestration potential and greenhouse gases emissions. Soil Biol. Biochem. 62, 137–146. doi: 10.1016/j.soilbio.2013.03.013
Mondini, C., Sinicco, T., Cayuela, M. L., and Sanchez-Monedero, M. A. (2010). A simple automated system for measuring soil respiration by gas chromatography. Talanta 81, 849–855. doi: 10.1016/j.talanta.2010.01.026
Mulvaney, R. L., and Boast, C. W. (1986). Equations for determination of nitrogen-15 labeled dinitrogen and nitrous oxide by mass spectrometry. Soil Sci. Soc. Am. J. 50, 360–363. doi: 10.2136/sssaj1986.03615995005000020021x
Prommer, J., Wanek, W., Hofhansl, F., Trojan, D., Offre, P., Urich, T., et al. (2014). Biochar decelerates soil organic nitrogen cycling but stimulates soil nitrification in a temperate arable field trial. PLoS ONE 9:e86388. doi: 10.1371/journal.pone.0086388
Rajbanshi, S. S., Benckiser, G., and Ottow, J. C. G. (1992). Effects of concentration, incubation temperature, and repeated applications on degradation kinetics of dicyandiamide (DCD) in model experiments with a silt loam soil. Biol. Fert. Soils 13, 61–64. doi: 10.1007/BF00337336
Saarnio, S., Heimonen, K., and Kettunen, R. (2013). Biochar addition indirectly affects N2O emissions via soil moisture and plant N uptake. Soil Biol. Biochem. 58, 99–106. doi: 10.1016/j.soilbio.2012.10.035
Sanford, R. A., Wagner, D. D., Wu, Q., Chee-Sanford, J. C., Thomas, S. H., Cruz-García, C., et al. (2012). Unexpected nondenitrifier nitrous oxide reductase gene diversity and abundance in soils. Proc. Natl. Acad. Sci. U.S.A. 109, 19709–19714. doi: 10.1073/pnas.1211238109
Shaw, L. J., Nicol, G. W., Smith, Z., Fear, J., Prosser, J. I., and Baggs, E. M. (2006). Nitrosospira spp. can produce nitrous oxide via a nitrifier denitrification pathway. Environ. Microbiol. 8, 214–222. doi: 10.1111/j.1462-2920.2005.00882.x
Spokas, K. A., and Reikosky, D. C. (2009). Impacts of sixteen different biochars on soil greenhouse gas production. Ann. Environ. Sci. 3, 179–193. Available online at: http://hdl.handle.net/2047/d10019583
Spott, O., and Florian Stange, C. (2011). Formation of hybrid N2O in a suspended soil due to co-denitrification of NH2OH. J. Plant Nutr. Soil Sci. 174, 554–567. doi: 10.1002/jpln.201000200
Spott, O., Russow, R., and Stange, C. F. (2011). Formation of hybrid N2O and hybrid N2 due to codenitrification: First review of a barely considered process of microbially mediated N-nitrosation. Soil Biol. Biochem. 43, 1995–2011. doi: 10.1016/j.soilbio.2011.06.014
Stevens, R. J., and Laughlin, R. J. (2001). Lowering the detection limit for dinitrogen using the enrichment of nitrous oxide. Soil Biol. Biochem. 33, 1287–1289. doi: 10.1016/S0038-0717(01)00036-0
Stevens, R. J., Laughlin, R. J., Atkins, G. J., and Prosser, S. J. (1993). Automated determination of nitrogen-15-labeled dinitrogen and nitrous oxide by mass spectrometry. Soil Sci. Soc. Am. J. 57, 981–988. doi: 10.2136/sssaj1993.03615995005700040017x
Suddick, E. C., and Six, J. (2013). An estimation of annual nitrous oxide emissions and soil quality following the amendment of high temperature walnut shell biochar and compost to a small scale vegetable crop rotation. Sci. Total Environ. 465, 298–307. doi: 10.1016/j.scitotenv.2013.01.094
Van Zwieten, L., Kimber, S., Morris, S., Downie, A., Berger, E., Rust, J., et al. (2010). Influence of biochars on flux of N2O and CO2 from Ferrosol. Aust. J. Soil Res. 48, 555–568. doi: 10.1071/SR10004
Velthof, G., Kuikman, P., and Oenema, O. (2003). Nitrous oxide emission from animal manures applied to soil under controlled conditions. Biol. Fert. Soils 37, 221–230. doi: 10.1007/s00374-003-0589-2
Wakelin, S. A., Clough, T. J., Gerard, E. M., and O'Callaghan, M. (2013). Impact of short-interval, repeat application of dicyandiamide on soil N transformation in urine patches. Agric. Ecosyst. Environ. 167, 60–70. doi: 10.1016/j.agee.2013.01.007
Yoo, G., and Kang, H. (2012). Effects of biochar addition on greenhouse gas emissions and microbial responses in a short-term laboratory experiment. J. Environ. Qual. 41, 1193–1202. doi: 10.2134/jeq2011.0157
Keywords: nitrous oxide, charcoal, nitrification, DCD, codenitrification, nitrogen fertilizers
Citation: Sánchez-García M, Roig A, Sánchez-Monedero MA and Cayuela ML (2014) Biochar increases soil N2O emissions produced by nitrification-mediated pathways. Front. Environ. Sci. 2:25. doi: 10.3389/fenvs.2014.00025
Received: 28 February 2014; Accepted: 09 June 2014;
Published online: 03 July 2014.
Edited by:
Christophe Darnault, Clemson University, USAReviewed by:
Anniet M. Laverman, Universite Pierre et Marie Curie, FranceLukas Van Zwieten, New South Wales Department of Primary Industries, Australia
Meihua Deng, Tsinghua University, China
Bing-Jie Ni, The University of Queensland, Australia
Copyright © 2014 Sánchez-García, Roig, Sánchez-Monedero and Cayuela. This is an open-access article distributed under the terms of the Creative Commons Attribution License (CC BY). The use, distribution or reproduction in other forums is permitted, provided the original author(s) or licensor are credited and that the original publication in this journal is cited, in accordance with accepted academic practice. No use, distribution or reproduction is permitted which does not comply with these terms.
*Correspondence: María L. Cayuela, CEBAS-CSIC, Campus Universitario de Espinardo, 30100 Murcia, Spain e-mail: mlcayuela@cebas.csic.es