Multi-decadal classification of synoptic weather types, observed trends and links to rainfall characteristics over Saudi Arabia
 Ahmed M. El Kenawy
 Matthew F. McCabe
 Georgiy L. Stenchikov3
 - 1Earth System Observations and Modeling Group, Water Desalination and Reuse Center, King Abdullah University of Science and Technology, Thuwal, Saudi Arabia
- 2Department of Geography, Mansoura University, Mansoura, Egypt
- 3Division of Physical Sciences and Engineering, King Abdullah University of Science and Technology, Thuwal, Saudi Arabia
An automated version of the Lamb weather type classification scheme was employed to characterize daily circulation conditions in Saudi Arabia from 1960 to 2005. Daily gridded fields of sea level pressure (SLP) from both the NCEP/NCAR and the European Center for Medium-Range Weather Forecast (ECMWF) reanalysis data (ERA40) were used as input data for this classification. The output catalog included 10 basic types, which describe the direction and vorticity of airflow in the region (i.e., cyclonic, anti-cyclonic, and directional). In general, our findings indicate that cyclonic (C) days represent the most frequent type among all days, with 69.2% of the annual count of days from 1960 to 2005, followed by SE directional flows (21%). It was also determined that airflows originating from the Indian Ocean (i.e., S, SE, and E) are more frequent than those from the Mediterranean and Red Seas (i.e., W, NW, and SW). The defined weather types were assessed for the presence of inter-annual and intra-annual trends using the Mann–Kendall tau statistic. The trend analysis suggests statistically significant changes in the frequencies of a majority of the weather types from 1960 to 2005. The relationship between the daily occurrence of rainfall and the frequency of individual weather types was also described using daily rainfall data from a network of 87 weather observatories. Results demonstrate that increasing frequencies of weather types connected to easterly inflows support higher precipitation amounts over the study domain. Characterizing the association between atmospheric circulation patterns and rainfall in Saudi Arabia is important for understanding potential impacts related to climate variability and also for developing circulation-based downscaling methods.
Introduction
Atmospheric circulations play a critical role in the Earth's climate system and better understanding their links and interactions provides a capacity for assessing regional climate variability, improving characterization of land-atmosphere connections and facilitating new insights into potential impacts of climate changes. In recent years, there has been a growing interest in studying the influence of atmospheric circulations on the surface climate, with a view to enhancing our understanding of dynamic meteorological processes, such as extreme weather events (Vicente-Serrano and López-Moreno, 2006; de Vries et al., under review). A number of studies have sought to provide evidence on the relationships between atmospheric circulation and inter-annual climate fluctuations on different spatial scales, including hemispheric (e.g., Hurrell and Deser, 2009), continental (e.g., Clark and Brown, 2013; Hoy et al., 2014), regional (e.g., Park and Ahn, 2014), and sub-regional (e.g., López-Moreno and Vicente-Serrano, 2007). In addition, possible changes in the recurrence of linked climate variables can be obtained by projecting changes in the probability of occurrence of atmospheric regimes (Goodess and Palutikof, 1998). Indeed, atmospheric circulations have steadily and increasingly been used for enhancing short-term forecasting of many meteorological variables. In downscaling studies, circulation characteristics can be used as predictors for regional and local climates (Goodess and Palutikof, 1998; Buchanan et al., 2002).
Atmospheric processes are likely to be reflected in the underlying weather types. For example, anti-cyclonic patterns are typically associated with dry conditions and clear skies. For this reason, efforts have been directed over the last few decades to develop schemes that categorize atmospheric circulations into distinct weather types (Huth et al., 2008). The aim of these approaches is to describe the local/regional pressure characteristics, so that each weather type provides a simple configuration of a variety of weather conditions. In this regard, although the results from weather type schemes can vary along prolonged time intervals and in regions with specific climate characteristics, possibly due to the pre-processing procedures such as selection of a “best” classification scheme, similarity function and number of final types, many authors have found that describing climate variability by means of weather types is advantageous, compared to using circulation indices (e.g., Huth et al., 2008; Jacobeit et al., 2009). This might be because large-scale climate indices (e.g., NAO and ENSO indices) generally focus on just a few atmospheric modes (i.e., positive, neutral and negative), whereas circulation classifications can explain a larger range of climate behavior and variability, particularly at more regional scale.
Generally, weather type classification methods can be classified into two broad groups: statistically-based methods and automated methods. A detailed discussion of the advantages and disadvantages of both methods can be found in Frakes and Yarnal (1997). Overall, the first group relies on statistical techniques for classification, including among others, principal components analysis (Esteban et al., 2005), canonical correlation analysis (Xoplaki et al., 2003), and cluster analysis (Littmann, 2000). For example, Alpert et al. (2004) applied a discriminant-based analysis to classify synoptic conditions over the eastern Mediterranean using NCEP data for 1948–2000. Automated classification approaches, on the other hand, often employ existing circulation-type catalogs, such as the Lamb weather types (Lamb, 1972), the Muller classification (Muller, 1977), or the Grosswetterlagen catalog (Hess and Brezowsky, 1977). While statistically-based approaches may result in many classes and subgroups, weather patterns can be assigned to a specific number of types in automated classification schemes (Linderson, 2001; Goodess and Jones, 2002).
Saudi Arabia is defined as a “typical” arid region (BWh in the Köppen classification, 1936). Nonetheless, it can occasionally be subjected to severe weather phenomena (Deng et al., under review). While rainfall events are infrequent and occasional, intense storms can lead to severe flash-floods, with consequences on infrastructure, property and human settlements. Despite the obvious necessity of studying synoptic-scale atmospheric situations responsible for such events, the atmospheric configurations related to these are generally poorly explained. In contrast to many regions, the links between atmospheric circulation and precipitation in the Middle East and North Africa (including Saudi Arabia) have received minor attention, with regional studies mostly devoted to the Mediterranean countries of the region [e.g., Morocco (Lamb and Peppler, 1987), Turkey (Türkeş and Erlat, 2005), and Israel (Black, 2012) or the Mediterranean mountains (López-Moreno et al., 2011)]. One possible explanation for this deficit is the lack of a complete, reliable and homogenized dataset of rainfall, that also provides a reasonable spatial coverage. Those studies that have sought to describe the spatial patterns of climate in Saudi Arabia have generally relied on a very limited number of observatories of short duration (e.g., Ahmed, 1997; Abdullah and Almazroui, 1998; Rehman, 2010; Almazroui et al., 2012). Among these, Ahmed (1997) employed factor analysis to classify Saudi Arabia into distinct climate regions, using 14 climate variables from a spatially restricted data set. More recently, Almazroui et al. (2012) assessed the observed annual rainfall over Saudi Arabia from 1978 to 2009, using daily records from 27 observatories. In the same context, there have been limited attempts at classification of the main synoptic types over the region, which can be indirectly linked to regional rainfall patterns. Earlier weather type classifications over the Middle East were restricted to the east Mediterranean (e.g., Alpert et al., 2004; Tsvieli and Zangvil, 2005).
Assessing the spatial and temporal characteristics of weather types in Saudi Arabia is important for two reasons. First, it can enhance our understanding of the possible influences of climate change and variability on atmospheric circulation at the local scale. For instance, as flood events in Saudi Arabia are associated with short duration extreme rainfall, classifying synoptic conditions on a daily basis can be beneficial to improve our understanding of these events and to interpret the physical processes behind them. Second, it is anticipated that large-scale weather patterns are likely to respond to climate changes, particularly in terms of changes in their frequency of occurrence and variability in space and time. As such, characterizing weather types may provide insights into the statistical association between the occurrence of specific weather regimes and rainfall response. This dependency is crucial when examining climate model simulations, as relationships developed via observation based data sets can be used in evaluation and subsequent forecasting of anticipated climate response.
The main objectives of this work are: (1) to categorize weather types in Saudi Arabia on a daily basis by means of an automated version of the Lamb weather types classification; and (2) to establish a connection between weather regimes and the occurrence of wet events in the region during rainy seasons (winter and spring). Apart from providing a description of hydro-climatological interactions in the region, this work represents the first attempt to classify multi-decadal circulation patterns in the region. Thus, this study may provide new insights into the main characteristics of weather types and their linkage with rainfall regimes in Saudi Arabia and the broader region.
Study Area
Saudi Arabia is located in southwestern Asia between latitudes of 15°22′ N and 32°09′ N and longitudes of 34°50′ E and 55°50′ E. It has an area of approximately 2.25 million km2 and occupies around 80% of the Arabian Peninsula. As shown in Figure 1, it is bounded by the Red Sea to the west, the Arab Sea in the south and the Arabian Gulf in the east. The altitude varies from 0 to over 3000 m. Rainfall in the region is characterized by high spatial and temporal variability, as revealed in Figure 2. In general, the annual average rainfall over the whole territory is approximately 114 mm/year. The rainy season extends from late October to April, with two peaks in late spring (March and April) and November. However, heating of the dry interior during the summer months may generate sufficient convection to develop cumulus cloud. In rare cases, the Red Sea Trough (RST) extends from East Africa through the Red Sea toward the eastern Mediterranean, allowing for the development of strong depressions over the central Red Sea, which may lead to heavy rainfall (de Vries et al., under review). Spatially, rainfall occurs more often in the southwestern regions, as orographic uplift significantly enhances rainfall on the windward sides of mountain ranges (Najd plateau and Sarawat mountains) along the Red Sea coast (Figure 2B). The southeastern region (namely the Rub al Khali, or empty quarter) shows the lowest annual rainfall totals, with almost no precipitation throughout the year.
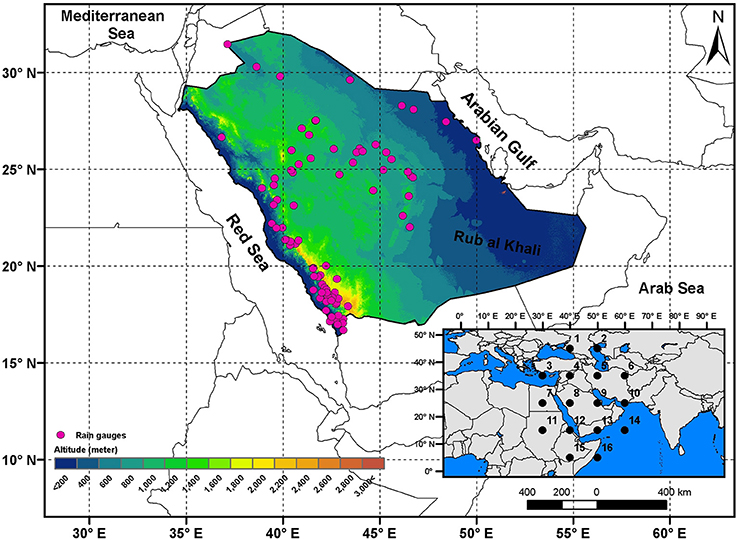
Figure 1. Location of the study domain and the spatial distribution of the meteorological stations together with the 16 grid points (1–16) used in the automated circulation-typing.
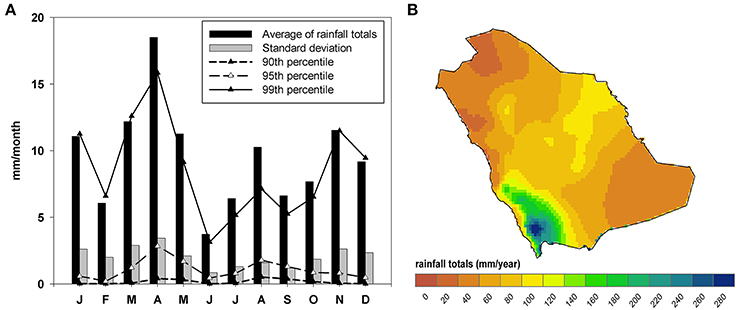
Figure 2. (A) Monthly accumulated rainfall for Saudi Arabia (black bars) and the corresponding standard deviation (gray bar), compared to a set of percentiles (90th, 95th, and 99th) calculated for the 1960–2005 period. Panel (B) shows the spatial distribution of the annual rainfall totals (mm) averaged from 1960 to 2005.
In addition to the influence of topography and local convective activity, rainfall regimes are impacted by the location and intensity of large-scale circulations. In particular, the region lies between two important features of the global general circulation: the band of subtropical configurations to the south, and the mid-latitudinal regimes to the north. The subtropical depressions, associated with a complexity of interactions of warm and cold fronts, sometimes shift to the Red Sea, bringing heavy rain to the region. Other configurations (e.g., the Azores High, the Siberian low and the monsoon) may also have indirect influence on the regional climate in Saudi Arabia.
Data and Methodology
Gridded SLP Data Sets
Here we define the daily synoptic weather types for Saudi Arabia according to the Lamb classification (see Section Circulation-Type Catalog). Weather types following this method are generally obtained using daily gridded data of mean sea level pressure (SLP) rather than air pressure at upper levels (see for example Goodess and Palutikof, 1998; Trigo and DaCamara, 2000; Vicente-Serrano and López-Moreno, 2006). Pressure data at the surface level are favored because the characteristics of precipitation are generally best described using circulation at the surface or lower levels of pressure (e.g., 850 hPa) (Conway and Jones, 1998; Post et al., 2002). In addition, surface pressure often produces a smaller range of synoptic conditions compared with upper pressure levels (McKendry et al., 2006). To generate the weather types catalog, we use daily SLP data from 16 points derived from the National Center for Environmental Prediction and the National Center for Atmospheric Research (NCEP/NCAR) reanalysis product (http://www.cdc.noaa.gov/cdc/data.ncep.reanalysis.html; Kalnay et al., 1996). The gridded daily SLP data are provided at a spatial resolution of 2.5° latitude × 2.5° longitude for the period 1960–2005. As illustrated in Figure 1, the 16 points are selected between 5°–45° N and 30°–60° E, so that the study domain is centered in the grid.
As there is limited access to station-based SLP data in the region, it is important to evaluate the reliability of the NCEP/NCAR SLP data. To accomplish this task, we assess the consistency of the defined weather types based on the NCEP/NCAR data set by comparing them against the European Center for Medium-Range Weather Forecast (ECMWF) reanalysis (ERA40) SLP data set. The ERA40 reanalysis data are supplied on a 1.5° by 1.5° latitude-longitude grid for the period 1960–2002 (Uppala et al., 2005). While some products (e.g., ERA-Interim) have a high spatial resolution (approximately 70 km), they only date back to 1979. Other products (e.g., UCAR ds010.0) present a relatively coarse spatial resolution (5° × 5°). For consistency, we therefore retrieve SLP data from 1960 to 2005 for a spatial domain consistent with the NCEP/NCAR data set.
Circulation-Type Catalog
The Lamb weather type catalog was initially developed for the British Isles using subjective methods (Lamb, 1972). To classify weather types in the study domain, we use the automated version of the Lamb classification following Jenkinson and Collinson (1977). This method is simple, straightforward and likely homogenous over time, regardless of the grid density (Demuzere et al., 2008). Thus, it has been used in several environments with varied climate regimes (e.g., Jones et al., 1993; Goodess and Palutikof, 1998; Trigo and DaCamara, 2000; Linderson, 2001; Vicente-Serrano and López-Moreno, 2006; Lorenzo et al., 2011; Ramos et al., 2011). This method has also been used as a tool for forecasting in a wide range of environmental studies, including analysis of air pollution (Hongisto and Joffre, 2005), ozone concentration (Tang et al., 2009), biometeorology (Laaidi, 2001), health risks (Rusticucci et al., 2002), wildfires (Papadopoulos et al., 2014), floods (Prudhomme and Genevier, 2011), droughts (Vicente-Serrano et al., 2011), and soil erosion (Ekström et al., 2002).
Using calculations of total shear vorticity (Z), the resultant flow strength (F), and direction (with an increment of 45°), the Lamb scheme can provide information on the direction (i.e., N, S, E, W, NE, NW, SE, and SW) and type (i.e., cyclonic, anti-cyclonic, hybrid) of surface flow. The southerly flow (SF), westerly flow (WF), total flow (F), southerly shear vorticity (ZS), and westerly shear vorticity (ZW) are computed from SLP data at the 16 grid points (P1–P16) shown in Figure 1, using the following expressions:
As indicated, F is defined as the sum of the westerly component of the geostrophic wind, while Z is computed as the sum of the westerly shear vorticity. The rules described in Table 1 are then employed to define the typical 26 weather types of the Lamb scheme [10 pure classes (A, C, NE, SE, NW, SW, E, W, N, S), eight cyclonic hybrids (CNE, CSE, CNW, CSW, CE, CW, CN, CS), and eight anti-cyclonic hybrids (ANE, ASE, ANW, ASW, AE, AW, AN, AS)]. The pure directional flow is computed using an eight-point compass, allowing 45° per each direction. Following Goodess (2000), the direction is computed by tan−1 (WF/SF), adding 180° if WF is positive. In this work, the classical 26 weather types are reduced to 10 by eliminating the hybrid types. Days with hybrid types are regrouped between either cyclonic (C) or anti-cyclonic (A) and their directional weather type (NE, SE, NW, SW, E, W, N, S) using a fractional weighting approach. For example, ANE is evenly distributed between A-type and NE-type, with 50% accounted to both. This occurs principally because the frequency of cyclonic and anti-cyclonic hybrid types is relatively small compared with pure synoptic (i.e., cyclonic/anti-cyclonic) or directional types. Numerous studies have aggregated Lamb's circulation types into fewer and more meaningful groups to facilitate inter-comparison (e.g., Trigo and DaCamara, 2000; Demuzere et al., 2008; Lorenzo et al., 2011). From a statistical point of view, a smaller number of weather types ensure a reasonable sample size for each type (Cortesi et al., 2013). To this end, the automated Lamb weather type method generates a daily circulation database (1960–2006) for 10 basic groups (eight directional and two synoptic).
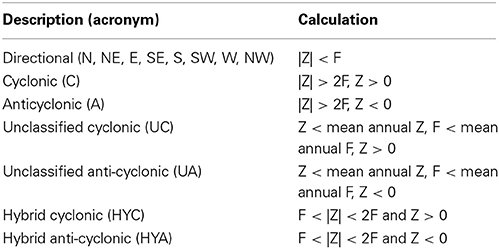
Table 1. The 14 circulation types defined using total shear vorticity (Z) and resultant flow (F).
Trend Detection and SLP Anomaly Analysis
In order to indicate the presence or absence of significant long-term trends in weather types, changes in their frequencies of occurrence are assessed from 1960 to 2005 using the least-squares regression method. The statistical significance of changes is estimated using the non-parametric Mann–Kendall tau statistic at the 95% level (p-value < 0.05). This test is robust to outliers and does not assume any prior distribution of the series (Lanzante, 1996) and has therefore been widely used for analyzing the significance of trends in climate and hydrology studies (e.g., Zhang et al., 2005; Choi et al., 2009; Liu et al., 2013). In this work, trend assessment is undertaken separately for each season. Seasons are defined as winter (DJF), spring (MAM), summer (JJA), and autumn (SON).
Composite maps of mean SLP corresponding to each weather type are also computed for the period from 1960 to 2005. The aim is to explore whether SLP patterns corresponding to each weather type are physically distinct and whether they can produce the expected type and direction of surface flow over the study domain. Here, the daily SLP data are first re-calculated as the deviation between each grid cell and its long-term average (1960–2005). The anomalies are calculated for each month separately, so that the effect of seasonal variability in pressure is minimized while the pressure spatial patterns are retained.
Links between Weather Types and Rainfall Characteristics
To assess the link between weather types and rainfall characteristics in Saudi Arabia, we use a network of 87 daily rainfall observatories, provided by the Saudi Ministry of Water and Electricity (MWE) from 1960 to 2005. The network is considered the most reliable in Saudi Arabia as it was screened for redundancy and the presence of erroneous values and outliers. Thus, it provides the best in-situ based representation of the range of climate regimes experienced across the country (see spatial distribution in Figure 1). As a function of altitude, just over 50% of observatories are below 700 m and approximately 25% are above 1000 m. It should be noted that the observatories used in this study are selected from a denser database of 209 stations spanning the period from 1960 to 2013. The selection of these observatories is based on the completeness of the series, as only those stations with relatively few missing values (less than 10% of the entire length of the record) are used. Here, no attempts were made to infill gaps because the time series of rainfall network show low spatial dependence among nearby observatories, even over short distances.
In this research, the development of relationships between weather types and rainfall characteristics focuses not only on mean changes, but also on other important characteristics, such as intensity and frequency of wet events. The aim is to explore whether there are any specific weather types that contribute more (or less) to rainfall in the region. This is particularly important in Saudi Arabia given the low rainfall totals in the region and the occasional nature of extreme events. Meteorological wet events are identified from the time series using two different indices. First, the most extreme rain-days (hereinafter RD99perc) are computed using values with probability of occurrence of 1% or lower. The RD99perc is determined for each observatory independently over the period 1960–2005. For each observatory, we also use a fixed absolute rainfall threshold to define extreme wet events. Rainy events (hereinafter RD30mm) are defined as those in which at least 30 mm of daily rainfall is recorded at any meteorological station.
It is inherently challenging to link rainfall amounts to the frequency of weather types in an arid region like Saudi Arabia. The relationship between weather patterns and rainfall characteristics cannot be assessed solely using the frequency of weather types. In Saudi Arabia, the number of rainy days is generally low, which makes it difficult to establish reliable statistics for rainfall characteristics (i.e., intensity and frequency) associated with each type. An alternative statistical approach is to assess the direction and strength of the rainfall-circulation relationship by comparing the frequency of weather types and rainy days with rainfall amount. More specifically, our approach relies on exploring the contribution of each weather type to rainfall totals as well as frequency of rainy days. In this respect, the contribution of a particular weather type to rainfall totals can be attributed to: (i) the proportion of rainy days, and/or (ii) the intensity of rainfall. To assess this association, we compute two indices following the procedure detailed by Goodess and Jones (2002). The first index compares the proportion of rainy days corresponding to each weather type to the proportion of all rainy days, at each observatory. The second index is defined as the ratio of the mean amount of rain that falls on days of a specific weather type to the mean amount of rainfall in all days. Both indices are calculated on a seasonal and annual basis.
Results and Discussion
Reanalysis Derived Patterns in Weather Types
Following the implementation of the Lamb weather type scheme, we calculated seasonal and annual totals for the 10 basic types using SLP from two independent sources (NCEP/NCAR and ERA40 data sets). The relative frequency of weather types obtained from both data sets annually and by season is given in Figure 3. A comparison between the defined weather types using the two data sets shows good correspondence. The frequencies of all types are consistent across both data sets and across all seasons. The relative occurrence of C-, SE-, E-, and A-types are well represented across all seasons in both data sets. While still consistent, the remaining weather types show a much lower frequency of occurrence throughout the study period. For example, there is agreement between the annual frequency of C-type in the NCEP/NCAR and ERA40 data sets (64.3% days per year in ERA40 and 66.5% in NCEP/NCAR). The high agreement is also seen for the frequency of C-type during the summer (98.4% summer days in ERA40 and 97.2% in NCEP/NCAR), highlighting the reliability and homogeneity of the NCEP/NCAR SLP data in the region for the considered period.
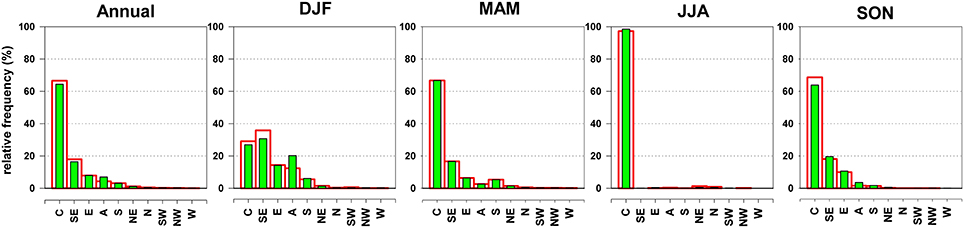
Figure 3. Annual and seasonal counts of the 10 basic Lamb weather types using SLP data from the NCEP/NCAR (red) and the ERA40 (green) data sets.
Figure 3 reveals that C-type is the most frequent at the annual scale, followed by SE- and E-types. Conversely, the occurrence of W, NW, and SW weather types is negligible for all periods throughout the year. This clearly suggests a stronger effect of the Indian Ocean wind component (E, SE, and S flows), compared with both the Mediterranean and Saharan influences (W and NW) and Asian continental airflows (N and NE). In winter, winds originating from the easterly quarter (NE, E, and SE) occur 51.6% of the time, followed by C (29%) and A-types (12.3%). In contrast, westerlies (NW, W, SW) show the least frequency during this season (0.7%). The presence of C-days during the winter can be associated with the intrusions of the Mediterranean cyclones, which occur frequently during this season. In winter, the central Mediterranean cyclones shift to the east. These depressions originally develop in the North Atlantic Ocean and the central Mediterranean and then move to the east, enhanced by the deepening upper level trough and the lee-low effect of the Cyprus mountains (Almazroui, 2006). Papadopoulos et al. (2013) indicated that the low pressure originating over both the east Mediterranean and equatorial Africa shifts during winter to be placed over the Red Sea. According to Cullen et al. (2002) and Kahya (2011), the winter cyclones over the Middle East region are significantly impacted not only by changes in the Atlantic westerly heat/moisture transport controlled by the NAO, but also by changes in sea surface temperatures (SSTs) between the Atlantic and the Mediterranean. In their study to assess the connections between atmospheric circulation and interannual variations of rainfall in Israel, Ziv et al. (2006) confirmed that the Cyprus low, a branch of the Mediterranean cyclones, is the main synoptic system affecting the eastern Mediterranean and parts of the Middle East during the winter.
C-type also has the greatest frequency of occurrence in spring, representing about two thirds (66.6%) of the days analyzed. Many studies regard the RST as the dominant circulation feature in the eastern Mediterranean and the Middle East during spring months (Ziv, 1994; Goldreich, 2003). Similar to the winter response, the circulation types driven by airflow with a westerly direction (W, NW, and SW) show lower frequency (0.1, 0.2, and 0.3%, respectively), than the eastern circulation types (SE:16.6%, E:6.3%, and NE:1.4%). A-type only occurs on about 2.6% of the spring days.
As depicted in Figure 3, the most obvious result during summer months is that the cyclonic (C) type has the greatest frequency of occurrence (97.2%), indicating that summer presents the least variations of weather types in Saudi Arabia. The relative frequencies of SW, NW, and W days are almost zero between late May and September. The relative frequency of A-days is also minimized (0.35%). This finding agrees well with Zarrin et al. (2010) who noticed that the frequency of the anti-cyclone centers over the Arabian Peninsula during the summer is negligible at all levels, except for the 500 hPa. The dominance of C-days during the summertime can be explained by the frequent low pressures at surface level during this season (Almazroui, 2006). Similarly, Littmann (2000) found that the Arabian Low deepens to its maximum in early summer (June and July). A large number of the cyclones are thermal lows, resulting from the high thermal contrast between the hot air over land and the colder maritime air in adjacent seas. Some authors (e.g., Chen, 2005) considered the thermal lows that develop over the Arabian desert as a westward extension of the Indian Monsoon trough. This can be linked to the extension of the intensified Persian Gulf Trough to the west in the period from June to September (Maheras et al., 2001). Similar to other seasons, both cyclonic conditions and easterly flows (E and SE) prevail 96.7% of the time over autumn compared with 1.6 and 1.4% of the time under anti-cyclonic and SFs, respectively. Likewise, SW, W, and NW days present very low relative frequencies.
Figure 3 also shows that the seasons that contribute most to annual rainfall totals (i.e., winter and spring) are characterized by a greater variety of weather types. Indeed, winter is the only season that generally shows a more balanced frequency distribution of weather types. For example, 96.9% of days are allocated to five weather types (C, SE, E, A, and S) in winter. By contrast, the driest seasons (i.e., autumn and summer) exhibit fewer weather types. This clearly suggests that rainfall in both the dry and wet seasons is largely influenced by variations in the number of weather types dominating in each season.
The results demonstrate that the Lamb scheme does not allow for defining how the cyclones are formed (i.e., thermal/synoptic). Therefore, it is quite difficult to evaluate the ability of the Lamb scheme to distinguish between cyclones associated with convective processes, which are more likely to occur at a very localized scale, and synoptic cyclones that extend largely over space. One explanation of this failure is that the Lamb weather type assumes that each day is dominated by a single synoptic type across the whole domain. In a country like Saudi Arabia, with an area of 2.25 million km2, a particular weather type may not characterize identical weather conditions on the same day across the whole country. For instance, while the northern and southern sides of the cyclone are devoted to the same weather type according to the Lamb classification, their weather conditions might be completely different. For this reason, these days cannot be easily attributed to a unique synoptic condition over the whole domain. Another reason is that the area of influence of thermal heating cyclones is usually small in terms of its size (i.e., very localized) compared with other synoptic patterns (e.g., anti-cyclones). Therefore, they are less well represented by the coarse resolution of the SLP grid-point data. Previous works (e.g., Goodess, 2000; Martin-Vide, 2001) found that the coarse resolution of the NCEP/NCAR SLP data fails to capture more local scale atmospheric configurations. Unfortunately, the availability of data sets of pressure with fine spatial resolution is not limited to this region alone.
In an attempt to distinguish between thermal lows and cyclones originating from synoptic conditions, we incorporated pressure data at the surface level with data of geopotential fields at low (500 hPa) and mid (200 hPa) troposphere fields. The chosen height levels are proven to be among the best predictors of climate variability in many regions worldwide (Pozo-Vázquez et al., 2001; Xoplaki et al., 2003; Vicente-Serrano et al., 2011). The use of geopotential data at different heights can determine whether anomalous low pressure at the surface during cyclonic days are forced by similar or different modes of pressure at mid and shallow troposphere. In particular, synoptic cyclones are expected to be accompanied by a dominant low pressure anomaly, not only at the surface, but also at upper air levels. Meanwhile, thermal lows resulting from convective activity often occur at the surface level and at a very local scale. To accomplish this task, daily data of geopotential fields are obtained from the NCEP/NCAR reanalysis on a regular grid of 2.5° × 2.5° resolution. Here, we first computed the daily anomalies of pressure at each grid using the long-term means calculated for each month independently from 1960 to 2005. Afterwards, the rank of pressure anomaly on each cyclonic day is obtained as a quantile, relative to all cyclonic days. For each cyclonic day, the quantile of pressure at the surface is then compared with that of the 200 and 500 hPa fields. When values are below the second quartile at the surface and above the second quartile at the height level, cyclonic condition on this day are assigned to thermal. In contrast, when values are below the second quartile at both surface and upper levels, the day is classified as synoptically cyclonic. Figure 4 depicts the relative contribution of the thermal and synoptic lows to the overall count of cyclonic days for each season. It can be clearly seen that the thermal lows dominate in all seasons, relative to synoptic lows. For example, a comparison of pressure anomaly at the surface and 200 hPa level suggests that 78.9% of cyclones during the summer are originating from convective activity, whereas only 21.1% have a synoptic origin. However, recalling that cyclonic days show the maximum frequency in the study domain throughout the year, with greater occurrence in spring and summer, more information about the positions and tracks of the cyclones is still needed. Therefore, it is probably prudent to rely on more sophisticated approaches to include the pressure at upper levels, which can be a useful tool for grouping cyclonic days into sub-types of circulation. Such classification may represent better dynamic frontal depressions and thermal cyclones in the region, which the Lamb scheme fails to clearly identify.
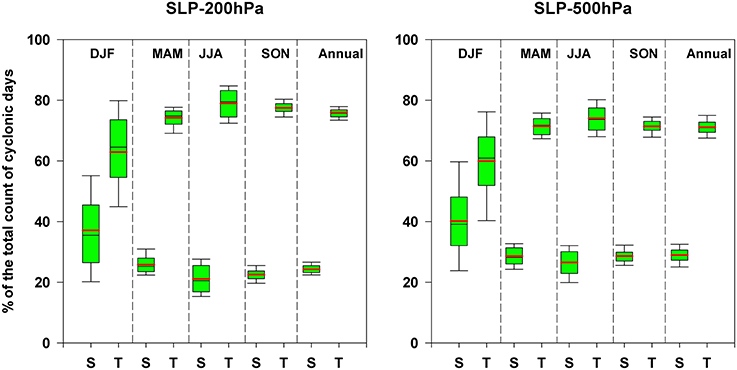
Figure 4. The relative contribution of the synoptic (S) and thermal (T) lows to the total count of cyclonic days. The percentage is calculated for each season independently. The central black line shows the median, whereas the red line indicates the mean. The horizontal lines of each plotted box plot illustrate the 10th, 25th, 75th, and 90th percentiles, respectively.
Trend analysis in observed weather types
Both the direction and the magnitude of the trends in mean annual frequency of the 10 circulation types are illustrated in Figure 5. The trends were estimated using the least-squares linear regression method and their statistical significance assessed at the 95% level using the Mann–Kendal tau statistic. Over the 46-year assessment, the time series analysis shows positive changes in the frequency for the majority of weather types, with a negative trend observed only for C- and S-types. Given the existence of these significant trends, the analysis may imply that all weather types are being influenced by potential changes in the mean climate state, regardless of their relative frequency. The strongest change was found for C-type, with a decrease of −5.1 days per decade. The observed decrease in the yearly frequencies of C-days suggests a decrease in low pressure events in the region. As shown in Figure 5, it seems that C- and E-types show reverse annual trends relative to each other. This suggests that years of high frequency of C and S regimes correspond to low frequency of flows from the east.
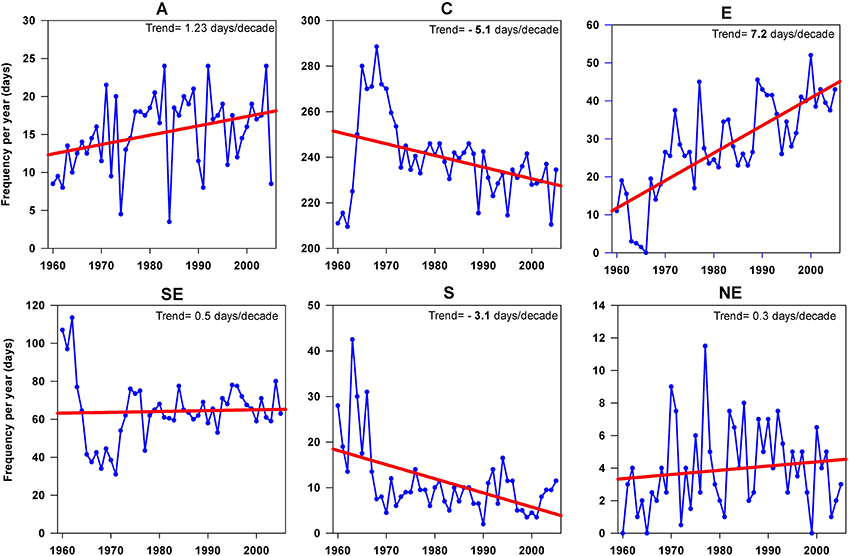
Figure 5. Temporal evolution of the annual frequency of the defined weather types during the period 1960–2005. Magnitudes of trends given in bold are statistically significant at the 95% level.
Table 2 summarizes linear trends in the seasonal frequencies of weather types from 1960 to 2005. The largest changes tend to occur for those types with high frequency (e.g., C, SE, and E). In winter, A, E, NE, and SE days exhibited an increase in their frequencies, while C and S days show a downward trend. This response is typically revealed in spring and autumn, with a greater increase in the frequency of A, E, NE, and SE-types relative to other types. Table 2 also indicates that there is a tendency toward an increase in the frequencies of weather types associated with low-rainfall (e.g., A and N). In the case of A-days (blockings), an increasing trend of 0.75 days/decade was found during winter, compared with an increasing trend of 0.48 days/decade in spring. In contrast, the high-rainfall types (e.g., C) tend to decrease. Almazroui et al. (2012) found a statistically significant decrease (47.8 mm/decade) in the annual rainfall over Saudi Arabia from 1978 to 2009. It can therefore be implied that the dry periods in the last decades can be related to a weakening of the cyclonic conditions and intensification of the anti-cyclones. Vicente-Serrano and López-Moreno (2006) indicate that the synoptic conditions that usually cause droughts correspond to the persistency of different anti-cyclonic configurations.
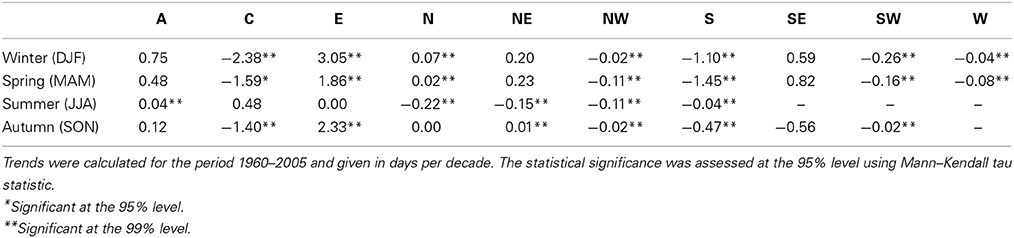
Table 2. Linear trends of the defined weather types using the SLP fields from the NCEP/NCAR reanalysis data.
Qualitative Assessment of Lamb Scheme Outputs Using SLP Configurations
Composites of the average SLP corresponding to each weather type for the 1960–2005 period are shown in Figure 6. The composite maps provide an indication on whether the circulation patterns support airflows from the direction defined by the Lamb classification in the previous section. They can also show whether SLP patterns associated with each weather type are distinct and physically meaningful, compared with other types. This is important because it determines whether each weather type is unique or whether it can be combined with other types with similar surface configurations when assessing the dependency between weather types and rainfall characteristics. A description of the SLP configurations associated with each weather pattern is provided, as follows:
• C-type configurations are characterized by two low-pressure centers, with the first developed over the Sahara to the west of the study area, while the second is placed over Southwest Asia and the Arabian Sea. Over the Arabian Peninsula, the mean frequency of the low pressure is enhanced by the frequent intrusions of the Persian Gulf Trough during the summer and the east Mediterranean cyclones during winter. The East European High is already established over continental Europe. This situation enhances moisture transfer from the tropical section of the Indian Ocean into the study domain, particularly in winter and spring.
• SE-type formations are characterized by a displacement of the cyclones to the north of the study domain. This situation is also accompanied by a negative mode of the NAO over the mid-latitudes and northern Atlantic and significant intrusions of the Siberian Anticyclone over mainland Asia. The spatial component of the SLP anomaly enhances advection of warm and humid air, accompanied by a cyclonal curvature of isobars over the study domain.
• E-type patterns are associated with the dominance of the anti-cyclonic system over central and eastern Europe, having a maximum intensity over the Black Sea. The East European High is established and extends southward toward the Balkan, eastern Mediterranean and large parts of North Africa and the Middle East. At the same time, the Azores High tends to be over the Western Mediterranean. Two well developed negative anomaly systems are positioned over the Indian Ocean and the Arabian Sea and large parts of Eurasia.
• A-type systems are characterized by the presence of a well-developed anti-cyclonic center over the Arabian Peninsula. The frequent high pressure at surface level, enhanced by the thermal heating, leads to a significant SLP gradient over the Arabian Peninsula. This synoptic condition is characterized by statically stable inversions with calm or weak winds. As illustrated in Figure 6, A-type over Saudi Arabia corresponds to a weakening of the Azores high (pressure) and a dominance of cyclones over Europe and the Mediterranean region.
• S-type circulations are generally associated with the formation of a cyclonic system placed over the eastern Mediterranean and western Asia. The anti-cyclones developed over the Arabian Sea are still weak. Therefore, the wind is generally weak, with a southerly component.
• NE-type systems are associated with a distinct west-to-east pressure gradient, with higher pressure throughout northern Africa and lower pressure over the southwest of Asia. The positive anomaly over north Africa is an extension of the subtropical high to the north, while the low pressure is an extension of the Indian Monsoon in the east. The boundary between the high-pressure and low-pressure anomalies lies over the Red Sea and allows for dry airflow originating over continental Asia.
• N-type flows are mainly enhanced by the absence of blocking activity over eastern Europe and western Asia. This configuration is governed by two pressure systems: the Siberian high and the eastern Mediterranean depressions. These air masses are typical for continental air masses, which are generally drier and not associated with rainfall, particularly from late autumn until the end of spring.
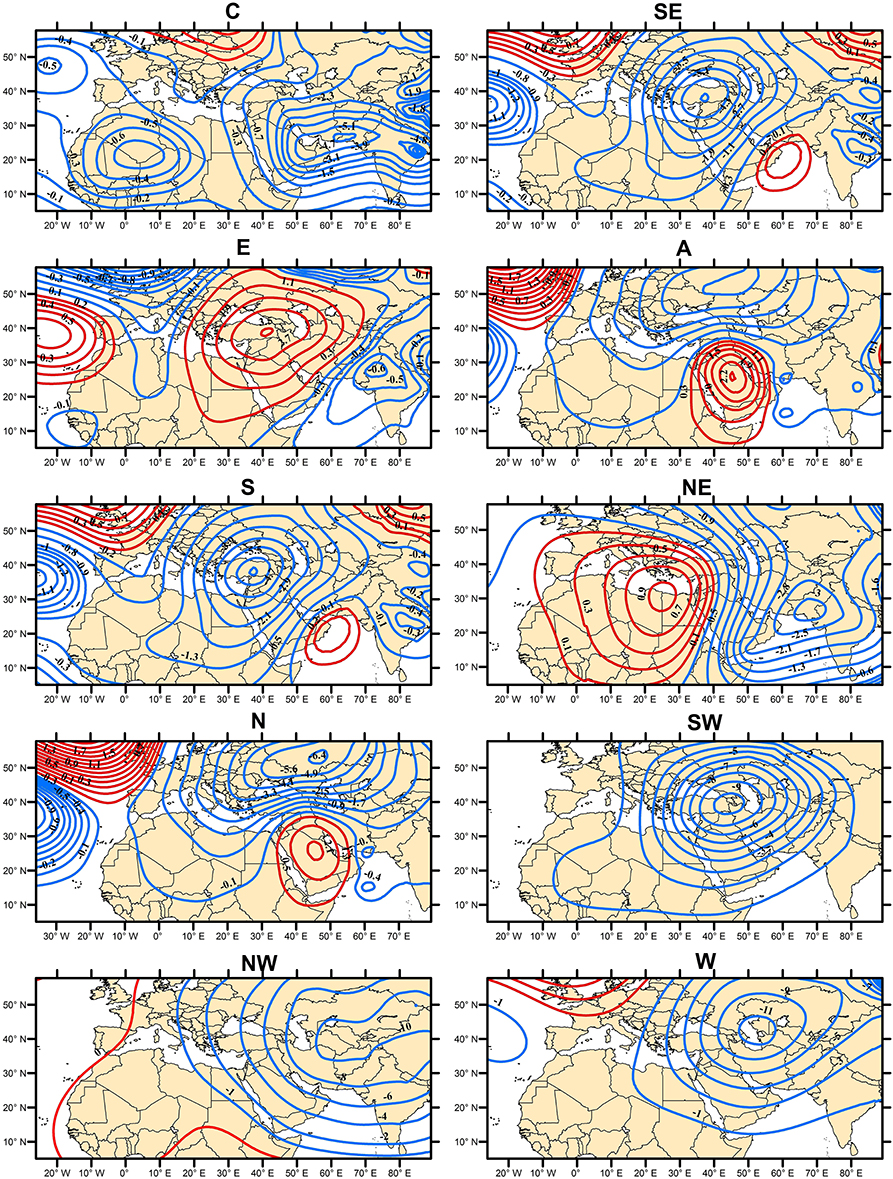
Figure 6. Composite maps of anomaly SLP fields for the 10 weather types calculated for the 1960–2005 period. Positive (negative) anomalies are shown in red (blue). Daily anomalies were computed by subtracting the daily long-term mean (1960–2005) of SLP from the mean of all days corresponding to a particular type.
As illustrated in Figure 6, A- and N-types are associated with intensification of the negative NAO in the north and central Atlantic. In contrast, the E-type corresponds to the NAO positive mode, in which above-normal SLP anomalies are located over the British Isles and below-normal anomalies are positioned over the mid-latitudes of the Atlantic Ocean. SW-, NW-, and W-types show fairly similar SLP anomaly patterns, although the anomalies of W- and NW-types are somewhat smaller in their magnitude (hPa), which leads to a weak pressure gradient over North Africa and the Middle East. These patterns are generally characterized by an intensified extension of the Persian Gulf Trough to the eastern Mediterranean. Correspondingly, there is a clear absence of the Azores High anti-cyclonic.
Figure 6 indicates that when high-pressure systems reach their greatest intensity over the Arabian Peninsula (e.g., A and N), the synoptic conditions are likely favored for significant low rainfall throughout the country. Conversely, when the high pressure anomalies are much further north, as in the case of E-type, the easterlies tend to be displaced well to the south of the country. Easterly airflows are associated with advection of moist air from the Indian Ocean, which often produces rainfall. On the other hand, rainfall tends to be relatively higher when the depressions are displaced over the Arabian Peninsula. These depressions can originate from different sources, including the migration of the East Mediterranean depressions in winter (e.g., Cyprus low), the RST in spring, and the Persian Gulf Trough and local thermal heating in summer. However, the wind directions corresponding to a cyclonic synoptic condition and their influence on rainfall in the study area varies markedly, depending on the intensification of the cyclones, their position, as well as the position of the high pressure anomaly. By comparison, when the positive anomalies are centered east of the Arabian Sea and over equatorial sections of the Indian Ocean, the rainfall is likely to be much higher in the region. In such situations, maritime air masses move from the Indian Ocean toward the Persian Gulf coasts and the Arabian Peninsula. However, it should be emphasized here that no single type can completely describe changes in rainfall characteristics in the region. This is simply because there are always some transitional cases, in which different configurations can interact with each other. Almazroui (2006) highlighted the role of the interaction between the RST and the southeastern flows on rainfall in the central Red Sea region.
For the majority of weather types, the composite maps of SLP are physically distinct, showing the expected type and direction of surface flow over the study area, as predicted by the Lamb classification scheme. For particular patterns (e.g., W and NW), the composite maps reveal similar underlying pressure patterns. They show very small differences in the positions of synoptic centers, although the frequencies of these patterns differ. However, even for those patterns, they are relatively distinct in the sense that their pressure gradients vary over space. For S-type, high pressures are almost in the same place as in SE cases, but with lower pressures, become established in eastern Europe. This finding implies that the results of the automated Lamb weather types in the study domain can be used to explore the association between defined weather types and rainfall in the region—the focus of the following section.
Observation Based Relationships between Weather Types and Rainfall
Local measurements from 87 observatories spanning the period from 1960 to 2005 were used to establish relationships between weather types and rainfall characteristics. Figure 7 (left) shows the contribution of each weather type to the annual rainfall in the region. The aim here is to identify those types which contribute greater (or less) than average to the annual rainfall totals for each observatory. As illustrated, SE-, E-, S-, and NW-types favor above normal rainfall across Saudi Arabia. While SE-, E-, and S-type events occur quite frequently throughout the year, NW-types occur infrequently. Conversely, A, NE, SW, and W patterns are responsible for below-average rainfall. This implies that weather types can generally be grouped into “wetter” (C, SE, E, S, and NW) and “drier” (A, N, NE, SW, and W).
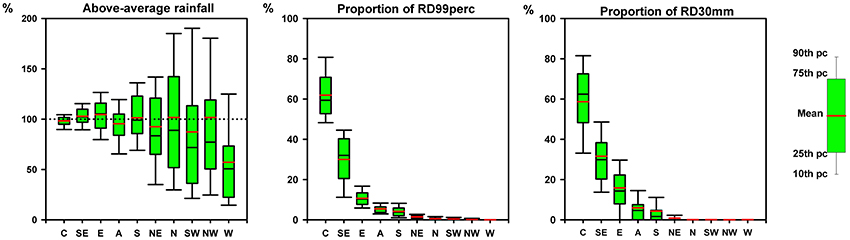
Figure 7. Box plots showing the ratio of the average of rainfall totals falling during days of each weather type and those falling in all rainy days (left). Also, the relative frequency (%) of RD99perc days (middle) and RD30mm days (right) corresponding to each weather type is plotted. All calculations were made using daily data from 87 observatories from 1960 to 2005. The black central line of each box denotes the median. Red line indicates identical changes (no differences) between the rainfall totals falling during days of a particular weather type and those of all rainy days.
It should be emphasized that the results also suggest higher deviations for the patterns with the least frequency (e.g., S, SW, and NW) compared with those of the maximum frequency of occurrence (e.g., C, SE, E, and A). This demonstrates that the influence of some weather types on the intensity of rainfall is very significant for some observatories, although these types rarely occur all year round. For example, the contribution to the annual rainfall from the rain-days classified as cyclonic is close to the annual rainfall totals of all rain-days for all observatories, with the greatest deviation of around 15.4 ± 19.1%. By contrast, though being favored for below normal rainfall, the NE, SW, and W regimes account in some observatories for rainfall totals much greater than their annual totals in all rain-days (e.g., 109.8% of deviation from the average rainfall totals for W days). Here, it should be noted that the negative deviations found for some of the types responsible for above-normal rainfall (e.g., SE, E, and NW) may be linked to the influence of topography or distance to water bodies (e.g., the Red Sea, the Arabian Sea), which can modulate the influences of these airflows over space. For example, NW flow brings rain to the western portions of Saudi Arabia, but not to the far eastern and southeastern regions.
To distinguish between the influence of weather types on both average rainfall and extreme rain events, we looked for the contribution of each weather type to the frequency of extreme wet events. Here, we defined the extreme rainy day by using an absolute (30 mm) and percentile-based (99th) threshold. As shown in Figure 7 (middle and right panels), C, SE, and E weather types contribute more to extreme wet events in Saudi Arabia throughout the year. C-type events contribute about 61.9 and 58.6% of the annual frequency of RD99perc (rainy days exceeding the 99th percentile of rainfall distribution) and RD30mm(days receiving 30 mm of rainfall or above), respectively. Approximately 30.0% of RD99perc and 31.6% of RD30mm events are associated with intensification of SE flows.
Several studies have sought to investigate the relationships between changes in precipitation and the frequency of different weather types in many regions. Trigo and DaCamara (2000) concluded that the decrease in the frequency of C-type contributed significantly to the decrease in precipitation during the second half of the 20th century in Portugal. In the eastern Mediterranean, Maheras et al. (2001) investigated the connection between precipitation and the frequency of cyclonic type over the last decades of the 20th century, concluding that high precipitation was associated with intensification of cyclones. In contrast, the contribution from NE, N, SW, NW, and W weather types to the occurrence of both RD99perc and RD30mm is considerably lower than for other weather types. In this study, a quick comparison of the panels in Figure 7 reveals the low number of extreme rain-days (RD99perc and RD30mm) associated with N and NW days, although these types are denoted as favorable for higher than average rainfall. Taken together, this may suggest an increase in the contribution of moderate rainfall events to total rainfall during these types.
A comparison between changes in precipitation amounts and frequencies and changes in the frequency of synoptic types was also examined. The analysis was predominantly restricted to winter (DJF) and spring (MAM), as most rainfall falls within these two seasons (roughly 65% of the annual rainfall totals) in Saudi Arabia. As shown in Figure 8 (upper panels), C, SE, and E regimes contribute to the vast majority of both rain-days and total amount of rainfall, with smaller contributions from N, NE, NW, SW, and W regimes. This offers some insight into the higher contribution of the Indian Ocean (i.e., SE, E, and S) to the annual fraction of rainfall in the region. The frequency of wet events and changes in rainfall intensity in Saudi Arabia seems to be conditioned by the phase of the intra-seasonal oscillation over the Indian Ocean and the Arabian Sea. Figure 8 also reveals that C-type contributes, on average, to 63.4% of the annual count of rain-days (>1 mm) and 61.8% of the annual rainfall sums.
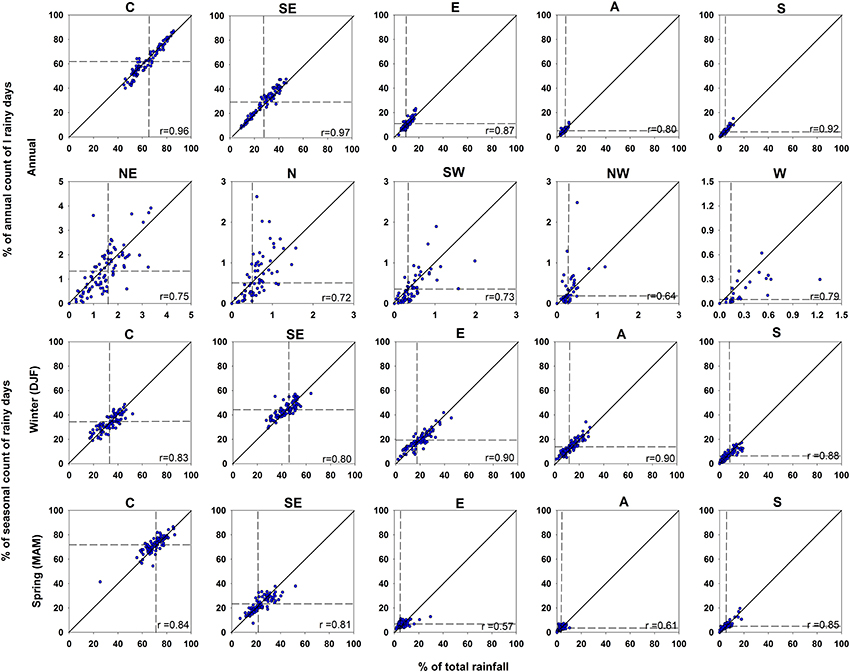
Figure 8. Scatter plots between the ratio of total rainfall corresponding to each weather type and the total rainfall of all rain-days (>1 mm) for each observatory (X-axis) against the ratio of the count of rain-days corresponding to each weather type and the count of all rain-days for each observatory (Y-axis). Dashed lines indicate the mean. The X and Y axes were re-scaled for the NE, N, SW, NW, and W annual types to improve their readability. Relationships were calculated for the annual and rainy season (winter and spring) periods.
Recalling that C-type represents roughly 65.6% of the days count per year, we may infer that it is the key circulation type influencing rainfall regimes in the region all year round. As illustrated in Figure 8, rainfall amounts corresponding to C-type are strongly correlated with the count of rainy days classified as cyclonic (r = 0.96). This clearly implies that rainfall amounts during these days show a regular distribution, with less intense wet events. Similarly, SE- and E-types are responsible for 28.5 and 10.5% of the count of rain-days, 29.2 and 10.9% of the total rainfall, but only 17.6 and 7.7% of days in the year, respectively. This indicates that SE and E days are more likely to be rainy within the year, relative to days with predominantly cyclonic conditions.
If we consider these relationships for the rainy seasons in Figure 8 (middle and lower panels), we can see that the main weather types follow a different distribution to that found on the annual scale. In winter, it seems that no single type can completely describe changes in rainfall characteristics in the region. The C-type explains 33.2% of the winter total amounts of rainfall, compared with 43.3% for SE-type. Similarly, 33.4 and 44.2% of the total rain-days during the winter months are associated with C- and SE-types, respectively. Remaining types (e.g., E, A, and S) also contribute to either the rainfall totals or the seasonal count of rain-days during this season. In winter, it seems that the most intense rainfall is associated with days experiencing southerly (S) flows. However, although these days represent only 2.4% of the winter days, they contribute to more than 8.3% of the total rainfall and 6.4% of the count of rain-days. In spring, the maximum contribution to the rainfall totals and the highest frequency of rain-days are primarily allocated to C-type. A lower proportion of the rainfall totals and the count of rain-days are contributed by E, A, and S patterns. On average, 70.1% of rainfall during the spring months are linked to cyclonic conditions, compared with 24.2% for the southeasterly flows.
As depicted in Figure 8, the high percentage of rainfall contribution from C and SE weather types during the winter and spring is mainly due to the high proportion of rain-days of these types. This can be revealed in the strong correlation between the percentage of rain-days and their contribution to the total rainfall. The Pearson coefficient was found to be 0.96 for C- and 0.97 for SE-types, while it varies from 0.80 (SE) to 0.83 (C) in winter and 0.81 (SE) to 0.84 (C) in spring. The association is weaker for other types (e.g., E and A in spring). This suggests that more rainy days may contribute to smaller amounts of rainfall and vice versa, a response that is evident in Figure 9. Pearson correlation coefficients calculated between circulation-type frequency during the spring and rainfall totals (mm) from 1960 to 2005 are negative for A-type and positive for E-type. This implies that rainfall intensity tends to show higher variations among stations, compared with their differences in terms of the ratio of wet days to all considered days.
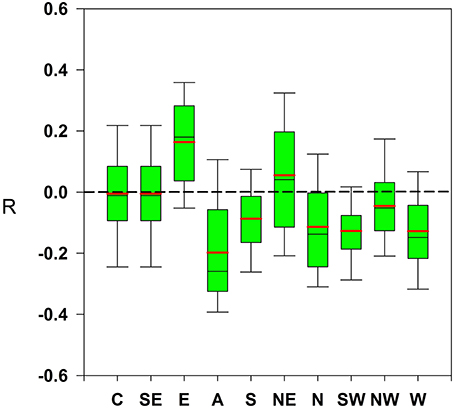
Figure 9. Box-plot of Pearson correlation values between the mean frequency of the defined weather types and rainfall totals (mm) during the spring, calculated for 87 observatories. Statistical significance was assessed at α < 0.05. The description of box plots is the same as Figure 7.
Conclusions
A comprehensive analysis of the seasonal characteristics of weather types in Saudi Arabia and their links with rainfall regimes has been performed. An attempt was made to apply an automated version of the Lamb weather type classification scheme in Saudi Arabia, which is a region influenced by the tropical and extratropical teleconnections of the northern Hemisphere. Using daily SLP data at 16 grid points, the direction and type of surface winds were computed from 1960 to 2005. The analysis revealed that the most common weather types in any part of the year are the cyclonic, southeastern, eastern, and anti-cyclonic types. Westerly, southerly and northerly flows were the least frequent. The results also demonstrate that the cyclones associated with thermal convectivity are significantly more frequent compared with the cyclones of synoptic origin. For the studied period, trend analysis of the defined weather types indicated a generally positive trend in the frequency of types associated with dry conditions (e.g., A, SE, and E) and a general negative trend in patterns favoring above-normal rainfall (e.g., C).
To provide an assessment of inter-annual variations of weather types and explore their association with wet events over Saudi Arabia, we employed daily rainfall totals (mm) from a network of observatories (N = 87). The synoptic patterns of SLP associated with the defined circulation in the region were identified and described over the period 1960–2005. The results indicate that weather types contributing to the highest fraction of winter (DJF) and spring (MAM) rainfall are C-type and also those with a predominant directional flow from the Indian Ocean (i.e., SE, E, and S).
The relationships described in this paper advance the understanding of the large-scale processes that contribute to the climate of Saudi Arabia and the results enhance our current understanding of pressure–rainfall dependency over the region. The results obtained by the Lamb weather type scheme may serve as a basis for informing the parameterization of climate models operating in the region, particularly on the seasonal scale. The relationships between atmospheric regimes and wet events may also be used for downscaling purposes, as they offer a potential for statistical description of the occurrence of extreme event in the region. Although rainfall changes in Saudi Arabia may be driven in part by changes in the circulation, observed changes in rainfall cannot be explained by changes in the circulation alone. The results of this work motivate future efforts to examine whether other synoptic classification techniques can be applied. Indeed, it might be informative to incorporate upper-air trough (e.g., 500 and 1000 hPa) in order to improve the prediction of rainfall in the region. In the same regard, although the spatial resolution of the NCEP/NCAR SLP data is satisfactory for downscaling purposes (as it is generally comparable with the spatial interval of GCMs), an improvement in the SLP grid resolution might be more appropriate for capturing important mesoscale or convective processes in the region.
Conflict of Interest Statement
The authors declare that the research was conducted in the absence of any commercial or financial relationships that could be construed as a potential conflict of interest.
Acknowledgments
Research reported in this publication was supported by the King Abdullah University of Science and Technology (KAUST), Saudi Arabia. Observed rainfall data were provided by the Ministry of Water and Electricity (MWE), Saudi Arabia.
References
Abdullah, M. A., and Almazroui, M. (1998). Climatological study of the southwestern region of Saudi Arabia. I. Rainfall analysis. Climate Res. 9, 213–223.
Ahmed, B. Y. M. (1997). Climatic classification of Saudi Arabia: an application of factor-cluster analysis. GeoJournal 41, 69–84.
Almazroui, M. (2006). The Relationships Between Atmospheric Circulation Patterns and Surface Climatic Elements in Saudi Arabia. Unpublished Ph.D. thesis, Climate Research Unit, University of East Angelia, 433.
Almazroui, M., Islam, M. N., Athar, H., Jones, P. D., and Rahman, M. A. (2012). Recent climate change in the Arabian peninsula: annual rainfall and temperature analysis of Saudi Arabia for 1978–2009. Int. J. Climatol. 32, 953–966. doi: 10.1002/joc.3446
Alpert, P., Osetinsky, I., Ziv, B., and Shafir, H. (2004). Semi-objective classification for daily synoptic systems: application to the eastern mediterranean climate change. Int. J. Climatol. 24, 1001–1011. doi: 10.1002/joc.1036
Black, E. (2012). The influence of the North Atlantic Oscillation and European circulation regimes on the daily to interannual variability of winter precipitation in Israel. Int. J. Climatol. 32, 1654–1664. doi: 10.1002/joc.2383
Buchanan, C. M., Beverland, I. J., and Heal, M. R. (2002). The influence of weather-type and long range transport on airborne particle concentrations in Edinburgh, UK. Atmos. Environ. 36, 5343–5354. doi: 10.1016/S1352-2310(02)00579-4
Chen, T. C. (2005). Maintenance of the midtropospheric North African summer circulation: saharan high and African Easterly Jet. J. Climate 18, 2943–2962. doi: 10.1175/JCLI3446.1
Choi, G., Collins, D., Ren, G., Trewin, B., Baldi, M., Fukuda, Y., et al. (2009). Changes in means and extreme events of temperature and precipitation in the Asia-Pacific Network region (1955)–(2007). Int. J. Climatol. 29, 1906–1925. doi: 10.1002/joc.1979
Clark, R. T., and Brown, S. J. (2013). Influences of circulation and climate change on European summer heat extremes. J. Climate 62, 9621–9632. doi: 10.1175/JCLI-D-12-00740.1
Conway, D., and Jones, P. D. (1998). The use of weather types and air flow indices for GCM downscaling. J. Hydrol. 213, 348–361.
Cortesi, N., Trigo, R. M., González-Hidalgo, J. C., and Ramos, A. M. (2013). Modelling monthly precipitation with circulation weather types for a dense network of stations over Iberia. Hydrol. Earth Syst. Sci. 17, 665–678. doi: 10.5194/hess-17-665-2013
Cullen, H. M., Kaplan, A., Arkin, P., and deMenocal, P. B. (2002). Impact of the North Atlantic oscillation on middle Eastern climate and streamflow. Clim. Change 55, 15–338. doi: 10.1023/A:1020518305517
Demuzere, M., Werner, M., van Lipzig, N. P. M., and Roeckner, E. (2008). An analysis of present and future ECHAM5 pressure fields using a classification of circulation patterns. Int. J. Climatol. 29, 1796–1810. doi: 10.1002/joc.1821
Ekström, M., Jönsson, P., and Bärring, L. (2002). Pressure patterns associated with wind erosion events in S. Sweden. Clim. Res. 23, 51–66. doi: 10.3354/cr023051
Esteban, P., Jones, P. D., Martin-Vide, J., and Mases, M. (2005). Atmospheric circulation patterns related to heavy snowfall days in Andorra, Pyrenees, Int. J. Climatol. 25, 319–329. doi: 10.1002/joc.1103
Frakes, B., and Yarnal, B. (1997). A procedure for blending manual and correlation-based synoptic classifications. Int. J. Climatol. 17, 1381–1396.
Goldreich, Y. (2003). The Climate of Israel. Observation, Research and Applications. New York, NY: Kluer Academic/Plenum Publishers.
Goodess, C. M. (2000). The Construction of Daily Rainfall Scenarios for Mediterranean Sites Using a Circulation-Type Approach to Downscaling. Ph.D. thesis, University of East Anglia, Norwich.
Goodess, C. M., and Jones, P. D. (2002). Links between circulation and changes in the characteristics of Iberian rainfall. Int. J. Climatol. 22, 1593–1615. doi: 10.1002/joc.810
Goodess, C. M., and Palutikof, J. P. (1998). Development of daily rainfall scenarios for southeast Spain using a circulation-type approach to downscaling. Int. J. Climatol. 18, 1051–1083. doi: 10.1002/joc.810
Hess, P., and Brezowsky, H. (1977). “Katalog der Grosswetterlagen Europas 1881–1976,” in Berichte des Deutschen Wetterdienst, No. 113 (Offenbach am Main: Selbstverlag des Deutschen Wetterdienstes).
Hongisto, M., and Joffre, S. (2005). The influence of meteorological conditions affecting transport and deposition of nitrogen compounds over the Baltic Sea area. Boreal Environ. Res. 10, 1–17.
Hoy, A., Schucknecht, A., Sepp, M., and Matschullat, J. (2014). Large-scale synoptic types and their impact on European precipitation. Theor. Appl. Climatol. 116, 19–35. doi: 10.1007/s00704-013-0897-x
Hurrell, J. W., and Deser, C. (2009). North Atlantic climate variability: the role of the North Atlantic Oscillation. J. Mar. Syst. 78, 28–41. doi: 10.1016/j.jmarsys.2008.11.026
Huth, R., Beck, C., Phillipp, A., Demuzere, M., Ustrnul, Z., Cahynová, M., et al. (2008). Classifications of atmospheric circulation patterns: recent advances and applications. Trends and directions in climate research. Ann. N.Y. Acad. Sci. 1146, 105–152. doi: 10.1196/annals.1446.019
Jacobeit, J., Rathmann, J., Philipp, A., and Jones, P. D. (2009). Central European precipitation and temperature extremes in relation to large-scale atmospheric circulation types. Meteorol. Z. 18, 397–410. doi: 10.1127/0941-2948/2009/0390
Jenkinson, A. F., and Collinson, P. (1977). “An initial climatology of gales over the North Sea,” in Synoptic Climatology Branch Memorandum No. 62 (Bracknell: Meteorological Office), 18.
Jones, P. D., Hulme, M., and Briffa, K. R. (1993). A comparison of Lamb circulation types with an objective classification scheme. Int. J. Climatol. 13, 655–663.
Kahya, E. (2011). “The impacts of NAO on hydrology of the East Mediterranean,” in Hydrological, Socioeconomic and Ecological Impacts of the North Atlantic Oscillation in the Mediterranean Region, Advances in Global Change Research, Vol. 46, eds S. M. Vicente-Serrano and R. M. Trigo (Zaragoza: Springer). doi: 10.1007/978-94-007-1372-7_5
Kalnay, E., Kanamitsu, M., Kistler, R., Collins, W., Deaven, D., Gandin, L., et al. (1996). The NCEP/NCAR 40-year reanalysis project. Bull. Am. Meteorol. Soc. 77, 437–471.
Köppen, W. (1936). “Das geographisca System der Klimate,” in Handbuch der Klimatologie, Vol. 1, eds W. Köppen and G. Geiger (Berlin: C. Gebr. Borntraeger), 1–44.
Laaidi, K. (2001). Predicting days of high allergenic risk during Betula pollination using weather types. Int. J. Biometeorol. 45, 124–132. doi: 10.1007/s004840100096
Lamb, H. H. (1972). “British Isles weather types and a register of daily sequence of circulation patterns 1861–1971,” in Geophysical Memoir 116 (London: HMSO), 85.
Lamb, P. J., and Peppler, R. A. (1987). North Atlantic oscillation: concept and an application. Bull. Amer. Meteorol. Soc. 68, 1218–1225.
Lanzante, J. R. (1996). Resistant, robust and non-parametric techniques for the analysis of climate data: theory and examples, including applications to historical radiosonde station data. Int. J. Climatol. 16, 1197–1226.
Linderson, M. (2001). Objective classification of atmospheric circulation over southern Scandinavia. Int. J. Climatol. 21, 155–169. doi: 10.1002/joc.604
Littmann, T. (2000). An empirical classification of weather types in the Mediterranean basin and their interrelation with rainfall. Theor. Appl. Climatol. 66, 161–171. doi: 10.1007/s007040070022
Liu, Y. Y., van Dijk, A. I. J. M., McCabe, M. F., Evans, J. P., and de Jeu, R. A. M. (2013). Global vegetation biomass change 1988–2008 and attribution to environmental and human drivers. Global Ecol. Biogeogr. 22, 692–705. doi: 10.1111/geb.12024
López-Moreno, J. I., and Vicente-Serrano, S. M. (2007). Atmospheric circulation influence on the interannual variability of snowpack in the Spanish Pyrenees during the second half of the twentieth century. Nord. Hydrol. 38, 33–44. doi: 10.2166/nh.2007.030
López-Moreno, J. I., Vicente-Serrano, S. M., Moran-Tejeda, E., Lorenzo-Lacruz, J., Kenawy, A., and Beniston, M. (2011). Effects of the North Atlantic Oscillation (NAO) on combined temperature and precipitation winter modes in the Mediterranean mountains: observed relationships and projections for the 21st century. Global Planet. Change 77, 62–76. doi: 10.1016/j.gloplacha.2011.03.003
Lorenzo, M. N., Ramos, A. M., Tabuada, J. J., and Gimeno, L. (2011). Changes in present and future circulation types frequency in northwest Iberian Peninsula. PLoS ONE 6:e16201. doi: 10.1371/journal.pone.0016201
Maheras, P., Flocas, H. A., Patrikas, I., and Anagnostopoulou, C. (2001). A 40 year objective analysis of surface cyclones in the Mediterranean region: spatial and temporal distribution. Int. J. Climatol. 21 359–367. doi: 10.1002/joc.599
Martin-Vide, J. (2001). Limitations of an objective weather-typing system for the Iberian peninsula. Weather 56, 248–250. doi: 10.1002/j.1477-8696.2001.tb06585.x
McKendry, I. G., Stahl, K., and Moore, R. D. (2006). Synoptic sea-level pressure patterns generated by a general circulation model: comparison with the types derived from NCEP/NCAR re-analysis and implications for downscaling. Int. J. Clim. 26, 1727–1736. doi: 10.1002/joc.1337
Muller, R. A. (1977). A synoptic climatology for environmental baseline analysis: New Orleans. J. App. Meteorol. 16, 20–33.
Papadopoulos, A., Paschalidou, A. K., Kassomenos, P. A., and McGregor, G. (2014). On the association between synoptic circulation and wildfires in the Eastern Mediterranean. Theor. Appl. Climatol. 115, 483–501. doi: 10.1007/s00704-013-0885-1
Papadopoulos, V. P., Abualnaja, Y., Josey, S. A., Bower, A., Raitsos, D. E., Kontoyiannis, H., et al. (2013). Atmospheric forcing of the winter air-sea heat fluxes over the Northern Red Sea. J. Clim. 26, 1685–1701. doi: 10.1175/JCLI-D-12-00267.1
Park, Y. J., and Ahn, J. B. (2014). Characteristics of atmospheric circulation over East Asia associated with summer blocking. J. Geophys. Res. Atmos. 119, 726–738. doi: 10.1002/2013JD020688
Post, P., Truija, V., and Tuulik, J. (2002). Circulation weather types and their influence on temperature and precipitation in Estonia. Boreal Environ. Res. 7, 281–289.
Pozo-Vázquez, D., Esteban-Parra, M. J., Rodríguez, F. S., and Castro-Diez, Y. (2001). A study of NAO variability and its possible non-linear influences on European surface temperature. Climate Dyn. 17, 701–715. doi: 10.1007/s003820000137
Prudhomme, C., and Genevier, M. (2011). Can atmospheric circulation be linked to flooding in Europe? Hydrol. Process. 25, 1180–1190. doi: 10.1002/hyp.7879
Ramos, A. M., Ramos, R., Sousa, P., Trigo, R. M., Janeira, M., and Prior, V. (2011). Cloud to ground lightning activity over Portugal and its association with circulation weather types. Atmos. Res. 101, 84–101. doi: 10.1016/j.atmosres.2011.01.014
Rehman, S. (2010). Temperature and rainfall variation over Dhahran, Saudi Arabia, 1970–2006. Int. J. Climatol. 30, 445–449. doi: 10.1002/joc.1907
Rusticucci, M., Bettolli, M. L., and Harris de los Angeles, M. (2002). Association between weather conditions and the number of patients at the emergency room in an Argentine hospital. Int. J. Biometeorol. 46, 42–51. doi: 10.1007/s00484-001-0113-z
Tang, L., Karlsson, P. E., Gu, Y., Chen, D., and Grennfelt, P. (2009). Synoptic weather types and long-range transport patterns for ozone precursors during high-ozone events in Southern Sweden. Ambio 38, 459–464. doi: 10.1579/0044-7447-38.8.459
Trigo, R. M., and DaCamara, C. C. (2000). Circulation weather types and their influence on the precipitation regime in Portugal. Int. J. Climatol. 20, 1559–1581. doi: 10.1002/1097-0088(20001115)20:13<1559::AID-JOC555>3.0.CO;2-5
Tsvieli, Y., and Zangvil, A. (2005). Synoptic climatological analysis of “wet” and “dry” Red Sea Troughs over Israel. Int. J. Climatol. 25, 1997–2015. doi: 10.1002/joc.1232
Türkeş, M., and Erlat, E. (2005). Climatological responses of winter precipitation in Turkey to variability of the North Atlantic Oscillation during the period 1930-2001. Theor. Appl. Climatol. 81, 45–69. doi: 10.1007/s00704-004-0084-1
Uppala, S. M., Allberg, K., Simmons, P. W., Andrae, A. J., Da Costa, U., Bechtold, V., et al. (2005). The ERA40 re-analysis. Q. J. R. Meteorol. Soc. 131, 2961–3012. doi: 10.1256/qj.04.176
Vicente-Serrano, S. M., and López-Moreno, J. I. (2006). The influence of atmospheric circulation at different spatial scales on winter drought variability through a semiarid climatic gradient in north east Spain. Int. J. Climatol. 26, 1427-1456. doi: 10.1002/joc.1387
Vicente-Serrano, S. M., Trigo, R. T., López-Moreno, J. I., Liberato, M. L. R., Lorenzo-Lacruz, J., Beguería, S., et al. (2011). The 2010 extreme winter north hemisphere atmospheric variability in Iberian precipitation: anomalies, driving mechanisms and future projections. Clim. Res. 46, 51–65. doi: 10.3354/cr00977
Xoplaki, E., Gonzalez-Rouco, F. J., Gyalistras, D., Luterbacher, J., Rickli, R., and Wanner, H. (2003). Interannual summer air temperature variability over Greece and its connection to the large-scale atmospheric circulation and Mediterranean SSTs 1950–1999. Clim. Dyn. 20, 537–554. doi: 10.1007/s00382-002-0291-3
Zarrin, A., Ghaemi, H., Azadi, M., and Farajzadeh, M. (2010). The spatial pattern of summertime subtropical anti-cyclones over Asia and Africa: a climatological review. Int. J. Climatol. 30, 159–173. doi: 10.1002/joc.1879
Zhang, X., Aguilar, E., Sensoy, S., Melkonyan, H., Tagiyeva, U., Ahmed, N., et al. (2005). Trends in middle East climate extreme indices from 1950 to 2003. J. Geophys. Res. Atmos. 110, D22104. doi: 101029/2005JD006181
Ziv, B. (1994). “The weather in Israel,” in Introduction to Meteorology, Unit 5, eds B. Ziv, Y. Yair (Tel Aviv: The Open University Press), 8–59.
Keywords: weather types, directional flows, daily rainfall, circulation patterns, extremes, Saudi Arabia
Citation: El Kenawy AM, McCabe MF, Stenchikov GL and Raj J (2014) Multi-decadal classification of synoptic weather types, observed trends and links to rainfall characteristics over Saudi Arabia. Front. Environ. Sci. 2:37. doi: 10.3389/fenvs.2014.00037
Received: 30 July 2014; Accepted: 27 August 2014;
Published online: 15 September 2014.
Edited by:
Alexandre M. Ramos, University of Lisbon, PortugalReviewed by:
Sergio M. Vicente-Serrano, Spanish National Research Council, SpainEduardo Zorita, Hemlholtz-Zentrum Geesthacht, Germany
Copyright © 2014 El Kenawy, McCabe, Stenchikov and Raj. This is an open-access article distributed under the terms of the Creative Commons Attribution License (CC BY). The use, distribution or reproduction in other forums is permitted, provided the original author(s) or licensor are credited and that the original publication in this journal is cited, in accordance with accepted academic practice. No use, distribution or reproduction is permitted which does not comply with these terms.
*Correspondence: Ahmed M. El Kenawy, Earth System Observations and Modeling Group, Water Desalination and Reuse Center, King Abdullah University of Science and Technology, Thuwal, Saudi Arabia e-mail: kenawy@mans.edu.eg