The influence of circulation weather patterns at different spatial scales on drought variability in the Iberian Peninsula
 Ana C. Russo
 Célia M. Gouveia
 Ricardo M. Trigo
 Margarida L. R. Liberato
 Carlos C. DaCamara
- 1Instituto Dom Luiz, Faculdade de Ciências, Universidade de Lisboa, Lisboa, Portugal
- 2Escola de Ciências e Tecnologia, Departamento de Engenharias, Universidade de Trás-os-Montes e Alto Douro, Vila Real, Portugal
Europe has suffered several extreme weather events which were responsible for considerable ecological and economic losses in the last few decades. In Southern Europe, droughts are one of the most frequent extreme weather events, causing severe damages and various fatalities. The main goal of this study is to determine the role of Circulation Weather Types (CWT) on spatial and temporal variability of droughts by means of the multi-scalar Standardized Precipitation Evapotranspiration Index (SPEI). This study aims also to identify the main CWTs associated with winter and summer droughts over different regions of Iberian Peninsula. During the period between 1950 and 2012, the most frequent CWTs were found to be the Anticyclonic (A), Cyclonic (C), North (N) and Northeast (NE) types. The trend analysis for winter season shows a clear increase of frequency CWTs associated to dry events (A, East and Southeast) and a decrease of frequency of C and northern types while in summer a clear decrease of NE is observed. The spatial patterns of correlation between SPEI and CWT show large patterns of negative correlations with winter frequencies of A and eastern weather types, while the reverse occurs with C and western types. This feature is highlighted on a regional approach. The NE type presents negative correlations in Central, Northwestern and Southwestern regions during winter and positive correlations in Eastern region during summer. In opposition, the West type presents positive correlations in all regions (except Eastern region) during winter and does not present significant correlations during summer. In general, the predominant CWT associated to winter or summer drought conditions differs greatly between regions. The winter droughts are associated mainly with high frequency of E types and low frequency of W types for all areas, while the summer drought in eastern sectors are linked with low frequency of C type, as well as the western regions are related with the N type.
Introduction
In the last decade, Europe has experienced multiple extreme weather (EW) events (Hov et al., 2013), such as the devastating floods in Central Europe in 2002 (Sánchez et al., 2004) and 2013 (Grams et al., 2014) and the severe droughts that hit the Iberian Peninsula (IP) in 2004/2005 (Garcia-Herrera et al., 2007) and 2011/2012 (Trigo et al., 2013) and western Russia and Ukraine in 2010 (Sánchez et al., 2004; Hov et al., 2013). Unprecedented mega heat waves have also struck Western Europe in 2003 (Garcia-Herrera et al., 2007) and Russia/Eastern Europe in 2010 (Barriopedro et al., 2011).
Despite their profound impact in the biosphere, and in built-up areas and transport networks, floods and heatwaves are usually phenomena of relative short duration, lasting in the order of a few days to a few weeks. On the contrary, droughts are characterized by much longer time scales, typically spanning from few months to several years, as the mega droughts of Australia (Delworth and Zeng, 2014) and southwestern USA (Woodhouse et al., 2010). In Southern Europe, in particular in the IP, droughts are one of the most frequent EW events (Hov et al., 2013), having negative impacts on agriculture (Vicente-Serrano and López-Moreno, 2006), hydroelectric power production (Garcia-Herrera et al., 2007; Trigo et al., 2013), water resources (Vicente-Serrano and López-Moreno, 2006), vegetation activity (Gouveia et al., 2009), net primary production (Bastos et al., 2014), forest growing (Martínez-Villalta et al., 2008) and risk of forest fires (Pausas, 2004).
According to the SREX report on extremes (IPCC, 2012), there are still large uncertainties regarding observed global-scale trends in droughts with no statistically significant changes in observed drought conditions in Europe, except for the Mediterranean region. Despite some contradictory results obtained with different GCMs (Scaife et al., 2012), there are several studies confirming that drought frequency is increasing in the Mediterranean basin (Seneviratne et al., 2006; Sousa et al., 2011; Hoerling et al., 2012), in particular over the IP (Xoplaki et al., 2012; Trigo et al., 2013). The occurrence of intense droughts in the IP is strongly associated to its precipitation regime, which is characterized by an intense interannual and decadal variability (Garcia-Herrera et al., 2007; Trigo et al., 2013). Taking into account that the largest concentration of rainfall in the IP occurs between October and March (Trigo and DaCamara, 2000; Garcia-Herrera et al., 2007), all major droughts in the IP are therefore characterized by a rainfall shortage during several winter months (Garcia-Herrera et al., 2007; Trigo et al., 2013). Even though precipitation is the main conditioning factor for the occurrence of drought events, temperature has also been identified in several studies as an important factor explaining recent trends in water resources (e.g., Vicente-Serrano et al., 2011, 2014; Schubert et al., 2014). Thus, warming processes may have a negative effect on the availability of surface water resources, mostly driven by higher evapotranspiration rates (Vicente-Serrano et al., 2011).
Drought events and their associated impacts have been systematically studied during the last years, namely in the context of future climate change scenarios. Some types of EW are expected to become more frequent and severe, enhancing the exposure and vulnerability of ecosystems and humans (IPCC, 2014). Moreover, the IP as part of the Mediterranean basin, corresponds to one of the most sensitive areas to current and future climate change, stressing its role as a climate change “hot spot” (Giorgi, 2006; Giorgi and Lionello, 2008), with some of the changes reflecting already an anthropogenic signal (Hoerling et al., 2012; Trigo et al., 2013). Furthermore, most climate change scenarios present a relative consensual evolution of the climate for the Mediterranean, pointing toward a concurrent decrease in precipitation and increase in temperature in Southern Europe (Giorgi, 2006; Giorgi and Lionello, 2008) including more summer heatwaves (Fischer and Schär, 2010). This combined effect of less rainfall and higher temperatures is bound to increase the frequency, magnitude and severity of drought episodes (Vicente-Serrano et al., 2011, 2014). Therefore, it is crucial to understand the spatial and temporal variability of droughts, especially within the framework of future warming scenarios (IPCC, 2014) and risk assessment (IPCC, 2012).
Given the difficulties to objectively identify the onset and end of a drought, and to quantify drought severity, a considerable amount of studies were undertaken in recent years with the aim of developing new drought indicators (e.g., Wells et al., 2004; Vicente-Serrano et al., 2010a,b). Drought analysis and monitoring have been conducted traditionally using either the Palmer Drought Severity Index (PDSI), based on a soil water balance equation (Palmer, 1965), or the Standardized Precipitation Index (SPI), based on a probabilistic approach to precipitation (McKee et al., 1993). However, the original PDSI has notorious problems when used outside USA plains (Wells et al., 2004). This caveat triggered the development of new formulations to adapt the PDSI, namely the so called self-calibrated PDSI (scPDSI) that was used successfully to assess droughts over the Mediterranean region (Wells et al., 2004; Sousa et al., 2011). Vicente-Serrano et al. (2010a) proposed a climatic drought index, the Standardized Precipitation Evapotranspiration Index (SPEI), based on the simultaneous use of precipitation and temperature fields. This new index also holds the advantage of combining a multi-scalar character with the capacity to include the effects of temperature variability on drought assessment (Vicente-Serrano et al., 2010a). The application of multi-scalar indices to the high-resolution datasets allows identifying whether the IP is in hydric stress and also whether drought and desertification is installed. Traditionally, local risk management strategies focus only on short-term climatic events without considering long-term climate changes (IPCC, 2012). The use of indices which account for different variables and time-scales in their formulation (e.g., SPEI) will fill this gap, especially for applications involving future climate scenarios (Vicente-Serrano et al., 2010a,b, 2011).
Droughts in Europe are closely connected to anomalies of the atmospheric circulation and to circulation features (e.g., Garcia-Herrera et al., 2007; Pfahl, 2014), thus the influence of synoptic atmospheric circulation on the frequency, intensity, severity and the onset and end of drought should be look upon carefully, especially within the framework of future warming scenarios and risk assessment.
The last two decades have witnessed a growing development and application of automated classifications of regional atmospheric circulation patterns, often entitled Circulation Weather Type (CWT) classification. CWTs are a fairly simple method to describe atmospheric circulation variability (Huth et al., 2008; Beck and Philipp, 2010), providing a discrete characterization of the atmospheric conditions for a specific given region. These weather patterns or CWTs result from the automated examination of synoptic weather data [e.g., sea level pressure (SLP) or geopotential height at 500 hPa (HGT500)], usually on regular gridded fields (Huth et al., 2008; Beck and Philipp, 2010). Most classification procedures are based on the application of statistical selection rules or on the determination of physical parameters related with the prevailing atmospheric circulation pattern (Yarnal, 1993; Beck and Philipp, 2010). CWTs have been widely used and the focus tends to be threesome: (i) climatic variability, including trends and extreme years, (ii) environmental and (iii) weather driven natural hazards. Typically, applications to the Iberian Peninsula concentrate on climatic trends (Paredes et al., 2006; Lorenzo et al., 2008), on drought events (Trigo and DaCamara, 2000; Vicente-Serrano and López-Moreno, 2006; Garcia-Herrera et al., 2007), on very wet years (Vicente-Serrano et al., 2011) or to assess the changes in present and future CWTs frequency (Lorenzo et al., 2011). In particular, several authors have applied different methodologies to study the influence of weather-type frequency on precipitation in Iberia using different datasets and periods of study (e.g., Trigo and DaCamara, 2000; Santos et al., 2005; Lorenzo et al., 2008; Cortesi et al., 2013). However, to the best of our knowledge, there is no application for the entire Iberian Peninsula including an analysis of the relationship between the CWT frequencies and the intensity, as well as, the spatial differences of droughts with detailed spatial scales for winter and summer.
The present study's main objectives are to determine the role of CWTs on spatial and temporal variability of droughts allowing to better identify the atmospheric processes associated to severe drought in the Iberian Peninsula. This aim is met through the following specific objectives: (1) to identify the influence of CWTs occurrences on spatial and temporal variability of droughts using the multi-scalar drought index (SPEI) for the study of historical droughts and (2) to identify the main CWTs associated with winter and summer droughts and (3) to identify the main CWTs associated with drought over different regions of Iberian Peninsula.
Data and Methods
Circulation Weather Type Classification
Classification procedures based on the determination of CWTs and their applications to environmental analysis have been used frequently in recent decades (e.g., Trigo and DaCamara, 2000; Demuzere et al., 2009; Ramos et al., 2011; Russo et al., 2014). The CWTs are able to capture the multivariate information given by an input dataset, e.g., time series of daily pressure fields, into a univariate time series of type membership, i.e., to a classification catalog (Philipp et al., 2010). Most classification procedures are based on the application of statistical selection rules (e.g., cluster analysis and regression trees) but can also be based on the determination of physical parameters related with the prevailing atmospheric circulation pattern. Traditionally, classification procedures have been divided into manual and automated classifications (e.g., Yarnal, 1993). Alternatively, subjective vs. objective procedures or even hybrid methods have been established (Philipp et al., 2010). For additional information on different CWTs classification procedures and applications throughout Europe please see also Huth et al. (2008); Beck and Philipp (2010) and Philipp et al. (2010).
In the present work, we applied an automated version of the Lamb circulation type's methodology. This classification of atmospheric circulation into CWTs was first developed for the British Isles by Lamb (1972) and, later on, it was improved for an objective automated classification by Jenkinson and Collison (1977). This automated methodology was later applied for different areas in the Iberian Peninsula (e.g., Trigo and DaCamara, 2000; Paredes et al., 2006; Garcia-Herrera et al., 2007; Domínguez-Castro et al., 2014; Russo et al., 2014). In this work, prevailing CWTs at regional scale where determined using the simple Geostrophic approximation according to the methodology proposed by Trigo and DaCamara (2000). Following the referred approach, 26 CWTs are initially identified (10 pure, 8 anticyclonic hybrids and 8 cyclonic hybrids). However, in order to obtain a more structured and statistically representative analyses, the 26 CWTs are reassembled in just 10 classes, not including any undefined class. This was achieved by simply assuming that each of the 16 hybrid types contributes with a weight of 0.5 into the corresponding pure directional and cyclonic/anticyclonic type monthly frequencies (e.g., one case hybrid like the CE is included as 0.5 in C and 0.5 in E types). This assemblage results on that only 10 distinct CWTs are considered from now on, eight of which are driven by the direction of the flow (NE, E, SE, S, SW, W, NW, and N) and two further classes dominated by the shear vorticity (cyclonic C or anticyclonic A). A short description for the observed SLP features of each type, as well as the description of this methodology including the simplification from 26 to 10 classes may be found in Trigo and DaCamara (2000).
The daily CWT for the 1950–2012 periods were computed based on Trigo and DaCamara (2000) approach by means of the daily sea level pressure (SLP) on a 2.5° latitude-longitude grid retrieved from the NCEP/NCAR reanalysis data (Kistler et al., 2001). Afterwards, the corresponding monthly frequencies were computed based on the daily classification. The year was divided in two extended winter (October–March) and summer (April–September) seasons that will be considered for the analysis.
Drought Assessment
As mentioned before the application of multi-scalar indices will allow to identify if the IP is in hydric stress and also if drought is installed. In order to quantify the evolution of drought for the IP the recently developed SPEI (Vicente-Serrano et al., 2010b) was applied. Choice of SPEI among other drought indices was because SPEI is not only more accurate than the standard precipitation-based indices (such as SPI and PDSI), but also more sensitive to global warming (Vicente-Serrano et al., 2010a); it has also shown to be better associated with hydrological drought in Iberia than SPI or PDSI (Vicente-Serrano et al., 2014). Additionally, SPEI is a standardized measure that is comparable among seasons, enabling the estimation of the duration, magnitude and intensity of drought. The water balance is included in the computation of SPEI by means of the calculation of the difference between monthly precipitation (Figure 1B) and the potential evapotranspiration (Figure 1C).
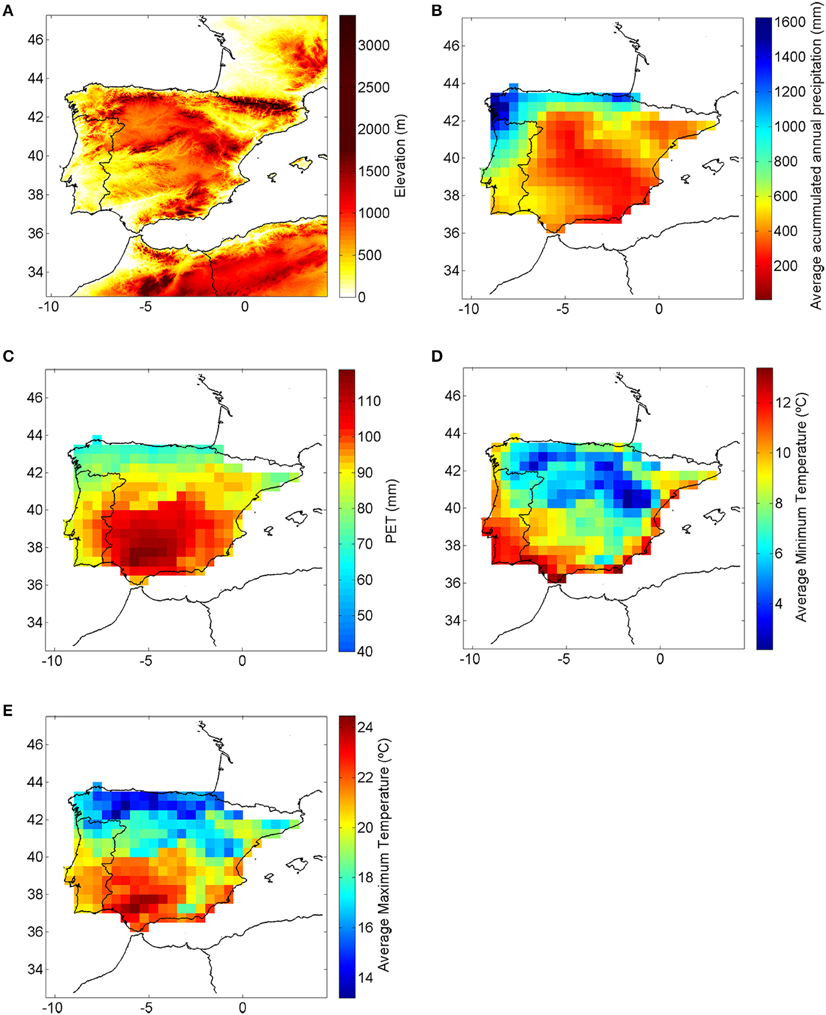
Figure 1. Elevation (A), annual mean accumulated precipitation (B), annual mean PET (C) minimum (D) and maximum temperature (E) in the study area.
The SPEI was computed using the Climatic Research Unit (CRU) TS3.21 High Resolution Gridded Data of Month-by-month Variation in Climate dataset (available online at http://badc.nerc.ac.uk/data/cru/), with a spatial resolution of 0.5 degrees and for the period 1950–2012. The study region of IP corresponds to a square of 30 × 30 grid boxes (Figure 1B). We computed the Potential Evapotranspiration (PET), using the Hargreaves equation (Hargreaves and Samani, 1985) and the log-logistic probability distribution. This formulation allows a very good fit to the series of differences between precipitation and PET (Vicente-Serrano et al., 2010b), and using monthly averages of daily maximum and minimum temperature data (Figures 1D,E) and also monthly precipitation records. The parameters were estimated by means of the L-moment method.
One of the main advantages of SPEI is that it can be determined for different time scales, which is very useful for monitoring drought impacts on natural and socioeconomic systems (Vicente-Serrano et al., 2010b). Detailed explanation on the meaning of the different drought time scales can be found in Vicente-Serrano et al. (2010a) and Vicente-Serrano et al. (2010b). In the present study, the 6-month time scale was used.
Drought Spatial and Temporal Patterns
The precipitation regime in the IP is characterized by high temporal and spatial variability (Lionello, 2012), with the former being related to the intense seasonal cycle and inter-annual variability and the latter driven by the marked topography (Figure 1A). Previous studies (e.g., Vicente-Serrano and López-Moreno, 2006) on drought characteristics suggest that it is possible to effectively quantify the hydrological variability over a certain region in terms of the combined monthly temperature and precipitation variability. In order to determine SPEI's general patterns of temporal evolution, a PCA was applied to the SPEI determined over IP for the 1950–2012 period.
To encapsulate the main spatio-temporal patterns of droughts in the study area, we used a PCA in S-mode (Serrano et al., 1999). The S-mode allows the determination of regions in which the structure of evolution of droughts is very similar and we have used the gridded values of SPEI as variables and years as cases. The retained principal components were rotated to redistribute the explained variance, using the Varimax method (Wilks, 2006). For each season we selected 4 PCs that explains about 80% of the variance (Table 3). A cluster analysis was then applied to the eight selected EOFs, representing the variability of the entire year. The clustering method used is the standard k-means clustering algorithm leading to the identification of six spatial clusters, that can be associated with the main homogeneous regions over Iberia, as obtained by Vicente-Serrano using SPI 6 months (Vicente-Serrano, 2006).
Results and Discussion
CWT Characterization
As described in Section Drought assessment, the prevailing circulation patterns were identified based on the large-scale standard pressure fields and the relative frequency of each CWT averaged for each month was then estimated for the period 1950–2012 (Figure 2). The anticyclonic (A) type is the most frequent circulation pattern throughout the year, except for the summer months of July and August, which are also highly influenced by the northeast (NE), north (N) and east (E) circulation types. The predominance of the A type is associated with the migration of the Azores anticyclone toward the Iberian Peninsula (Tomás et al., 2004). During summer, Portugal is usually under the influence of the Azores anticyclone and while a frequent shallow thermal depression can develop over the central Iberian Peninsula, the A class appears as one of the most frequent CWT affecting Portugal also during summer months (Ramos et al., 2011). The meridional circulation types north (N) and south (S) present very distinct behaviors; N is one of the predominant CWT, particularly during spring and summer months, while S is rather minor, especially from April to August. The directional CWTs with a southern component (i.e., S, SE, SW) are the least frequent CWTs throughout the majority of the year. Moreover, the NW and E circulation types present relatively stable frequencies during most of the year. Throughout the year, the relative frequency of C situations does not change significantly reaching one relative peak in the spring.
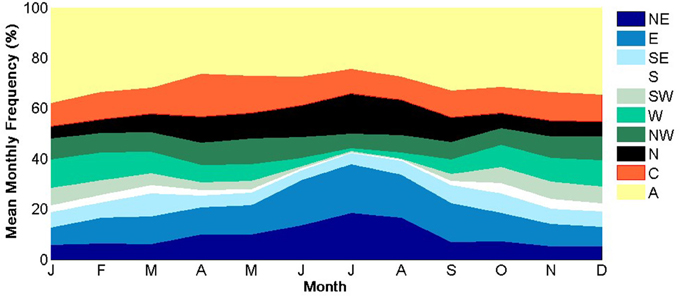
Figure 2. Mean monthly frequency (%) for the 10 CWT during the 1950–2012 period. The circulation patterns are labeled as follows: A, Anticyclonic; C, Cyclonic; N, North; S, South; W, West; E, East; NW, Northwest; NE, Northeast; SW, Southwest and SE, Southeast.
The CWTs present an important range of temporal variability behavior, with inter-annual and inter-decadal variance often superimposed on longer trends. The moving average procedure is a conventional approach for temporal change detection in climatology, allowing for filtering the year-to-year variations and revealing more persistent trends (De Luis et al., 2000). Thus, prior to trend analysis, a moving average of 9 years was determined, decreasing the degrees of freedom of the series through the reduction of the number of samples, reducing also the higher frequency variability which can hide existing trends. The datasets were smoothed using a 9-year moving average, as suggested by De Luis et al. (2000) and Vicente-Serrano and López-Moreno (2006). Trends were then evaluated by means of Spearman's rank correlation (Figure 3). Figure 3 shows the frequency of the A, C, SW, and NE weather types throughout the study period for winter and summer seasons. The red line indicates a moving average for a 9 year window.
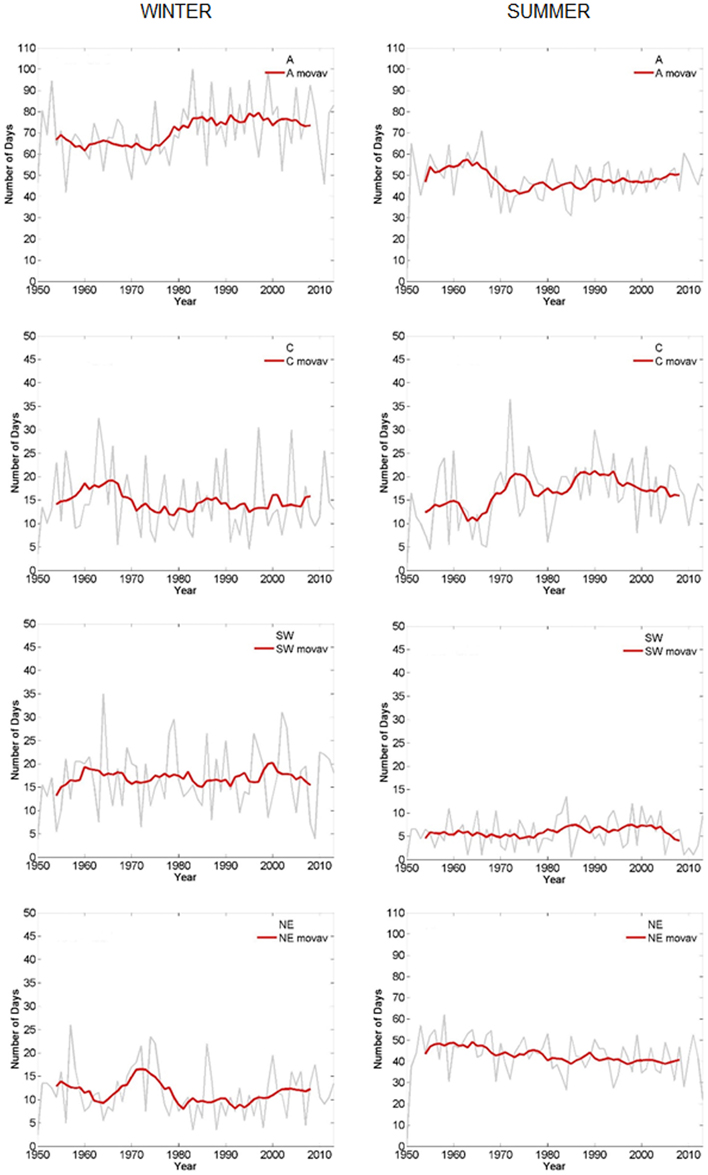
Figure 3. Evolution of the frequency of different CWTs for winter (left panel) and summer (right panel). Red line indicates a moving average of 9 years.
Previous works have shown that the most important CWTs associated to the Iberian precipitation regime are C, W, and SW that contribute to the highest fraction of winter, spring and autumn precipitation (Trigo and DaCamara, 2000; Garcia-Herrera et al., 2007). Figure 3 shows that some of winter CWTs contributing to the highest fraction of winter, spring, and autumn precipitation over Iberia are decreasing (e.g., types C and NE) and those associated with stability are increasing (e.g., types A and E), contributing positively to the intensification of more frequent drought events.
These results are supported by Table 1 where the statistically significant trends (α < 0.05) for the different CWTs in the Iberian Peninsula (1950–2012) are presented. The winter season presents a significant increasing trend in A and a significant decreasing trend in NW, contrasting with summer where significant increases can be observed for types C and NW and W (Table 1). The decrease in NW in winter is also observed in the adjacent classes N and W, although being not significant. A significant decrease in NE and significant increases in neighboring types E and SE are also observed in summer. Finally, the winter season shows a significant increase in E type (Table 1).
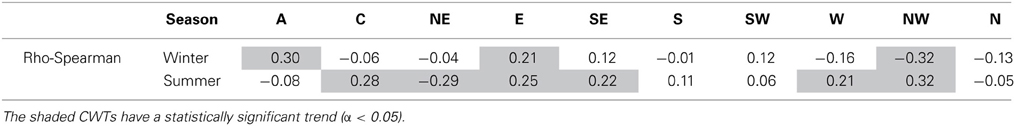
Table 1. Trends in the different CWTs in the Iberian Peninsula (1950–2012).
Figure 4 shows the seasonal anomaly composites of pressure (mb) at sea level (SLP) relative to four distinct CWTs, those classified as C, A, SW, and NE. These seasonal anomaly composites were obtained after removing the respective grand means computed for the period 1950–2012 over each season: winter (ONDJFM) and summer (AMJJAS).
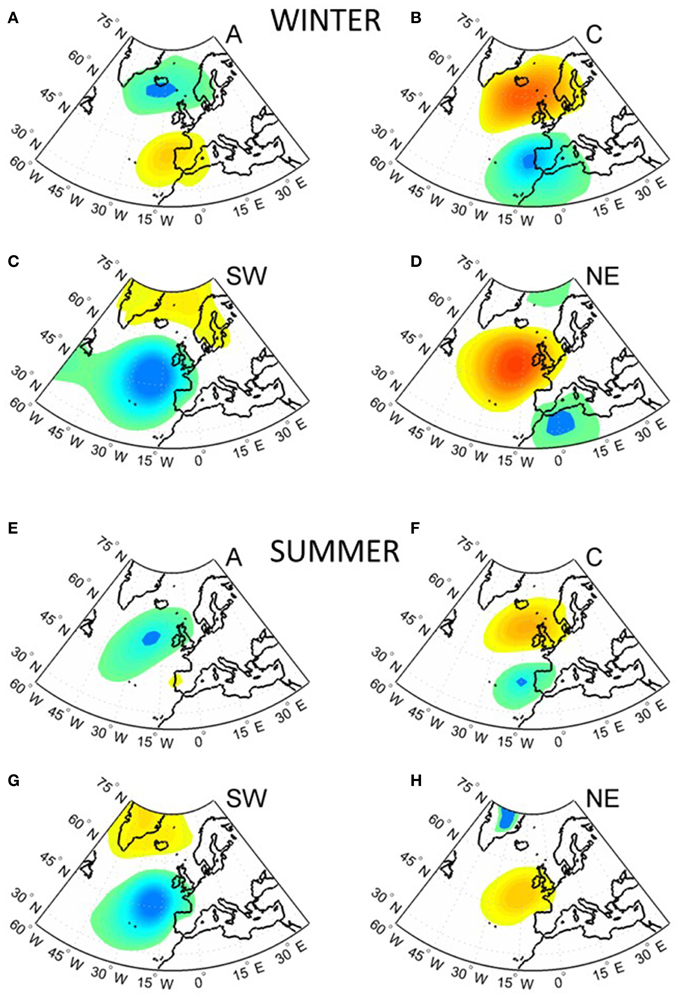
Figure 4. Anomaly composites of pressure (colorbar; mb) at sea level (SLP) in days classified as A, C, SW, and NE. The anomaly fields are shown for winter (A–D) and summer (E–H).
In winter the A weather type (Figure 4A) which shows a clear increase in the frequency from 1950 to 2012 (Table 1), indicates the influence of high pressures centered on the IP. On the other hand the C (Figure 4B) and NE (Figure 4D) weather types, characterized by a negative and statistically non-significant trend in the frequency, show respectively low pressures centered on the IP and a transition from strong high pressures over the Atlantic region extending to the northwestern Iberia and low pressures centered over northwestern Africa. The SW (Figure 4C) weather type, which presents very low and non-significant trends, indicates intense low pressures over the Atlantic and affecting the IP.
In summer the patterns are similar, though less intense than in winter. The C (Figure 4F) and SW (Figure 4G) weather types, which also correspond to low relative pressures over the IP, show an increase in the frequency during the analyzed period (Table 1), while the NE (Figure 4H) weather type, which shows a clear negative and statistically significant trend in the frequency, still shows a high pressure region over eastern Atlantic and northwestern Iberia. Finally, the A weather type (Figure 4E), which presents low and non-significant trends, indicates the influence of high relative pressures centered on the IP.
Spatial Regionalization of the Iberian Droughts
Having obtained all CWTs patterns and time series for the considered period, their possible associations with observed drought patterns were investigated. This circulation-to-environmental approach (Yarnal, 1993) should allow identifying clear links between circulation and drought patterns. In order to reduce the dimensionality of the problem we have applied a PCA to the SPEI dataset from 1950 to 2012 over Iberia. A selection criteria was used to determine how many principal components should be retained. According to this criteria, one should retain all the components that account for a minimum of 80% of the cumulative temporal variability. Thus, we have selected four principal components as they explain more than 80% of the temporal variability of the SPEI (Table 2). Accordingly, the four principal components account for 80.4% of the total explained variance (EV) in the case of winter season and 82.6% in summer. Figure 5 shows the spatial distribution of the first four PC loadings and it may be noted that the spatial patterns of the four major leading components is similar for winter and summer, although they appear in a different order. Component 1 (55.4% of the EV) for winter and component 2 (12.8% of the EV) for summer reflect the temporal evolution of the SPEI series in the southwestern quadrant, which is influenced by the Atlantic systems. Component 2 (12.1% of the EV) for winter and component 4 (3.4% of the EV) for summer reflect the temporal evolution of droughts in the southeastern quadrant, corresponding to the area between Spanish Central System mountain area and the Mediterranean coastland. Component 3 for both winter (10.1% of the EV) and summer (8.5% of the EV) represents the evolution in the northeastern quadrant, a transitional region between the Pyrenees mountain area and the Spanish Central System. Finally, component four for winter (3.8% of the EV) represents the temporal evolution in northern IP, whereas component 1 for summer (57.8% of the EV) reflects the evolution of SPEI in the northwestern quadrant, including the area from the Atlantic to the central Iberia and part of the Pyrenees mountains.
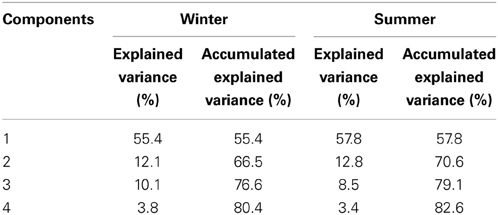
Table 2. Results of principal component analysis for SPEI over Iberia (1950–2012).
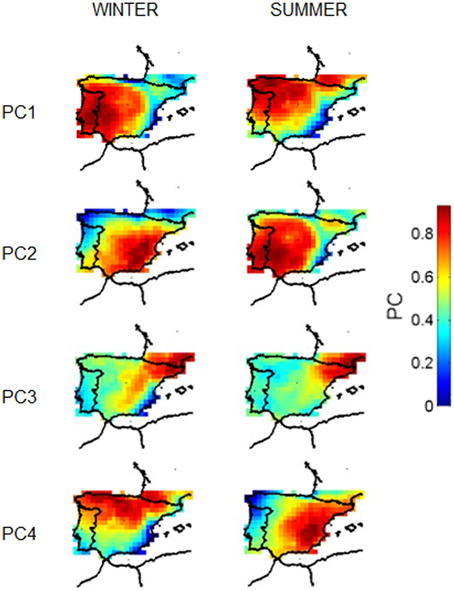
Figure 5. First four PCA loadings for winter (left panel) and summer (right panel).
Results obtained suggest that the first and second components, both for summer and winter, are representative of drought evolution for a large spatial fraction of the Iberian Peninsula.
Figure 6 shows the evolution of the four components obtained from the PCA for winter (left panel) and summer (right panel). The winter PC1 does not present a significant trend. However, the temporal evolution of winter PC1, representative of SW Iberia, allows identifying the main drought events in the region, namely the 1975/76, 1981, and 1999 episodes. The summer PC1, representative of the Northwestern IP, shows a sharp and statistically significant decrease in SPEI values (Rho = −0.67, α < 0.05) starting at the beginning of the 1980s, and also allows identifying the 2005 intense drought. Although representative of different areas, component 2 shows marked negative trends in both winter (Rho = −0.76) and summer (Rho = −0.82) particularly noticeable between the 1970s until the 1990s. Component 3, representative of the Pyrenees area both for summer and winter, shows slightly smaller negative trends for winter (Rho = −0.47) and summer (Rho = −0.53) which are nevertheless statistically significant (α < 0.05). Component 4 also shows negative trends for winter (Rho = −0.57) and summer (Rho = −0.71), both statistically significant (α < 0.05) caused by a sustained and progressive decrease in the SPEI values since the decade of 1970s until the 1990s.
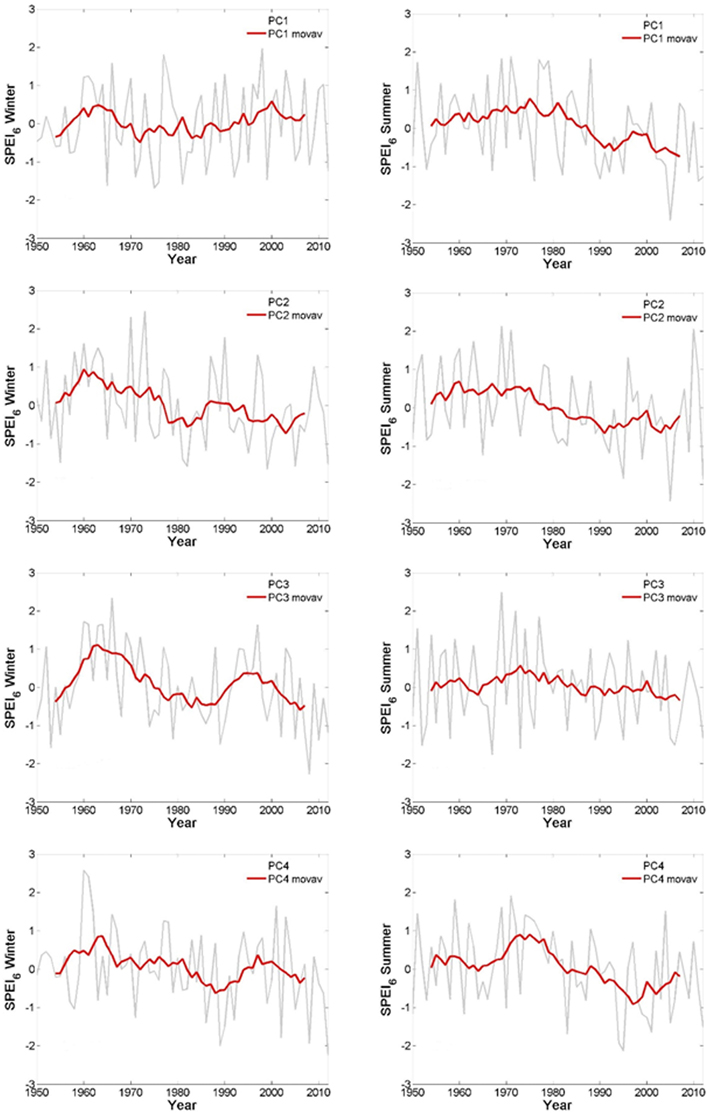
Figure 6. Evolution of the first four principal components (PC1-PC4) in the winter (left panel) and in the summer (right panel). Red line indicates a moving average of 9 years for each PC.
The negative SPEI trends account for an observed general increase in droughts which agrees with precipitation trends in other Mediterranean regions, namely in Spain (Vicente-Serrano and López-Moreno, 2006), Portugal (Trigo and DaCamara, 2000), and Italy (Brunetti et al., 2001; Ventura et al., 2002). Some studies in the Mediterranean region have shown a general negative trend in precipitation since the 1960s, which is related to the increase in the succession of dry years (Vicente-Serrano and López-Moreno, 2006; Sousa et al., 2011). Our results are in good agreement with the recent work of Vicente-Serrano et al. (2014); using data from ground meteorological stations in the IP to compute SPEI and SPI, the authors confirm that the drought severity has increased in the past five decades, as a consequence of greater atmospheric evaporative demand resulting from temperature rise. They also pointed that this drought severity increase is less intense in SW Iberia, namely in Lisbon, which is in good agreement with the strong negative trends obtained for all the principal components except for the winter PC1, that are representative of the SW sector.
Using cluster analysis, the 8 EOFs of SPEI were aggregated into six main homogeneous regions over the Iberian Peninsula (Figure 7): the northwestern region (RNW), the northeastern region (RNE), the central region (RC), the southwestern region (RSW), the southeastern region (RSE) and the eastern region (RE). This classification is especially useful since it summarizes the information on the regionalisation of drought behavior in the Iberian Peninsula and will be used to evaluate drought evolution on each of the determined areas. Results are in accordance with the ones obtained by other authors, using SPI 6 months (Vicente-Serrano, 2006).
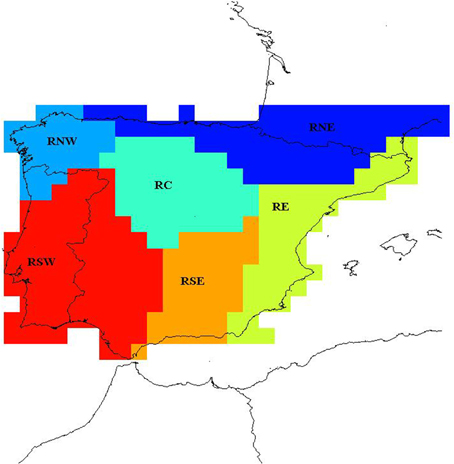
Figure 7. Six main homogeneous regions over Iberia.
Relationship between the Circulation Weather Types and Drought—the Circulation-to-Environmental Approach
In this section the influence of weather-type frequency on drought spatial and temporal patterns is assessed. First, the correlation matrices between each CWT and the PCs were estimated for the Iberian Peninsula (Tables 3, 4). It should be noted that the proposed methodology only accounts for linear relationships although some of the relations could be non-linear. Thus, we acknowledge that some of the results presented in these tables should be considered within this context. Regions affected by droughts are characterized by negative values of SPEI and associated with lower (higher) than usual frequency of “wet” CWTs, such as C (A). Therefore, as expected, all PCs present negative and positive correlations with the frequency of A and C weather types, respectively. The frequency of east weather types (E, SE, NE) during winter shows negative correlations with all PCs except for SE vs. PC2. A similar behavior is found for summer, except for NE which presents very small positive values of correlation with PCs 1 to 4. In opposition, the frequency of west CWTs (W, SW, NW) shows positive correlations with all PCs in winter and with PC1 in summer. Overall, the winter season presents a larger number of statistically significant correlations (at the 5% level) than summer. The obtained results are consistent with the spatial fields of correlation between CWTs frequency and SPEI time series for each grid point (Figure 8). Negative correlations may be identified in a large part of the study area of SPEI with the winter frequencies of A, N and eastern weather types (E, SE, NE). Positive correlations are found in the case of winter frequencies of C and western weather types (W, SW, NW). Again, the winter fields present stronger correlations than those of summer and a reverse of signs in the spatial patterns is also conspicuous in some of the CWTs (N, NE, SW, and W) between the two seasons. However, it should be noted the low monthly frequency of some CWTs in summer, namely S, SW, and W.
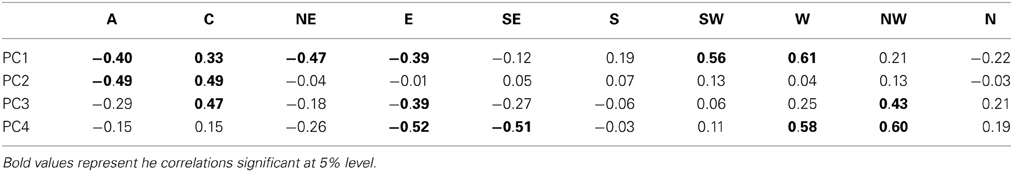
Table 3. Correlation between the winter weather-type frequency and the PC.
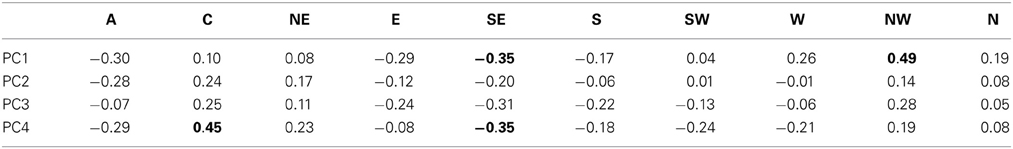
Table 4. As in Table 3, but for summer.
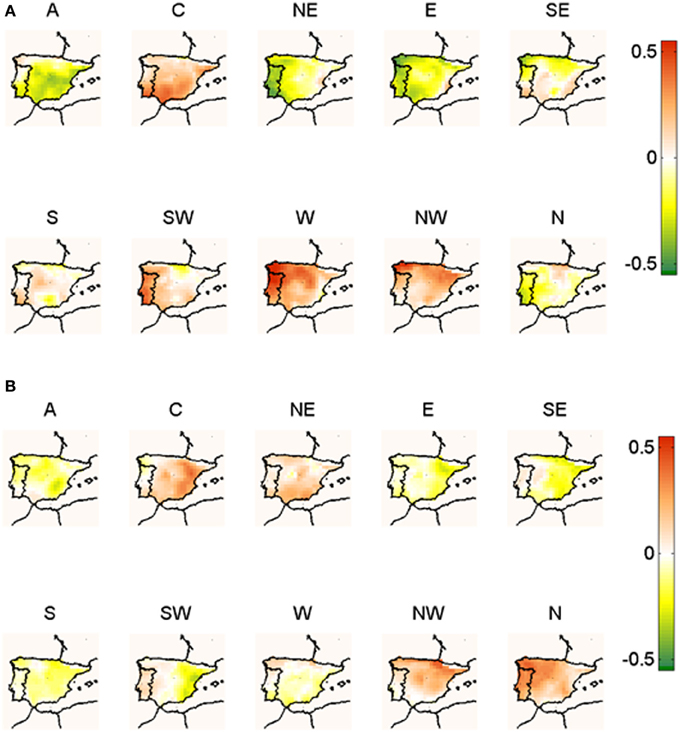
Figure 8. Correlation between the (A) winter and (B) summer SPEI and the frequencies of each CWT. Significant correlations correspond to R-values higher than 0, 24 or lower than −0,24 (α < 0,05).
The structure of some loadings presents similarities with the correlation pattern obtained between several CWTs and seasonal SPEI. In particular, the winter loadings for component 1 (Figure 5, top left panel) agrees with spatial impacts of the western types (W, NW, SW). The structure of the winter loadings for component 2 is similar to the correlation pattern between the frequency of the C weather type and the winter SPEI (Figure 8A). This behavior was also highlighted by Vicente-Serrano and López-Moreno (2006) for central Spain. Regarding the summer season, the structure of the summer component 1 (top Figure 5, right panel) agrees with spatial impacts of the N and NW types. The structure of the summer loadings for component 4 is consistent with the correlation pattern between the frequency of the C weather type and the summer SPEI.
The information above is complemented by the regionalised information on Tables 5, 6 where the median and interquartile values of significant correlation values (α < 0.05) between the CWT frequencies and the winter and summer SPEI for each region of the Iberian Peninsula (Figure 7) is presented. The interquartile measure is used to evaluate the range of correlation values within each region. Overall, these values present relatively low inter-regional variability with the exceptions of the cases of the NW type for the RNW area and for the W class for the RSW area during winter. On the other hand Tables 5, 6 present relatively small values of interquartile range, thus ensuring a high level of consistency impact of each CWT on the SPEI field within each region. The exceptions to these are the RNW and RSW sectors that present higher average values of interquartile range during winter than the rest of Iberia.
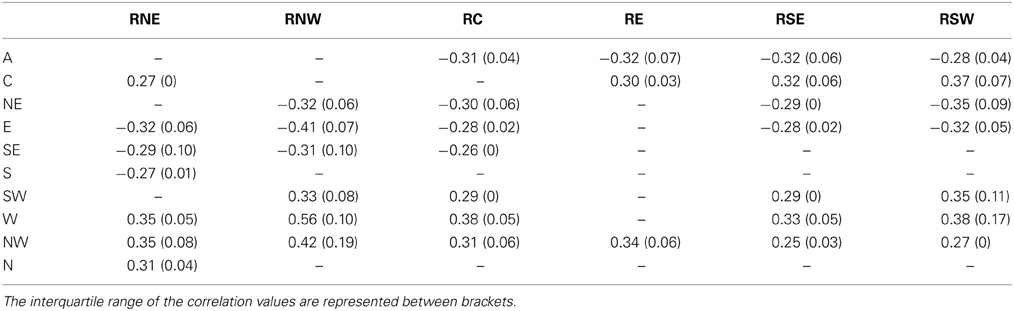
Table 5. Median values of correlation between the weather-type frequency and the winter SPEI in the Iberian Peninsula (1950–2012).
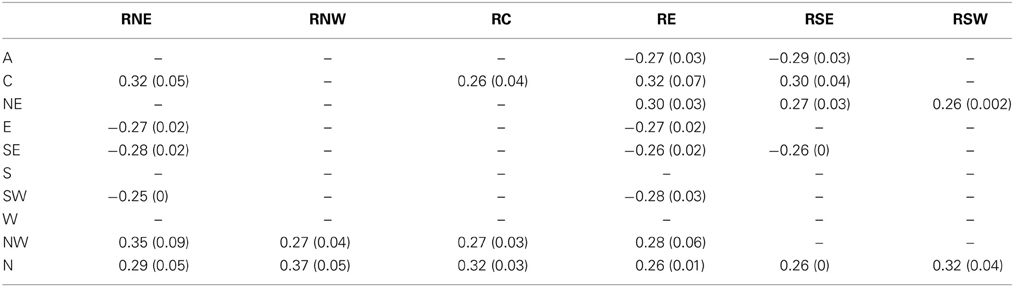
Table 6. As in Table 5, but for summer.
It should be noted that the above mentioned contrasting behavior of NE and W classes between winter and summer is also notorious at regional scale (Figure 8). The NE type, which presents statistically significant negative correlations with SPEI values, particularly for RNW, RC and RSW regions during winter (Table 5), has statistically significant positive correlations to SPEI values in RE and RSE regions during summer (Table 6). In opposition, the W type, which presents statistically significant positive correlations to SPEI values in all regions except for RE during winter (Table 5), has no statistically significant negative correlations to SPEI for any Iberian region during summer.
CWTs associated to drought conditions depend on both region and season (Tables 5, 6). In the case of RNE, droughts in winter are associated to CWTs more (less) frequent than average of the lower right (upper left) quadrant, i.e., E, SE, and S (W, NW, and N) whereas in summer droughts are accompanied by a predominance of NW and C types. Winter droughts in RNW are related to higher (lower) than normal frequency of eastern (western) types, i.e., NE, E, and SE (SW, W, NW), whereas in RC they appear to be related to more (less) frequent NE and A (W and NW) types. Summer droughts are linked to a higher frequency of the N type in both RNW and RC. Winter droughts in both RE and RSE are related to more (less) frequent A (NW and C) types, whereas those in RSW appear associated to higher (lower) than normal frequencies of E and NE (C, W, and SW) types. Finally, summer droughts are associated to lower than normal frequencies of C and NE types in the case of both RE and RSE, and of N type in the case of RSW.
In order to understand how distinct synoptic conditions may differently affect a specific given region, several meteorological fields are evaluated for several CWTs. Thus, Figure 9 shows anomaly composites of HGT at 500 hPa and temperature at 850 hPa as well as anomaly composites of SLP and relative humidity at 850 hPa, both in days classified as W, N, SW, and NE, for winter and summer seasons. For the sake of simplicity results are only shown for the most relevant CWTs. The contrasting behavior between winter and summer seasons over Iberia is particularly evident (Figure 9, left panels) where the winter negative temperature anomalies associated with the N and NE CWTs disappear (N) or even become positive (NE) in summer. Likewise, the winter anomalies in the patterns of W and SW (positive) change to negative in summer. Since, in the case of the W and SW types, there is no inversion on the pattern depicting the relative humidity anomaly fields, these results suggest the overall importance of the temperature. Winter drought events have been shown above to be associated to the occurrence of NE and N types and these are characterized by negative temperature anomalies and positive relative humidity anomalies (Figure 9, top panel). On the contrary, during summer these same CWTs are not associated to cold and wet anomalies, with anomalous fields either disappearing (N) or even reversing the signal (NE).
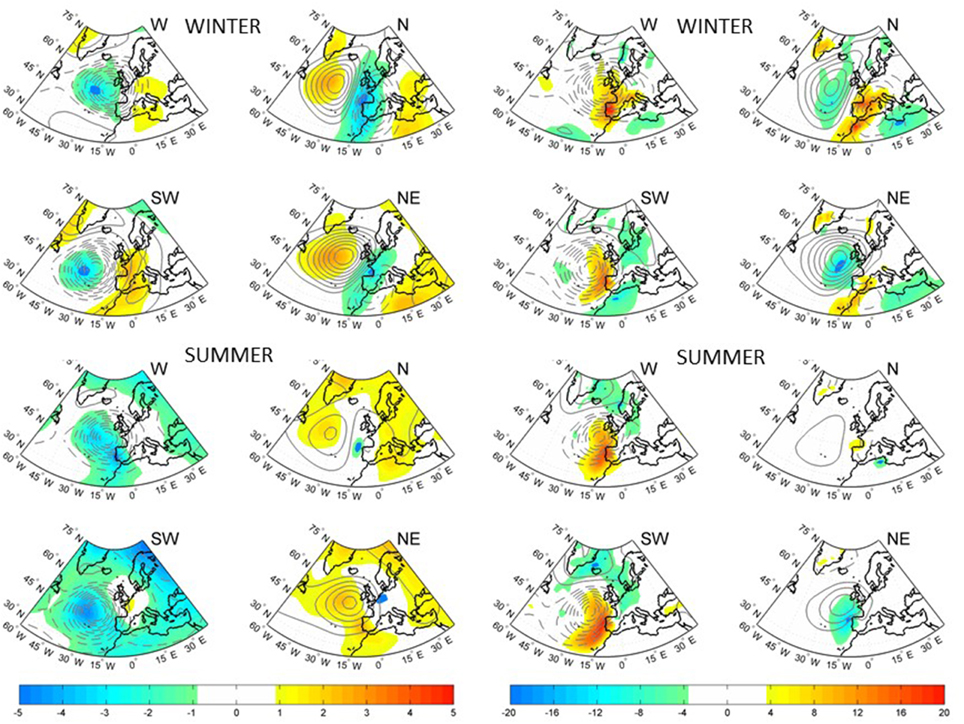
Figure 9. (left) Anomaly composites of HGT (contours; m) at 500 hPa and temperature at 850 hPa (colorbar; °C) in days classified as W, N, SW, and NE. Contour lines every 20 m; solid lines represent positive anomalies, dashed lines represent negative anomalies and the zero contour is omitted. The anomaly fields are shown for winter (top panel) and summer (bottom panel). (right) Anomaly composites of pressure (contours; mb) at sea level (SLP) and relative humidity at 850 hPa (colorbar; %) in days classified as W, N, SW, and NE. Contour lines every 2 mb; solid lines represent positive anomalies, dashed lines represent negative anomalies and the zero contour is omitted. The anomaly fields are shown for winter (top panel) and summer (bottom panel).
Conclusions and Final Remarks
Prevailing circulation patterns affecting the Iberian Peninsula were identified following the methodology proposed by Trigo and DaCamara (2000). The interannual variability of the 10 resulting CWTs was determined over the period 1950–2012 and the number of days for each CWT and season for the same period was accounted for. The impact of each CWT on drought regime was studied on a monthly basis between 1950 and 2012. During this period, the most frequent CWTs were found to be the anticyclonic (A), the cyclonic (C), the north (N) and the northeast (NE) types, accounting respectively for 30, 11, 9, and 12% of the days.
Drought is associated with synoptic circulation but also with many other factors that are not taken into account in this work. The influence of the atmospheric circulation on spatial and temporal patterns of winter and summer droughts in the Iberian Peninsula was analyzed by means of the SPEI, as obtained using the high resolution CRU TS3.21 gridded monthly data. The potential evapotranspiration was computed using the Hargreaves equation and the log-logistic probability distribution.
The trend analysis for winter season over the period between 1950 and 2012 shows a linear positive trend of CWTs associated with dry events, such as A, E, SE, and SW and a decrease of frequency of C and of the remaining weather types. On the other hand, only the A, E and NW weather types present statistically significant trends. During summer a clear decrease is observed for NE. The A and N weather types present low and non-significant trends and the remaining CWTs presents a clear increase.
The spatial variability of SPEI was analyzed using PCA and four PCs were selected for each season, explaining about 80% of the variance. The first PC, for both winter and summer, explains more than half of the variability. With exception of the winter PC1, all the remaining components present a negative trend, with higher Rho values (α < 0.05) for summer PC1, winter and summer PC2 and summer PC4. The temporal evolution of SPEI indicates a general negative trend, indicative of drier conditions between 1950 and 2012, which is in agreement with the evolution in the Iberian Peninsula and in other Mediterranean regions (Vicente-Serrano and López-Moreno, 2006).
On the other hand droughts show an important spatial and temporal variability within the study area, presenting six well-defined patterns corresponding to the northwestern (RNW), northeastern (RNE), central (RC), eastern (RE), southwestern (RSW) and southeastern (RSE) regions. The correlation between each CWT and the PCs were determined for the Iberian Peninsula showing an opposite behavior for A and C weather types for both seasons. The frequency of weather types with an eastern component during winter months shows negative correlations with all PCs, with exception of PC2. A similar behavior is found for summer months, except for NE. In opposition, the frequency of western CWTs shows positive correlations with PC1 and PC2 during summer and with all PCs during winter. As expected, the higher positive correlation values for PC1 are obtained with SW and W types for winter and for with SE and NW types in summer.
The spatial patterns of correlation between SPEI and CWT show negative correlations in a large part of the study area with the winter frequencies of A and eastern weather types (E, SE, NE), while the reverse occurs with the winter frequencies of C and western weather types (W, SW, NW). The spatial patterns of summer correlations present lower values for the majority of the CWTs, showing particular differences between SPEI and the NE and W influences during summer and winter. This feature is highlighted during the regional analysis of the relation between SPEI and CWTs. The NE type presents negative correlations with SPEI in RNW, RC and RSW regions during winter and positive correlations in RE, RSE, and RSW regions during summer. In contrast, the W type presents positive correlations with SPEI values in all regions (except RE) during winter and non-significant correlations during summer.
In general, the predominant CWT associated to winter or summer drought conditions differs greatly between regions. Over the majority of the areas the winter droughts are associated with high frequency of E types and low frequency of W types. RE and RSE present also a high frequency of A type during winter and a low frequency of C type. On the other hand the summer droughts of eastern regions (RNE, RE, RSE) are usually associated with low frequency of C type, while the western regions (RSW,RNW, RC) are associated with the N type. The NE type is also frequent in RE and RSE areas during winter.
Conflict of Interest Statement
The authors declare that the research was conducted in the absence of any commercial or financial relationships that could be construed as a potential conflict of interest.
Acknowledgments
This work was partially supported by national funds through FCT (Fundação para a Ciência e a Tecnologia, Portugal) under project QSECA (PTDC/AAGGLO/ 4155/2012).
References
Barriopedro, D., Fisher, E., Luterbacher, J., Trigo, R. M., and García-Herrera, R. (2011). The hot summer of 2010: redrawing the temperature record map of Europe. Science 322, 220–224. doi: 10.1126/science.1201224
Pubmed Abstract | Pubmed Full Text | CrossRef Full Text | Google Scholar
Bastos, A., Gouveia, C. M., Trigo, R. M., and Running, S. W. (2014). Analysing the spatio-temporal impacts of the 2003 and 2010 extreme heatwaves on plant productivity in Europe. Biogeosciences 11, 3421–3435. doi: 10.5194/bg-11-3421-2014
Beck, C., and Philipp, A. (2010). Evaluation and comparison of circulation type classifications for the European domain. Phys. Chem. Earth 35, 374–387. doi: 10.5194/bg-11-3421-2014
Brunetti, M., Mangueri, M., and Nanni, T. (2001). Changes in total precipitation, rainy days and extreme events in northeastern Italy. Int. J. Climatol. 21, 861–871. doi: 10.1002/joc.660
Cortesi, N., Gonzalez-Hidalgo, J. C., Trigo, R. M., and Ramos, A. M. (2013). Weather types and spatial variability of precipitation in the Iberian Peninsula. Int. J. Climatol. 34, 2661–2677. doi: 10.1002/joc.3866
De Luis, M., Raventós, J., González-Hidalgo, J. C., Sánchez, J. R., and Cortina, J. (2000). Spatial analysis of rainfall trends in the region of Valencia (East Spain). Int. J. Climatol. 20, 1451–1469. doi: 10.1002/1097-0088(200010)20:12<1451::AID-JOC547>3.0.CO;2-0
Delworth, T. L., and Zeng, F. (2014). Regional rainfall decline in Australia attributed to anthropogenic greenhouse gases and ozone levels. Nat. Geosci. 7, 583–587. doi: 10.1038/ngeo2201
Demuzere, M., Trigo, R. M., Vila-Guerau de Arellano, J., and van Lipzig, N. P. M. (2009). The impact of weather and atmospheric circulation on O3 and PM10 levels at a rural mid-latitude site. Atmos. Chem. Phys. 9, 2695–2714. doi: 10.5194/acp-9-2695-2009
Domínguez-Castro, F., Ramos, A. M., García-Herrera, R., and Trigo, R. M. (2014). Iberian extreme precipitation 1855/1856: an analysis from early instrumental observations and documentary sources. Int. J. Climatolol. 35, 142–153. doi: 10.1002/joc.3973
Fischer, E. M., and Schär, C. (2010). Consistent geographical patterns of changes in high-impact European heatwaves. Nat. Geosci. 3, 398–403. doi: 10.1038/ngeo866
Garcia-Herrera, R., Paredes, D., Trigo, R. M., Trigo, I. F., Hernández, H., Barriopedro, D., et al. (2007). The outstanding 2004-2005 drought in the Iberian Peninsula: associated atmospheric circulation. J. Hidrometeorol. 8, 483–498. doi: 10.1175/JHM578.1
Giorgi, F. (2006). Climate change hot-spots. Geophys. Res. Lett. 33:L08707. doi: 10.1029/2006GL025734
Giorgi, F., and Lionello, P. (2008). Climate change projections for the Mediterranean region. Global Planet. Change 63, 90–104. doi: 10.1016/j.gloplacha.2007.09.005
Gouveia, C., Trigo, R. M., and DaCamara, C. C. (2009). Drought and vegetation stress monitoring in Portugal using satellite data. Nat. Hazards Earth Syst. Sci. 9, 185–195. doi: 10.5194/nhess-9-185-2009
Grams, C. M., Binder, H., Pfahl, S., Piaget, N., and Wernli, H. (2014). Atmospheric processes triggering the central European floods in June 2013. Nat. Hazards Earth Syst. Sci. 14, 1691–1702. doi: 10.5194/nhess-14-1691-2014
Hargreaves, G. H., and Samani, Z. A. (1985). Reference crop evapotranspiration from temperature. Appl. Engine Agric. 1, 96–99. doi: 10.13031/2013.26773
Hoerling, M., Eischeid, J., Perlwitz, J., Quan, X., Zhang, T., and Pegion, P. (2012). On the increased frequency of Mediterranean drought. J. Clim. 25, 2146–2161. doi: 10.1175/JCLI-D-11-00296.1
Hov, Ø., Cubasch, U., Fischer, E., Höppe, P., Iversen, T., Gunnar Kvamstø, N., et al. (2013). Extreme Weather Events in Europe: Preparing for Climate Change Adaptation. Oslo: Norwegian Meteorological Institute.
Huth, R., Beck, C., Philipp, A., Demuzere, M., Ustrnul, Z., Cahynová, M., et al. (2008). Classifications of atmospheric circulation patterns: recent advances and applications. Trends and Directions in Climate Research: Ann. N.Y. Acad. Sci. 1146, 105–152. doi: 10.1196/annals.1446.019
Pubmed Abstract | Pubmed Full Text | CrossRef Full Text | Google Scholar
IPCC. (2012). “Managing the risks of extreme events and disasters to advance climate change adaptation,” in A Special Report of Working Groups I and II of the Intergovernmental Panel on Climate Change, eds C. B. Field, V. Barros, T. F. Stocker, D. Qin, D. J. Dokken, K. L. Ebi, et al. (Cambridge, UK; New York, NY, USA: Cambridge University Press), 582.
IPCC. (2014). Climate Change 2014: Mitigation of Climate Change. New York, NY: Cambridge University Press
Jenkinson, A. F., and Collison, F. P. (1977). An Initial Climatology of Gales Over the North Sea. London, UK: Synoptic Climatology Branch Memo. 62, Met Office.
Kistler, R., Collins, W., Saha, S., White, G., Woollen, J., Kalnay, E., et al. (2001). The NCEP–NCAR 50–year reanalysis: monthly means CD–ROM and documentation. Bull. Am. Meteorol. Soc. 82, 247–267. doi: 10.1175/1520-0477(2001)082<0247:TNNYRM>2.3.CO;2
Lamb, H. (1972). British isles weather types and a register of daily sequence of circulation patterns. Geophys. Mem. 116, 1861–1971.
Lionello, P. (2012). The Climate of the Mediterranean Region. From the Past to the Future. London: Elsevier.
Lorenzo, M. N., Ramos, A. M., Taboada, J. J., and Gimeno, L. (2011). Changes in present and future circulation types frequency in northwest Iberian Peninsula. PLoS ONE 6:e16201. doi: 10.1371/journal.pone.0016201
Pubmed Abstract | Pubmed Full Text | CrossRef Full Text | Google Scholar
Lorenzo, M. N., Taboada, J. J., and Gimeno, L. (2008). Links between circulation weather types and teleconnection patterns and their influence on precipitation patterns in Galicia (NW Spain). Int. J. Climatol. 28, 1493–1505. doi: 10.1002/joc.1646
Martínez-Villalta, J., López, B. C., Adel, N., Badiella, L., and Ninyerola, M. (2008). Twentieth century increase of Scots pine radial growth in NE Spain shows strong climate interactions. Global Change Biol. 14, 2868–2881. doi: 10.1111/j.1365-2486.2008.01685.x
McKee, T. B. N., Doesken, J., and Kleist, J. (1993). “The relationship of drought frecuency and duration to time scales,” in Eight Conference On Applied Climatology ed Não encontro em lado nenhum (Anaheim, CA: Amer. Meteor. Soc.), 179–184.
Palmer, W. C. (1965). Meteorological Drought. Office of Climatology, US Weather Bureau Research Paper NO.45, Washington, DC.
Paredes, D., Trigo, R. M., García-Herrera, R., and Trigo, I. F. (2006). Understanding precipitation changes in iberia in early spring: weather typing and storm-tracking approaches. J. Hydrometeor. 7, 101–113. doi: 10.1175/JHM472.1
Pausas, J. G. (2004). Changes in fire and climate in the Eastern Iberian Peninsula (Mediterranean Basin). Climate Change 63, 337–350. doi: 10.1023/B:CLIM.0000018508.94901.9c
Pfahl, S. (2014). Characterising the relationship between weather extremes in Europe and synoptic circulation features. Nat. Hazards Earth Syst. Sci. 14, 1461–1475. doi: 10.5194/nhess-14-1461-2014
Philipp, A., Bartholy, J., Beck, C., Erpicum, M., Esteban, P., Huth, R., et al. (2010). COST733CAT – a database of weather and circulation type classifications. Phys. Chem. Earth 35, 360–373. doi: 10.1016/j.pce.2009.12.010
Ramos, A. M., Ramos, R., Sousa, P., Trigo, R. M., Janeira, M., and Prior, V. (2011). Cloud to ground lightning activity over Portugal and its association with Circulation Weather Types. Atmos. Res. 101, 84–101. doi: 10.1016/j.atmosres.2011.01.014
Russo, A., Trigo, R. M., Martins, H., and Mendes, M. T. (2014). NO2, PM10 and O3 urban concentrations and its association with circulation weather types in Portugal. Atmos. Environ. 89, 768–785. doi: 10.1016/j.atmosenv.2014.02.010
Sánchez, E., Gallardo, C., Gaertner, M. A., Arribas, A., and Castro, M. (2004). Future climate extreme events in the Mediterranean simulated by a regional climate model: a first approach. Global Planet. Change 44, 163–180. doi: 10.1016/j.gloplacha.2004.06.010
Santos, J. A., Corte-Real, J., and Leite, S. M. (2005). Weather regimes and their connection to the winter rainfall in Portugal. Int. J. Climatol. 25, 33–50. doi: 10.1002/joc.1101
Scaife, A. A., Spangehl, T., Fereday, D. R., Cubasch, U., Langematz, U., Akiyoshi, H., et al. (2012). Climate change and stratosphere–troposphere interaction. Climate Dyn. 38, 2089–2097. doi: 10.1007/s00382-011-1080-7
Schubert, S. D., Wang, H., Koster, R. D., Suarez, M. J., and Groisman, P. Y. (2014). Northern eurasian heat waves and droughts. J. Climate 27, 3169–3207. doi: 10.1175/JCLI-D-13-00360.1
Seneviratne, S. I., Lüthi, D., Litschi, M., and Schür, C. (2006). Land-atmosphere coupling and climate change in Europe. Nature 443, 205–209. doi: 10.1038/nature05095
Pubmed Abstract | Pubmed Full Text | CrossRef Full Text | Google Scholar
Serrano, A., García, J. A., Mateos, V. L., Cancillo, M. L., and Garrido, J. (1999). Monthly modes of variation of precipitation over the Iberian Peninsula. J. Climate 12, 2894–2919. doi: 10.1175/1520-0442(1999)012<2894:MMOVOP>2.0.CO;2
Sousa, P., Trigo, R. M., Aizpurua, P., Nieto, R., Gimeno, L., and García-Herrera, R. (2011). Trends and extremes of drought indices throughout the 20th century in the Mediterranean. Nat. Hazards Earth Syst. Sci. 11, 33–51. doi: 10.5194/nhess-11-33-2011
Tomás, C., de Pablo, F., and Rivas Soriano, L. (2004). Circulation weather types and cloud to-ground flash density over the Iberian Peninsula. Int. J. Climatol. 24, 109–123. doi: 10.1002/joc.917
Trigo, R. M., Añel, J., Barriopedro, D., García-Herrera, R., Gimeno, L., Nieto, R., et al. (2013). The record Winter drought of 2011-12 in the Iberian Peninsula, in explaining extreme events of 2012 from a climate perspective. Bull. Am. Meteorol. Soc. 94, S41–S45.
Trigo, R. M., and DaCamara, C. C. (2000). Circulation weather types and their impact on the precipitation regime in Portugal. Int. J. Climate 20, 1559–1581. doi: 10.1002/joc.917
Ventura, F., Rossi, P., and Ardizzoni, E. (2002). Temperature and precipitation trends in Bologna (Italy) from 1952 to 1999. Atmos. Res. 61, 203–214. doi: 10.1016/S0169-8095(01)00135-1
Vicente-Serrano, S. M. (2006). Differences in spatial patterns of drought on different time scales: an analysis of the Iberian Peninsula. Water Res. Manag. 20, 37–60. doi: 10.1007/s11269-006-2974-8
Vicente-Serrano, S. M., Beguería, S., and López-Moreno, J. I. (2010a). A Multi-scalar drought index sensitive to global warming: the standardized precipitation evapotranspiration index – SPEI. J. Climate 23, 1696–1718. doi: 10.1175/2009JCLI2909.1
Vicente-Serrano, S. M., Beguería, S., López-Moreno, J. I., Angulo, M., and El Kenawy, A. (2010b). A new global 0.5° gridded dataset (1901-2006) of a multiscalar drought index: comparison with current drought index datasets based on the Palmer Drought Severity Index. J. Hydrometeorol. 11, 1033–1043. doi: 10.1175/2010JHM1224.1
Vicente-Serrano, S. M., and López-Moreno, J. I. (2006). The influence of atmospheric circulation at different spatial scales on winter drought variability through a semiarid climatic gradient in north east Spain. Int. J. Climatol. 26, 1427–1456. doi: 10.1002/joc.1387
Vicente-Serrano, S. M., Lopez-Moreno, J. I., Beguería, S., Lorenzo-Lacruz, J., Sanchez-Lorenzo, A., García-Ruiz, J. M., et al. (2014). Evidence of increasing drought severity caused by temperature rise in southern Europe. Environ. Res. Lett. 9:044001. doi: 10.1088/1748-9326/9/4/044001
Vicente-Serrano, S. M., López-Moreno, J. I., Drumond, A., Gimeno, L., Nieto, R., Morán-Tejeda, E., et al. (2011). Effects of warming processes on droughts and water resources in the NW Iberian Peninsula (1930-2006). Climate Res. 48, 203–212. doi: 10.3354/cr01002
Wells, N., Goddard, S., and Hayes, M. J. (2004). A self-calibrating palmer drought severity index. J. Climate 17, 2335–2351. doi: 10.1175/1520-0442(2004)017<2335:ASPDSI>2.0.CO;2
Pubmed Abstract | Pubmed Full Text | CrossRef Full Text | Google Scholar
Wilks, D. (2006). Statistical Methods in the Atmospheric Sciences. No. 59 in International Geophysics, 2nd Edn. Burlington, MA: Academic Press.
Woodhouse, C. A., Meko, D. M., MacDonald, G. M., Stahle, D. W., and Cook, E. R. (2010). A 1,200-year perspective of 21st century drought in southwestern North America. Proc. Natl. Acad. Sci. U.S.A. 107, 21283–21288. doi: 10.1073/pnas.0911197107
Pubmed Abstract | Pubmed Full Text | CrossRef Full Text | Google Scholar
Xoplaki, E., Trigo, R., García-Herrera, R., Barriopedro, D., D'Andrea, F., Fisher, E. M., et al. (2012). “Large-scale atmospheric circulation driving extreme climate events in the mediterranean and its related impacts,” in The Climate of the Mediterranean Region: From the Past to the Future, ed P. Lionello (London: Elsevier), 347–417. doi: 10.1016/B978-0-12-416042-2.00006-9
Keywords: circulation weather types, Iberian Peninsula, Standardized Precipitation Evapotranspiration Index (SPEI), winter and summer droughts, spatial scale
Citation: Russo AC, Gouveia CM, Trigo RM, Liberato MLR and DaCamara CC (2015) The influence of circulation weather patterns at different spatial scales on drought variability in the Iberian Peninsula. Front. Environ. Sci. 3:1. doi: 10.3389/fenvs.2015.00001
Received: 15 September 2014; Accepted: 08 January 2015;
Published online: 04 February 2015.
Edited by:
Emanuel Dutra, European Centre for Medium-Range Weather Forecasts, UKReviewed by:
Paolo Boi, Agenzia Regionale Protezione Ambiente Sardegna, ItalyJuan José Taboada, MeteoGalicia, Spain
Copyright © 2015 Russo, Gouveia, Trigo, Liberato and DaCamara. This is an open-access article distributed under the terms of the Creative Commons Attribution License (CC BY). The use, distribution or reproduction in other forums is permitted, provided the original author(s) or licensor are credited and that the original publication in this journal is cited, in accordance with accepted academic practice. No use, distribution or reproduction is permitted which does not comply with these terms.
*Correspondence: Ana C. Russo, Instituto Dom Luiz, Faculdade de Ciências, Universidade de Lisboa, Edifício C8, Piso 3, 1749-016 Lisboa, Portugal e-mail: acrusso@fc.ul.pt