Comment on “Record solar UV irradiance in the tropical Andes, by Cabrol et al.”
 Richard L. McKenzie
 Germar Bernhard
 Sasha Madronich
 Francesco Zaratti
- 1National Institute of Water and Atmospheric Research, Lauder, Central Otago, New Zealand
- 2Biospherical Instruments Inc., San Diego, CA, USA
- 3National Center for Atmospheric Research, Boulder, CO, USA
- 4Laboratorio de Fisica de la Atmosfera, Universidad Mayor de San Andres, La Paz, Bolivia
Recently Cabrol et al. (2014), hereafter C14, reported measurements of the UV Index (UVI) reaching 43.3 at a high altitude location in the Andes (Licancabur; 22.5° S, 67.5° W, 5917 m a.s.l.). This value is much larger than those previously reported from other high altitude tropical locations. For example, UVI maxima reported for Mauna Loa (19.5° N, 155.6° W, 3397 m a.s.l.) (Bodhaine et al., 1997; McKenzie et al., 2001), La Paz, Bolivia (16.5° S, 68.1° W, 3420 m a.s.l.) (Zaratti et al., 2014), and Chile's northern Atacama Desert (Chajnantor Plateau; 23.0° S, 67.8° W, 5100 m a.s.l) (Cordero et al., 2014) are less than 26. The large UVI values measured by C14 are surprising because they would simultaneously require atmospheric conditions—specifically low total ozone amounts and cloud enhancements of UV-B radiation—that are extremely unlikely if not impossible (Seckmeyer et al., 2010). An alternative explanation of the results of C14 is that the large reported UV-B changes stem from instrument problems or data analysis issues, as will be discussed later. There are two important reasons why these measurements should be questioned and re-examined more closely:
(1) If correct, the new measurements challenge our understanding of stratospheric ozone variability and of shortwave radiative transfer—two aspects of atmospheric science that are generally viewed as firmly established theoretically and validated with numerous measurements [e.g., WMO (World Meteorological Organization), 2014]. Indeed, the very method to measure atmospheric ozone content from satellites or from the ground is based on this understanding.
(2) Measurements of very high ambient UV radiation have been reported for this region before (D'Antoni et al., 2007, 2008) but have been shown to be instrument artifacts from stray light (Flint et al., 2008); the extreme UV index values reported by C14 must therefore be taken with additional caution lest a new round of incorrect measurement becomes validation of previously reported mistakes.
We consider first the implications for the theory of radiative transfer and our understanding of the atmospheric ozone climatology. Specifically, C14 measured an extreme UV-B (280–315 nm) value of 8.15 W m−2 on January 17, 2004 at about 9:30 local time (solar zenith angle (sza) = 30.5°). In comparison, the maximum UV-B measurement at Mauna Loa is 3.5 W m−2 (http://www.ndsc.ncep.noaa.gov/UVSpect_web/). C14 suggest that their high value of 8.15 W m−2 could be explained by a combination of extremely low total ozone column (TOC) of 75 Dobson Units (DU), and simultaneous strong radiation enhancement of 27% by scattering from clouds surrounding the measurement site (Figure 3 of C14 and associated text). TOC values lower than 100 DU have been reported during the springtime Antarctic ozone hole, but not outside polar regions [WMO (World Meteorological Organization), 2014]. For example, minimum and average TOCs reported by the Ozone Monitoring Instrument (OMI) for La Paz between 2004 and 2014 are 210 and 244 DU, respectively (site 149 of http://avdc.gsfc.nasa.gov/index.php?site=1593048672&id=28). The standard deviation is 10.1 DU. Hence, a TOC of 75 would be more than 16 standard deviations below the average and therefore extremely unlikely. The high UV-B value could also be explained with an ozone column larger than 75 DU, but then the enhancement of UV-B by clouds would have to be much larger than any observation published in the past.
According to results of radiative transfer model calculations presented by C14, an ozone column of 75 DU results in a clear-sky UVI of 66 for the conditions (sza, altitude) of the extreme event on January 17. The measured UVI reported by C14 for this time is 32.6, which is less than half of the modeled value. Our own model calculations result in a value of 62, which agrees with the results by C14 to within the uncertainties of the model input parameters. Because UV-B and the UVI are in a similar wavelength band, cloud enhancement is expected to be similar and the cloud-enhanced model UVI value would therefore be 83.8 (= 66 × 1.27). Hence, if the UV-B measurements were correct and the TOC was indeed 75 DU, the reported UVI of 32.6 would be greatly inconsistent with the theory of radiative transfer represented by the model result. Because the origin of this inconsistency is unclear, it is unknown whether it would be ameliorated by use of a more typical (higher) value of the TOC.
We now turn our attention to the effect of clouds implicated in Figure 3 of C14. C14 made measurements of both UV-B and UV-A (315–400 nm) radiation which is important because the former is quite sensitive to the TOC while the latter is much less so (with respective radiation amplification factors, RAFs, of ca. 1.1 and 0.025, see McKenzie et al., 2011). Figure 3 of C14 shows short term variations of UV-B and UV-A, with peak values around 9:30 and minima around noon, as also summarized in our Table 1. The peak reported UV-A and UV-B irradiances are, respectively, 1.32 and 1.27 times larger than the clear sky values estimated from a radiative transfer model that already used exceptionally low ozone (75 DU). Enhancements by clouds are a well-known effect and can arise for short times when both bright clouds and the direct solar beam are in the field of view (Nack and Green, 1974). Cloud-related enhancements in the range of 20–30% are possible in principle but are rare, being for the most part outliers of a distribution that is on average much closer to unity (e.g., Mims and Frederick, 1994; Seckmeyer et al., 1994; Pfister et al., 2003; Bernhard et al., 2007; Badosa et al., 2014). A coincidence between such rare cloud enhancements and record-low ozone is improbable. However, even more troubling are the variations in the few hours following the peak, with both UV-A and UV-B levels dropping sharply as summarized in Table 1. Reported UV-A radiation decreased by a factor of 3.2 (even not accounting for the higher sun at noon), while UV-B decreased by a much larger factor, 16.3. In theory, the clear-sky UV-B irradiance should show a larger increase than UV-A irradiance between 9:30 a.m. and noon due its stronger dependence on sza. If the UV-A decrease was due to clouds (reducing rather than enhancing irradiance, ostensibly by now blocking the direct beam), and the same factor is applied to UV-B wavelengths, a remaining factor of 5.1 (= 16.3/3.2) decrease in UV-B must be explained by a process other than one related to clouds. If ozone were the culprit, such a decrease in UV-B would require an increase from 75 DU to about 350 DU. Thus, explanation of the UV-B observations requires not only an unprecedented low ozone column value for these latitudes (75 DU) at the time of the maximum, but also a rapid increase to 350 DU within a few hours. We are not aware of such extreme spatio-temporal granularity of stratospheric ozone at any location around the globe.
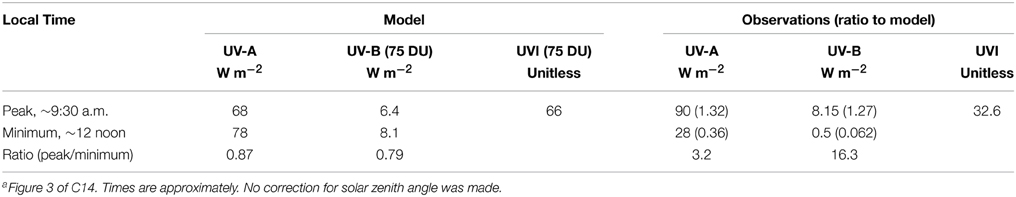
Table 1. Extreme UV-A, UV-B, and UVI measurements reporteda by C14.
C14 suggest that an optically thick cloud at noon could have enhanced the absorption by tropospheric ozone, thereby contributing to the pronounced drop in UV-B and could thus explain the sharp noon-time UV-B reductions. Such a phenomenon is well known for heavy clouds over polluted regions because in-cloud scattering increases the total length traversed by photons before exiting the cloud base, increasing total absorption in accordance with the Beer-Lambert law. For example, Mayer et al. (1998) described one episode during a thunderstorm over an industrialized region of Germany (where tropospheric ozone is abundant) in which the apparent TOC increased from about 300 DU to about 600 DU, about the same increase as would be required by C14. However, this heavy cloud reduced UV-A to only 2–3% of its clear sky value (see Figure 4 of Mayer et al.), while the C14 measurements indicate only a reduction to 36% in UV-A when this UV-B minimum occurred. Thus, neither a heavy cloud nor significant tropospheric ozone appears supported by the simultaneous UV-A and UV-B data.
We also note that cloud enhancement effects under these relatively pristine conditions should be similar, and even somewhat stronger, at the longer UV-A (and visible) wavelengths compared to UV-B. This is essentially because at shorter wavelengths molecular Rayleigh scattering is stronger (~ λ−4) so that additional scattering from clouds is not as large in a relative sense. Detailed radiative transfer models as well as observations confirm that the cloud effects generally deviate from unity more with increasing wavelength (see for example Figures 2–4 of Crawford et al., 2003; or Figure 4 of Badosa et al., 2014). Thus, based on previous theory and observations, we doubt that the larger UV-B variations are due to more profound cloud effects at the shorter wavelengths, be it as a result of absorption or scattering.
An alternative explanation of the results of C14 is that the large reported UV-B changes stem from instrument problems or data analysis issues. We recognize that accurate and reliable measurement of UV-B radiation can be extremely difficult, and much more so in the extreme environment of the high-altitude Andes. For example, any (unquantified) departures from the ideal cosine responses for the detectors would become more problematic because a larger fraction of the irradiance is in the direct solar beam. The particular type of instrument used in this study overcomes many of these difficulties, but has also been shown to be less stable than some other instruments, e.g., during the 2006 intercomparison of erythemal radiometers (Gröbner et al., 2006). Furthermore, there is no discussion by C14 of data analysis; for example, the method used to derive UVI from the instrument's UV-B and UV-A data is not described. There is also no discussion of measurement uncertainties, which would have been particularly useful given that a “record” value is reported. In practice, the uncertainties arising from band-pass mismatches and angular response errors alone would likely exceed 10%. The conversion factors from instrument response to the desired output (e.g., UV-B, UVI) are functions of ozone and SZA (Seckmeyer et al., 2006), so if the ozone amount is not known accurately, it is not possible to accurately retrieve these UV outputs. An example of this issue is clearly apparent in the inconsistencies between the measured UV-B and UVI values, and their ratios to model results discussed earlier.
The overall uncertainty in C14's retrieved UV values relative to an irradiance scale established by a standards laboratory (e.g., NIST) would be considerably greater than 10% when operating correctly, and, as noted above, there have been well-documented examples when these instruments did not behave correctly. On this basis, we feel it would be premature to revise our understanding of shortwave radiative transfer or stratospheric ozone variability to match these results.
Conflict of Interest Statement
The authors declare that the research was conducted in the absence of any commercial or financial relationships that could be construed as a potential conflict of interest.
References
Badosa, J., Calbo, J., McKenzie, R., Liley, B., Gonzalez, J. -A., Forgan, B., and Long, C. N. (2014). Two methods for retrieving UV index for all cloud conditions from sky imager products or total SW radiation measurements. Photochem. Photobiol. 90, 941–951. doi: 10.1111/php.12272
PubMed Abstract | Full Text | CrossRef Full Text | Google Scholar
Bernhard, G., Booth, C. R., Ehramjian, J. C., Stone, R., and Dutton, E. G. (2007). Ultraviolet and visible radiation at Barrow, Alaska: climatology and influencing factors on the basis of version 2 National Science Foundation network data. J. Geophys. Res. 112, D09101. doi: 10.1029/2006JD007865
Bodhaine, B. A., Dutton, E. G., Hofmann, D. J., McKenzie, R. L., and Johnston, P. V. (1997). Spectral UV measurements at Mauna Loa: july 1995-july 1996. J. Geophys. Res. 102, 19265–19273.
Cabrol, N. A., Feister, U., Häder, D. -P., Piazena, H., Grin, E. A., and Klein, A. (2014). Record solar UV irradiance in the tropical Andes. Front. Environ. Sci. 2:19. doi: 10.3389/fenvs.2014.00019
Cordero, R. R., Seckmeyer, G., Damiani, A., Riechelmann, S., Rayas, J., Labbe, F., et al. (2014). The world's highest levels of surface UV. Photochem. Photobiol. Sci. 23, 70–81. doi: 10.1039/C3PP50221J
PubMed Abstract | Full Text | CrossRef Full Text | Google Scholar
Crawford, J., Shetter, R. E., Lefer, B., Cantrell, C., Junkermann, W., Madronich, S., et al. (2003). Cloud impacts on UV spectral actinic flux observed during the International Photolysis Frequency Measurement and Model Intercomparison (IPMMI), J. Geophys. Res. 108, 8545. doi: 10.1029/2002JD002731
D'Antoni, H., Rothschild, L., Schultz, C., Burgess, S., and Skiles, J. W. (2007). Extreme environments in the forests of Ushuaia, Argentina. Geophys. Res. Lett. 34, L22704. doi: 10.1029/2007GL031096
D'Antoni, H. L., Rothschild, L. J., and Skiles, J. W. (2008). Reply to comment by Stephan D. Flint et al. on “Extreme environments in the forests of Ushuaia, Argentina”. Geophys. Res. Lett. 35, L13711. doi: 10.1029/2008GL033836
Flint, S. D., Ballare, C. L., Caldwell, M. M., and McKenzie, R. L. (2008). Comment on “Extreme environments in the forests of Ushuaia, Argentina.” Geophys. Res. Lett. 35, L13710. doi: 10.1029/2008GL033570
Gröbner, J., Hülsen, G., Vuilleumier, L., Blumthaler, M., Vilaplana, J. M., Walker, D., et al. (2006). Report of the PMOD/WRC-COST Calibration and Intercomparison of Erythemal Radiometers (Davos). Available online at: www.pmodwrc.ch/wcc_uv/pdf/ReportCOST726.pdf
Mayer, B., Kylling, A., Madronich, S., and Seckmeyer, G. (1998). Enhanced absorption of UV irradiance due to multiple scattering in clouds: experimental evidence and theoretical expectation. J. Geophys. Res. 103, 31241–31254. doi: 10.1029/98JD02676
McKenzie, R. L., Aucamp, P. J., Bais, A. F., Björn, L. O., Ilyas, M., and Madronich, S. (2011). Ozone depletion and climate change: impacts on UV radiation. Photochem. Photobiol. Sci. 10, 182–198. doi: 10.1039/c0pp90034f
PubMed Abstract | Full Text | CrossRef Full Text | Google Scholar
McKenzie, R. L., Johnston, P. V., Smale, D., Bodhaine, B., and Madronich, S. (2001). Altitude effects on UV spectral irradiance deduced from measurements at Lauder, New Zealand and at Mauna Loa Observatory, Hawaii. J. Geophys. Res. 106, 22845–22860. doi: 10.1029/2001JD900135
Mims, F. M. III., and Frederick, J. E. (1994). Cumulus clouds and UVB. Nature 371, 291. doi: 10.1038/371291a0
Nack, M. L., and Green, A. E. S. (1974). Influence of clouds, haze, and smog on the middle ultraviolet reaching the ground. Appl. Opt. 12, 2405–2415. doi: 10.1364/AO.13.002405
PubMed Abstract | Full Text | CrossRef Full Text | Google Scholar
Pfister, G., McKenzie, R. L., Liley, J. B., Thomas, A., Forgan, B. W., and Long, C. N. (2003). Cloud coverage based on all-sky imaging and its impact on surface solar irradiance. J. Appl. Meteor. 42, 1421–1434. doi: 10.1175/1520-0450(2003)042<1421:CCBOAI>2.0.CO;2
Seckmeyer, G., Bais, A., Bernhard, G., Blumthaler, M., Johnsen, B., Lantz, K., et al. (2010). Instruments to Measure Solar Ultraviolet Radiation, Part 3: Multi-Channel Filter Instruments. World Meteorological Organization Global Atmosphere Watch, Report 190, WMO/TD-No. 1537 (Geneva).
Seckmeyer, G., Bais, A., Bernhard, G., Blumthaler, M., Booth, C. R., Lantz, K., et al. (2006). Instruments to Measure Solar Ultraviolet Radiation. Part 2: Broadband Instruments Measuring Erythemally Weighted Solar Irradiance. World Meteorological Organization Global Atmosphere Watch, Report No. 164, WMO TD-No. 1289 (Geneva), 55, electronic version 2006.
Seckmeyer, G., Mayer, B., Erb, R., and Bernhard, G. (1994). UV-B in Germany higher in 1993 than in 1992. Geophys. Res. Lett. 21, 577–580. doi: 10.1029/94GL00567
WMO (World Meteorological Organization). (2014). Scientific Assessment of Ozone Depletion: 2014, World Meteorological Organization, Global Ozone Research and Monitoring Project, Report No. 55, 416, (Geneva).
Zaratti, F., Piacentini, R. D., Guillen, H. A., Cabrera, S. H., Liley, J. B., and McKenzie, R. L. (2014). Proposal for a modification of the UVI risk scale. Photochem. Photobiol. Sci. 13, 980–985. doi: 10.1039/c4pp00006d
PubMed Abstract | Full Text | CrossRef Full Text | Google Scholar
Keywords: Record solar UV irradiance, UV index, ozone, UV-B, UV-A, radiative transfer, UV measurement, atmosphere
Citation: McKenzie RL, Bernhard G, Madronich S and Zaratti F (2015) Comment on “Record solar UV irradiance in the tropical Andes, by Cabrol et al.”. Front. Environ. Sci. 3:26. doi: 10.3389/fenvs.2015.00026
Received: 03 February 2015; Accepted: 18 March 2015;
Published: 08 April 2015.
Edited by:
Ashok Kumar Ghosh, Anugrah Narayan College, IndiaReviewed by:
Gunther Seckmeyer, Leibniz University of Hannover, GermanyCopyright © 2015 McKenzie, Bernhard, Madronich and Zaratti. This is an open-access article distributed under the terms of the Creative Commons Attribution License (CC BY). The use, distribution or reproduction in other forums is permitted, provided the original author(s) or licensor are credited and that the original publication in this journal is cited, in accordance with accepted academic practice. No use, distribution or reproduction is permitted which does not comply with these terms.
*Correspondence: Richard L. McKenzie, richard.mckenzie@niwa.co.nz