Costs and benefits of satellite-based tools for irrigation management
 Francesco Vuolo
 Laura Essl
  Clement Atzberger
- Institute of Surveying, Remote Sensing and Land Information, University of Natural Resources and Life Sciences, Vienna, Austria
This paper presents the results of a collaborative work with farmers and a cost-benefit analysis of geospatial technologies applied to irrigation water management in a semi-arid agricultural area in Lower Austria. We use Earth observation (EO) data to estimate crop evapotranspiration (ET) and webGIS technologies to deliver maps and irrigation advice to farmers. The study reports the technical and qualitative evaluation performed during a demonstration phase in 2013 and provides an outlook to future developments. The calculation of the benefits is based on a comparison of the irrigation volumes estimated from satellite vs. the irrigation supplied by the farmers. In most cases, the amount of water supplied was equal to the maximum amount of water required by crops. At the same time high variability was observed for the different irrigation units and crop types. Our data clearly indicates that economic benefits could be achieved by reducing irrigation volumes, especially for water-intensive crops. Regarding the qualitative evaluation, most of the farmers expressed a very positive interest in the provided information. In particular, information related to crop ET was appreciated as this helps to make better informed decisions on irrigation. The majority of farmers (54%) also expressed a general willingness to pay, either directly or via cost sharing, for such a service. Based on different cost scenarios, we calculated the cost of the service. Considering 20,000 ha regularly irrigated land, the advisory service would cost between 2.5 and 4.3 €/ha per year depending on the type of satellite data used. For comparison, irrigation costs range between 400 and 1000 €/ha per year for a typical irrigation volume of 2000 cubic meters per ha. With a correct irrigation application, more than 10% of the water and energy could be saved in water-intensive crops, which is equivalent to an economic benefit of 40–100 €/ha per year.
Introduction
Irrigated agriculture is the main user of freshwater resources (WWAP, United Nations World Water Assessment Programme, 2015). Recent studies show that many large aquifer located in agricultural regions are exposed to stress conditions due to intense exploitation combined to a slower rate of recharge (Richey et al., 2015b); our knowledge about the total amount of water stored and the resilience of these systems is often limited (Richey et al., 2015a). Hence, efficient irrigation management is vitally important, especially within the growing context of challenges such as increased use of groundwater and water quality degradation (OECD, 2012). While agricultural decisions are often made solely on the basis of a farmer's experience and at individual level, today the farming sector is expected to deliver food security, environmental sustainability, and create new economic opportunities (WEF, 2013). This requires not only improved efficiency at farm scale but also tools that allow water management and monitoring on a larger scale. With a 70 per cent share of worldwide water withdrawals, improved efficiency of water application and management is expected to result in a major step toward more sustainable water usage (WEF, 2013).
The potential of Earth observation (EO) techniques to support irrigation water management is now widely recognized: high spatial resolution satellite images are well-suited to monitor the spatial and temporal distribution of crop development and to derive crop evapotranspiration (ET) at field scale with a regional coverage (Choudhury et al., 1994; Bausch, 1995; Courault et al., 2005; Verstraeten et al., 2008; McMahon et al., 2013). However, the adoption of these technologies and the integration into the day-to-day routine operations of farmers is a complex process and favorable conditions depend on several technical, social, and economic factors (Baptista, 2006).
A commonly used approach to produce maps of ET in operational frameworks relies on the methodology proposed by FAO in 1998 (Allen et al., 1998; Task Committee on Standardization of Reference Evapotranspiration, 2005). The approach requires local agro-meteorological data for the direct application of the Penman-Monteith (P-M) equation, with EO-based estimates of albedo (r) and Leaf Area Index (LAI) (D'Urso and Menenti, 1995; D'Urso, 2001; D'Urso et al., 2010; Vuolo et al., 2015a). The minimum satellite data requirements to apply this approach are multispectral observations in the visible (VIS) and near-infrared (NIR) spectrum. Such data are available with the appropriate frequency and spatial resolutions. Suitable satellite platforms are for instance Landsat-8 (U.S. Geological Survey—USGS—and NASA) which provides free data within less than 24-h of acquisition. In an operative scenario, Landsat-8 is often combined with commercial satellite data to achieve a temporal resolution of about 7–10 days between acquisitions, which is adequate to monitor the various phases of the crop development throughout the growing season. The availability of free and open access data for commercial use is expected to improve with the Sentinel-2 mission (Drusch et al., 2012), developed by European Space Agency (ESA) within the Copernicus initiative.
Several research projects have facilitated the advancement of readiness levels pertaining to the application of space technologies to water resource management. The first concept of satellite-based irrigation advisory services was designed in the context of the DEMETER EU-project in 2005 (D'Urso and Belmonte, 2006; Osann Jochum, 2006). It was successively improved and automatized to meet the requirements of individual farmers with personalized weekly irrigation advices by using Short Message Services on mobile phones1 (Vuolo et al., 2006; De Michele et al., 2009). The development of advisory services based on webGIS platforms has been initially developed within the PLEIADeS2 EU-project and further tested in SIRIUS3. The methodologies have been validated during several experimental field campaigns (Rubio, 2006; D'Urso et al., 2010; Vuolo et al., 2013) showing a strong potential and good transferability to different contexts.
In Lower Austria, the region of Marchfeld is one of the major crop production areas. Water resource management is a real and tangible issue in this region. Due to the shortage of precipitation and the semi-arid regional climate, after the Second World War farmers began to intensify crop production by irrigation with groundwater. Today most of the cultivated land in Marchfeld is equipped with irrigation infrastructures. Groundwater is shared with urban and industrial sectors, leading to high pressure on the quantity and quality of resources. The increased demand for high quality food, sustainable local production, and market development strategies is stimulating the application of tools for more efficient and effective irrigation water use (Cepuder, 2004). Tests have been carried out to regulate irrigation based on soil water content measurements performed at plant or field scale (Cepuder and Nolz, 2007). However, the widespread application of soil water content sensors that can support the decision making process is hampered by investment and maintenance costs. Generally, the information available to help in the decision process is based only on agro-meteorological data that does not account for the large spatial variability of crop development, soil conditions, and agronomic practices.
This work presents the results of a demonstration campaign in the Marchfeld region (conducted in May–September, 2013) and evaluation with users. First, we compared the irrigation volumes estimated from satellite and the irrigation supplied by the farmers to calculate the efficiency of water use. Second, during and after the irrigation season, we assessed the service with the users based on questionnaires and meetings. The results of this qualitative evaluation provided an indication of the usefulness of the information in relation to the user needs. Finally, we developed a cost and benefit analysis and evaluated the willingness to pay for the information generated by the project. This study reports preliminary results of the evaluation. It also introduces the information technologies and webGIS solutions used to provide the service and presents future steps for implementation.
Material and Methods
Pilot Area
Implementation and evaluation activities were carried out in the years 2012–2013 in the framework of a case study in the Marchfeld region (Lat. 48.20°N, Long. 16.72°E), Lower Austria (Figure 1). In this region of about 60,000 hectares, irrigation water is sourced mainly from private well via electric or diesel pumps. Irrigation water accounts for up to 60 per cent of the total freshwater use4. Irrigation is regularly performed (using sprinkler systems) during the cropping period for intensive crops (i.e., sugarbeet, potatoes, and various vegetables), and during the dry periods for semi-intensive crops (such as cereals, oilseed, and maize). The climate in Marchfeld is semi-arid with annual precipitations of less than 550 mm (about 250–300 mm from May to September). The soil conditions are characterized by a high spatial variability, including soils with low to moderate water-storage capacity (Rischbeck, 2007; Thaler and Eitzinger, 2008; Eitzinger et al., 2009).
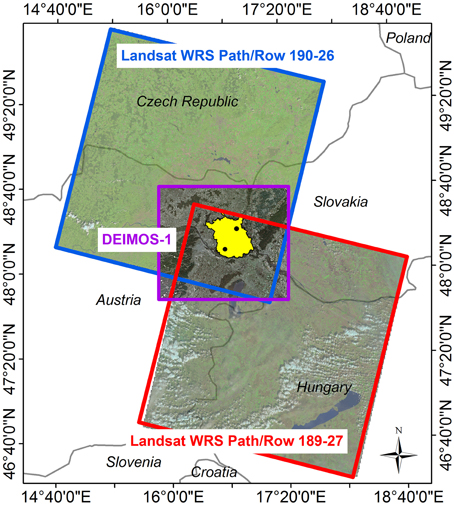
Figure 1. Configuration of the Landsat-8 and DEIMOS-1 acquisitions over the test site of Marchfeld (yellow polygon). The black dots indicate the location of the two weather stations.
Methodological Background for the Estimation of Crop Water Requirements
The approach for the calculation of crop ET using satellite observations was developed by (D'Urso and Menenti, 1995), based on Penman–Monteith (P–M) equation as implemented in the FAO-56 procedure (Allen et al., 1998). A detailed description of the methodologies for the generation of maps of crop ET and crop water requirements (CWR) was recently reported in a comparative study in different pilot areas (Vuolo et al., 2015a). The model considers the canopy as a “big leaf,” with a surface area expressed by the LAI, a crop height hc and a hemispherical spectrally integrated albedo r. LAI and albedo (r) maps can be obtained using atmospherically corrected multi-spectral images. To calculate crop ET, the model also required daily values of main agro-meteorological variables (i.e., temperature, solar radiation, wind speed, and air humidity) obtained from local weather stations. The ratio of crop ET to the reference ET (ET of the hypothetical grass reference crop i.e., hc = 0.12 m; r = 0.23, and LAI = 2.88) leads to the crop coefficient (kc), which is often used in irrigation management. The CWR is calculated by subtracting the rainfall from crop ET. Depending on user requirements, the calculated CWR is further aggregated over different temporal (e.g., weekly) and spatial (e.g., individual parcels) scales. The information is then transferred to farmers for irrigation management using webGIS and mobile phone technologies.
The most critical point in the data processing chain is the successful acquisition of cloud-free satellite images. A first estimation of the availability of adequate data over our pilot area was carried out using the revisit time map created for the Sentinel-2 mission planning (Martimort et al., 2007). According to this map, the constellation of the two Sentinel-2 satellites (the first satellite was successfully launched in June 2015) would be able to acquire cloud-free images in summer every 5 days in areas with clear-sky conditions (as in Southern Europe) and every 15–30 days in cloudy areas. For our geographic location, cloud-free images would be available approximately every 10–15 days (with two satellites in operation). Sentinel-2 data will be available with global coverage as well as free and open access for the European and international users, therefore there will be a high potential for application in Europe and in other regions. Moreover, the combined use of Sentinel-2 and Landsat-8 will further increase the opportunities to acquire cloud-free scenes with adequate temporal resolution.
Waiting for a fully operational Sentinel-2 mission, our development and initial operations activities have been based on existing free and commercial satellite sensor data. In particular, the Marchfeld region is located in the overlapping area between two Landsat orbits (Figure 1); within this area, Landsat achieves a revisit time of 8 days, which is usually not sufficient to produce cloud-free scenes with the required temporal interval. Therefore, our approach was to use the commercial satellite DEIMOS-1 (featuring an image swath of 630 km and a ground sampling distance of 22 m)5 in a virtual constellation of satellites with Landsat-8. DEIMOS-1 acquisitions were tasked during the campaign to complement Landsat-8 in case of cloud cover. Thanks to its large image swath, DEIMOS-1 can theoretically achieve a revisit time of 1–3 days. Based on this strategy, we obtained cloud-free acquisitions every 15 days (average value during the irrigation season) in 2013. An overview of the images acquired in the year 2013 is provided in Figure 2. By using Landsat-8 images in addition to DEIMOS-1 data, substantial cost reductions were achieved.
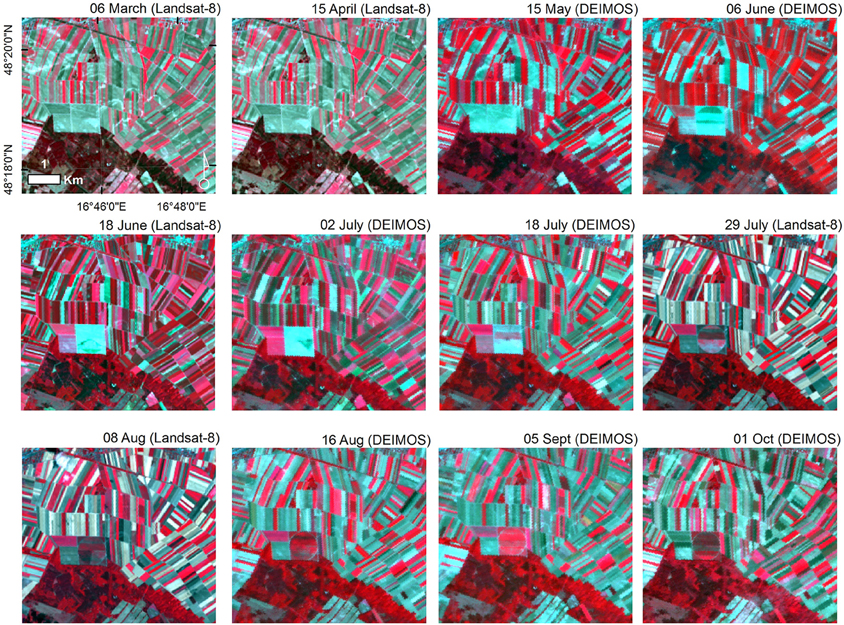
Figure 2. Near-infrared color composite of a time series of DEIMOS-1 and Landsat-8 images over Marchfeld in the year 2013. Four more cloud-free Landsat-8 scenes were available on May 1st, September 6th, October 1st and 8th.
Agro-meteorological variables were measured using wireless weather stations at two different sites located in the southern and northern part of the pilot area (black dots in Figure 1). Reference ET was calculated according to the FAO-56 standards and made available twice a day: we provided a first forecast at midday and updated it with the actual value at midnight. In this way, farmers could calculate the water requirement already for the current day. All meteorological data were recorded and stored on a 15-min basis; reference ET was calculated on an hourly basis and aggregated to daily values.
Delivery of the Information
Experience gained in past projects revealed that decision support tools have to be easy-to-use, reliable and correctly embedded into irrigation routine operations of farmers. Otherwise, it is not possible to achieve successful and effective use of maps and other provided data. Several information technology solutions are possible, based on spatial online data analysis and visualization systems with dynamically interactive graphics display for decision-support or personalized information sheet. We used an existing and consolidated webGIS solution implemented in past projects in Italy in the context of an operative irrigation advisory service (Irrisat) and made available for the purpose of the project. The webGIS system is the main repository for the maps and irrigation advices, which are published on a timely basis, with access restricted to individual farmers for their parcels. Figure 3 shows the mapping panel of the webGIS that provides tools to browse and query maps and to display the boundaries of the irrigation units. A data frame (right panel, Figure 3), provides the plot details (crop type, irrigation method) and the temporal series of crop ET, effective rainfall, and irrigation requirements. The dictionary, units and style of maps of the existing webGIS system were adapted to the local conditions and deployed for demonstration in Marchfeld.
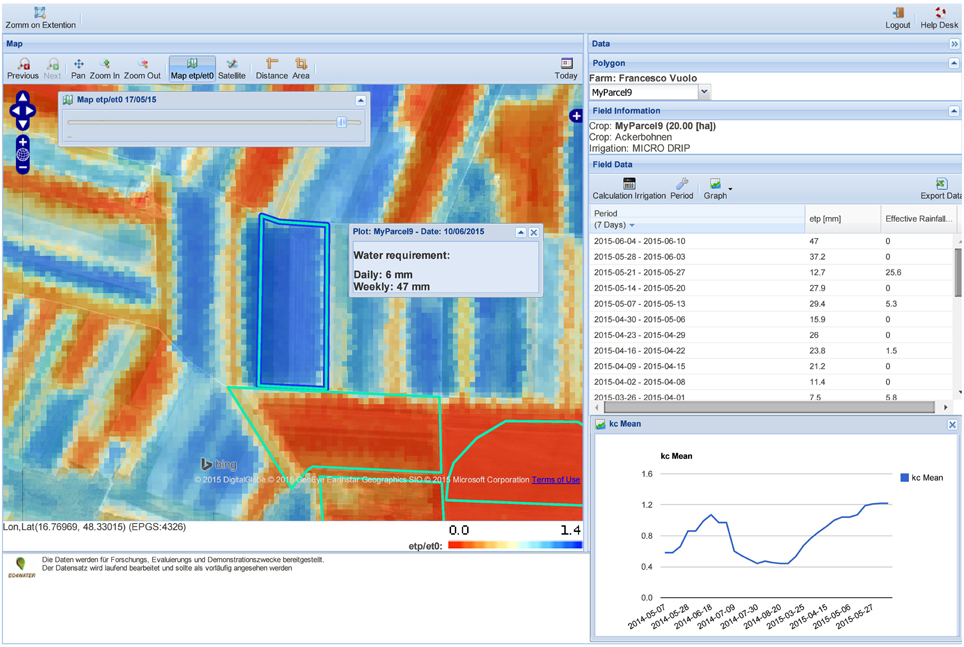
Figure 3. Example of webGIS interface used to deliver the irrigation advice. The map displays the ratio of crop ET to reference ET (i.e., crop coefficient image, kc, where red tones indicate low kc-values); the data and chart panel on the right side display the weekly crop ET, the effective rainfall values, and the kc chart of the selected parcel.
Evaluation
The demonstration campaign conducted in the year 2013 provided the framework for evaluation that was achieved at different levels.
First, we compared the satellite-derived irrigation volumes with the irrigation supplied by the farmers. The volumes of supplied water for each irrigation unit were directly reported by the farmers based on their measurements. In total, we received 46 irrigation reports. These volumes were aggregated to an adequate temporal scale (based on the time of irrigation) and compared to the CWR estimated from satellite. For this comparison, we used the time interval between the first and last irrigation during the period covered by satellite images. These data were further summarized to calculate the Total Crop Water Use Indicator (IP) that expresses the adequacy of water supplied compared to the water requirements (water supply/water demand). A value greater than 1 indicates that the amount of water supplied is higher than the potential water needed.
Second, during and after the irrigation season, a qualitative evaluation with the users was achieved. The main aim was to get insight into the user's perspective and gain knowledge about the expectations, needs and problems of the farmers relating to the use of the information and tools provided. Our approach was to turn existing issues into opportunities to further improve the functionality of the system. Therefore, we worked closely with a core group of farmers who tested the system during a demonstration campaign (May–September, 2013). Personal contacts were established before the campaign by visiting farmers at their place or by keeping regular contact by telephone. During the irrigation season, farmers had different options to provide their feedback and to get help in case of problems: they could either call the project team or participate in one of the monthly group meetings. If the problem was not solved by phone, personal visits were conducted. At the end of the irrigation season (October 2013), all farmers were visited again personally to collect their final feedback and their perception of problems and benefits. For this purpose, a semi-structured questionnaire was developed and compiled during face-to-face interviews with each of the farmers. It aimed at capturing information connected to the use of the system (frequency of use, benefit, problems), but was kept open to leave space for personal comments.
Finally, we developed a cost and benefit analysis for different data cost scenarios and evaluated the willingness to pay for the information generated by the project. The benefits were classified in two main categories according to the approach proposed by (Wichelns and Oster, 2006), which differentiates between farm-level benefits and the social cost-benefit of irrigation management. In this paper, we focus only on farm-level benefits. A qualitative description of the benefit was based on the analysis to the semi-structured questionnaire and measured by the willingness of the farmers to pay for the service. Table 1 summarizes the benefits and possible valuation methods.
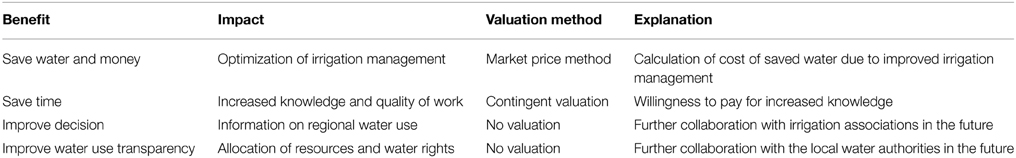
Table 1. Benefits and possible valuation methods.
Results
A total number of 358 irrigation units were registered into the webGIS system and 30 different farmers contributed in various ways to the demonstration and evaluation of the project activities. The participating irrigation units covered an area of approximately 2000 ha (~10% of total irrigated area in Marchfeld) and were distributed over 40 different administrative districts. The average field size was 5 hectares (ha) and the crop inventory comprised 33 different crop species. Twenty-two farmers were engaged in regular face-to-face meetings and 17 farmers provided irrigation volumes for a total number of 46 fields or irrigation units (comprising different crop types, sowing dates, soil characteristics, and irrigation techniques).
Evaluation of Crop Water Requirements vs. Water Supply
The comparison was performed for all the irrigation volumes for the 46 fields collected during the campaign in the year 2013 and included various crops such as Sugarbeet, Maize, Potatoes, Soya, Onion, Carrots, Spinach, and Peas. Figure 4 shows (A) an example of satellite-based crop coefficient curves for different crops, (B) the temporal evolution of the CWR estimated from satellite vs. the irrigation supplied and (C) the total water supplied (irrigation + effective rainfall) vs. the water demand. Figure 5 provides a synthesis of the results. Figure 6 shows the Total Crop Water Use Indicator (IP). We can notice that the average value of the IP is close to 1, indicating that the amount of water supplied is equal to the maximum amount of water required by crops in the reference time frame. However, a high variability can be observed for the different irrigation units and crop types. For example, results indicate that sugarbeet (number of irrigation units, n = 16) received less water than the potential requirements (from 0.83 to 0.91 times the maximum requirements), while Onion (n = 3), Maize (n = 9), and other vegetables (n = 5) (Carrots, Spinach, and Peas) received more water than required. For the mentioned vegetables, IP ranged between 1.47–1.58, 1.15–1.2, and 1.38–1.64. Soya (n = 5) and Potatoes (n = 8) presented an IP range of 0.98–1.12, indicating that the maximum water requirements were fully satisfied. The data indicate that some economic benefit could be directly achieved by reducing the irrigation volumes. However, these results are limited to one irrigation season only, which was particularly dry from middle June to the end of August. The total reference ET (from May 15th to September 30th 2013) ranged between 480 and 530 mm, with a total rainfall of 300 mm. A more detailed analysis will require considering the irrigation and the water requirements over multiple seasons before drawing conclusions on irrigation efficiency in the study area. Regarding the validation of the crop ET maps, we evaluated the performance of the atmospheric correction over multiple seasons and years (Vuolo et al., 2015b) and the accuracy in the retrieval of LAI over a wide range of crops (Vuolo et al., 2013, 2015a). In both cases we achieved good results. Additionally, the crop ET was directly validated using actual ET measurements based on eddy covariance data for a maize field during the irrigation season 2014; results (not shown) demonstrated a very good agreement between measured and satellite-based crop ET.
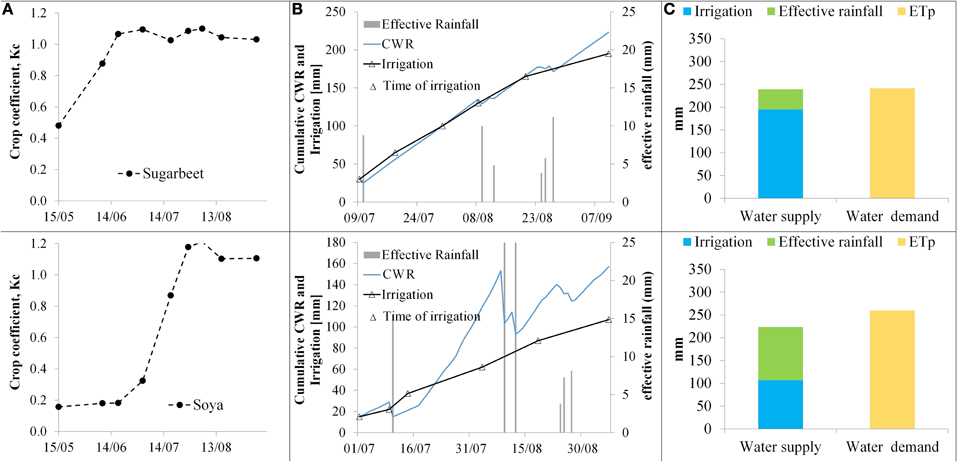
Figure 4. Examples of (A) satellite-based crop coefficient, (B) Crop Water Requirements (CWR) estimated from satellite vs. supplied irrigation volumes provided by the farmers, and (C) Total water supplied (Irrigation + effective rainfall) vs. water demand (crop ET).
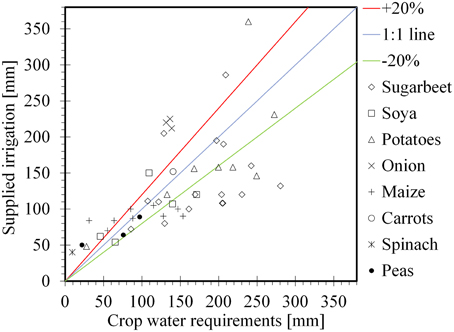
Figure 5. Crop water requirements (CWR) vs. supplied irrigation volumes for Sugarbeet (number of irrigation units, n = 16), Soya (n = 5), Potatoes (n = 8), Onion (n = 3), Maize (n = 9), and other crops (Carrots, Spinach and Peas) (n = 5).
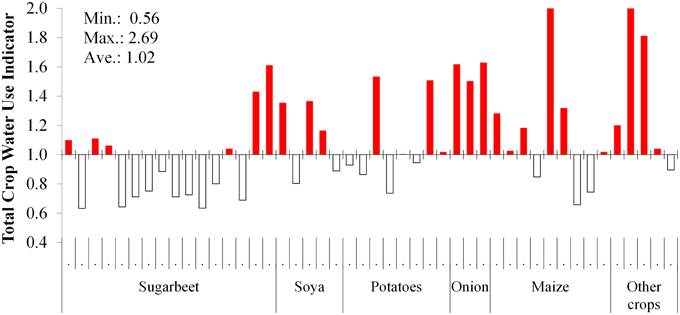
Figure 6. Total Crop Water Use Indicator (Water supply/Potential Water Demand) for Sugarbeet (n = 16), Soya (n = 5), Potatoes (n = 8), Onion (n = 3), Maize (n = 9), and other crops (n = 5).
Qualitative Evaluation
Most farmers expressed a positive interest in the information (mainly crop evapotranspiration that helps them to make decision on irrigation) and the majority of them (54%) also expressed a general willingness to pay, either directly or via cost sharing with complementary services. Farmers were asked about the expected benefits and the value-added information and multiple answers were possible. The most often mentioned reason for taking part in the demonstration and evaluation activities was (i) the determination of the best time for irrigation, (ii) the interest in new technologies, and (iii) the information about crop evapotranspiration. Another incentive was the possibility to observe—by using crop vigor maps—differences in crop development within a parcel or between parcels planted with the same crop and under different management practices.
Based on the visualization and interpretation of the crop vigor maps, farmers expected to prove their long professional experience and to save money on energy costs for irrigation, on travels and time necessary to survey all their parcels. Expected benefits that were mentioned less often included the possibility: (i) to derive information on soil characteristics, (ii) to improve the sustainable use of water within the farm, and (iii) to get local weather information.
The most frequently mentioned issues were that the units and terminology were difficult to understand. Some farmers noted that the system is not compatible with their management structure as they need a period of a few days to irrigate one field and therefore cannot react immediately on changing water requirements of the crops. Other farmers had (minor) technical problems related to lost passwords and the type of internet browser they used. Distribution of rainfall in Marchfeld strongly varies and the two weather stations were considered insufficient to cover the whole area. Sometimes, satellite images with a higher spatial resolution were expected.
Concerning the decision making process for irrigation, results indicate that farmers base their decisions on various criteria: the most frequently listed factors were the actual weather conditions and the weather forecast. Farmers use various online platforms to get information about precipitation and wind direction. In addition, many farmers have their own precipitation measurement stations within the farm or in field. Another environmental criterion is the actual condition of the plants, which is checked personally on site.
Economic criteria also play an important role in the decision to irrigate crops. The price of the seeds determines the initial investment and crops with expensive seeds (e.g., onions) are more frequently irrigated (resulting often in over-irrigation). The expected market price of the product is another factor to decide which crops are irrigated. Irrigation itself is expensive with prices between 0.2–0.5 € per cubic meter depending on the type of irrigation system. Fuel prices are subject to high variations and are therefore also a relevant factor in the decision-making process. To give a practical example, we can consider that 1 hectare (ha) of onion receives about 200 mm of water, which is equivalent to 2000 cubic meters per ha. This leads to a total cost of 400–1000 € per ha only for irrigation. In addition, farmers have obligations to fulfill production contracts, which is only possible with irrigation. For certain crops, they have to assure that irrigation on the fields is possible and therefore these crops will be irrigated first. Another relevant aspect is the personal experience. Farmers recognized that their habits are difficult to change. They receive suggestions from friends concerning irrigation and decisions of their respective neighbors influence their own irrigation management practices. The capacity of infrastructure is another constraint. Farmers usually do not have the capacity to irrigate all their fields, so they have to decide at the beginning of the season where to place the irrigation infrastructure.
Some of the expectations were completely fulfilled: (i) farmers confirmed their observations about differences between different fields with the spatial variability depicted in the satellite-based maps; (ii) the information on plant development confirmed or even improved their experience. Some expected benefits were not achieved within the timeframe of this analysis: the determination of the best time to irrigate was not permitted by the system as the farmers had to concentrate on other limiting factors (mainly technical) due to the dry summer months experienced in the year 2013.
Economic Analysis
Benefits
Farmers were asked whether further optimization of their irrigation management practices was possible. Only 23% stated that there were no more margins for optimization whereas 50% said that further improvements could be achieved by optimizing the total amount of water requirements and the temporal frequency and distribution of individual irrigation events. No general tendency could be found as some farmers claimed to irrigate too much while others complained about water deficits of their crops. Carrots and soya were mentioned to be especially sensitive to water scarcity and therefore require special care in the future.
To support the decision whether to irrigate or not, farmers listed various factors: (i) they would like to know the actual status of the crops on the field without visiting every single plot, (ii) be able to compare their own experiences with farmers who are irrigating less, (iii) to know the water need of the plant in different phases of growing season, or (iv) to have access to more exact weather forecasts.
Improved irrigation management also has substantial economic impacts. The running costs for irrigation vary between around 0.1–0.2 € per cubic meter for irrigation systems powered by electricity to around 0.3–0.5 € per cubic meter for diesel systems. The amount of water irrigated therefore has a direct economic impact on savings. If water is reallocated between the plots, indirect benefits through higher yields can also be expected.
The willingness to pay for the provided service was used as a measure of the value of the system. The majority (54%) of the farmers indicated a general willingness to pay, either directly or via cost sharing funding options; 32% did not answer and 14% expressed no willingness to pay. One quarter of the farmers indicated a willingness to pay 3 € per ha. A small percentage would be willing to pay more (5 €/ha) for higher spatial resolution images and others would be willing to pay only if costs are shared with complementary services (e.g., fertilizer and pesticide consultancy services).
Costs
The costs of the service include the initial set-up of the webGIS and farmer's database and the cost for satellite data acquisition, processing and delivery of final maps. These costs can be grouped in two categories: variable costs (that vary with the number of hectares and users served) include the initial farmer's database implementation and a dedicated customer service. Fixed costs, for a given service coverage/area, are the main component of the operative costs and include the satellite data acquisition and processing.
To calculate operative cost items we consider three categories: (1) personnel, (2) satellite data, and (3) other costs. Personnel-effort account for the entire satellite processing chain that includes: EO data procurement, atmospheric correction and generation of products, quality control and calibration/validation activities, agro-meteorological data elaboration, and maintenance of geo-infrastructures. The personnel-effort is a fixed cost given a certain region of interest, duration of the operation and number of images to process. Other costs include field travel, software licenses, and satellite data.
Satellite data cost depends on the type of data, minimum order size and required spatial resolution. Depending on field size different spatial resolutions are required (i.e., for smaller field size higher spatial resolution is needed). We use four satellite data cost scenarios. Table 2 provides an overview of current commercial satellites (and data costs) that would be able to provide data for the service in our region of interest. Considering the minimum order size and length of the irrigation season (10 images), the cost of the satellite data per irrigation/growing season would range between 15,000 € (DEIMOS-1) and 35,000 € with RapidEye. With the availability of free satellite data from current Landsat-8 (30 m pixel size) and upcoming Sentinel-2 missions (10–20 m pixel size), we foresee minimum need for commercial data, therefore the cost will be notably reduced.
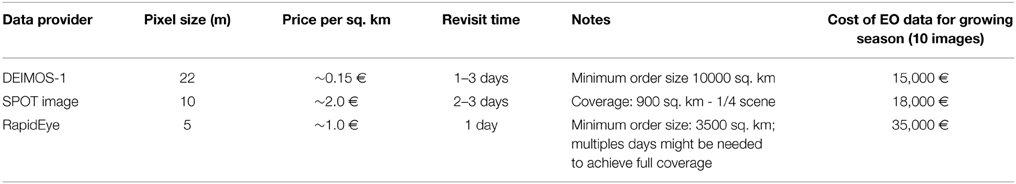
Table 2. Summary of relevant satellite data provides and cost of data.
Using commercial satellite data at 10–30 m pixels size, the service cost ranges between 65,000 and 68,000 € per growing season. The cost of the satellite data would comprise about 25% of the total cost of the service. If very high spatial resolution data (e.g., 5 m pixel size) are needed (e.g., to cover higher level of field fragmentation—smaller parcels), the cost of the satellite data would reach around the 40% of the total cost. With the availability of free satellite data from the upcoming Sentinel-2 mission (at 10–30 m spatial resolution), we foresee an average service cost of about 50,000 € per growing season. This cost will be further reduced with the automation of various processing steps as for instance atmospheric correction (Vuolo et al., 2015b).
Using the four data cost scenarios and the extent of the region of interest (Marchfeld), we calculated the total cost of the service for an entire growing season. A summary graph is provided in Figure 7. Taking into account only the 20,000 ha that are regularly irrigated in the region of Marchfeld (Neugebauer and Vuolo, 2014) and depending on the type of satellite data used, the service would have an estimated cost ranging between 2.5 and 4.3 €/ha per year. Instead, considering the total area of the Marchfeld region (40,000 ha) and the use of free data (possible with Landsat-8 and Sentinel-2 in operation), the service would have a cost of approximately 1.3 €/ha per year. In the first case, the cost of the service would be equal or below the willingness to pay expressed by most of the users (3 to 5 €/ha per year). In the second case, the cost of the service would be substantially below the willingness to pay, which allows for revenue generation.
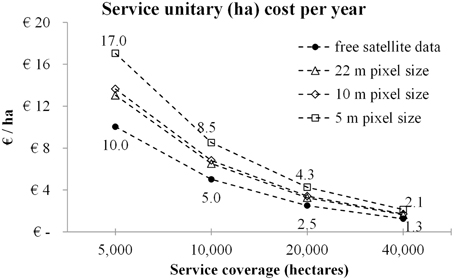
Figure 7. Service cost per hectare (ha) and per growing season.
In comparison: irrigation costs range between 400 and 1000 €/ha per year for a typical irrigation volume of 2000 cubic meters per ha. With a correct irrigation application, more than 10% of the water and energy could be saved in water-intensive crops, which is equivalent to an economic benefit of 40–100 €/ha per year.
It is worth noting that the benefit analysis only includes the farmer's perspective and does not consider the benefit derived from more efficient use of environment and water resources. We did not consider the social and environmental benefits because they can vary widely and their quantification is beyond the scope and resources available within this work. Therefore, we expect even a larger net economic benefit for society than the one estimated here. Social and environmental costs express the value of water allocation to alternative users (e.g., opportunity costs associated with urban and industrial water use) and the impact on water resources, pollution, soil degradation, and landscape modifications due to intense irrigated agriculture, while our financial analysis is based only on the on-farm costs that farmers generally pay for water as well as for any other production costs, such as seed, machinery, labor, and maintenance. The literature indicates that these two categories of costs (social and environmental) are far from being negligible.
Conclusions
The adoption of better irrigation practices requires information technologies and tools that can be easily embedded into existing systems and that can fully respond to the user needs. Research and demonstration activities (this project and other case studies such as DEMETER, PLEIADeS, and SIRIUS-GMES EU projects), show that satellite-based irrigation advisory services can be successfully implemented in different environments and, once in place, can contribute to assessments of crop water requirements in a spatially, timely, and cost-efficient way. Current information technologies (webGIS and smartphones) support the delivery of irrigation advice to farmers in a user-friendly environment and in a timely manner. The combination of satellite-based mapping tools and webGIS/smartphone devices provides the basis for better and more informed decision over a variety of spatial and temporal scales. The final decision is then taken knowing local system components and management constraints. This implies a strong commitment by users and is contingent on the assumption that irrigation will be managed to achieve a specific target, for example maximum water use efficiency, yield, or profitability. This assumption seems valid in many intensive irrigated areas since farmers are interested in reducing operating constraints and costs, maximize or stabilize yield and, at the same time, maintain sustainability and environmental efficiency.
Our work contributed to evaluate the implementation and functioning process of a satellite-based irrigation advisory service in a very different environment compared to precursors systems running already in Mediterranean countries (e.g., Irrimet6), in Australia (e.g., Irrieye7) or in California (TOPS8). We calibrated and validated the models to derive crop biophysical variables using ground measurements (Vuolo et al., 2013), performed the demonstration and evaluation with a group of farmers and completed the adaptation of mapping and data dissemination technologies; finally, we assessed the benefits and costs of the service. An estimation of the net economic benefit was also obtained and presented in this study. Results confirm that the adoption of new space-based solutions for crop and irrigation water management is a complex process and favorable conditions depend on several aspects; creating the connection with the users and embedding new solutions into standard practices remains the most critical issue. Therefore, our approach has been based on establishing a local network and on intensive work with the users since the very beginning. This way of implementing has contributed to create distinctive results and has contributed to stimulate and build local capacities and, potentially, to create job opportunities in the future.
Feedback from final users is essential to improve the effectiveness of the service in terms of water use optimization, especially during the early stage of service implementation. In our opinion, a continuous effort will still be necessary to transfer, tune, and demonstrate these technologies in different environments and to adapt them to new challenges with the participation of the final users. Only with this approach we expect satellite technologies to become an integral part of existing management systems and bring real benefits.
Outlook
Different irrigation management strategies are possible. For example, one may use satellite-based technologies for management of water-intensive crops. In that case, irrigation is optimized so that the crops produce at their maximum potential. A different irrigation strategy is to seek a compromise between cost of irrigation and loss of production. In this case, farmers irrigate their crops at the limit of the water stress conditions, to reduce costs and limit yield lost (Fereres and Soriano, 2007). This irrigation technique is adopted to optimize economic and technical resources, which are often limited.
In the Marchfeld, the latter irrigation approach is more prevalent. For instance, winter cereals or maize are irrigated only in dry years to avoid excessive yield losses. In these situations, crops grow under limited water availability, and irrigation water is applied only to supplement scarce rainfall. The decision whether to irrigate or not, when and how much, is a critical issue for farmers and it is often based only on personal experience. Monitoring the daily soil water balance is the first steps toward the implementation of these irrigation strategies. The approach necessitates the development of operative frameworks to run a soil water balance model at parcel level and to collect in near-real-time information on irrigation volumes applied by farmers. These technical requirements reflect and complement the requests of the users to adapt the existing webGIS system to (i) manually enter and store in the database the amounts of rainfall and irrigation volumes and use the system as a logbook for their management activities; (ii) access the information via smartphones to save time and have full mobility and (iii) receive alerts via SMS if particular stress conditions are met. To respond to this request, we developed an application for smartphones based on Sencha Touch9, a software development framework for mobile applications that can be deployed on iOS, Android, BlackBerry, Windows Phone systems. The application shares the same mapping and database infrastructure of the desktop version of the existing webGIS and therefore maintenance and operational efforts are minimized. It consists of (i) a main panel for map and data visualization (Figure 8) with the information (crop ET, rainfall and irrigation) aggregated to daily, 7-day and from the start of irrigation; ii) a data input panel (Figure 9), where users can log parcel-specific management activities such as irrigation volumes and crop type; and (iii) 7-day weather forecast, currently based on OpenWeatherMap10 services. The new system also includes a calculation module to assimilate ET raster maps in a simple soil water balance model (FAO-56), which activates if the farmer inserts the minimum set of inputs (irrigations and crop type) for the parcel under monitoring. The application will be deployed during the growing season 2015 for a first evaluation with users.
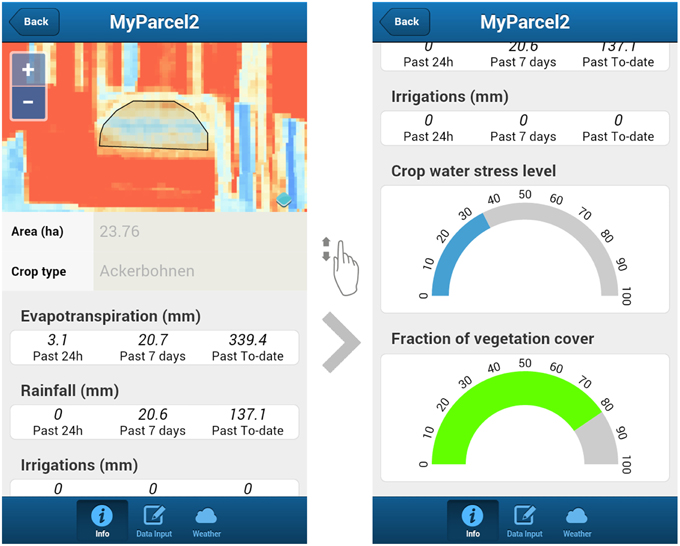
Figure 8. Mobile app: map and data visualization panel. The farmer can connect using user name and password to the list of subscribed parcels and display the latest crop coefficient map (red tones: low values), along with irrigation management parameters (evapotranspiration, rainfall, provided irrigations). The graphs show the crop water stress level based on the FAO-56 soil water balance model (which is activated only if irrigation inputs are provided) and the fraction of vegetation cover for the parcel.
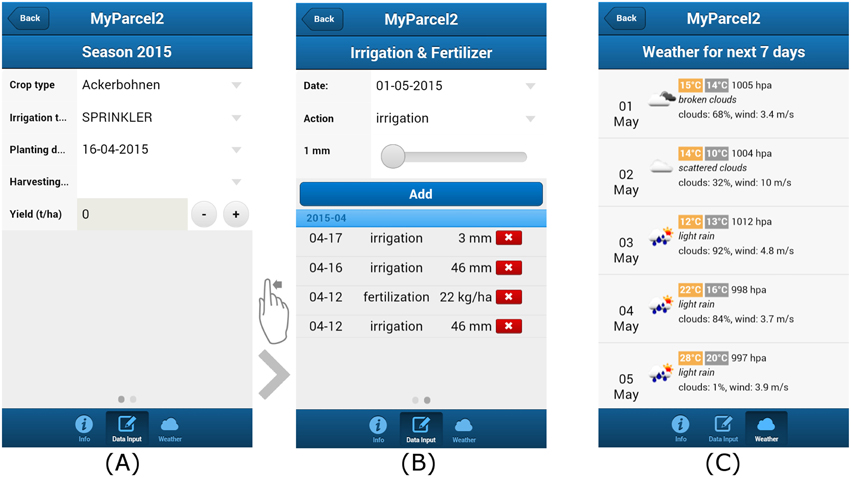
Figure 9. Data input panels (A,B) and weather data (C). Using panel (A) farmers can change the crop and irrigation type, dates of planting and harvest, crop yield. In (B) farmers can log their irrigation (used for the soil water balance) and fertilizer applications; this also helps to keep the history of the parcel and management. In (C) 7-day weather forecast are displayed; we use data obtained from Open Weather Map community but any type of local weather data can be used.
Conflict of Interest Statement
The authors declare that the research was conducted in the absence of any commercial or financial relationships that could be construed as a potential conflict of interest.
Acknowledgments
This research was carried our within the “Earth Observation for water management project” (EO4Water) funded under Die Österreichische Forschungsförderungsgesellschaft (FFG) and the Austrian Space Applications Programme (ASAP). We thank Nikolaus Neugebauer from BOKU for help in processing the Earth observation and agrometeorological data. We thank Prof. Guido D'Urso from the University of Naples Federico II for fruitful discussion and feedback on the application of the remote sensing methodologies. We also acknowledge feedback from colleagues involved in the operational development of satellite-based services: C. De Michele, L. Marotta, S. Falanga Bolognesi and M. Colandrea from Ariespace. The smartphone application was developed by Mateusz Żółtak. The framework for the cost analysis was initially developed in the context of the SIRIUS-GMES project and reviewed by Anna Osann from University Castilla La Mancha, Andrew Groom from Geo-Intelligence Airbus Defence and Space and C. De Michele from Ariespace.
Footnotes
4 ^www.marchfeldkanal.at/home.htm
8 ^ecocast.arc.nasa.gov/dgw/sims/
References
Allen, R. G., Pereira, L., Raes, D., and Smith, M. (1998). Crop Evapotranspiration-Guidelines for Computing Crop Water Requirements-FAO Irrigation and Drainage Paper 56. FAO, Rome. Available online at: http://www.engr.scu.edu/~emaurer/classes/ceng140_watres/handouts/FAO_56_Evapotranspiration.pdf (Accessed October 4, 2013).
Baptista, A. (2006). “Transferability Of DEMETER. A case study of The Irrigation Scheme of Veiga De Chaves,” in AIP Conference Proceedings (Naples), 84–92. doi: 10.1063/1.2349331
Bausch, W. C. (1995). Remote sensing of crop coefficients for improving the irrigation scheduling of corn. Agric. Water Manag. 27, 55–68. doi: 10.1016/0378-3774(95)01125-3
Cepuder, P. (2004). “Soil water content monitoring for irrigation,” in Forstliche Schriftenreihe, Universität für Bodenkultur Wien, Vol. 18., eds R. Jandl, H. Hager, W. Loiskandl, M. Gerzabek, H. Mauser, O. Moog, and H. Richter (Wien: Österr Gesellschaft für Waldökosystemforschung und experimentelle Baumforschung), 46–52.
Cepuder, P., and Nolz, R. (2007). Irrigation management by means of soil moisture sensor technologies. J. Water L. Dev. 11, 79–90. doi: 10.2478/v10025-000-0007-0
Choudhury, B. J., Ahmed, N. U., Idso, S. B., Reginato, R. J., and Daughtry, C. S. (1994). Relations between evaporation coefficients and vegetation indices studied by model simulations. Remote Sens. Environ. 50, 1–17. doi: 10.1016/0034-4257(94)90090-6
Courault, D., Seguin, B., and Olioso, A. (2005). Review on estimation of evapotranspiration from remote sensing data: from empirical to numerical modeling approaches. Irrigation Drain. Syst. 19, 223–249. doi: 10.1007/s10795-005-5186-0
Drusch, M., Del Bello, U., Carlier, S., Colin, O., Fernandez, V., Gascon, F., et al. (2012). Sentinel-2: ESA's optical high-resolution mission for GMES operational services. Remote Sens. Environ. 120, 25–36. doi: 10.1016/j.rse.2011.11.026
D'Urso, G. (2001). Simulation and Management of On-demand Irrigation Systems: A Combined Agrohydrological and Remote Sensing Approach. Wageningen: Wageningen University Press.
D'Urso, G., and Belmonte, A. C. (2006). “Operative approaches to determine crop water requirements from earth observation data: methodologies and applications,” in AIP Conference Proceedings (Naples), 14–25.
D'Urso, G., and Menenti, M. (1995). “Mapping crop coefficients in irrigated areas from Landsat TM images,” in Proc. SPIE 2585, Remote Sensing for Agriculture, Forestry, and Natural Resources, eds E. T. Engman, G. Guyot, and C. M. Marino (Paris: International Society for Optics and Photonics), 41–47.
D'Urso, G., Richter, K., Calera, A., Osann, M. A., Escadafal, R., Garatuza-Pajan, J., et al. (2010). Earth Observation products for operational irrigation management in the context of the PLEIADeS project. Agric. Water Manag. 98, 271–282. doi: 10.1016/j.agwat.2010.08.020
Eitzinger, J., Kersebaum, K. C., and Formayer, H. (2009). Landwirtschaft im Klimawandel: Auswirkungen und Anpassungsstrategien für die Land- und Forstwirtschaftlichen Betriebe in Mitteleuropa. (Agrimedia).
Fereres, E., and Soriano, M. A. (2007). Deficit irrigation for reducing agricultural water use. J. Exp. Bot. 58, 147–159. doi: 10.1093/jxb/erl165
Martimort, P., Berger, M., Carnicero, B., Bello, U. E., Arino, O., Biasutti, R., et al. (2007). Sentinel-2, the optical high-resolution mission for GMES operational services. Esa Bull. 131, 19–23. doi: 10.1109/igarss.2007.4423394
McMahon, T. A., Peel, M. C., Lowe, L., Srikanthan, R., and McVicar, T. R. (2013). Estimating actual, potential, reference crop and pan evaporation using standard meteorological data: a pragmatic synthesis. Hydrol. Earth Syst. Sci. 17, 1331–1363. doi: 10.5194/hess-17-1331-2013
De Michele, C., Vuolo, F., D'Urso, G., Marotta, L., and Richter, K. (2009). “The irrigation advisory program of campania region: from research to operational support for the water directive in Agriculture,” in 33rd International Symposium on Remote Sensing of Environment (ISRSE) Proceedings, May 4-8, 2009 (Stresa).
Neugebauer, N., and Vuolo, F. (2014). Crop water requirements on regional level using remote sensing data – a case study in the marchfeld region berechnung des pflanzenwasserbedarfs für sommerfeldfrüchte mittels fernerkundungsdaten. Eine Fallstud. Marchfeld Region Photogramm. FernerkundungGeoinf. 2014, 369–381. doi: 10.1127/1432-8364/2014/0230
OECD (2012). OECD Environmental Outlook to 2050: The Consequences of Inaction. Paris: OECD Publishing. doi: 10.1787/9789264122246-en
Osann Jochum, M. A. (2006). “Operational space-assisted irrigation advisory services: overview of and lessons learned from the project DEMETER,” in AIP Conference Proceedings (Naples), 3–13. doi: 10.1063/1.2349322
Richey, A. S., Thomas, B. F., Lo, M.-H., Famiglietti, J. S., Swenson, S., and Rodell, M. (2015a). Uncertainty in global groundwater storage estimates in a total groundwater stress framework. Water Resour. Res. doi: 10.1002/2015WR017351. Available online at: http://onlinelibrary.wiley.com/doi/10.1002/2015WR017351/pdf
Richey, A. S., Thomas, B. F., Lo, M.-H., Reager, J. T., Famiglietti, J. S., Voss, K., et al. (2015b). Quantifying renewable groundwater stress with GRACE. Water Resour. Res. doi: 10.1002/2015WR017349. Available online at: http://onlinelibrary.wiley.com/doi/10.1002/2015WR017349/pdf
Rischbeck, P. (2007). Der Einfluss von Klimaänderung, Bodenbearbeitung und Saattermin auf den Wasserhaus halt und das Ertragspotential von Getreide im Marchfeld. Available online at: https://zidapps.boku.ac.at/abstracts/download.php?dataset_id=6338&property_id=107&role_id=NONE
Rubio, E. (2006). “Golden day comparison of methods to retrieve ET (Kc-NDVI, Kc-analytical, MSSEBS, METRIC),” in AIP Conference Proceedings (Naples), 193–200. doi: 10.1063/1.2349344
Task Committee on Standardization of Reference Evapotranspiration. (2005). “ASCE Standardized Reference Evapotranspiration Equation,” in ASCE-EWRI Task Committee Report, eds R. G. Allen, I. A. Walter, R. L. Elliott, T. A. Howell, D. Itenfisu, M. E. Jensen, and R. L. Snyder (Kansas city: American Society of Civil Engineers).
Thaler, S., and Eitzinger, J. (2008). “Climate change impacts on selected crops in Marchfeld, Eastern Austria,” 28th Conference …, 3–7. Available online at: https://ams.confex.com/ams/28Hurricanes/techprogram/paper_138941.htm (Accessed October 13, 2013).
Verstraeten, W. W. W., Veroustraete, F., and Feyen, J. (2008). Assessment of evapotranspiration and soil moisture content across different scales of observation. Sensors 8, 70–117. doi: 10.3390/s8010070
Vuolo, F., D'Urso, G., De Michele, C., Bianchi, B., and Cutting, M. (2015a). Satellite-based irrigation advisory services: a common tool for different experiences from Europe to Australia. Agric. Water Manag. 147, 82–95. doi: 10.1016/j.agwat.2014.08.004
Vuolo, F., Mattiuzzi, M., and Atzberger, C. (2015b). Comparison of the landsat surface reflectance Climate Data Record (CDR) and manually atmospherically corrected data in a semi-arid European study area. Int. J. Appl. Earth Obs. Geoinf. 42, 1–10. doi: 10.1016/j.jag.2015.05.003
Vuolo, F., De Michele, C., and Lazzaro, U. (2006). “Success stories: analysis and evaluation of the italian case-study of DEMETER in the Destra Sele Plain,” in AIP Conference Proceedings (Naples), 33–42. doi: 10.1063/1.2349325
Vuolo, F., Neugebauer, N., Bolognesi, S., Atzberger, C., and D'Urso, G. (2013). Estimation of leaf area index using DEIMOS-1 data: application and transferability of a semi-empirical relationship between two agricultural areas. Remote Sens. 5, 1274–1291. doi: 10.3390/rs5031274
WEF (2013). Putting the New Vision for Agriculture into Action: A Transformation is Happening. Available online at: http://www.weforum.org/projects/new-vision-agriculture.
Wichelns, D., and Oster, J. D. (2006). Sustainable irrigation is necessary and achievable, but direct costs and environmental impacts can be substantial. Agric. Water Manag. 86, 114–127. doi: 10.1016/j.agwat.2006.07.014
WWAP (United Nations World Water Assessment Programme) (2015). The United Nations World Water Development Report 2015: Water for a Sustainable World. Paris: UNESCO. Available online at: http://unesdoc.unesco.org/images/0023/002318/231823E.pdf.
Keywords: earth observation, evapotranspiration, webGIS, mobile application, irrigation advisory service, cost-benefit
Citation: Vuolo F, Essl L and Atzberger C (2015) Costs and benefits of satellite-based tools for irrigation management. Front. Environ. Sci. 3:52. doi: 10.3389/fenvs.2015.00052
Received: 05 May 2015; Accepted: 08 July 2015;
Published: 29 July 2015.
Edited by:
Xuan Zhu, Monash University, AustraliaReviewed by:
Shuisen Chen, Guangzhou Institute of Geography, ChinaLola Suarez, RMIT University, Australia
Copyright © 2015 Vuolo, Essl and Atzberger. This is an open-access article distributed under the terms of the Creative Commons Attribution License (CC BY). The use, distribution or reproduction in other forums is permitted, provided the original author(s) or licensor are credited and that the original publication in this journal is cited, in accordance with accepted academic practice. No use, distribution or reproduction is permitted which does not comply with these terms.
*Correspondence: Francesco Vuolo, Institute of Surveying, Remote Sensing and Land Information, University of Natural Resources and Life Sciences, Peter Jordan Straße 82, Vienna, 1190, Austria, francesco.vuolo@boku.ac.at