Influence of Gypsum Amendment on Methane Emission from Paddy Soil Affected by Saline Irrigation Water
 Ei E. Theint
 Sonoko D. Bellingrath-Kimura
 Aung Z. Oo
 Takashi Motobayashi4
- 1Land Use Division, Department of Agriculture, Ministry of Agriculture and Irrigation, Nay Pyi Taw, Myanmar
- 2Leibniz Center for Agricultural Landscape Research, Institute of Land Use Systems, Muencheberg, Germany
- 3Department of Biological Production Science, Graduate School of Agriculture, Tokyo University of Agriculture and Technology, Fuchuu, Japan
- 4Field Science Centre for Education and Research, Tokyo University of Agriculture and Technology, Fuchu, Japan
To investigate the influence of gypsum application on methane (CH4) emission from paddy rice soil affected by saline irrigation water, two pot experiments with the rice cultivation were conducted. In pot experiment (I), salinity levels 30 mMNaCl (S30) and 90 mMNaCl (S90), that showed maximum and minimum CH4 production in an incubation experiment, respectively, were selected and studied without and with application of 1 Mg gypsum ha−1(G1). In pot Experiment (II), CH4 emission was investigated under different rates of gypsum application: 1 (G1), 2.5 (G2.5), and 5 (G5) Mg gypsum ha−1 under a non-saline and saline condition of 25 mMNaCl (S25). In Experiment (I), the smallest CH4 emission was observed in S90. Methane emission in S30 was not significantly different with the non-saline control. The addition of gypsum showed significant lower CH4 emission in saline and non-saline treatments compared with non-saline control. In Experiment (II), the CH4 emissions in the saline treatments were not significantly different to the non-saline treatments except S25-G5. However, our work has shown that gypsum can lower CH4 emissions under saline and non-saline conditions. Thus, gypsum can be used as a CH4 mitigation option in non-saline as well as in saline conditions.
Introduction
The hydroponic nature of rice enables it to grow in coastal areas of humid tropical regions. However, salinity problems are a major limiting factor for rice production in those areas due to periodic sea water intrusion during the rainy season and irrigation water salinity during the dry season. Out of the 130 million hectares used for rice production, about 30% contains levels of salts that are too high for normal rice yields (Mishra, 2004). To improve the crop productivity in saline environment, there are two major approaches: selecting cultivars that are tolerant to saline environment and modifying the growing environment that is suitable for the normal growth of plant. The first approach: growing salt tolerant cultivars, which was suggested as a cost effective way to overcome the salinity problems (Hu et al., 2012). However, salinity resistance in rice has been a concern of plant breeding for a long time and the progress in breeding for salt tolerance and its related abiotic stress have been slow (Reddy et al., 2014). This is partly due to the complexity of the phenomenon and the susceptibility of rice to changes in salinity during the plant's various developmental stages. The second approach: the addition of organic and inorganic amendments containing calcium ion (Ca2+) to irrigation water or soil (Dobermann and Fairhurst, 2000) to reduce the effect of salinity on growth and yield as Ca2+ has been reported to restrict the entry of Na+ into the plant cells (Kader and Lindberg, 2008; Hussain et al., 2010). The earlier study of Grieve and Fujiyama (1987) reported that the maximum growth of salinized rice plant can be achieved under the addition of Ca2+ concentration about 4 mM and at Na+/Ca2+ratio of around 18. Wu and Wang (2012) have also proven that at low salinity (25 mMNaCl), the addition of Ca2+ (10 mMCaCl) significantly enhanced the selectivity for K+ over Na+ in rice. This supplemental Ca2+ can be provided directly by applying calcium chloride, gypsum or phosphogypsum (Ghafoor et al., 2004). Furthermore, Mathad and Hiremath (2010) stated that the application of gypsum (CaSO4.2H2O) as a source of Ca2+ is a well-known practice for the amelioration and management of sodium (Na+)-saturated waters/soils. However, these findings were based on a short growing period in hydroponic conditions and the effects of the soil medium were not investigated. Therefore, it is necessary to study the influence of Ca2+ amendment on rice growth under different soil conditions for the whole crop season.
Calcium amendment influences not only the rice plant, but also affects the whole soil system. Paddy rice fields are known to be the main anthropogenic source of CH4 gas emission (Liu et al., 2012). More than 50% of global CH4 emission is related to human activities (US EPA, 2006), among which paddy rice fields account for 10–25% (Sakai et al., 2007). There are several factors that can mitigate CH4 emission in paddy fields. Many authors have reported factors that influence CH4 emission such as soil type, climatic conditions, agronomic practices including water and fertilizer management, organic matter amendment, and application of pesticides, etc. (Liesack et al., 2000; Aulakh et al., 2001; Yan et al., 2005; Zou et al., 2005; Xiong et al., 2007). However, few studies have investigated the effects of salinity on CH4 emission. Datta et al. (2013) observed that CH4 flux from the saline paddy field is significantly lower than that of irrigated inland non-saline paddy field. However, in another saline rice field study comprising an outside saline patch and an inside saline patch, the average CH4 emissions in no organic matter added treatments did not differ significantly between outside and inside patches (Supparattanapan et al., 2009). In this experiment, the inside saline patch and outside saline patch were defined based on the previous soil data of Grünberger et al. (2005). Grünberger et al. (2005) mentioned that for the inside saline patch, the electrical conductivity of soil solution is 10 dSm−1, which is sufficient to decrease rice yield, whereas for the outside saline patch, the soil solution's electrical conductivity was suitable for rice production. Thus, current CH4 emissions from saline paddy fields are not clearly evaluated, and may even change with the use of Ca2+ amelioration. It is therefore important to evaluate CH4 emissions under saline conditions and in relation to amelioration practice.
The objectives of this study were therefore to evaluate the influence of irrigation water salinity levels on CH4 emission from paddy rice soil, and the effect of gypsum amendment on CH4 emission in relation to plant growth. For these purposes, one incubation experiment and two pot experiments were conducted. In the incubation experiment, the influence of saline water on CH4 production potential was analyzed. In pot Experiment (I), the effect of different irrigation water salinity levels and gypsum amendment on CH4 emission during the rice-growing season was investigated. Gypsum was used as a Ca2+ source under different saline levels. In pot Experiment (II), the effect of different rates of gypsum application on CH4 emission during the rice-growing season was investigated.
Materials and Methods
Laboratory Incubation Experiment
A composite soil sample was collected from a depth of 0–15 cm at FM Fuchu Honmachi, Field Science Center of the Tokyo University of Agriculture and Technology. The soil was kept in a refrigerator for 1 week until the incubation experiment. The background salinity level of soil (EC 1:1) was 0.23 dSm−1. The CH4 production potential of this soil was studied at 5 salinity levels: control, 10 (S10), 30 (S30), 60 (S60), and 90 (S90) mMNaCl. The objective of this study was to evaluate the CH4 production potential of soil by the addition of different concentrations of NaCl solution. Twenty grams of wet soil were put into 100-ml conical flasks and then flooded with 20 ml of tap water for the control or with different levels of saline water for the salinity treatments. The conical flasks were fitted with rubber stoppers possessing two tubes to facilitate flushing with nitrogen gas (N2) and the collection of gas samples. These flasks were kept in an incubator at 30°C for 21 days. There were four replications for each salinity level. Three replications were used to collect the CH4 gas samples and another one replication was used to monitor the changes of soil pH under each salinity level during the incubation period by using Beckman, Φ 260 pH/Temp/mV meter. To check the redox potential value (Eh) of incubated soil whether it could support for anaerobic condition or not, one control sample was prepared and platinum Eh probe was permanently inserted into that soil. The value of Eh was recorded by using SWC-201RP, Sanyo water checker on each sampling day. Gas samples were collected on 2, 4, 7, 14, and 21 days after incubation. The flushing with N2 gas was carried out 1 day before and immediately after the sampling at 250 ml min−1 for 3 min. The conical flasks were shaken just before sampling to release the CH4 entrapped within the soil.
Pot Experiments
Experimental Site
Pot Experiments (I) and (II) were conducted in the open field of FM Fuchu Honmachi, Field Science Center of the Tokyo University of Agriculture and Technology, Fuchu, Tokyo, Japan.
Preparation of Soil and Cultivation of Rice
The soils used in pot experiment (I) and (II) were also collected from paddy fields in FM Fuchu Honmachi, Field Science Center of the Tokyo University of Agriculture and Technology. Soil pH (in H2O and 1M KCl) was measured in a 1:2.5 soil: water/1M KCl by using Benchtop pH/Water Quality Analyzer LAQUA F-74BW.For the purpose of soil characterization, the removal of soil organic matter by H2O2 and carbonates by HCl was carried out. The soil texture analysis (fraction of sand, silt and clay) was carried out by Pipette method. The cation exchange capacity of soil was determined by the Scholenberger method. The detailed physico-chemical properties of each soil are shown in Table 1 (Tanaka et al., 2008).
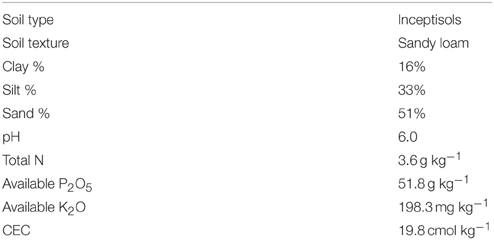
Table 1. Soil properties of Fuchu Honmachi field (Tanaka et al., 2008).
Indica type rice (Oryza sativa L.) variety, Dorfak cultivar originating from Iran, was used in this study for both experiments.
About 8 kg of soil was placed in to the Wagner pots with the area of 0.05 m2 and height of 27 cm. About 1 week before transplanting, puddling was conducted by irrigating the pots twice on alternate days with specific salinity levels of NaCl solutions or tap water (control). The chemical fertilizers of 40 kg P ha−1 and 70 kg K ha−1 were applied 1 day before transplanting. About 70 kg N ha−1 was applied in three equal splits at basal (1 day before transplanting), active tillering stage (2 weeks after transplanting) and panicle initiation stage (4 weeks after transplanting). Urea, ammonium phosphate and potassium chloride were used as a source of N, P, and K, respectively.
In pot Experiment (I), two salinity levels i.e., 30 mMNaCl (S30), and 90 mMNaCl (S90) were tested. The treatments comprised of (1) control (tap water), (2) 30 mMNaCl (S30), (3) 90 mMNaCl (S90), (4) gypsum 1 Mg ha−1 (G1), (5) 30 mMNaCl plus gypsum 1 Mg ha−1(S30-G1), and (6) 90 mMNaCl plus gypsum 1 Mg ha−1(S90-G1). All treatments were laid out in a completely randomized design with three replications. Twenty-one-day-old seedlings were transplanted with three seedlings per pot on 23rd June, 2010 and harvested on 30th September, 2010. A water level of about 2–3 cm was maintained in the pots throughout the growing season by irrigating regularly with the assigned NaCl concentration until crop maturity. The purposes of this experiment were to examine the effects of the saline levels (S30 and S90) on CH4 emissions in relation to rice growth and to evaluate the effects of applying gypsum amendment that is commonly used into saline soil, on CH4 emission in Na-salinized paddy soil under rice cultivation.
Based on the results of pot Experiment (I), the effects of gypsum application on CH4 emission were evaluated in pot Experiment (II) with 3 different gypsum application rates in non-saline and saline conditions. Based on the rice growth condition of pot Experiment (I) under continuous irrigation with saline water with the salinity levels of S30 and S90, irrigation water salinity level S25 was tested in pot Experiment (II) with intermittent irrigation. The treatments were assigned according to a randomized complete block design with 3 replications and comprised of (1) control (tap water), (2) 25 mMNaCl (S25), (3) gypsum 1 Mg ha−1 (G1), (4) gypsum 2.5 Mg ha−1 (G2.5), (5) gypsum 5 Mg ha−1 (G5), (6) 25 mMNaCl plus gypsum 1 Mg ha−1 (S25-G1), (7) 25 mMNaCl plus gypsum 2.5 Mg ha−1 (S25-G2.5), and (8) 25 mMNaCl plus gypsum 5 Mg ha−1 (S25-G5). Twenty-one-day-old seedlings were transplanted with two seedlings per pot on 21st June, 2011 and harvested on 23rd September, 2011. A water level of about 2–3 cm was maintained in pots at each irrigation time. Irrigation was performed when the soil water reached the saturation level (i.e., no standing water) as intermittent irrigation.
Measured Parameters and Analytical Methods
Data regarding agronomic characters such as plant height, tiller numbers, number of dead leaves, and soil environment were collected at weekly intervals. The pH and EC of the flooded water were directly measured by portable meters (Beckman, Φ 260 pH/Temp/mV meter, and ES-51 COND METER, Horiba, Japan, respectively). The Eh value of soil was monitored by inserting platinum electrodes permanently into the soil during the rice-growing season at a depth of 5 cm in each plot using Eh probes (SWC-201RP, Sanyo, Japan). Soil temperature was also measured at 5 cm depth by inserting OPTEX Thermometer TBW-3 at each sampling time. Flowers and Flowers (2005) pointed out that the salinity affects plants by lowering water potentials and interfering the uptake of essential nutrients including nitrogen (N). Furthermore, as there is an interactive effect between ammonium () and Na+ and/or between Cl− and nitrate (), surface water samples were also collected at weekly intervals for the analysis of and ions concentrations (Hu and Schmidhalter, 2005). Both and concentrations were determined by using a UV spectrophotometer (UV–VI Mini 1240, Shimadzu Corporation, Kyoto, Japan). Before analysis of these ions, water samples were filtered with 0.45 μm filter papers. For analysis, 5 ml of water samples, 2 ml of solution A and 3 ml of solution B were mixed and allowed to stand for about 45 min. Solution A contained30 g of Na2HPO4.H2O, 39 g of C6H5Na3O7.2H2O, 3 g of EDTA.2Na, 60 g of Phenol, and 0.02 g of Na2Fe(CN)5NO.2H2O, which was prepared to get the final volume of 1 Liter by adding distilled water. Solution B contained 16 g of NaOH and 20 ml of NaClO, which was also prepared to get the final volume of 1 Liter by adding distilled water. After 45 min, was determined at the wavelength of 630 nm. For analysis, no reagent was added to the 5-ml water samples and measurements were made directly at the wavelength of 230 nm. Total organic carbon content flooded water was also checked (2) times at 6 and 10 weeks after transplanting by using Total Organic Carbon analyzer (TOC-VCPH, Shimadzu Corp., Japan) in the Experiment (II).
Gas Sampling, Analysis, and Calculations
Gas sampling was undertaken at 09:00 a.m.–12:00 p.m. using a closed-chamber method (Lu et al., 1999). The chambers used were 100 cm in height, 30 cm in length, 30 cm in width, and were made of acrylic transparent sheets. A plastic tray with a length of 40 cm, width of 40 cm, and height of 5 cm was filled with 3 cm of water and placed under the pot. The chamber was put into the tray by covering the pot, and the tray water sealed the surrounding area of the chamber to form an airtight chamber. A battery-operated fan and Tedlar bag were installed at the chamber to mix the air inside the chamber and regulate the pressure, respectively. The temperature inside the chamber was recorded using a micro-temperature thermometer (PC-9125, AS ONE Co., Tokyo, Japan) fitted with rubber septum inserted into the small hole of the chamber. To assess the linear rate increase of gas concentration emitted from the surface area of soil inside the pot with time, gas samples were drawn from the chambers through a three-way stopcock using a 50-ml airtight syringe at intervals of 15 min (0, 15, and 30 min). The air inside the chamber was thoroughly mixed before collecting gas samples by flushing the syringe three times. Approximately 45 ml of gas samples were then taken with the 50-ml plastic syringe, adjusted to 40 ml and then transferred into a 20-ml pre-vacuumed glass vial. The amount of CH4 flux was calculated using the following equation
Where Q: flux of the CH4 gas (mg m−2 min−1)
V: volume of gas chamber
A: gas emitted surface area (m2)
Δc: increased or decreased change of the gas concentration (mg m−3)
Δt: unit of time intervals (min)
M: molar weight of the gas,
K: Kelvin temperature of air inside the chamber.
To get the cumulative CH4 flux over a growing season, the average CH4 flux values between the sampling dates were calculated at first. After that, each average CH4 flux values were multiplied by the total number of days between the sampling dates. Finally, the cumulative CH4 flux over a growing season was obtained by the summation of all these average CH4 flux values.
All the data were evaluated by an analysis of variance (ANOVA) by using CropStat 7.0 statistical software. Comparison of treatment means was performed using least significant differences (LSD) at p = 0.05. Correlation and regression analysis was performed using Sigma Plot 11.0 statistical software.
Results
Laboratory Incubation Experiment
Effect of Salinity Levels on CH4 Production
The addition of NaCl kept the pH lower than that of the non-saline control (Table 2). The Eh values were in the range −320 to −435 mV. The addition of NaCl up to S30 increased CH4 production. The increase of CH4 production in salinity S10 and S30 was 1.2 and 2 times higher than the control, respectively, although they were not significantly different. At higher salinity levels (S60 and S90), CH4 production was 19 to 33% lower than the control.
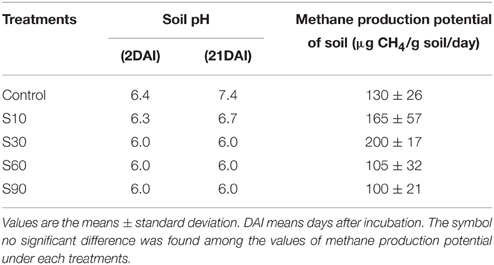
Table 2. Results of laboratory incubation experiment.
Pot Experiments
Soil Environment During the Rice-Growing Season
In the Experiment (I), there were continuous rainy days in the early vegetative stage (until 3 weeks after transplanting) and there was almost no rainfall in 9–11 weeks after transplanting (Figure 1A). In the Experiment (II), the total rainfalls (mm in a week) in the early vegetative stage (until 3 weeks after transplanting) were less than those in late vegetative stage (4–7 weeks after transplanting) and reproductive stage (8–12 weeks after transplanting) (Figure 1F). Soil temperature throughout the growing season ranged from 20 to 35°C in Experiment (I) (Figure 1B) and 27 to 34°C in Experiment (II) (Figure 1G). There was no significant difference in the temperature between the treatments. However, a sudden drop of soil temperature in Experiment (II) at 4 weeks after transplanting was observed following a period of rain on that sampling day. The desired EC level for Experiment (I) was maintained by adding saline water or tap water. However, the desired EC level during the first 3 weeks could not be achieved due to continuous rainy days (Figure 1C). In Experiment (II), intermittent application of saline water resulted in higher EC levels during the latter growth period from 9 weeks after transplanting. The range of flooded water' EC value under saline condition was observed from 1.11 to 2.58 dSm-1 in the vegetative stage of rice growth (until 7 weeks after transplanting) and from 1.13 to 4.8 dSm-1 in the reproductive stage of rice growth. Gypsum application under saline conditions showed higher EC values compared to those of non-saline conditions (Figure 1H). Experiment (I) showed a high fluctuation of pH among treatments until 5 weeks after transplanting (Figure 1D). The pH was then between 6 and 7.4 throughout the subsequent growing period. In Experiment (II), the pH was in the range 6.7–8.4 throughout the growing season (Figure 1I). The ranges of Eh were observed as −281 to −415 mV in Experiment (I) (Figure 1E and −254 to −440 mV in Experiment (II) (Figure 1J).
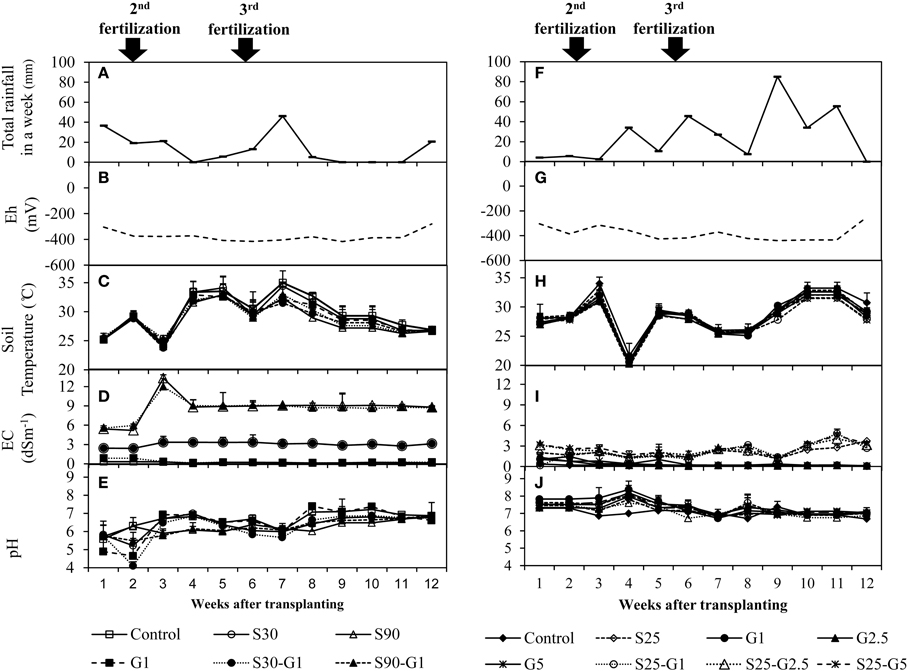
Figure 1. Distribution of rain fall and changes of soil environments under the addition of gypsum and different salinity levels. (A–E) for Experiment (I) and (F–J) for Experiment (II). Error bars indicate standard deviation.
In pot Experiments I and II, the 2 highest peaks of and concentration were observed at and immediately after fertilizer addition. In Experiment (I), the concentration of and ions in flooded water was 0.14 to 12.6 mg L−1 (Figure 2A) and 0.15 to 46.1 mg L−1 (Figure 2B), respectively. The concentration of both N ions was higher in S90 than in others treatments. In Experiment (II), the and concentration in flooded water was 0.02–18.7 mg L−1 (Figure 2C) and 0.02–18.5 mg L−1 (Figure 2D), respectively. The concentrations in the non-saline control and S25 were lower than those in other treatments at the time of the second fertilization. There was no significant difference in concentration during the latter growth period (from 4 weeks after transplanting), except for S25-G5. In the early growth period (until 5 weeks after transplanting), the concentration of was higher in S25 than in other treatments.
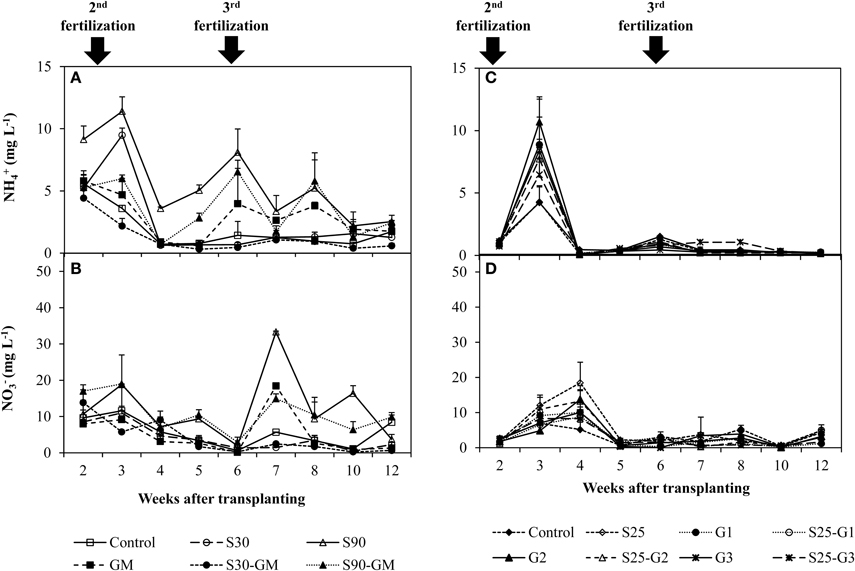
Figure 2. Changes of and concentration under the addition of gypsum and different salinity levels. (A,B) for Experiment (I) and (C,D) for Experiment (II). Error bars indicate standard deviation.
Influence of Salinity and Gypsum Amendment on Rice Growth
In Experiment (I), continuous irrigation with saline water severely suppressed rice growth at both S30 and S90 salinity levels. A significant difference in the level of growth suppression was observed between S30 and S90 immediately after transplanting because rice growth was much more seriously affected by salinity level S90 compared to S30 and the non-saline control in terms of tillering pattern (Figure 3A) and above-ground plant biomass yield (Table 3). Rice plants in S30 survived until the harvesting period, but the above-ground plant biomass yield in S30 was significantly lower and the total number of dead leaves was significantly higher compared to the non-saline control (Table 3). The survival period of rice plants in S90 was until 7 weeks after transplanting (Figure 3A) and the lowest number of dead leaves was observed in S90 (Table 3). The addition of gypsum as a source of Ca2+ under continuously flooded conditions with saline water suppressed the above-ground plant biomass yield significantly when compared with the non-saline conditions with and without the addition of gypsum.
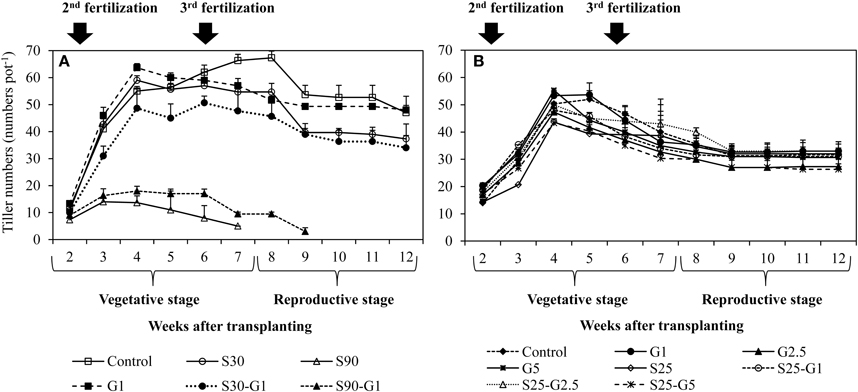
Figure 3. Influence of salinity and gypsum addition upon tillering pattern of rice plants; (A) represents Experiment (I) and (B) represents Experiment (II). Error bars indicate standard deviation.
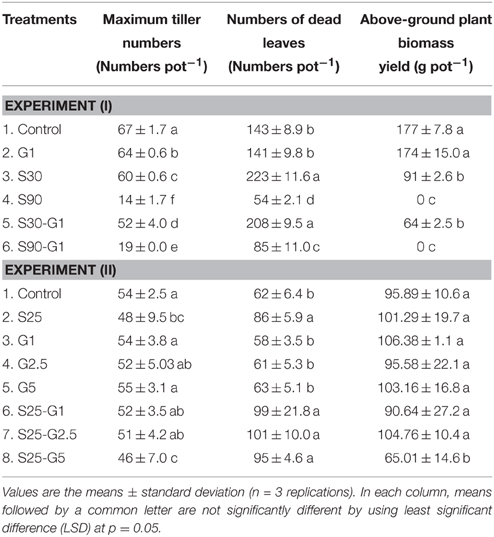
Table 3. Effect of different salinity levels and different rates of gypsum amendment upon rice growth.
In Experiment (II), the above-ground plant biomass yield under intermittent application of saline water with a salinity level of S25 did not differ significantly from that of the non-saline control, except for S25-G5 (Table 3). However, salinity suppressed rice growth in terms of the number of dead leaves (Table 4). The total number of dead leaves was significantly higher in saline conditions compared with non-saline conditions (Table 3). There were no significant differences in above-ground plant biomass yield under different rates of gypsum application such as G1 and G2.5, either in non-saline or saline conditions, except for the addition of gypsum G5 (Table 3).
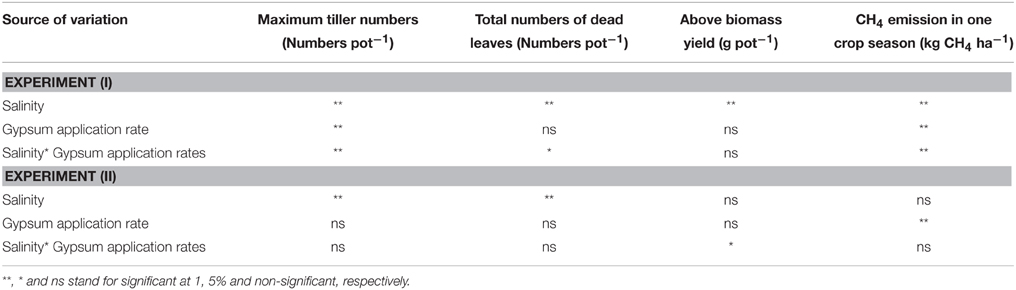
Table 4. Results of ANOVA test for CH4 emission and crop growth.
Influence of Salinity and Gypsum Amendment on CH4 Emission
In Experiment (I), a distinct higher CH4 flux was observed during the reproductive stage of rice growth in both non-saline and saline conditions (Figures 4A,B). Methane emissions gradually increased during the reproductive stage (Figure 4A), while the rate of dead leaves also increased about 63 days after transplanting and the tiller numbers decreased after the maximum tillering period at about 56 days after transplanting. The daily CH4 fluxes under saline conditions were lower than those under non-saline conditions, especially during the vegetative stage of rice growth. Under saline conditions, the maximum emission (296 kg CH4 ha−1) was found in S30 without gypsum amendment. The amount of CH4 emission in S30 without gypsum amendment was 6% lower than that of the non-saline control, although the difference was not significant. The lowest CH4 emission among the treatments was observed in S90 with gypsum amendment (55.5 kg CH4 ha−1) and without gypsum amendment (44.2 kg CH4 ha−1). The addition of gypsum suppressed CH4 emission under saline and non-saline conditions throughout the rice-growing period. The reduced rates due to gypsum addition were about 56% for non-saline conditions and 53–83% for saline conditions (S30-G1, and S90-G1) compared to CH4 emission in the non-saline control (Figure 5A). Although rice plants are known as major CH4 transport conduits, the number of tillers in S30-G1 was significantly lower than that in G1, even though the level of the reduced CH4 emission rate did not differ significantly. However, the total number of dead leaves, which can contribute as a source of organic carbon (C) for methanogens, was higher in S30-G1 than G1 (Table 3).
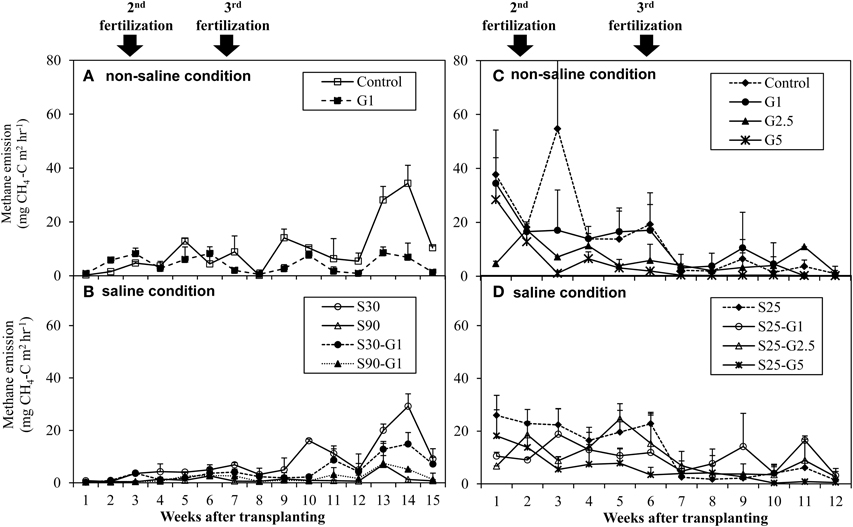
Figure 4. Average CH4 emission rate under non-saline condition and saline condition; (A,B) represents Experiment (I), and (C,D) represents Experiment (II). Error bars indicate standard deviation.
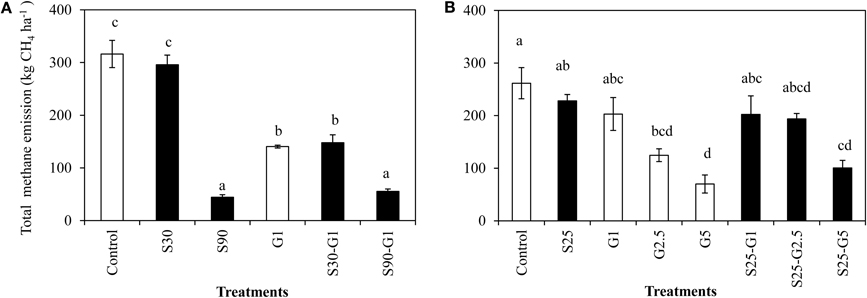
Figure 5. Total CH4 emission under salinity and gypsum application. (A) represents Experiment (I) and (B) represents Experiment(II). Means followed by a common letter are not significantly different by using least significant differences (LSD) at p = 0.05. Error Bars indicate Standard Error.
In Experiment (II), CH4 emission was slightly higher during the vegetative growth stage (Figures 4C,D). Total CH4 emission under intermittent irrigation using saline water with salinity level S25 did not differ significantly from that of the non-saline control (Figure 5B). The addition of gypsum suppressed CH4 emission under non-saline and saline conditions. Under non-saline conditions, CH4 emission in G1 was about 22% lower than that of the non-saline control, although the difference was not significant. Methane emission in G2.5 and G5 was significantly lower than that of the non-saline control. Methane emissions were reduced in G2.5 and G5 compared with the non-saline control by 52 and 73%, respectively. Under saline conditions, reductions of CH4 emission due to the addition of gypsum were 23, 27, and 61% in G1, G2.5, and G5, respectively. The results show that a higher rate of gypsum addition produces a higher reduction of CH4 emission. Although the above-ground plant biomass yield, which is known as a major CH4 transport conduit, did not differ significantly except for S25-G5, the reduction of CH4 emission due to the addition of gypsum was lower under saline conditions than non-saline conditions. Our findings also demonstrated a negative relationship between gypsum application rates and CH4 emission (p < 0.001) based on the result of regression analysis (Figure 6).
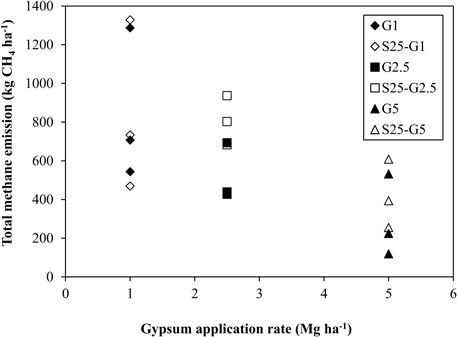
Figure 6. Relationship between total CH4 emission and gypsum application rates. **Stands for significance at p = 0.001.
Discussion
Effect of Salinity on CH4 Emission
The present study showed that a salinity level of 90 mMNaCl (S90) suppressed CH4 emission through a lower CH4 production potential as shown in the laboratory incubation experiment (Table 2), and a lower biomass yield and shorter growth duration period (Experiment I). The addition of saline irrigation water up to salinity levelS30 was more favorable for CH4 production (Table 2). Thus, the lower amount of CH4 emission in S30 compared with the non-saline control under rice cultivation is not due to suppressed CH4 production. There was also no significant difference in total CH4 emissions between S25 and the non-saline control in Experiment (II) (Figure 5B). Ramakrishnan et al. (1998) also observed that the addition of 27 mMNaCl to alluvial soil caused an almost two-fold increase in CH4 production relative to the control, and higher addition of NaCl resulted in an approximate 50% reduction of CH4 production. Jarrell and Kalmokoff (1988) reported that Na+ is required by methanogenic bacteria for amino acid transport, growth, methanogenesis, and internal pH regulation. The higher CH4 production under saline conditions might be due to the Na+ requirement of methanogens, and the lower CH4 production over a specific salinity level might be due to Cl− toxicity under higher additions of NaCl. Irrigation with NaCl solution S25 and S30 might have provided the Na required by methanogens, thereby favoring CH4 production. The lower amount of CH4 emission in S30 compared with the non-saline control under rice cultivation (Figure 5A) might be due to the lower above-ground plant biomass yield (Table 3). Results showed that the level of CH4 emission in S25 was slightly lower than that in the non-saline control (Figure 5B), although the above-ground plant biomass yields were slightly higher in S25 compared with the non-saline control (Table 3). This lower CH4 emission in S25 might be due to the existence of a higher concentration in S25 in the early growth stage (Figure 2D). The higher concentration might be due to nitrification process under intermittent irrigation and antagonistic effect of Cl− and ions in saline condition. According to the report of Zhou et al. (2012), the drained–reflooded paddy soil had an enhanced nitrification rate up to 56.8 μg N g−1day−1, which was four times higher than the flooded paddy soil and further stimulated nitrate reduction rates. In the saline condition, the existence of Cl− inhibits the absorption of by rice plants (Abdelgadir et al., 2005).
Furthermore, Dubey (2005) mentioned that soils containing greater amounts of readily decomposable organic substrates (acetate, formate, methanol, methylated amines, etc.) and low amounts of electron acceptors such as ferric ion, manganese, and sulfate () are likely to show high production of CH4. It can therefore be concluded that the extent of CH4 emission under saline conditions is influenced not only by the above-ground plant biomass yield, but also by the existence of electron acceptors such as that accumulate in rice-growing environments due to the osmotic stress of rice plants.
Effect of Gypsum Amendment on CH4 Emission
The observed lowering CH4 emission under gypsum application might be due to its high content (Figures 5A,B). In the presence of , -reducing bacteria will out compete methanogens for the same substrates such as hydrogen (H2) or carbon dioxide (CO2) or Acetate (CH3COO−) that methanogens use in CH4 production (Lindau et al., 1993; Denier van der Gon and Neue, 1994; Epule et al., 2011). Furthermore, Gauci et al. (2004) mentioned that -reducing bacteria have a higher affinity for both H2 and CH3COO− than methanogens, which enables them to maintain the pool of these substrates at concentrations too low for methanogens to use. Therefore, the reduction of CH4 emission following the addition of gypsum (Figures 5A,B) might be due to the competition between -reducing bacteria and CH4–producing bacteria for substrates as stated by Lindau et al. (1993), Denier van der Gon and Neue (1994) and Epule et al. (2011). The observed CH4 reduction under different rates of gypsum addition might be influenced by the amount of added to the soil. Therefore, it can be assumed that the higher amount of added gypsum resulted in a higher reduction of CH4 emission. According to Denier van der Gon et al. (2001), one mole of is needed to reduce one mole of CH4 produced. These considerations support the notion of a direct and proportional correlation between the amount of added and the reduction of CH4 production. However, the amount of added to a rice cultivation pot culture might be lost from the soil through plant uptake. It may be one possible factor that the level of CH4 reduction was not directly proportional to the amount of added in the present study.
In addition, Chin and Conrad (1995) and Rothfuss and Conrad (1993) reported that 20–30% of CH4 production in rice fields is derived from the conversion of H2 or CO2 and 70–80% is derived from CH3COO−. Although sulfate-reducing bacteria can outcompete methanogens for H2 or CO2, it is impossible to completely outcompete them for CH3COO− that was derived from a native soil organic C source and dead plant materials. Pangala et al. (2010) also indicated that level of CH4 suppression in the wetland is influenced by the ratio of and organic matter. Therefore, the lower reduction of CH4 emission under saline conditions in this study was due to the higher availability of organic C sources from leaf senescence under these conditions and their contribution as a source of nutrients for methanogens.
Relation Between Rice Growth and CH4 Emission
The concentration of salts in normal soil is generally lower than that in the cells of plants' roots. Water is absorbed by plant roots through a process called osmosis, which involves movement of water from soil with lower concentration of salts to a place that has a higher concentration of salts, inside the cells of plants' roots (Alex, 2006). In the Experiment (I), the maintaining of continuous flooded condition with specific salinity levels of either S30 or S90 inhibited the rice growth by lowering the tiller numbers, above-ground plant biomass yield and enhancing the numbers of dead leaves (Table 3). The addition of saline water with salinity levels (S30) or (S90) may have disturbed the uptake of water by plants. Moreover, higher concentration of and in flooded water was observed in saline condition compared with non-saline condition especially in early stage of vegetative growth (3 weeks after transplanting). Neves-Piestun and Bernstein (2001), and Homaei (2002) pointed out that as the salinity and osmotic pressure increase, this process leads to less water and nutrient absorption by plants including N and potassium, hence the plants growth will be stunted. Thus, this higher concentration (especially in S90) and concentration of flooded water under saline condition might be due to less water and N nutrient uptake by the plants under osmotic stress. Although N fertilizer was applied as the form in this experiment, the existence of in flooded water might be contributed from rain water and irrigation water or the conversion of to through nitrification process in the flood water. In comparison of S30 and S90, higher and concentrations of S90 indicated that the osmotic stress in S90 levels was much more severe than that in S30. Thus, the shortest growth duration was observed in S90.
In the Experiment (II), although the intermittent addition of saline water with S25 enhanced the total numbers of dead leaves, it did not significantly suppress the tiller numbers and the above biomass yields except in S25-G5 (Figure 3B and Table 3). The growth reduction in S25-G5 might be due to the higher Ca2+concentration in S25-G5. The higher Ca2+concentration in S25-G5 might not allow much absorption of ion as it is indicated by significantly higher concentration of flooded water in S25-G5 in the reproductive stage of rice growth (Figure 2B). Although there was no significant difference in concentration in flooded water EC between control treatment and S25, the concentration of S25 was significantly higher than that of control treatment in the early stage of vegetative growth (3 weeks after transplanting, Figure 3). This higher concentration in S25 compared with non-saline control treatment might be due to nitrification process in intermittent irrigation practice and antagonistic effect of and Cl− ions in saline condition.
The present study did not show any improvement in rice growth in terms of tiller numbers or total number of dead leaves following irrigation with saline water or addition of gypsum (Table 3). When irrigation water with a high Na+ concentration relative to divalent cations is used, there will be a great tendency for adsorption of exchangeable Na+ around soil particles (Alobaidy et al., 2010). The purpose of adding gypsum was to replace the monovalent Na+ ion by increasing the Ca2+ ion concentration in the root zone.
The use of gypsum (CaSO4.2H2O) as a source of Ca2+ is a well-established practice for the amelioration and management of Na+-saturated waters/soils (Mathad and Hiremath, 2010). Soil water laden with those Na+ ions is then drained or leached out of the soil. However, both experiments in the present study were conducted as pot experiments and the depth of a pot was only 30 cm. The water outlets of the pots were also covered with rubber stoppers during the whole rice-growing period, and there was no space for regular leaching of the soil solution with Na+ ions as found occurring in ordinary field conditions. Therefore, the regular addition of saline water could not provide sufficient Na+/Ca2+ in the root zone, and a clear effect due to Ca2+ amendment was not found.
In both pot experiments, the addition of saline water (S25, S30, and S90) enhanced the total numbers of dead leaves. These dead plant materials may act as the soil organic C source available for CH4 production because the total organic carbon (TOC) content in flooded water was detected in Experiment (II) and the higher TOC in flooded water was observed in saline condition compared to the non-saline condition as shown in Figure 7. Furthermore, although there was no significant relationship between CH4 emission and total numbers of dead leaves under gypsum application, the value of CH4 reduction due to gypsum addition was lower under saline condition than that of non-saline condition. It might be due to higher availability of C source from dead plant materials under saline condition.
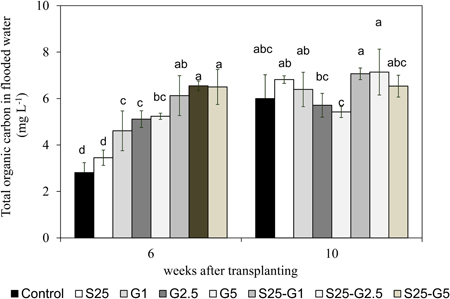
Figure 7. Total organic carbon content in flooded water at panicle initiation stage and maturity stage of rice. Error bars: SD of three replications. The same alphabetical characters indicate values that do not differ significantly by using LSD at p < 0.05.
Conclusion
Although gypsum was added as Ca2+ source to maintain appropriate Na+/Ca2+ in the soil, no improvement of rice growth due to gypsum addition in saline condition might be due to the high Na+/Ca2+ ratio under addition of saline water into the limited space of pot. Thus, it needs to be studied in actual fields affected by saline water. Beside this, as continuous application of saline water suppressed the above-ground plant biomass yield, and the intermittent application of saline water with S25 did not severely suppress the yield, saline water with 25 mMNaCl can be used for rice cultivation with intermittent irrigation if fresh water is unavailable.
Regarding with CH4 production, saline condition (30 mmol NaCl−1) favors CH4 production. However, excessive addition of NaCl (>30 mMNaCl) can inhibit CH4 production. Although CH4 production was favored by S30 level, the extent of CH4 emission in paddy rice cultivation was determined by the above-biomass yield and the existence of electron acceptor such as in soil environment. Furthermore, the addition of gypsum amendment (CaSO4. 2H2O) resulted in a reduction of CH4 emission. Thus, -containing amendment can be used as a CH4 mitigation option in saline and non-saline conditions. However, in the presence of due to gypsum addition, the extent of CH4 emission depended not only on the content of the soil, but also on the availability of a C source from dead plant materials. Finally, it can be concluded that CH4 emission under saline conditions was not only influenced by rice growth and salinity levels but also the existence of electron acceptors such as and .
Conflict of Interest Statement
The authors declare that the research was conducted in the absence of any commercial or financial relationships that could be construed as a potential conflict of interest.
Acknowledgments
We sincerely thank the Japanese government (Monbukagakusho:Mext) Scholarship Association for supporting this research.
References
Abdelgadir, E. M., Oka, M., and Fujiyama, H. (2005). Nitrogen nutrition of rice plants under salinity. Biol. Plant. 49, 99–104. doi: 10.1007/s10535-005-0104-8
Alobaidy, A., Al-Sameraiy, M., Kadhem, A., and Majeed, A. (2010). Evaluation of treated municipal wastewater quality for Irrigation. J. Environ. Prot. 1, 216–225. doi: 10.4236/jep.2010.13026
Aulakh, M. S., Wassmann, R., and Rennenberg, H. (2001). Methane emission from rice fields—quantification, mechanisms, role of management and mitigation options. Adv. Agron. 70, 193–260. doi: 10.1016/S0065-2113(01)70006-5
Chin, K., and Conrad, R. (1995). Intermediary metabolism in methanogenic paddy soil and the influence of temperature. FEMS Microbiol. Ecol. 18, 85–102. doi: 10.1111/j.1574-6941.1995.tb00166.x
Datta, A., Jagadeesh, B., Yeluripati, N. D. R., Mahata, K. R., Santra, S. C., and Adhya, T. K. (2013). Seasonal variation of methane flux from coastal saline rice field with the application of different organic manures. Atmos. Environ. 66, 114–122. doi: 10.1016/j.atmosenv.2012.06.008
Denier van der Gon, H. A. C., Bodegom, P. M., Wassman, R., Lantin, S. R., and Metra-corton, M. T. (2001). Sulfate-containing amendment to reduce methane emissions from rice fields: mechanisms, effectiveness and cost. Mitig. Adapt. Strategies Glob. Chang. 6, 71–89. doi: 10.1023/A:1011380916490
Denier van der Gon, H. A. C., and Neue, H. U. (1994). Impact of gypsum application on the methane emission from a wetland rice field. Global Biogeochem. Cycles 8, 127–134. doi: 10.1029/94GB00386
Dobermann, A., and Fairhurst, T. (2000). Rice: Nutrient Disorder and Nutrient Management, Vol. 1. Los Banos, CA: International Rice Research Institute.
Dubey, S. K. (2005). Microbial ecology of methane emission in rice agroecosystem: a review. Appl. Ecol. Environ. Res. 3, 1–27. doi: 10.15666/aeer/0302_001027
Epule, E. T., Peng, C., and Mongoh, N. (2011). Methane emissions from paddy rice fields: strategies towards achieving a win-win sustainability scenario between rice production and methane emission reduction. J. Sustain. Dev. 4, 188–196. doi: 10.5539/jsd.v4n6p188
Flowers, T. J., and Flowers, S. A. (2005). Why does salinity pose such a difficult problem for plant breeders? Agric. Water Manage. 78, 15–24. doi: 10.1016/j.agwat.2005.04.015
Gauci, V., Matthews, E., Dise, N., Walter, B., Koch, D., Granberg, G., et al. (2004). Sulfur pollution suppression of the wetland methane source in the 20th and 21st centuries. Proc. Natl. Acad. Sci. U.S.A. 101, 12583–12587. doi: 10.1073/pnas.0404412101
Ghafoor, A., Qadir, M., and Murtaza, G. (2004). Salt–Affected Soils: Principles of Management. Lahore: Allied BookCenter.
Grieve, C. M., and Fujiyama, H. (1987). The response of two rice cultivars to external Na/Ca ratio. Plant Soil 103, 245–250. doi: 10.1007/BF02370396
Grünberger, O., Maeght, J. L., Montoroi, J. P., Rattana-Anupap, S., Wiengwongnam, J., and Hammecker, C. (2005). “Assessment of salinity hazard by time domain reflectometry in flooded sandy paddy soils,” in Proceedings of Management Tropical Sandy Soils for Sustainable Agriculture (Session 3), 27, (Bangkok), 112–117.
Homaei, M. (2002). Plant Reaction to Salinity. Teheran: National Irrigation & Drainage Committee Publication (in Farsi).
Hu, S., Tao, H., Qian, Q., and Guo, L. (2012). Genetics and molecular breeding for salt-tolerance in rice. Rice Genom. Genet. 3, 39–49. doi: 10.5376/rgg.2012.03.0007
Hu, Y., and Schmidhalter, U. (2005). Drought and salinity: a comparison of their effects on mineral nutrition of plants. J. Plant Nutr. Soil Sci. 168, 541–549. doi: 10.1002/jpln.200420516
Hussain, K., Nisar, M. F., Majeed, A., Nawaz, K., Bhatti, K. H., Afghan, S., et al. (2010). What molecular mechanism is adapted by plants during salt stress tolerance? Afr. J. Biotechnol. 9, 416–422.
Jarrell, K. F., and Kalmokoff, M. L. (1988). Nutritional requirements of the methanogenicarchaebacteria. Can. J. Microbiol. 34, 557–576. doi: 10.1139/m88-095
Kader, M. A., and Lindberg, S. (2008). Cellular traits for sodium tolerance in rice (Oryza sativa L.). Plant Biotechnol. 25, 247–255. doi: 10.5511/plantbiotechnology.25.247
Liesack, W., Schnell, S., and Revsbech, N. P. (2000). Microbiology of flooded rice paddies. FEMS Microbiol. Rev. 24, 625–645. doi: 10.1111/j.1574-6976.2000.tb00563.x
Lindau, C. W., Bollich, P. K., Delaune, R. D., Mosier, A. R., and Bronson, K. F. (1993). Methane mitigation in flooded Louisiana rice fields. Biol. Fertil. Soils 15, 174–178. doi: 10.1007/BF00361607
Liu, S., Zhang, L., Jiang, J., Chen, N., Yang, X., Xiong, Z., et al. (2012). Methane and nitrous oxide emissions from rice seedling nurseries under flooding and moist irrigation regimes in Southeast China. Sci. Total Environ. 426, 166–171. doi: 10.1016/j.scitotenv.2012.02.003
Lu, Y., Wassmann, R., Neue, H. U., and Huang, C. (1999). Impact of phosphorus supply on root exudation, aerenchyma formation and CH4 emission of rice plants. Biogeochemistry 47, 203–218. doi: 10.1007/BF00994923
Mathad, P., and Hiremath, S. (2010). Alleviation of saline stress by gypsum in chlorella vulgaris EIJERINCK. J. Algal Biomass Utln. 1, 43–53.
Mishra, B. (2004). “Present status issues and future strategies for increasing quality rice production and export,” in National Symposium on Strategies for Enhancing Export of Quality Rice Held at NBPGR (New Delhi), 1–16.
Neves-Piestun, B. G., and Bernstein, N. (2001). Salinity-induced inhibition of leaf elongation in maize is not mediated by changes in cell wall acidification capacity. Plant Physiol. 125, 1419–1428. doi: 10.1104/pp.125.3.1419
Pangala, S. R., Reay, D. S., and Heal, K. V. (2010). Mitigation of methane emissions from constructed farm wetlands. Chemosphere 78, 493–499. doi: 10.1016/j.chemosphere.2009.11.042
Ramakrishnan, B., Kumaraswamy, S., Mallick, K., Adhya, T. K., Rao, V. R., and Sethunathan, N. (1998). Effect of various anionic species on net methane production in flooded rice soils. World J. Microbiol. Biotechnol. 14, 743–749. doi: 10.1023/A:1008814925481
Reddy, M. A., Francies, R. M., Rasool, S. N., and Reddy, V. R. P. (2014). Breeding for tolerance to stress triggered by salinity in rice. Int. J. Appl. Biol. Pharm. Technol. 5, 167–176.
Rothfuss, F., and Conrad, R. (1993). Vertical profiles of CH4 concentrations, dissolved substrates and processes involved in CH4 production in a flooded Italian rice field. Biogeochemistry 18, 137–152. doi: 10.1007/BF00003274
Sakai, S., Imachi, H., Sekiguchi, Y., Ohashi, A., Harada, H., and Kamagata, Y. (2007). Isolation of key methanogens for global methane emission from rice paddy fields: a novel isolate affiliated with the clone cluster rice cluster, I. Appl. Environ. Microbiol. 73, 4326–4331. doi: 10.1128/AEM.03008-06
Supparattanapan, S., Saenjan, P., Quantin, C., Maeght, J. L., and Grünberger. (2009). Salinity and organic amendment effects on methane emission from a rain-fed saline paddy field. Soil Sci. Plant Nutr. 55, 142–149. doi: 10.1111/j.1747-0765.2008.00330.x
Tanaka, H., Nakamura, Y., and Motobayashi, T. (2008). Detailed soil map of paddy fields located in field museum honmachi, tokyo university of agriculture and technology. J. F. Sci. 7, 1–10.
US EPA. (2006). Global Anthropogenic Non-CO2 Greenhouse Gas Emissions: 1990-2020. Washington, DC: Office of Atmospheric Programs, Climate Change Division, U.S. Environmental Protection Agency.
Wu, G. Q., and Wang, S. M. (2012). Calcium regulates K+/Na+ homeostasis in rice (Oryza sativa L.) under saline conditions. Plant Soil Environ. 58, 121–127.
Xiong, Z. Q., Xing, G. X., and Zhu, Z. L. (2007). Nitrous oxide and methane emissions as affected by water, soil and nitrogen. Pedosphere 17, 146–155. doi: 10.1016/S1002-0160(07)60020-4
Yan, X., Yagi, K., Akiyama, H., and Akimoto, H. (2005). Statistical analysis of the major variables controlling methane emission from rice fields. Glob. Chang. Biol. 11, 1131–1141. doi: 10.1111/j.1365-2486.2005.00976.x
Zhou, S., Sakiyama, Y., Riya, S., Song, X., Terada, A., and Hosomi, M. (2012). Assessing nitrification and denitrification in a paddy soil with different water dynamics and applied liquid cattle waste using the 15N isotopic technique. Sci. Total Environ. 430, 93–100. doi: 10.1016/j.scitotenv.2012.04.056
Keywords: methane emission, methane production, gypsum, non-saline condition, saline condition, rice growth
Citation: Theint EE, Bellingrath-Kimura SD, Oo AZ and Motobayashi T (2016) Influence of Gypsum Amendment on Methane Emission from Paddy Soil Affected by Saline Irrigation Water. Front. Environ. Sci. 3:79. doi: 10.3389/fenvs.2015.00079
Received: 10 August 2015; Accepted: 30 November 2015;
Published: 05 January 2016.
Edited by:
Christophe Darnault, Clemson University, USAReviewed by:
Lukas Van Zwieten, New South Wales Department of Primary Industries, AustraliaXiuli Liu, Academy of Mathematics and Systems Science, China
Copyright © 2016 Theint, Bellingrath-Kimura, Oo and Motobayashi. This is an open-access article distributed under the terms of the Creative Commons Attribution License (CC BY). The use, distribution or reproduction in other forums is permitted, provided the original author(s) or licensor are credited and that the original publication in this journal is cited, in accordance with accepted academic practice. No use, distribution or reproduction is permitted which does not comply with these terms.
*Correspondence: Sonoko D. Bellingrath-Kimura, belks@zalf.de