Evaluating the Role of Seagrass in Cenozoic CO2 Variations
 Marco Brandano1,2*
  Marco Cuffaro2
  Giovanni Gaglianone1
  Patrizio Petricca3
  Vincenzo Stagno1
  Guillem Mateu-Vicens4,5
- 1Dipartimento Scienze della Terra, Università Roma La Sapienza, Rome, Italy
- 2Istituto di Geologia Ambientale e Geoingegneria, CNR, Rome, Italy
- 3GFZ German Research Centre for Geosciences, Telegrafenberg, Potsdam, Germany
- 4Càtedra Guillem Colom Casasnovas, Universitat de les Illes Balears, Palma de Mallorca, Spain
- 5Laboratorio de Zoología, Departament de Biologia, Universitat de les Illes Balears, Palma de Mallorca, Spain
Marine seagrass angiosperms play an important role in carbon sequestration, removing carbon dioxide from the atmosphere and binding it as organic matter. Carbon is stored in the plants themselves, but also in the sediments both in inorganic and organic forms. The inorganic component is represented by carbonates produced by calcareous organisms living as epiphytes on seagrass leaves and rhizomes. In this paper, we find that the rate of seagrass epiphyte production (leaves and rhizomes) averages 400 g m−2 yr−1, as result of seagrass sampling at seven localities along the Mediterranean coasts, and related laboratory analysis. Seagrasses have appeared in the Late Cretaceous becoming a place of remarkable carbonate production and C sequestration during the whole Cenozoic era. Here, we explore the potential contribution of seagrass as C sink on the atmospheric CO2 decrease by measuring changes in seagrass extent, which is directly associated with variations in the global coastal length associated with plate tectonics. We claim that global seagrass distribution significantly affected the atmospheric composition, particularly at the Eocene-Oligocene boundary, when the CO2 concentration fell to 400 ppm, i.e., the approximate value of current atmospheric CO2.
Introduction
Seagrasses are marine angiosperms that form extensive submarine meadows in the photic zone along temperate to tropical coastlines worldwide (Short and Wyllie-Echeverria, 1996; Short et al., 2007). They first (Posidonia cretacea) appeared during the Late Cretaceous (Brasier, 1975; den Hartog and Polderman, 1975; Eva, 1980; Ivany et al., 1990) in the Tethys Ocean. Since the early Eocene this ecosystem became well established and spread throughout the Tethys (Brasier, 1975; Ćosović et al., 2004; Zamagni et al., 2008; Tomás et al., 2016; Tomassetti et al., 2016), the Western Atlantic-Caribbean (Vélez-Juarbe, 2014) and in the Indo-Pacific realm when they colonized the euphotic zone of coastal environments as well as carbonate platforms.
Until the 2000s only few works focus on geological record of seagrass (Brasier, 1975; Eva, 1980; Wanless, 1981; Ivany et al., 1990). This is likely a consequence of the scarcity of fossil remains of seagrasses, due to the low potential of preservation of these plants (Brasier, 1975; Reich et al., 2015 and references therein). On the contrary, in these last years many works have focused on the identification of paleo-seagrasses through the recognition of indirect sedimentological and biological indicators, by comparison with modern seagrass habitats (e.g., Mateu-Vicens et al., 2008, 2012; Reich et al., 2015; Darroch et al., 2016). These works well evidence the extensive colonization by seagrass in the photic zone of coastal environment and carbonate platforms at global scale (Reich et al., 2015 and reference therein).
Seagrasses have two clearly distinguishable levels, rhizomes and blades. Rhizomes run in sediments beneath the seabed, and have regularly spaced nodes, each bearing roots below and an erect stem or shoot with the blades above. Each level has characteristic associated communities living attached to the plant (Langer, 1988; Mateu-Vicens et al., 2008). A diverse array of biota dwells in seagrass meadows as epiphytic (foraminifers, bryozoans, serpulids and encrusting coralline algae) or infaunal forms (echinoids, mollusks) (Figures 1A,B). Many of these organisms secrete calcareous skeletons (Perry and Beavington-Penney, 2005; Brandano et al., 2009; Mateu-Vicens et al., 2010, 2012), consequently seagrasses hosted a significant carbonate production.
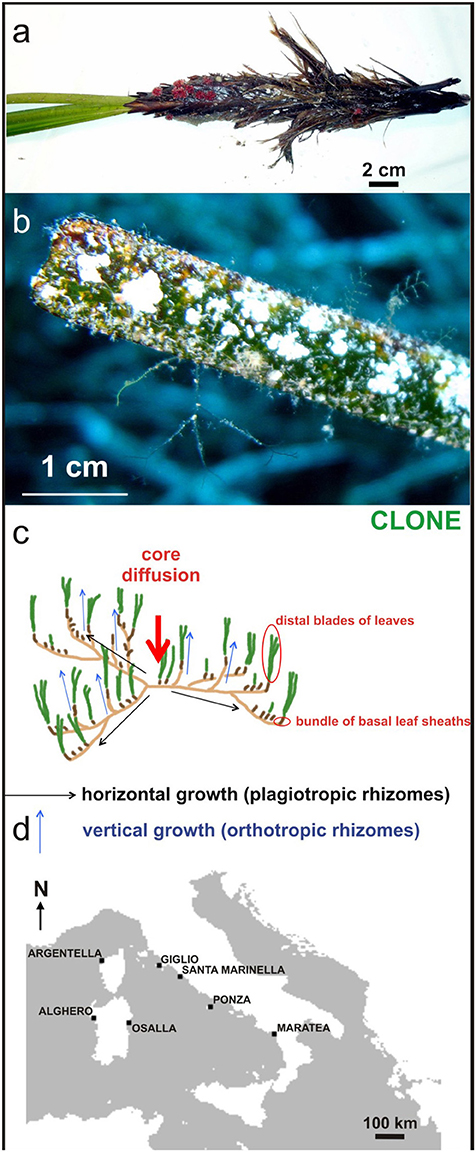
Figure 1. (A) Biota dwelling vertical rhizome (Miniacina miniacea) and (B) leaves as epiphytic forms; (C) clonal growth reproductive strategy involves the development of modular units, knowns as ramets, through horizontal growth of the rhizome, genetically identical to the parent plant, the genet; (D) Location map of sampling sites for measurement of seagrass carbonate production.
The distribution of seagrass species is the result of combined plant sexual reproduction and clonal growth (Figure 1C) influenced by dispersal and environmental limitations (Spalding et al., 2003). All seagrass species are capable of asexual reproduction, giving rise to modular units known as ramets, through horizontal growth of the rhizome genetically identical to the parent plant, the genet. The reproductive strategy, which involves clonal growth and production of long-lived, locally dispersed seeds may provide an evolutionary advantage to plants growing in environments subject to temporally unpredictable major disturbances (Rasheed, 2004).
Lastly, seagrasses play an important role in carbon sequestration as they remove carbon dioxide from the atmosphere and bind it as organic matter (Fourqurean et al., 2012). The carbon (C) sequestered in vegetated coastal ecosystems, specifically mangrove forests, seagrass beds and salt marshes, has been termed “blue carbon” (Nellemann et al., 2009). Blue carbon is sequestered over the short term (decennial) in biomass and over longer (millennial) time-scales in sediments (Duarte et al., 2005; Lo Iacono et al., 2008). Carbon is stored above the seabed on plant tissues, underneath the seabed on roots and rhizomes, and in sediments in both organic and inorganic forms, the latter represented by carbonates. Much attention has focused on the quantification of organic C sequestration, and the latest estimates indicate that seagrasses can store 4.2–8.4 Pg C (Fourqurean et al., 2012), and total global C burial by seagrasses may reach 112 Tg C yr−1 (McLeod et al., 2011). However, we point out here that less attention has been paid to C stored by carbonates (inorganic C) produced by epiphytic calcareous organisms that, live on seagrass leaves and rhizomes. This inorganic C, unlike organic C, is locked away.
Methods
Estimates of Seagrass Carbonate Production
Posidonia oceanica shoots were collected by scuba divers at 5, 11, and 15 mwd (mean water depth) from seagrass meadows in seven locations on the Tyrrhenian coast (Maratea, Ponza, S. Marinella, Isola del Giglio, Osalla, Alghero, Crovani see Figure 1D) during spring and autumn 2012 after evaluation of meadow shoot density near the sampling points. The sampling period was chosen taking into account the seagrass growth dependence on seasons (Short et al., 2006). The main morphometric measurements (length, width, and leaf area, leaf length, Leaf Area Index) were performed on 200 leaves from seagrass bundles. The annual production of epiphytic carbonate in the meadows was evaluated independently for the leaves (blades) and its common basal parts (bundle of leaf-sheaths), as well as on the whole leaf bundles. Calcium carbonate content was assessed by geochemical calcimetric analysis on ash from plant parts, previously dried at 105°C for 24 h and weighed, burned in an oven at 550°C for 4 h (LOI550 method; (Dean, 1974)), and determination of calcium carbonate content by calcimetric analysis on ash. The epiphytic foliar content of calcium carbonate was converted into epiphytic foliar annual average following Canals and Ballesteros (1997), that is multiplying by 1.88. This process was also extended to the carbonate contribution from basal parts, and then to whole bundles. On whole parts (leaves and basal parts), the annual production of epiphytic carbonate per surface meadow unit of P. oceanica was estimated to be about 400 g m−2 yr−1.
Plate Reconstructions and Coastline Lengths
Absolute plate reconstructions with respect to the Pacific Hotspot Reference frame during the Cenozoic were performed by combining global plate models and finite rotations provided by Seton et al. (2012). The reconstructed positions of continents (Figure S1) were obtained with GPlates software (http://www.gplates.org), and closely coincide with magnetic Chrons, crucial geological events (e.g., the Messinian salinity crisis) and global variation trends of atmospheric CO2, as reported by Beerling and Royer (2011). The coastline polygons from Seton et al. (2012) were used to compute global coastline lengths at each selected stage. Coastal data were digitalized and simplified due the complexity of several uneven areas (such as Polinesia and Indonesia), underestimating the actual total lengths of the coastlines. Polygon borders presumed to be in contact with seas and oceans were selected and considered as a single boundary according to the reconstruction by Seton et al. (2012). Total coastline lengths and areas of seagrass emplacement were computed at each selected age.
Global CO2 Estimates
In this work, the Cenozoic CO2 variations according to Beerling and Royer (2011) are used with one proxy (phytoplankton) to obtain a better comprehension of changes in atmospheric CO2 concentrations. Our purpose is to quantify the contribution from both inorganic and organic carbon sequestration due to seagrass extent variations during the Cenozoic, and compare them with the reference changes of Beerling and Royer (2011) to evaluate the role of seagrass in CO2 atmospheric composition. At this aim we consider that,
where VCO2 is the partial volume of the CO2 in the atmosphere, Vatm is the total volume of the atmosphere, and C = 400 ppmv is the current value of the global concentration of carbon dioxide in the atmosphere, expressed in parts per million by volume.
Under the same conditions of temperature T and pressure P, we can write:
where nCO2 and natm are the CO2 and the atmosphere number of moles respectively, and R is the universal gas constant, so that we have:
where MCO2 is the mass in grams of the carbon dioxide in the atmosphere, Matm = 5.1480 × 10²¹ g is the total mean mass of the atmosphere (Trenberth and Smith, 2005), mCO2 = 44.00 g mole−1 and matm = 28.97 g mole−1 are the CO2 molecular weight and the mean molecular weight of the atmosphere (NASA Earth Fact Sheet, http://nssdc.gsfc.nasa.gov/planetary/factsheet/earthfact.html), respectively
Using equation (3), we are able to compute the variation of the ratio VCO2/Vatm during the Cenozoic, and evaluate the inorganic and organic carbon sequestration in terms of carbon dioxide mass MCO2 (in grams) in the atmosphere.
The quantity MCO2 depends on the seagrass areal extent, being estimated for the Present using the lower global area of A1 = 300,000 km2 (Charpy-Roubaud and Sournia, 1990), and an upper global area A2 = 600,000 km2 (Duarte et al., 2005). The area depends by the extension of seagrass from the coast, that in turn is under control of the light requirement for photosynthesis Short et al. (2007). The upslope limit of seagrasses is imposed by their necessity of constant immersion in seawater and low hydrodynamic conditions because high energy superficial wave inhibits its growth and development. As seagrass may colonize rocky and sandy substrates in the photic zone (Green and Short, 2003; Mateu-Vicens et al., 2012) the areal extent of seagrass meadows depends by steep gradient of marine seafloor. These requirements suggest that it is not necessary a flat and wide seafloor surface for seagrass meadows colonization, and also steep rocky substrate may host productive seagrasses (Green and Short, 2003). Modern examples of such substrate are represented by the northeastern coast of Philippines or northeastern coast of Haiti in the Caribbean (Green and Short, 2003). On the contrary are well known examples of large continental platforms not colonized by seagrass such as the southwestern Africa or southeastern South America continental platforms.
During the Cenozoic, we expect that seagrass area varied according to plate tectonics. Mantle—reference plate reconstructions with respect to the Pacific hotspot framework during the Cenozoic were performed by combining global plate models and finite rotations provided by Seton et al. (2012). The reconstructed positions of continents (Figure S1) were obtained with GPlates software (http://www.gplates.org), chosen here to coincide as closely as possible with magnetic chrons, crucial geological events (e.g., the Messinian salinity crisis) and global variation trends of atmospheric CO2, as reported by Beerling and Royer (2011). The coastline polygons of Seton et al. (2012) are used to compute global coastline lengths L at each selected stage in a range of latitude [−65°N, 65°N] in which seagrasses are presumed to have existed based on paleontological record-IPSIs-, Reich et al. (2015) (see Figure 1, Table S1). Offshore distance d is assumed constant during the Cenozoic, and is varied to obtain lower and upper global estimates of the seagrass areal extent for the present-day, so that:
where i = 1, 2, and L0 is the current total coastline length obtained with coastal polygon model by Seton et al. (2012), at age t = 0 Ma, resulting in d1 = 0.889625 km and d2 = 1.779249 km. Cenozoic coast lengths and seagrass areal extent variations are reported in Table S1.
To compute current inorganic carbon sequestration, laboratory experiments carried out in this study suggest that present-day seagrass coverage produces CaCO3 carbonate with the rate a = 400 g m−2 yr−1, which results in the 44% of CO2 stored in seagrass carbonates, corresponding to the coefficient b = 176 g m−2 yr−1. The mass in grams of CO2 over a year, due to inorganic carbon sequestration, produced by seagrass coverage Ai, with i = 1, 2 is obtained for the Present-day, as it follows:
Combining Equation (5) with Equation (3), we obtain the carbon dioxide removal (CDR) due to inorganic (CaCO3) carbon sequestration, during the Cenozoic. At each selected age, results are reported in Table S2 and Table S3, for lower and upper seagrass areal extent A1 and A2, respectively.
To calculate the present-day value of organic carbon sequestration, the estimate procedure of Duarte et al. (2010), Kennedy et al. (2010) and Waycott et al. (2009) were followed. Those authors estimated an organic C sink of c1 = 160 g C m−2 yr−1 and c2 = 186 g C m−2 yr−1 related to the A1 (300,000 km2) and A2 (600,000 km2) seagrass areal extent, respectively. The mass in grams of C over a year, due to the organic carbon sequestration, produced by seagrass coverage Ai, with i = 1, 2 is obtained for the present-day, as it follows:
Then, from Rasheed (2004), we know that:
where mCO2 = 44.00 g mole−1 and mC = 12.00 g mole−1 are the CO2 and C molar mass, respectively.
Combining Equation (7), Equation (6), and Equation (3) we obtain the carbon dioxide removal (CDR) due to organic carbon sequestration during the Cenozoic. At each selected age, results are reported in Tables S2, S3, for lower and upper seagrass areal extent A1 and A2, respectively.
Finally, to have an estimate of the global amount of C sink due to both inorganic and organic contributions, we define the cumulative carbon dioxide removal (CDR), as it follows:
where i = 1, 2. Combining equation (8) with equation (3) we obtain the carbon dioxide removal (CDR) due to cumulative effect of carbon sequestration (i.e., inorganic and organic), during the Cenozoic. At each selected age, results are reported in Tables S2, S3, for lower and upper seagrass areal extent A1 and A2, respectively. A third model for the upper seagrass areal extent A3 = 100,0000 km2 with d3 = 2.965415 km can be used to calculate the present-day values of inorganic and organic carbon sequestration taking into account the seagrass loss of 29% worldwide (Waycott et al., 2009), also including the inorganic C sink estimate of b = 176 g m−2 yr−1, and the organic C sink estimate of c2 = 186 g C m−2 yr−1 respectively. Again, combining Equation (5), Equation (6), Equation (7) with Equation (3), and using Equation (8) we obtain results as in Table S4.
Storage of C by seagrasses may be calculated over 1000-year periods as seagrasses work and live for 1000 of years (Arnaud-Haond et al., 2012). This carbon dioxide removal over 1000 yr (KCDR) is reported in Tables S2–S4, for the inorganic, organic and cumulative contributions of lower and upper seagrass areal extent A1, A2, and A3.
Cenozoic coastal variations, associated with inorganic, organic and cumulative contribution for C sink for Area A1 and A3 are reported in Figures S2, S3, respectively.
Linear regressions on CO2 Cenozoic variations CO2 and KCDR models (i.e., A1, A2, and A3), are reported in Table S5 and Figure S4, and represent the rate of variations, showing a decrease of CO2 with respect an increase of carbon dioxide removal over 1000 yr.
Partial time interval linear regressions are reported in Table S5 and Figure S5, showing that rates of variations suggest a correspondence at 45% between CO2 decrease and cumulative KCDR increase during the Cenozoic whereas, if we consider the 41–7 Ma interval, correspondence increases to 66% (Table S5, and Figure S5).
Results and Discussion
The Mediterranean shelf has classically hosted seagrass sites used to investigate both calcareous production and carbon burial capacity (Canals and Ballesteros, 1997; Duarte et al., 2013). In this paper, carbonate content and (epiphytic) production have been quantified both from seagrass leaves (blades) and from bundles of persistent basal leaf-sheaths resembling “shaving brushes” (Larkum et al., 2006), where the most important seagrass is Posidonia oceanica in terms of calcareous epiphyte production (Figure 1A). The seagrass biomass exerts a predominant control on the relative abundance of calcareous epiphytes. The most abundant of these are geniculate (articulated) and non-geniculate (encrusting) coralline algae that, together, comprise up to 50% of epiphytic carbonate. Other significant epiphytes are bryozoans and benthic foraminifers, which contribute approximately in equal amounts (~25% each) to the carbonate production. Calcareous epiphyte abundance peaks at water depths of ~10 meters. The rate of epiphyte production (leaves and rhizomes) averages 400 g m−2 yr−1. Today, seagrass meadows are widespread in many tropical and temperate, shallow marine, and estuarine environments. Data from leaf carbonate production are available from both tropical and temperate environments (Nelsen and Ginsburg, 1986; Bosence, 1989; James et al., 2012), showing that the total epiphytic production for seagrass is within the range of the Tyrrhenian seagrass. Throughout the world, seagrasses are estimated to cover 0.6 × 10⁶ km2, equivalent to 10% of the coastal ocean surface, an area comparable to that covered by coral reefs and mangroves (Charpy-Roubaud and Sournia, 1990; Hemminga and Duarte, 2000). Consequently, with an average carbonate production of 400 g m−2 yr−1, the CO2 stored in seagrass carbonates may be estimated at up to 105 Tg yr−1 (10.5 × 10⁷ t).
Seagrasses have been integral components of shallow marine ecosystems since their appearance in the Late Cretaceous (den Hartog, 1970; Brasier, 1975; Ivany et al., 1990). Because the calcareous skeletons of many seagrass dwellers contribute significantly to the sediment of photic shallow water environments, seagrass meadows have become host of substantial carbonate production and C (organic and inorganic) sequestration since the Cenozoic era.
Reconstructions of atmospheric CO2 concentrations for the Cenozoic have improved greatly in the last few decades (e.g., Beerling and Royer, 2011), although many uncertainties still exist, with CO2 estimates varying greatly within the same time interval used as a proxy (Royer et al., 2012). However, the review of CO2 concentration estimates by Beerling and Royer (2011) documented a consistent pattern of CO2 change. According to the above authors' compilation in the early Paleogene atmospheric CO2 was about 400 ppm, followed by a first peak to nearly 1900 ppm at 50 Ma and two others above 1200 ppm until the Eocene-Oligocene boundary when a decreasing trend began, with values around 400 ppm throughout the Oligocene. During the Miocene a few data points exceed 400 ppm, but most fall in the range 200–350 ppm. The bulk of the data from the Pliocene are in the range 250–400 ppm, followed by a general decrease during the Pleistocene.
The causes of the reduction in atmospheric CO2 levels at the Eocene-Oligocene boundary are still debated (Willenbring and von Blanckenburg, 2010). According to Allen and Armstrong (2008), the decrease in atmospheric CO2 was the result of complementary mechanisms, such as waning pre-collision arc magmatism, increased weathering of silicate, storage of organic carbon in Paratethyan basins, and oceanographic changes producing upwelling.
Changes in the atmospheric CO2 concentrations, however, may have had severe consequences for marine ecosystems. Elevated atmospheric CO2 phases in the Earth's history had induced important crisis and extinctions of marine calcifiers (Weissert and Erba, 2004; Erba et al., 2010; Črne et al., 2011; Hönisch et al., 2012). However, with the exception of PETM (Paleocene Eocene Thermal Maximum) event, the Cenozoic interval was not affected by important changes of CaCO3 saturation (Hönisch et al., 2012).
The role of modern seagrasses as global C sinks was demonstrated and quantified once the total area of Earth covered by seagrass meadows was estimated. Seagrasses grow over a large range of latitudes, from the tropics to close to Arctic regions (N70°, Norway) in coastal waters, with a seafloor illuminated by 1.0–29% of surface irradiance, in water depths of up to −60 m, average −25 m (Green and Short, 2003). On the other hand, the global extent of seagrasses is directly linked to global coastal length. As a consequence, changes in the latter over time may influence global seagrass coverage and its contribution to C storage.
The potential contribution of seagrasses in reducing atmospheric CO2 during the Cenozoic can be evaluated by measuring changes in seagrass extent, which is directly associated with variations in global coastal length due to plate tectonics. Estimates of coastal length changes are provided here by means of plate tectonic reconstructions. During the Cenozoic the position and shape of the continents were modified by the movement of lithospheric plates with respect to the underlying mantle (Figure 2).
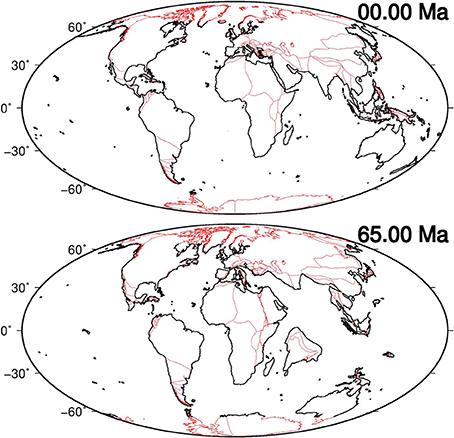
Figure 2. Present-day (0 Ma) and reconstructed (65 Ma) positions of continents using models provided by Seton et al. (2012) (red polygons). Black lines represent digitalized, and simplified data, estimated in a range of latitude [−65°N, 65°N] in which seagrasses are presumed to have existed, and utilized to compute global coastal lengths at several key-time points.
Using the rotation vector, plate polygon and coastline data proposed by Seton et al. (2012), we computed global plate reconstructions at several key-time points (Figure S1) overlapping possible magnetic Chrons, crucial geological events (e.g., the Messinian salinity crisis) and trends of variations in atmospheric CO2, as reported by Beerling and Royer (2011). Then, with the reconstructed positions of continents, we estimated the total length of the global coastlines in a range of latitude [−65°N, 65°N] in which seagrasses are presumed to have existed over the entire investigated period of time (see Methods paragraph).
From 65 to 41 Ma we observe a general increase in the coastline length (Figure 3), mostly due to the southward movement of North America and Eurasia over the latitude hypothesized for seagrass growth, at 65°N. The appreciable decrease in coastlines at 34 Ma can be attributed to the evolution of the India-Eurasia continental collision: a relevant increase in coastline lengths between 34 and 28 Ma is observed, probably due to the opening of the Gulf of Aden and the beginning of continental rifting in the Red Sea between the Africa and Arabia plates. Lastly, a steady decrease in length is noted after 14 Ma, mainly due to the continental collision of the Arabia and Eurasia plates, with the exception of a singular increase at 5 Ma, ascribed to the closure of North America and South America. The curves of CaCO3 carbonate production and organic contribution to carbon dioxide removal (CDR) and their cumulative curve (i.e., CaCO3 plus organic C) during the Cenozoic are shown in Figure 3 and compared with variations in coastline length (31.0 × 10⁴ to 36.7 × 10⁴ km). Here, we present 3 models (A1−3) that take into account the dependence of CO2 sequestration on the seagrass areal extent, being evaluated for the Present-day with a lower global estimate of A1 = 300,000 km2 (29), an upper global estimate of A2 = 600,000 km2 (19) and an overestimation of A3 = 1,000,000 km2. We report the result of calculation for the A2 model, for A1 and A2 see Figures 3, 4.
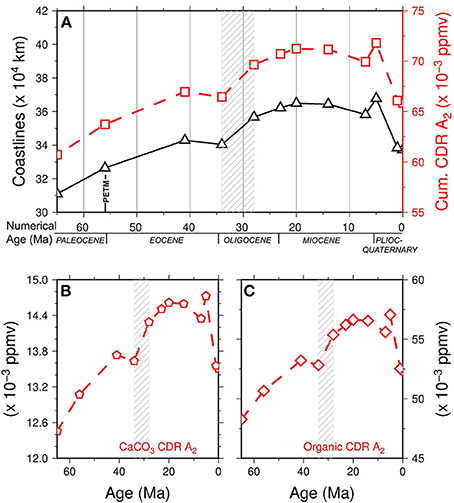
Figure 3. (A) Cenozoic cumulative carbon dioxide removal (CDR) for model A2 (red line, open squares, compared with variations of coastline length (black line open triangles). (B) Cenozoic inorganic (CaCO3) carbon dioxide removal (CDR) for model A2. (C) Cenozoic organic carbon dioxide removal (CDR) for model A2. Dashed pattern represents the Eocene-Oligocene time interval. Data are reported in Table S3.
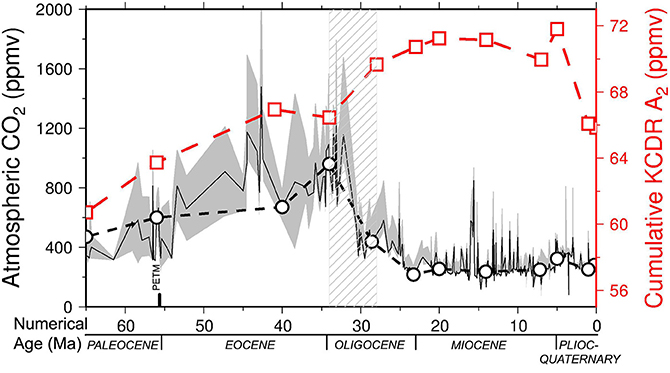
Figure 4. Cenozoic cumulative (i.e., inorganic—CaCO3 – and organic) carbon dioxide removal carbon dioxide removal over 1000 yr (KCDR) (red line, open squares) for model A2 = 600,000 km2, compared with the values of atmospheric CO2 reported by Beerling and Royer (2011) (solid black line, gray confidence band), including CO2 selected values at the key times used to calculate plate reconstructions and coastline lengths (dashed black line, open circles). Note the general match between CO2 decrease and KCDR increase due to seagrass extent as a consequence of increase of coastal length. Dashed pattern represents the Eocene-Oligocene time interval.
The contribution of CaCO3 to CO2 sequestration in the A2 was found to vary from 12.45 × 10⁻³ to 14.72 × 10⁻³ ppm yr−1. Higher values were observed for the organic component, which ranged from 48.26 × 10⁻³ to 57.52 × 10⁻³ ppm yr−1. The cumulative contribution of the two components was in the range 60.71 × 10⁻³ to 71.79 × 10⁻³ ppm yr−1.
Storage of C by seagrasses may be calculated over 1000-year periods, because seagrasses work and live for 1000 of years (Arnaud-Haond et al., 2012). This cumulative carbon dioxide removal over 1000 years (KCDR) (80.43–95.11 ppm) throughout the Cenozoic is shown in Figure 4 and compared with the value of atmospheric CO2 reported by Beerling and Royer (2011), including values for the key time used to calculate plate reconstructions and coastline lengths. Figure 3A shows the general match between increased C sequestration and increased coastal length. Linear regressions on both curves, i.e., cumulative KCDR and atmospheric CO2, show a general increase in seagrass contributions with respect to a global decrease in atmospheric CO2 during the Cenozoic (Figure S4).
Nowadays, the role of the oceans as carbon sinks is widely documented (Duarte et al., 2005; McLeod et al., 2011; Fourqurean et al., 2012; Karl et al., 2012). Phytoplankton photosynthesis is one of the mechanism leading to C sequestration through the deposition and burial of the particulate organic material at the ocean floor formed by phytoplankton (Raven and Falkowski, 1999). However, the carbon burial capacity of coastal vegetated habitats (seagrass, mangroves and salt marshes) is 180 times greater than the average burial rate in the open ocean (Duarte et al., 2005), reaching 233 Tg C yr−1 (McLeod et al., 2011), values comparable with the C burial in lakes and peatlands that is about 300 Tg C yr−1 (Dean and Gorham, 1998). Consequently, it is out of question that blue carbon sinks play a key role in the oceanic carbon cycle (Duarte et al., 2005; McLeod et al., 2011; Fourqurean et al., 2012). On the contrary, it is more difficult to prove the role of blue carbon and, more in general, of the ocean as C sink in the fossil record. The obtained data for seagrass are in agreement with the present day role of ocean as natural sink. The obtained values of carbon dioxide sequestration are in the order of atmospheric CO2 fluctuations during glacial cycles (Kohfeld et al., 2005).
By looking at the specific time-points and analyzing each rate of the two curves compared (i.e., cumulative KCDR increase and CO2 decrease, Figure S5) with linear regressions for each time interval, the correspondence decreases to 45%, probably due to the lack of accuracy of CO2 data from 65 to 41–34 Ma. In addition, after the Late Miocene (5 Ma), the lack of correspondence may be due to the development of the Arctic ice cap, marked by decreasing temperature and consequent decreasing atmospheric CO2. The resulting increase of CO2 solubility in ocean seawater, together with the Mediterranean Messinian crisis, probably reduced the seagrass extent.
It should also be noted that the Red Sea syn-rift Miocene evaporatic event and the Mediterranean Messinian salinity crisis were included in our computation of coastlines, although a decreased seagrass productivity is expected in these areas during those specific periods. This means that 4000 km2 of seagrass production in the Red Sea should be neglected in our record, almost from 28 to 5 Ma. In addition, at 5 Ma, we have an over-estimated length of coastlines producing seagrasses in the Mediterranean, so that non-accurate comparisons can be made for the 7–5 and 5–1 time intervals. Focusing on those key-time intervals, for which CO2 data are well constrained (e.g., from 41 to 7 Ma) the global correspondence rises up to 66% except for the time ranges 23–20 and 20–14 Ma. The most evident shift occurs with the Eocene-Oligocene CO2 decline (Figure 4). Both curves, i.e., increasing cumulative KCDR and decreasing CO2 (Figure 4 and Figure S5), plot on higher rates of the considered time intervals, estimated with linear regressions to be 5.32 ppm Ma−1 and −87.00 ppm Ma−1, respectively (Figure S5). In conclusion, we provide an initial estimate of the contribution of seagrass meadows as C sink since their occurrence at the end of the Cretaceous. We admit that this result might be underestimated due to the simplified models used for coastal length computations, and it would need of more specific regional tectonic investigations and ecological constraints associated with eustatic processes in order to improve the accuracy of seagrass involvement to CO2 decline. However, we are confident that this study represents a valid quantitative and global estimate of C sequestration by seagrass in the geological record since Cretaceous time, to date missing in literature.
Author Contributions
MB, MC, VS, and GM developed the ideas and the methods for this study. GG carried out sampling and laboratory analyses. MC and PP carried out plate tectonic reconstructions and coastline length computations. MB and MC wrote jointly the paper. All the authors discussed extensively the results and the interpretations
Funding
Funding by Sapienza University of Rome and IGAG-CNR.
Conflict of Interest Statement
The authors declare that the research was conducted in the absence of any commercial or financial relationships that could be construed as a potential conflict of interest.
Acknowledgments
Discussions with Marco Ligi and Fabio Trippetta were appreciated. Many of the figures were made with the Generic Mapping Tools of Wessel and Smith (1995) (http://gmt.soest.hawaii.edu/). Criticisms by two reviewers and A. Editor Cody Sheik greatly improved the manuscript.
Supplementary Material
The Supplementary Material for this article can be found online at: https://www.frontiersin.org/article/10.3389/fenvs.2016.00072/full#supplementary-material
References
Allen, M. B., and Armstrong, H. A. (2008). Arabia-Eurasia collision and the forcing of mid Cenozoic global cooling. Paleoecol. Palaeogeogr. Palaeocl. 265, 52–58. doi: 10.1016/j.palaeo.2008.04.021
Arnaud-Haond, S., Duarte, C. M., Diaz-Almela, E., Marbà, N., Sintes, T., and Serrão, E. A. (2012). Implications of extreme life span in clonal organisms: millenary clones in meadows of the Threatened Seagrass: Posidonia oceanica. PLoS ONE 7:e30454. doi: 10.1371/journal.pone.0030454
Beerling, D. J., and Royer, D. L. (2011). Convergent cenozoic CO2 history. Nat. Geosci. 4, 418–420. doi: 10.1038/ngeo1186
Brandano, M., Frezza, V., Tomassetti, L., Pedley, M., and Matteucci, R. (2009). Facies analysis and palaeoenvironmental interpretation of the Late Oligocene Attard Member (Lower Coralline Limestone Formation), Malta. Sedimentology 56, 1138–1158. doi: 10.1111/j.1365-3091.2008.01023.x
Canals, M., and Ballesteros, E. (1997). Production of carbonate particles by phytobenthic communities on the Mallorca-Menorca shelf, northwestern mediterranean sea. Deep Sea Res. II, 44, 611–629. doi: 10.1016/s0967-0645(96)00095-1
Charpy-Roubaud, C., and Sournia, A. (1990). “The comparative estimation of phytoplanktonic, microphytobenthic and macrophytobenthic primary production in the oceans,” in Microalgal Growth: Inputs and Losses, Practical Approaches: Marine Microbial Food Webs, eds S. Y. Maestrini and F, Rassoulzadegan (Rome: Sapienza Press), 31–57.
Ćosović, V., Drobne, K., and Moro, A. (2004). Paleoenvironmental model for Eocene foraminiferal limestones of the Adriatic carbonate platform (Istrian Peninsula). Facies 50, 61–75. doi: 10.1007/s10347-004-0006-9
Črne, A. E., Weissert, H., Goričan, Š., and Bernasconi, S. M. (2011). A biocalcification crisis at the Triassic-Jurassic boundary recorded in the Budva Basin (Dinarides, Montenegro). Geol. Soc. Am. Bull. 123, 40–50. doi: 10.1130/B30157.1
Darroch, S. A., Locatelli, E. R., McCoy, V. E., Clark, E. G., Anderson, R. P., Tarhan, L. G., et al. (2016). Taphonomic disparity in foraminifera as a paleo-indicator for seagrass. Palaios 31, 242–258. doi: 10.2110/palo.2015.046
Dean, W. E. (1974). Determination of carbonate and organic matter in calcareous sediments and sedimentary rocks by loss on ignition: comparison with other methods. J. Sed. Petrol. 44, 242–248.
Dean, W. E., and Gorham, E. (1998). Magnitude and significance of carbon burial in lakes, reservoirs, and peatlands. Geology 26, 535–538.
den Hartog, C. (1970). The sea-grasses of the World. North-Holland Publ. Co: Verh kon Ned Akad Wet Afd Natuurkundem 59, 275.
den Hartog, C., and Polderman, P. J. G. (1975). Changes in the seagrass populations of the Dutch Wadden Zee. Aquat. Bot. 1, 141–147.
Duarte, C. M., Kennedy, H., Marbà, N., and Hendriks, I. (2013). Assessing the capacity of seagrass meadows for carbon burial: current limitations and future strategies. Ocean Costal Manage 83, 32–38. doi: 10.1016/j.ocecoaman.2011.09.001
Duarte, C. M., Marbà, N., Gacia, E., Fourqurean, J. W., Beggins, J., Barròn, C., et al. (2010). Seagrass community metabolism: assessing the carbon sink capacity of seagrass meadows. Glob. Biogeochem. Cycles 24:GB4032. doi: 10.1029/2010GB003793
Duarte, C. M., Middelburg, J. J., and Caraco, N. (2005). Major role of marine vegetation on the oceanic carbon cycle. Biogeoscences 2, 1–8. doi: 10.5194/bg-2-1-2005
Erba, E., Bottini, C., Weissert, H., and Keller, C. E. (2010). Calcareous nannoplankton response to surface water acidification around Oceanic Anoxic Event 1a. Science 329, 428–432. doi: 10.1126/science.1188886
Fourqurean, J. W., Duarte, C. M., Kennedy, H., Marbà, N., Holmer, M., Mateo, M. A., et al. (2012). Seagrass ecosystems as a globally significant carbon stock. Nat. Geosci. 5, 505–509. doi: 10.1038/ngeo1477
Green, E. P., and Short, F. T. (2003). World Atlas of Seagrasses. Prepared by the UIMEP World Conservation Monitoring Centre. Berkeley, CA: University of California Press.
Hönisch, B., Ridgwell, A., Schmidt, D. N., Thomas, E., Gibbs, S. J., Sluijs, A., et al. (2012). The geological record of ocean acidification. Science 335, 1058–1063. doi: 10.1126/science.1208277
Ivany, L. C., Portell, R. W., and Jones, D. S. (1990). Animal-plant relationships and paleobiogeography of an Eocene seagrass community from Florida. Palaios 5, 244–258. doi: 10.2307/3514943
James, N. P., Bone, Y., Brown, K. M., and Cheshire, A. (2012). “Calcareous epiphyte production in cool-water carbonate seagrass depositional environments; Southern Australia,” in Perspectives in Carbonate Geology: A Tribute to the Career of Robert Nathan Ginsburg (London: Special Publication 41 of the IAS), 123–148.
Karl, D. M., Church, M. J., Dore, J. E., Letelier, R. M., and Mahaffey, C. (2012). Predictable and efficient carbon sequestration in the North Pacific Ocean supported by symbiotic nitrogen fixation. Proc. Natl. Acad. Sci. U.S.A. 109, 1842–1849. doi: 10.1073/pnas.1120312109
Kennedy, H., Beggins, J., Duarte, C. M., Fourqurean, J. W., Holmer, M., Marbà, N., et al. (2010). Seagrass sediments as a global carbon sink: isotopic constraints. Glob. Biogeochem. Cycles 24:GB4026. doi: 10.1029/2010GB003848
Kohfeld, K. E., Le Quéré, C., Harrison, S. P., and Anderson, R. F. (2005). Role of marine biology in glacial-interglacial CO2 cycles. Science 308, 74–78. doi: 10.1126/science.1105375
Langer, M. R. (1988). Recent epiphytic foraminifera from Vulcano (Mediterranean Sea). Rev. Paléobiol. BENTHOS'86 Special 2, 827–832.
Larkum, A. W. D., Orth, R. J., and Duarte, C. M. (2006). Seagrasses: Biology, Ecology and Conservation. Dordrecht: Springer, 691.
Lo Iacono, C., Mateo, M. A., Gràcia, E., Guasch, C. R., Serrano, L., and Dañobeitia, J. (2008). Very high-resolution seismo-acoustic imaging of seagrass meadows (Mediterranean Sea): implications for carbon sink estimates. Geophys. Res. Lett. 35:L18601. doi: 10.1029/2008GL034773
Mateu-Vicens, G., Box, A., Deudero, S., and Rodríguez, B. (2010). Comparative analysis of epiphytic foraminifera in sediments colonized by seagrass Posidonia oceanica and invasive macroalgae Caulerpa spp. J. Foramin. Res. 40, 134–147. doi: 10.2113/gsjfr.40.2.134
Mateu-Vicens, G., Brandano, M., Gaglianone, G., and Baldassarre, A. (2012). Seagrass-meadow sedimentary facies in a mixed siliciclastic–carbonate temperate system in the Tyrrhenian Sea (Pontinian Islands, Western Mediterranean). J. Sediment Res. 82, 451–463. doi: 10.2110/jsr.2012.42
Mateu-Vicens, M., Hallock, P., and Brandano, M. (2008). A depositional model and paleoecological reconstruction of the lower Tortonian distally steepened ramp of Menorca (Balearic Islands, Spain). Palaios 23, 465–481. doi: 10.2110/palo.2007.p07-061r
McLeod, E., Chmura, G. L., Bouillon, S., Salm, R., Björk, M., Duarte, C. M., et al. (2011). A blueprint for blue carbon: toward an improved understanding of the role of vegetated coastal habitats in sequestering CO2. Front. Ecol. Environ. 9, 552–560. doi: 10.1890/110004
Nellemann, C., Corcoran, E., Duarte, C. M., Valdés, L., De Young, C., Fonseca, L., et al. (2009). Blue Carbon. A Rapid Response Assessment. Arendal: GRID-Arendal: United Nations Environment Programme.
Nelsen, J. E., and Ginsburg, R. N. (1986). Calcium carbonate production by epibionts on thalassia in florida bay. J. Sediment. Petrol. 56, 622–628.
Perry, C. T., and Beavington-Penney, S. J. (2005). Epiphytic calcium carbonate production and facies development within sub-tropical seagrass beds, Inhaca Island, Mozambique. Sediment Geol. 174, 161–176. doi: 10.1016/j.sedgeo.2004.12.003
Rasheed, M. A. (2004). Recovery and succession in a multi-species tropical seagrass meadow following experimental disturbance: the role of sexual and asexual reproduction. J. Exp. Mar. Biol. Ecol. 310, 13–45. doi: 10.1016/j.jembe.2004.03.022
Raven, J. A., and Falkowski, P. G. (1999). Oceanic sinks for atmospheric CO2. Plant Cell Environ. 22, 741–755.
Reich, S., Di Martino, E., Todd, J. A., Wesselingh, F. P., and Renema, W. (2015). Indirect paleo-seagrass indicators (IPSIs): a review. Earth Sci. Rev. 143, 161–186. doi: 10.1016/j.earscirev.2015.01.009
Royer, D. L., Pagani, M., and Beerling, D. J. (2012). Geobiological constraints on Earth system sensitivity to CO2 during the Cretaceous and Cenozoic. Geobiology 10, 298–310. doi: 10.1111/j.1472-4669.2012.00320.x
Seton, M., Müller, R. D., Zahirovic, S., Gaina, D., Torsvik, T., Shepard, G., et al. (2012). Global continental and ocean basin reconstructions since 200 Ma. Earth Sci. Rev. 113, 212–270. doi: 10.1016/j.earscirev.2012.03.002
Short, F. T., Carruthers, T., Dennison, W., and Waycott, M. (2007). Global seagrass distribution and diversity: a bioregional model. J. Exp. Mar. Biol. Ecol. 350, 3–20. doi: 10.1016/j.jembe.2007.06.012
Short, F. T., Koch, E., Creed, J. C., Magalhaes, K. M., Fernandez, E., and Gaeckle, J. L. (2006). SeagrassNet monitoring across the Americas: case studies of seagrass decline. Mar. Ecol. 27, 277–289. doi: 10.1111/j.1439-0485.2006.00095.x
Short, F. T., and Wyllie-Echeverria, S. (1996). Natural and human-induced disturbances of seagrass. Environ. Conserv. 23, 17–27.
Spalding, M., Taylor, M., Ravilious, C., Short, F., and Green, E. (2003). “Global overview: the distribution and status of seagrasses,” in World Atlas of Seagrasses, eds E. P Green and F. T. Short (Berkeley, CA: University of California Press), 5–26.
Tomassetti, L., Benedetti, A., and Brandano, M. (2016). Middle Eocene seagrass facies from Apennine carbonate platforms (Italy). Sediment. Geol. 335, 136–149. doi: 10.1016/j.sedgeo.2016.02.002
Tomás, S., Frijia, G., Bömelburg, E., Zamagni, J., Perrin, C., and Mutti, M. (2016). Evidence for seagrass meadows and their response to paleoenvironmental changes in the early Eocene (Jafnayn Formation, Wadi Bani Khalid, N Oman). Sediment. Geol. 341, 189–202. doi: 10.1016/j.sedgeo.2016.05.016
Trenberth, K. E., and Smith, L. (2005). The mass of the atmosphere: a constraint on global analyses. J. Clim. 18, 864–875. doi: 10.1175/jcli-3299.1
Vélez-Juarbe, J. (2014). Ghost of seagrasses past: using sirenians as a proxy for historical distribution of seagrasses. Palaeogeogr. Palaeoclimatol. Palaeoecol. 400, 41–49.
Wanless, H. R. (1981). Fining-upwards sedimentary sequences generated in seagrass beds. J. Sediment. Res. 51, 445–454.
Waycott, M., Duarte, C. M., Carruthers, T. J. B., Orth, R. J., Denninson, W. C., Olyarnik, S., et al. (2009). Accelerating loss of seagrasses across the globe threatens coastal ecosystems. Proc. Natl. Acad. Sci. U.S.A. 106, 12377–12381. doi: 10.1073/pnas.0905620106
Weissert, H., and Erba, E. (2004). Volcanism, CO2 and palaeoclimate: a Late Jurassic–Early Cretaceous carbon and oxygen isotope record. J. Geol. Soc. 161, 695–702.
Wessel, P., and Smith, W. H. (1995). The Generic Mapping Tools, GMT, Version 3: Technical Reference and Cookbook. Manoa: School of Ocean and Earth Science and Technology, University of Hawaii at Manoa.
Willenbring, J. K., and von Blanckenburg, F. (2010). Long-term stability of global erosion rates and weathering during late-Cenozoic cooling. Nature 465, 211–214. doi: 10.1038/nature09044
Keywords: seagrass, atmospheric CO2, cenozoic, plate reconstructions, coast
Citation: Brandano M, Cuffaro M, Gaglianone G, Petricca P, Stagno V and Mateu-Vicens G (2016) Evaluating the Role of Seagrass in Cenozoic CO2 Variations. Front. Environ. Sci. 4:72. doi: 10.3389/fenvs.2016.00072
Received: 13 July 2016; Accepted: 24 October 2016;
Published: 11 November 2016.
Edited by:
Cody Springer Sheik, University of Minnesota Duluth, USACopyright © 2016 Brandano, Cuffaro, Gaglianone, Petricca, Stagno and Mateu-Vicens. This is an open-access article distributed under the terms of the Creative Commons Attribution License (CC BY). The use, distribution or reproduction in other forums is permitted, provided the original author(s) or licensor are credited and that the original publication in this journal is cited, in accordance with accepted academic practice. No use, distribution or reproduction is permitted which does not comply with these terms.
*Correspondence: Marco Brandano, marco.brandano@uniroma1.it