Modeling the Disintegration Process in Anaerobic Digestion of Tannery Sludge and Fleshing
 Cecilia Polizzi
 Felipe Alatriste-Mondragón
 Giulio Munz
- 1Department of Civil and Environmental Engineering, University of Florence, Florence, Italy
- 2Department of Environmental Science, Instituto Potosino de Investigación Cientifica y Tecnologica, San Luis Potosí, Mexico
Mathematical modeling of anaerobic digestion (AD) is widely acknowledged as a powerful tool to v of the process and to support full-scale plant design, operation and optimization. In this work, a modified version of the IWA-ADM1 model is proposed to simulate the AD of tannery primary sludge (TPS) and fleshing, with special emphasis on the disintegration formulation. Multiple batch tests were performed at different inoculum/substrate VS-mass ratio, in order to evaluate the biodegradability of the two substrates and to provide experimental data for modeling purposes. Beside the necessary adjustments of substrates' COD fractionation, the structure modifications of the model focused on the disintegration and hydrolysis. The Contois Monod-based model was adopted to describe disintegration kinetics and the results were compared to the traditionally adopted first-order kinetic. The fate of particulate matter generated from biomass lysis was also questioned and a new model variable was introduced to account for cellular lysis products. Finally, a further modification differentiated substrate particulate matter into a readily and a slowly hydrolysable fraction. Batch tests confirmed that TPS and fleshing are suitable substrates for AD, exhibiting specific methane productions of: 0.26 ± 0.06 and 0.47 ± 0.05 Nm3 Kg−1 VS, respectively. Modeling results showed that the proposed modifications were crucial for successful simulation of experimental data referring to fleshing, whereas did not have a significant effect on the results related to primary sludge degradation. This work is the first application of an IWA-ADM1-based model to AD of tannery waste.
Introduction
Leather industry comprises a chain of processes required to transform raw animal hides into the finished product. A large amount of tannery wastewater and of solid waste is generated throughout the process, especially in the highly water-demanding pre-tanning phases. Dedicated wastewater treatment plants are often conceived to treat tannery pollutant load, characterized by high concentrations of organic matter (including recalcitrant compounds), ammoniacal nitrogen, sulfide and salts (Mannucci et al., 2010). Tannery fleshing (TF) represents the main solid waste; it originates from the removal of animal tissue from the raw hide, usually after liming process (de-haring phase). Tannery primary sludge (TPS) and TF has been traditionally disposed in landfill or incinerated. In the last decades, new stringent regulations and environmental policies have been encouraging alternative eco-friendly treatments, worldwide. Among them, anaerobic digestion (AD) has been acknowledged as a valuable solution for the treatment of a wide variety of organic waste, whose multiple advantages range from waste volume reduction to renewable energy production and cost-effective management. AD of tannery-originated wastes found its first applications in the late 80's (Cenni et al., 1982); since then, various studies have been conducted to evaluate the actual suitability of such organic wastes to AD. In developing countries, where tanning industry plays a prominent role within the local economy, AD turns very attractive to handle the massive waste production due to the relevant reduction of solids to be disposed and possible pay-back in terms of energy/heat production. Some of the reported studies on AD of tannery wastes refer to industrial districts in Asia (Vasudevan and Ravindran, 2007; Thangamani et al., 2010; Sri Bala Kameswari et al., 2014), Latin America (López et al., 2015; Ruiz-Aguilar et al., 2015; Priebe et al., 2016) and Northern Africa (Zerdani et al., 2004). The majority of this works were oriented toward co-digestion of untanned solid wastes with other organic substrates in order to face/prevent possible problems of unbalanced C/N ratio as well as inhibitory conditions from ammonia, long chain fatty acids and sulfide accumulation (Dhayalan et al., 2007; Shanmugam and Horan, 2009; Zupancic and Jemec, 2010; Giaccherini et al., 2016).
Mathematical models support and continuously update knowledge on process understanding, while promoting technological transfer from the research world to the industry and vice versa (Batstone et al., 2002). Modeling may be very useful when dealing with highly complex processes as AD. At real-scale applications, many factors, related to substrate nature and operational conditions, can interact and dramatically affect process performances. Thus, the predictive capacity of a reliable simulation model represents a powerful tool in plant designing, optimization and management (Batstone et al., 2002). The IWA AD Model n. 1 (ADM1) was published in 2002. Its original formulation presents several process simplifications and is intended to simulate municipal sludge degradation. Therefore, necessary model adjustments are required when simulating AD of different substrates such as industrial wastes. The model structure describes AD as a chain-reaction comprising the following steps: disintegration, hydrolysis, acidogenesis, acetogenesis, and methanogenesis. COD fractionations differs from the classical one applied in the IWA-ASMs series as the particulate COD is lumped into a complex fraction, Xc, a pool of particulate organics gathering both particulate substrates and biomass decay by-products. This fraction undergoes the preliminary disintegration step and results in the formation of unbiodegradable (inert) COD, both in its soluble and particulate form, SI and XI, and biodegradable macro components of: proteins, lipids and carbohydrates (Xpr, Xli, Xch). Disintegration stoichiometry is defined by the parameters fXI, fSI, fpr, fli, fch, referred to the variable Xc. The subsequent hydrolysis step concerns biodegradable macrocompounds only, that are degraded into their corresponding soluble components: amminoacids, Saa, long chain fatty acids, Sfa, and monosaccharides, Ssu, respectively. The intermediate acidogenic and acetogenic phases model the production of propionate, butyrate, valerate and acetate. Eventually, two parallels methanogenic phases represent biogas production on acetate and hydrogen (parallel acetoclastic and hydrogenophilic paths). The biomass groups included in the model are: acidogenic, acetogenic, hydrogenotrofic and acetoclastic methanogenic microorganisms. Among process simplifications, first order disintegration/hydrolysis is often argued as unsuitable for many real-scale applications (Vavilin et al., 2008; Yasui et al., 2008; Ramirez et al., 2009). Since disintegration and hydrolysis are usually considered as the rate limiting step in AD (Eastman and Ferguson, 1981), the proposed and traditionally adopted formulation for disintegration is a first-order kinetic with respect to the particulate matter, according to the following expression:
with Xc being the complex particulate matter (gCODm−3) and kdis the first order kinetic rate (d−1). A first criticism points out that such an approach does not account for the actual biological nature of enzymatic hydrolysis, neglecting the dependency on biomass concentration or, more precisely, on the substrate/biomass concentration ratio (Ramirez et al., 2009). The reported values of disintegration and hydrolysis rates vary widely since they are strongly affected by experimental conditions (e.g., temperature, I/S ratio, biomass acclimation) and substrate characteristics (e.g., composition, solid content, particle size), beside the fact that some simplified models lump together disintegration and hydrolysis, accounting for a cumulative effect of the various process taking place in particle solubilization, and widening the range of reported values as discussed by Vavilin et al. (2008). These authors reported an overview on hydrolysis kinetics models and applications available in the literature. With regard to complex solids, they highlight the dependency of hydrolysis rate on substrate's biodegradability, which, in turn, depends on its composition in terms of carbohydrates, proteins and lipids. In the same review, the two-phase model and the Contois model are indicated to provide good fit of experimental data for a wide range of complex particulate organic waste, when the enzymatic (i.e., biological) dependency of the hydrolysis rate is witnessed by methane production curves showing a typical sigmoidal shape. Moreover, the two formulations can be considered as general models since they both tend to a 1st order kinetic when biomass-to-substrate ratio is sufficiently high. In the two-phase model, the first phase refers to biomass colonization of the particulate substrate surface—the rate varying according to the available substrate's surface—whereas the second one takes place at a constant rate once the surface has been completely covered with bacteria. On the other hand, the Contois model provides a Monod-based reactions with respect to the substrate to biomass ratio, with the following mathematical expression:
where km, dis (d−1) is the maximum disintegration rate and ks, dis (gCODgCOD−1) is the half-saturation coefficient for both the biomass, Xbiom, and the particulate matter, Xc. Such a model describes the substrate-to-biomass ratio (instead of the sole substrate) as the actual limiting factor, representing the actual mass transfer limitation due to both hydrolytic biomass concentration and to substrate surface availability (Mottet et al., 2013). Another limiting assumption of default ADM1 relates to the fate of particulate matter generated from biomass decay. The ADM1 assumes that this fraction returns directly to the complex particulate pool, lumped in the fraction Xc. Such mechanism is reasonable when dealing with secondary sludge AD, as the substrate and the active biomass show comparable composition (mainly biomass) and physical characteristics (colloidal nature), but fails in theoretical rigor when the substrates have completely different nature (Huete et al., 2006; Yasui et al., 2008).
In this study, we focused on the characterization of the disintegration step in order to simulate batch experimental results on anaerobic degradation of TPS and TF. Batch tests provide baseline information on waste methane potential and process kinetics by adopting even simple experimental apparatus in a relatively short time lapse, if compared with continuous experiments. Modeling of batch experimental data allows for the definition of the main required kinetic parameters to be adopted as first estimation for further simulation of continuous or full-scale systems (Donoso-Bravo et al., 2011). The aim of this study was to modify, on the basis of batch tests results, the ADM1 in order to better represent experimental biodegradability results of TPS and TF, with special emphasis on the disintegration-hydrolysis step. To best of our knowledge, this is the first work on the application of IWA-ADM1-based models on tannery wastes as sole substrates for lab-scale AD tests.
Materials and Methods
Experimental Set-Up
Wastes were collected from the tannery district of León (Guanajuato, Mexico), which represents the largest one in Mexico (Blackman and Sisto, 2005). TPS is produced in a chemical primary sedimentation tank in the tannery WWTP of León. In the plant, polyelectrolytes are added to enhance solid precipitation together with sulfuric acid for pH adjustment. TF was provided by a commercial tannery, after liming process. As inoculum, granular sludge was collected from a UASB digester treating tequila vinasses (Casa Herradura, Amatitán, Jalisco, México) and used in all the tests. After collection, tannery wastes and seed sludge where stored at 4°C.
Two batch experiments were performed in 120 ml serum bottles: Experiment 1 for TPS and Experiment 2 for TF. Each experiment comprised a set of five parallel tests, run in triplicate as described in Table 1. Tests A, B and C had inoculum:substrate VS-mass ratios of: 1:1; 2,5:1 and 5:1, respectively. Test D was run as positive control (with acetate addition) and test E as blank control (inoculum only). The quantity of acetate (as sodium acetate) added in test D was defined in order to have equivalent COD load of test B. All the tests had the same initial inoculum concentration. Prior to be used as inoculum, seed sludge was re-activated by the addition of sodium acetate and kept at room temperature for a few days. Acetate concentration in the supernatant was monitored until its complete depletion. Then, seed sludge granules were rinsed with tap water in order to remove any possible organic residue. Size reduction of TF was achieved by mincing it with a commercial meat miller. Mineral medium (Gomez-Tovar et al., 2012) was added in order to provide optimum conditions for methanogenic activity. Yeast extract was added in the proportion of 100 mg per liter of final volume solution. The serum bottles were filled to obtain a working volume of 70 ml, sealed with rubber stoppers and crimped with aluminum ring. The headspace was flushed with a mixed gas of 80% CO2 and 20% N2 for 5 min. Initial pH was adjusted at 7 with addition of 1M HCl solution. An incubator equipped with rotating plate ensured continuously stirred conditions and mesophilic temperature of 32.5°C. Biogas production was measured regularly through water displacement by purging biogas present in the headspace in an inverted-burette system. The frequency of biogas sampling was decided according to the observed biogas production in order to limit excessive overpressure interference. On average, gas in the bottle headspace was purged (until pressure equilibrium) every 12 or 24 h in the first exponential production phase and every 2–3 days in the low-rate production phase. The experiments were run until biogas production leveled off to the endogenous levels observed in the blank control (biogas production below 1 ml per day).
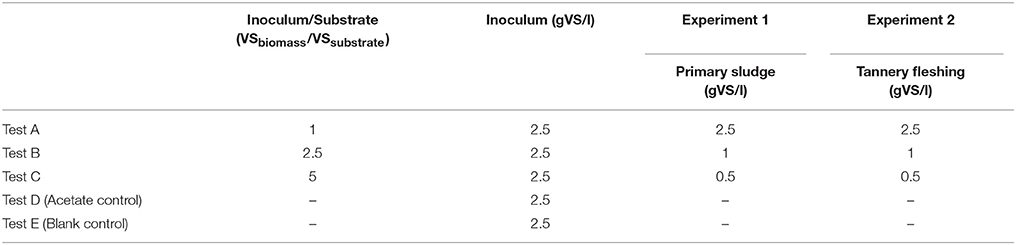
Table 1. Experimental Inoculum/Substrate initial conditions.
Analytical Methods
Analysis of COD, TS, VS were performed according to APHA standard method (APHA-AWWA, 1998); N-NH4+ was measured according to 4500-NH3 F phenate method (APHA-AWWA, 1998). TF was characterized in terms of total proteins (AOAC, 1990), total carbohydrates (NMX-F-312-1978) and total lipids (NMX-F089-1978). Representative homogeneous sample of TF was achieved by mincing around 5 kilos of fleshing. Acetate was analyzed through capillary electrophoresis (Agilent G1600A), prior to sample dilution, filtration and centrifugation at 3,000 rpm. Biogas samples were withdrawn with lock syringe and analyzed though gas-chromatography in order to assess CH4 and CO2 content. The gas chromatograph (Agilent 6850) was equipped with thermal conductivity detector (TCD) and HT PLOT Q packed column, using Nitrogen as carrier gas. The injector, oven and detector temperature were: 250, 70, and 250°C.
Modified ADM1
The first adjustment attempted in the present study refers to the mathematical formulation for disintegration rate. Contois model was implemented and compared with the default 1st order formulation.
A further modification was suggested by observing methane production curves and methane production rates. Indeed, the traditional S-shaped cumulative curves showed the high-rate production laps followed by a second production stage with slower rate, prior to reach the endogenous flat-shaped phase. Due to the solid nature of fleshing and the high solid content of TPS, it was hypothesized that the high-rate and slow-rate methane production phases reflected the degradation of a rapidly and slowly hydrolysable fraction, respectively. Thereby, the complex particulate fraction Xc was simulated split into the new fractions Xc_rapid and Xc_slow, characterized by different disintegration kinetic rates and equal composition (i.e., stoichiometric parameters). A similar approach is reported by Yasui et al. (2008) on municipal primary sludge, Mottet et al. (2013) on treated and untreated waste activated sludge and García-Gen et al. (2015) on fruit and vegetable wastes.
Finally, the ADM1 assumption of recirculating biomass decay by-products into the pool of organic particulate, Xc, was not deemed suitable due to the strong difference between biomass and substrates characteristics. Thereby a new variable, Xc_decay, was introduced to take into account the particulate by-products of cellular lysis, similarly to what assumed in the IWA-ASM3. This variable was assumed to undergo disintegration according to the default ADM1 formulation and stoichiometry. Thereby, default 1st order rate of 0.5 d-1 was used for Xc_decay as well as the default fractionation.
In the present work, we evaluated the following combinations of model modifications in order to assess their influence on the simulated results: (i) Model 1: 1st order disintegration model for the complex variable, Xc (i.e., ADM1 formulation, with calibrated parameters); (ii) Model 2: Contois disintegration model for the complex particulate Xc; (iii) Model 3: 1st order disintegration model for the rapidly and slowly hydrolysable fractions, Xc_slow and Xc_rapid; (iiii) Model 4: Contois disintegration model for the rapidly and slowly hydrolysable fractions, Xc_slow and Xc_rapid. The model adjustment regarding biomass decay by-product's fate was included in all the cases. The results were compared with the default ADM1. Models were implemented using the software Aquasim®. Stoichiometric matrixes for the disitegration process formulations in the four models are provided as Supplementary Material.
Model Initial Conditions
Initial conditions were defined in terms of substrate COD fractionation, with particular focus on the complex fraction Xc, and initial biomass concentration. COD fractionation for TPS was mainly based on COD balance, similarly to what presented in Lubello et al. (2009) and Munz et al. (2008) on tannery wastewater COD fractionation as well as in Mottet et al. (2013). Total COD was divided in soluble and particulate biodegradable fractions, SB and XB, and to soluble and particulate unbiodegradable fractions, SI and XI; the corresponding values were assumed according to the following equations:
The values of total, soluble and particulate COD for the initial and final state (CODIN, CODsoluble, IN, CODparticulate, IN, CODOUT, CODsoluble, OUT and CODparticulate, OUT) and the removed COD, ΔCOD, were available from analytical measurements. Such a COD fractionation lays on two important hypotheses: (1) the biodegradable COD is completely degraded in the experiment; (2) the production of unbiodegradable COD generated as endogenous by-product is negligible compared to the substrate's contribution. These assumptions were deemed far reasonable for the experimental conditions tested and considered during the calibration phase. All the particulate COD was gathered into the fraction Xc, so that initial values for Xli, Xpr, Xch were set equal to zero. The stoichiometric parameters for Xc fractionation on inert COD were defined as follow: fXI = XI /Xc (XI according to Equation 6); fSI = SI/Xc (SI according to Equation 3). Since no information were available on TPS composition in terms of proteins, lipids and carbohydrates, we referred to the values reported by Thangamani et al. (2010) on TPS (proteins: 28.4%TS and lipids 2.6%TS) and by Zupancic and Jemec (2010) on a mixture of tannery primary and secondary sludge (proteins: 9–13% and lipids 5–10%TS). In a first attempt, the biodegradable content of Xc (1− fSI −fXI) was set by assuming the carbohydrate content of TPS to be zero and the proportion between proteins and lipids over the remaining biodegradable part of Xc as an average of the referenced values. For fleshing COD fractionation, a different approach was adopted. Analysis on its composition in terms of protein, carbohydrates (not detected), lipids and inert allowed for a straightforward characterization of the fractions of the TF complex particulate Xc. As protein and lipid concentration were expressed in terms of %TS, their values were converted into COD according to the values reported in Angelidaki and Sanders (2004). The remaining COD was ascribed to XI.
Concerning the starting values for the rapidly and slowly hydrolysable fractions, it was assumed that their percentage was the same of the observed high-rate and slow-rate production shares of the total methane production. For each of the two substrates, the same stoichiometric parameters were used for the disintegration of Xc, Xc_rapid, and Xc_slow. In order to focus on the identification of the parameters related to the disintegration process, the values for the initial biomass concentration were estimated by calibrating methane production of acetate control tests only. It was assumed that only a share of the input seed-sludge COD was to be ascribed to the fraction of actually active biomass. Thereby, the parameter factive was introduced to calibrate this percentage based on the methanogenic activity observed in the acetate test. The calibrated value for factive was applied to all the parallel tests run in each of the two experiments. Since no information were available on inoculum biomass populations, the distribution proposed by Souza et al. (2013) was adopted. The Aquasim® optimization tool was used to calibrate the parameters, the objective function being the least square between simulated and experimental methane production data. Confidence intervals were qualitatively identified by calibrating model parameters for each of the three I/S tests, whose specific optimum values varied slightly. The final values were obtained through calibration on test A (having the highest substrate concentration, likely to provide not limiting conditions), validation on tests B and C and final iterative visual recalibration on the three tests, by “trial-and-error.”
Results
Batch Tests
Results on substrate characterization in terms of TS, VS, COD, and pH are reported in Table 2. TPS showed a high solid content of 14.4%, a concentration of ammonia of 2.18 gN-NH3/l and neutral pH. The protein and fat content on a dry-weight base of TF were 71.4 and 12.6%, respectively; the remaining 16% was constituted by inorganic material. These values are comparable with those reported by Thangamani et al. (2010) (protein 56.5%; fat 4.79%) and Zerdani et al. (2004) (protein 79%; fat 7.57%).
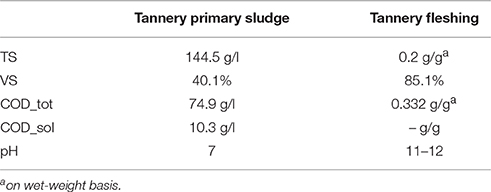
Table 2. Substrate characteristics.
Inoculum activity shown in the positive control test was comparable in both experiments, showing specific methane production of 0.28 ± 0.01 and 0.31 ± 0.04 Nm3_CH4/kgCODadd for Experiments 1 and 2, respectively. Methane production curves exhibit similar patterns for the I/S ratios (test A to C), both for TPS and TF, as reported in Figures 1A,B. Noting that each test had the same initial inoculum concentration and a decreasing concentration of substrate from test A to test C, it can be observed that the final methane production, corrected with the endogenous methane production (blank test), was proportional to the initial substrate concentration. This outcome suggests that no inhibition occurred during the experiments and the organic matter with bio-methane potential was completely degraded. Specific methane production was comparable within the three ratios for both the substrates, with values of 0.26 ± 0.06 Nm3_CH4/kgVSadd for TPS and 0.47 ± 0.05 Nm3_CH4/kgVSadd for TF. Ammonia concentration at the end of Experiment 1 ranged from 0.076 of test A to 0.125 gN-NH3/l of test C, reflecting the higher input load of the test with higher TPS initial load. In Experiment 2, ammonia concentration was similar in all the tests, with 0.31 ± 0.02 gN-NH3/l as average value. Due to the protein-rich composition of fleshing, ammonia inhibition is reported by many authors as possible drawback of anaerobically treating such a waste (Chen et al., 2008; Kovács et al., 2013; Rajagopal et al., 2013). Nevertheless, this was not the case in our experiments due to the relatively low concentration of substrate that never lead to inhibitory condition from ammonia. Thereby, both TPS and TF showed to be suitable for AD in the range of I/S ratio and organic load tested, in line with results available in literature.

Figure 1. Methane production curves for (A) tannery primary sludge and (B) fleshing ( I:S = 1:1;
  I:S = 2.5:1;
  I:S = 5:1).
Model Results
Figures 2, 3 show model results for test A to D of Experiment 1 (TPS) and Experiment 2 (TF), respectively. The starting point of the calibration procedure was the characterization of active biomass, expressed by the parameter factive. The calibrated values for factive were 13% for Experiment 1 and 16% for Experiment 2. As presented in the graphs referred to the acetate control, these values well fitted methane production curves of tests D, in both experiments. Curves resulting from factive extreme values of 1 and 80% are also reported to highlight the high sensitivity of model results on the active biomass simulated in the system. For both substrates, it was necessary to re-calibrate the inert content of Xc. For TF tests, the initial fractionations lead to overestimation of the final methane production. Thereby, fXI was increased in order to match the observed methane values and fpr reduced proportionally. Conversely, final methane productions were underestimated by models for TPS tests. In this latter case, TPS fXI fraction was arbitrarily reduced and the corresponding COD ascribed to fch (originally set equal to zero). The carbohydrate content was not included in TF composition according to the available results on substrate composition, whereas it was considered reasonable to include a fch fraction for TPS, though its composition was not available in terms of macro-compounds. The final calibrated values for the stoichiometric coefficient referring to Xc fractionation for TF and TPS are presented in Table 3. Kinetic parameters for each of the four models adopted as well as the percentage of the rapidly and slowly hydrolysable fractions for TPS and TF, are reported in Table 4.
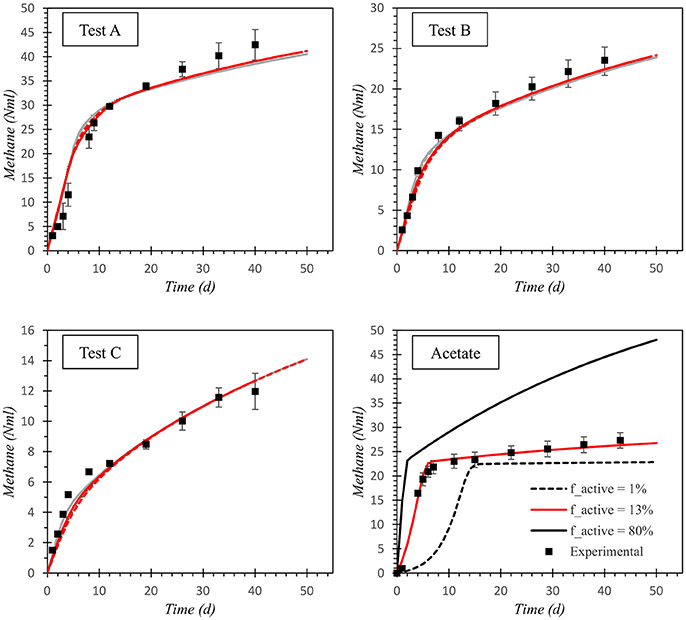
Figure 2. Simulation results for Experiment 1, with Tannery Primary Sludge ( Default ADM1;
  1st order disintegration;
  Contois disintegration;
  Rapid/Slow_1st order Disintegration;
  Rapid/Slow_Contois Disintegration;
  Experimental).
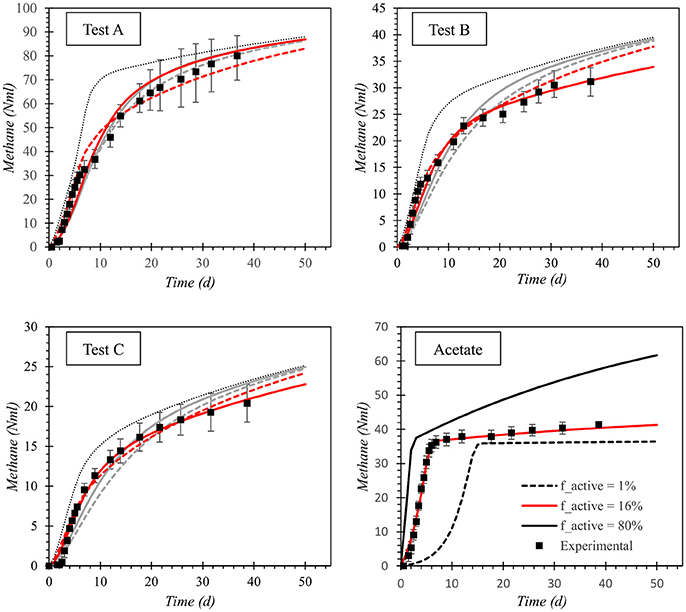
Figure 3. Simulation results for Experiment 2, with Tannery Fleshing ( Default ADM1; 1st order disintegration; Contois disintegration; Rapid/Slow_1st order Disintegration; Rapid/Slow_Contois Disintegration; Experimental).
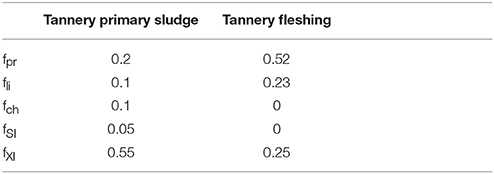
Table 3. Stoichiometric parameters for the disintegration step of TPS and TF.
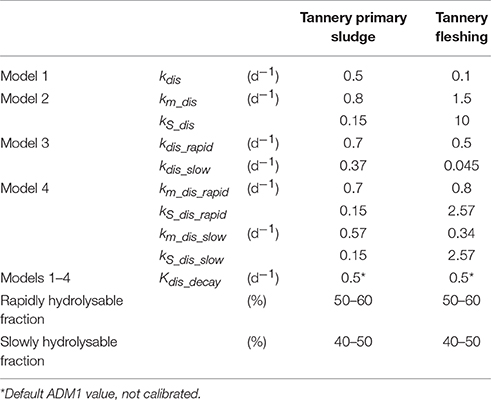
Table 4. Calibrated parameters for disintegration in Experiment 1 and Experiment 2.
Graphs referring to test A to C in Figure 2 show that model modifications did not have a significant impact on the simulation capacity of the model for TPS results, as all the models, including the default ADM1, are able to properly reproduce the experimental results for the three I/S tested. Conversely, model outcomes differ significantly for TF results. All the models, 1–4, allows for good accuracy when parameters are calibrated on test A (I/S = 1). Specifically, Model 3 (1st order kinetic for Xc_rapid and Xc_slow) exhibited the best performance in simulating the high-rate and low-rate phases of test A, whereas Model 2 (Contois kinetic for Xc) seemed to be the worst performing one. However, when the calibrated parameters are validated on the tests B and C, with different I/S ratios, models' accuracy differed notably, the worst data fitting showed for test B. The simulated curves shown in Figures 1, 2 are obtained with the final kinetic parameters obtained in the second re-calibration step on the three I/S curves, for each of the two substrates (Table 4).
Discussion
Figures on specific methane production of TPS and TF (0.26 ± 0.06 Nm3_CH4/kgVSadd and 0.47 ± 0.05 Nm3_CH4/kgVSadd, respectively) indicate the significantly higher biodegradability of fleshing volatile solids in comparison with primary sludge, since VS-substrate quantities were the same for the two experiments. However, it should be noted that TPS is characterized by strong variations in terms of solid and pollutant content, due to the relevant fluctuations in tannery wastewater characteristics. Indeed, tanneries' industrial activity varies over the week as well as over the year. Observed methane yield from both substrates are in line with those reported in literature, although, very few works are available on batch AD of sole TF and TPS. Zupancic and Jemec (2010) performed biomethane potential tests on TF at 37°C, obtaining a methane production of 0.55 Nm3_CH4/kgVS. Thangamani et al. (2010) reported 0.263–0.483 Nm3_CH4/kgVSadd for the co-digestion of TF and TPS (at different substrate/inoculum ratios) at 30°C; López et al. (2015) performed batch biodegradability test for a mixture of ruminal content, TF and thickened secondary sludge generated in a WWTP treating oil factory wastewater, in a volumetric ratio of 4:2:1, obtaining 0.487 ± 37 CH4/kgVSrem.
Concerning modeling results, curves on acetate simulations (Figures 2, 3) clearly indicate model high sensitivity to the initial biomass concentration at controlled conditions and not limiting concentrations for substrate. At the calibrated values, curve fitting is very good both at initial exponential production as well as at the endogenous phase. Proper characterization of active biomass, i.e., of the actual inoculum/substrate ratio in the model, is often a challenging task/exercise when dealing with batch systems due to the high sensitivity of batch simulation to initial conditions. It has to be noted that this fraction referred to the same seed sludge may vary according to operational conditions, biomass acclimation or affinity to a given substrate. In this work, we decided to calibrate this fraction on the positive control test (Test D) of the two experiments and to assume the same value for all the parallel tests. This assumption is considered reasonable since the biomass was not acclimated and the operational conditions were the same for all the tests.
Graphs referring to test A to C in Figure 2 show that model modifications did not have a significant impact on the simulation capacity of the model for TPS results, as the simulated curves referring to the proposed models almost overlaps for all of the three tests. Although the default ADM1 already provided a well-fitting of the trend of the observed data, a slight improvement can be observed when adopting the Contois model for the complex variable Xc. Thus, no significant improvement seemed to be gained from the differentiation in rapidly and slowly hydrolysable matter and the default ADM1 formulation proved adequate for TPS anaerobic degradation. On the contrary, results regarding TF simulations indicate that almost all the models exhibited better simulations, when compared with the default ADM1 (Figure 3). Both the 1st order and the Contois models proved to fail in accuracy when applied to the complex particulate fraction Xc (Model 1 and 2), since underestimation of the initial production rate was observed for test B and C. Model 3 and Model 4, that differentiate the complex Xc into Xc_rapid and Xc_slow, showed the best results on all of the three tests, even if Model 3 was not able to represent the slow-rate methane production of test B. This evidence suggests an actual dependency of disintegration kinetics on I/S ratio, at least for complex solid substrates. In fact, Model 4, describing Contois disintegration kinetic for the rapidly and slowly hydrolysable fractions, seemed to enables a good representation of the sigmoid pattern for all of the three tests, i.e., of the three I/S ratios.
To the best of our knowledge, there are no available studies reporting about the implementation of ADM1 on tannery wastes, specifically, on TF. López et al. (2015) modeled batch test results on TF and a mixture of TF, ruminal content and secondary sludge, by applying a simplified model for methane production laying on the basic assumption of hydrolysis as limiting step similarly to what proposed in Vavilin et al. (2001). A unique 1st order kinetic with respect to particulate substrate was successfully adopted to account for the overall degradation rate of AD processes, instead of the more complex ADM1. The general 1st order kinetic constants were 0.39, 0.56, 0.98, and 0.89 d-1 for the sole TF, ruminant content, secondary sludge and their mixture, respectively. Although these values cannot be directly compared to our results on disintegration constants, it can be observed that TF performed, in fact, at the lowest production rate in comparison with the other substrates, confirming the necessity to properly characterize its degradation kinetics.
The procedure adopted for the calibration of the rapidly and slowly hydrolysable fractions for Xc on the base of observed differences on methane production rates is in line with other works presented in the literature (Yasui et al., 2008; Mottet et al., 2013; García-Gen et al., 2015). It ought to be considered that such an approach tends to overestimate the rapid fraction, as the biogas produced in the high-rate phase is actually the result of the degradation of both rapidly and slowly hydrolysable fractions. Though, depending on the substrate's nature and on the duration of the two phases, it can be reasonably assumed that the contribution of the slowly hydrolysable fraction is negligible in comparison with the rapid one.
Model modifications of Model 3 are comparable to those proposed by García-Gen et al. (2015), who applied a 1st order kinetic to rapidly and slowly hydrolysable fractions for different organic substrates, mainly fruit and vegetable wastes but also fish-derived waste (protein-rich) and oil-derived wastes (fat-rich). The reported values of 1.4–1.7 and 60 d-1 for the disintegration rate, kdis_slow and kdis_rapid, respectively, are higher than those obtained in our work. Though, experimental conditions and substrates were far different: (i) 6-l reactors were used in batch mode and consecutively fed with the same substrate in order to favor biomass acclimation; (ii) substrate-to-biomass mass ratio were very low (0.08 d-1 compared with those applied in our tests ranging from 0.2 to 1), with high-rate kinetics degrading the input substrate within 3 days; (iii) substrates were highly biodegradable compared to industrial wastes. Moreover, model adjustments regarded also hydrolysis of lipids and carbohydrates, whose rates were set lower than the default ADM1, likely countering the overall effect of higher disintegration rates on the final curve fitting.
Results of model 4 can be compared with those presented in Mottet et al. (2013), as similar model modification were introduced (Contois model for the disintegration of Xc_rapid and Xc_slow). Again, their values of maximum disintegration velocity for Xc_rapid and Xc_slow are much higher than ours (9 and 5.7 d−1) and affinity constants much lower (0.4 and 0.3 kgCOD.m−3). Though, they introduced two new biomass groups accounting for hydrolytic micro-organisms specific for each of the two particulate fractions, whose decay coefficients were set higher than the default ADM1 values (0.2 and 0.4 d−1 instead of 0.04 d−1). Again, such calibrated values are likely to reduce the net kinetic value for disintegration.
According to our results, the introduction of a rapidly and slowly hydrolysable fraction for Xc seemed crucial for a proper representation of TF results. Even if model 4 proved the best performing one, it implies the calibration of 4 kinetic parameters, whereas Model 3 provides sufficiently good results requiring only two kinetic parameters. The selection of the model to be used should be done according to the goal of the simulation exercise and the availability of data. Further work can be attempted in order to improve model reliability in terms of mathematical formulations and parameters. It could be suggested to evaluate AD performance by adopting an acclimated biomass and testing a wider range of I/S values. Scaling up from bench to pilot-scale system is also advisable in order to limit measurements interferences.
Conclusions
Our results show that TPS and TF are suitable substrates for methane production by AD. Particularly, TF exhibited a higher specific methane production of 0.47 ± 0.05 Nm3_CH4/kgVSadd, if compared with the value of TPS, 0.26 ± 0.06 Nm3_CH4/kgVSadd. Modeling outcomes highlight that the default ADM1 provides a good representation of the experimental data related to methane production from TPS. On the contrary, in order to simulate the results from the TF degradation, it was necessary to include a Monod-type disintegration kinetic and differentiate the particulate matter into readily and slowly hydrolysable fractions. These results increase the knowledge on the limiting step of AD and, therefore, provide valuable information on process behavior that can be transferred to further investigations, oriented to full-scale application of AD of tannery sludge and solid wastes.
Author Contributions
GM contributed by designing the experiment. FA contributed by elaborating the experimental results. CP operated and monitored the reacotrs and carried out the simulations.
Funding
This study was supported by the EU MSCA Irses Program (Carbala Project PIRSES-GA-2011-295176).
Conflict of Interest Statement
The authors declare that the research was conducted in the absence of any commercial or financial relationships that could be construed as a potential conflict of interest.
Supplementary Material
The Supplementary Material for this article can be found online at: https://www.frontiersin.org/article/10.3389/fenvs.2017.00037/full#supplementary-material
References
Angelidaki, W., and Sanders, I. (2004). Assesment of the anaerobic biodegradabilty of macropollutants. Rev. Environ. Sci. Bio/technol. 3, 117–129. doi: 10.1007/s11157-004-2502-3
APHA-AWWA (1998). Standard Methods for the Examination of Water and Wastewater, 20th Edn. Washington, DC: American Public Health Association.
AOAC (1990). “Meat and meat products,” in Official Methods of Analysis, Vol. 2., 15th Edn. (Washington, DC: Association of Official Analytical Chemists), 931–948.
Batstone, D. J., Keller, J., Angelidaki, I., Kalyuzhnyi, S. V., Pavlostathis, S. G., and Rozzi, A. (2002). The IWA anaerobic digestion model No. 1 (ADM1). Water Sci. Technol. 45, 65–73.
Blackman, A., and Sisto, N. P (2005). Muddling through While Environmental Regulatory Capacity Evolves: What Role for Voluntary Agreements? Resources for the Future. Availabe online at: http://ageconsearch.umn.edu/bitstream/10570/1/dp050016.pdf
Cenni, F., Dondo, G., and Tombetti, F. (1982). Anaerobic digestion of tannery wastes. Agric. Wastes 4, 241–243. doi: 10.1016/0141-4607(82)90016-6
Chen, Y., Cheng, J. J., and Creamer, K. S. (2008). Inhibition of anaerobic digestion process: a review. Bioresour. Technol. 99, 4044–4064. doi: 10.1016/j.biortech.2007.01.057
Dhayalan, K., Fathima, N. N., Gnanamani, A., Rao, J. R., Nair, B. U., and Ramasami, T. (2007). Biodegradability of leathers through anaerobic pathway. Waste Manage. 27, 760–767. doi: 10.1016/j.wasman.2006.03.019
Donoso-Bravo, A., Mailier, J., Martin, C., Rodríguez, J., Aceves-Lara, C. A., and Vande Wouwer, A. (2011). Model selection, identification and validation in anaerobic digestion: a review. Water Res. 45, 5347–5364. doi: 10.1016/j.watres.2011.08.059
Eastman, J. A., and Ferguson, J. G. (1981). Solubilisation of particulate organic carbon during the acid phase of anaerobic digestion. J. Water Pollut. Control Feder. 53, 352–366.
García-Gen, S., Sousbie, P., Rangaraj, G., Lema, J. M., Rodríguez, J., Steyer, J.-P., et al. (2015). Kinetic modelling of anaerobic hydrolysis of solid wastes, including disintegration processes. Waste Manage. 35, 96–104. doi: 10.1016/j.wasman.2014.10.012
Giaccherini, F., Ricotti, A., Mannucci, A., Mori, G., Alatriste-Mondragon, F., Lubello, C., et al. (2016). Investigation on Anaerobic Co-Digestion of Vegetable Tannery Sludge and Fleshing in Laboratory Scale Experiments. Available online at: http://www.progettometa.it/CmsData/Articoli%20pdf/Investigation%20on%20anaerobic%20co-digestion%20of%20vegetable%20tannery%20sludge%20and%20fleshing%20in%20laboratory%20scale%20experiments.pdf
Gomez-Tovar, F., Celis, L. B., Razo-Flores, E., and Alatriste-Mondragón, F. (2012). Chemical and enzymatic sequential pretreatment of oat straw for methane production. Bioresour. Technolo. 116, 372–378. doi: 10.1016/j.biortech.2012.03.109
Huete, E., de Gracia, M., Ayesa, E., and Garcia-Heras, J. L. (2006). ADM1-based methodology for the characterisation of the influent sludge in anaerobic reactors. Water Sci. Technol. 54, 157. doi: 10.2166/wst.2006.537
Kovács, E., Wirth, R., Maróti, G., Bagi, Z., Rákhely, G., and Kovács, K. L. (2013). Biogas production from protein-rich biomass: fed-batch anaerobic fermentation of casein and of pig blood and associated changes in microbial community composition. PLoS ONE 8:e77265. doi: 10.1371/journal.pone.0077265
López, I., Passeggi, M., and Borzacconi, L. (2015). Variable kinetic approach to modelling an industrial waste anaerobic digester. Biochem. Eng. J. 96, 7–13. doi: 10.1016/j.bej.2014.12.014
Lubello, C., Caffaz, S., Gori, R., and Munz, G. (2009). A modified activated sludge model to estimate solids production at low and high solids retention time. Water Res. 43, 4539–4548. doi: 10.1016/j.watres.2009.08.001
Mannucci, A., Munz, G., Mori, G., and Lubello, C. (2010). Anaerobic treatment of vegetable tannery wastewaters: a review. Desalination 264, 1–8. doi: 10.1016/j.desal.2010.07.021
Mottet, A., Ramirez, I., Carrère, H., Déléris, S., Vedrenne, F., Jimenez, J., et al. (2013). New fractionation for a better bioaccessibility description of particulate organic matter in a modified ADM1 model. Chem. Eng. J. 228, 871–881. doi: 10.1016/j.cej.2013.05.082
Munz, G., Gori, R., Camilli, L., and Lubello, C. (2008). Characterization of tannery wastewater and biomass in a membrane bioreactor using respirometric analysis. Bioresour. Technol. 99, 8612–8618. doi: 10.1016/j.biortech.2008.04.004
NMX-F089-1978 (1978). Determinación de extracto etéreo (método Soxhlet) en alimentos, Normas mexicanas. Dirección general de Normas, MEX.
NMX-F-312-1978 (1978). Determinación de reductores directos y totals en alimentos. Normas mexicanas. Dirección general de Normas, MEX.
Priebe, G. P. S., Kipper, E., Gusmão, A. L., Marcilio, N. R., and Gutterres, M. (2016). Anaerobic digestion of chrome-tanned leather waste for biogas production. J. Clean. Prod. 129, 410–416. doi: 10.1016/j.jclepro.2016.04.038
Rajagopal, R., Massé, D. I., and Singh, G. (2013). A critical review on inhibition of anaerobic digestion process by excess ammonia. Bioresour. Technol. 143, 632–641. doi: 10.1016/j.biortech.2013.06.030
Ramirez, I., Mottet, A., Carrère, H., Déléris, S., Vedrenne, F., and Steyer, J. P. (2009). Modified ADM1 disintegration/hydrolysis structures for modeling batch thermophilic anaerobic digestion of thermally pretreated waste activated sludge. Water Res. 43, 3479–3492. doi: 10.1016/j.watres.2009.05.023
Ruiz-Aguilar, G. M. L., Lovanh, N., Camarena-Aguilar, E. A., and Sosa, L. O. (2015). The effect of electron acceptors on biogas production from tannery sludge of a Mexican wastewater plant. Int. J. Environ. Sci. Technol. 12, 3479–3488. doi: 10.1007/s13762-015-0781-6
Shanmugam, P., and Horan, N. J. (2009). Optimising the biogas production from leather fleshing waste by co-digestion with MS. Bioresour. Technol. 100, 4117–4120. doi: 10.1016/j.biortech.2009.03.052
Sri Bala Kameswari, K., Kalyanaraman, C., Umamaheswari, B., and Thanasekaran, K. (2014). Enhancement of biogas generation during co-digestion of tannery solid wastes through optimization of mix proportions of substrates. Clean Technol. Environ. Policy 16, 1067–1080. doi: 10.1007/s10098-013-0706-3
Souza, T. S. O., Carvajal, A., Donoso-Bravo, A., Pen, M., and Fdz-Polanco, F. (2013). ADM1 calibration using BMP tests for modeling the effect of autohydrolysis pretreatment on the performance of continuous sludge digesters. Water Res. 47, 3244–3254. doi: 10.1016/j.watres.2013.03.041
Thangamani, A., Rajakumar, S., and Ramanujam, R. A. (2010). Anaerobic Co-digestion of hazardous tannery solid waste and primary sludge: biodegradation kinetics and metabolite analysis. Clean Technol. Environ. Policy 12, 517–524. doi: 10.1007/s10098-009-0256-x
Vasudevan, N., and Ravindran, A. D. (2007). Biotechnological process for the treatment of fleshing from tannery industries for methane generation. Curr. Sci. 93, 1492–1494.
Vavilin, V. A., Fernandez, B., Palatsi, J., and Flotats, X. (2008). Hydrolysis kinetics in anaerobic degradation of particulate organic material: an overview. Waste Manage. 28, 939–951. doi: 10.1016/j.wasman.2007.03.028
Vavilin, V. A., Rytov, S. V., Lokshina, L. Y., Rintala, J. A., and Lyberatos, G. (2001). Simplified hydrolysis models for the optimal design of two-stage anaerobic digestion. Water Res. 35, 4247–4251. doi: 10.1016/S0043-1354(01)00148-8
Yasui, H., Goel, R., Li, Y. Y., and Noike, T. (2008). Modified ADM1 structure for modelling municipal primary sludge hydrolysis. Water Res. 42, 249–259. doi: 10.1016/j.watres.2007.07.004
Zerdani, I., Faid, M., and Malki, A. (2004). Digestion of solid tannery wastes by strains of Bacillus sp. isolated from compost in morocco. Int. J. Agric. Biol. 6, 758–761. Available online at: http://www.fspublishers.org/published_papers/756_..pdf
Keywords: anaerobic digestion, tannery waste, modeling, ADM1, hydrolysis
Citation: Polizzi C, Alatriste-Mondragón F and Munz G (2017) Modeling the Disintegration Process in Anaerobic Digestion of Tannery Sludge and Fleshing. Front. Environ. Sci. 5:37. doi: 10.3389/fenvs.2017.00037
Received: 23 March 2017; Accepted: 12 June 2017;
Published: 28 June 2017.
Edited by:
Gang Pan, Nottingham Trent University, United KingdomReviewed by:
Constantinos Noutsopoulos, National Technical University of Athens, GreeceBing-Jie Ni, The University of Queensland, Australia
Copyright © 2017 Polizzi, Alatriste-Mondragón and Munz. This is an open-access article distributed under the terms of the Creative Commons Attribution License (CC BY). The use, distribution or reproduction in other forums is permitted, provided the original author(s) or licensor are credited and that the original publication in this journal is cited, in accordance with accepted academic practice. No use, distribution or reproduction is permitted which does not comply with these terms.
*Correspondence: Giulio Munz, giulio.dicea@unifi.it