Open-Source Processing and Analysis of Aerial Imagery Acquired with a Low-Cost Unmanned Aerial System to Support Invasive Plant Management
 Jan R. K. Lehmann1*
  Torsten Prinz2 Silvia R. Ziller3 Jan Thiele1
  Gustavo Heringer4 João A. A. Meira-Neto4
  Tillmann K. Buttschardt1
- 1Institute of Landscape Ecology, University of Muenster, Muenster, Germany
- 2Institute for Geoinformatics, University of Muenster, Muenster, Germany
- 3The Horus Institute for Environmental Conservation and Development, Florianópolis, Brazil
- 4Laboratory of Ecology and Evolution of Plants, Universidade Federal de Viçosa, Viçosa, Brazil
Remote sensing by Unmanned Aerial Systems (UAS) is a dynamic evolving technology. UAS are particularly useful in environmental monitoring and management because they have the capability to provide data at high temporal and spatial resolutions. Moreover, data acquisition costs are lower than those of conventional methods such as extensive ground sampling, manned airplanes, or satellites. Small fixed-wing UAS in particular offer further potential benefits as they extend the operational coverage of the area under study at lower operator risks and accelerate data deployment times. Taking these aspects into account, UAS might be an effective tool to support management of invasive plant based on early detection and regular monitoring. A straightforward UAS approach to map invasive plant species is presented in this study with the intention of providing ready-to-use field maps essential for action-oriented management. Our UAS utilizes low-cost sensors, free-of-charge software for mission planning and an affordable, commercial aerial platform to reduce operational costs, reducing expenses with personnel while increasing overall efficiency. We illustrate our approach using a real example of invasion by Acacia mangium in a Brazilian Savanna ecosystem. A. mangium was correctly identified with an overall accuracy of 82.7% from the analysis of imagery. This approach provides land management authorities and practitioners with new prospects for environmental restoration in areas where invasive plant species are present.
Introduction
Biological invasions by plant species increased rapidly since the past century, with major impacts on nature, landscapes, and human health, which carries high economic and ecological costs throughout the globe (Mack et al., 2000; Vilà et al., 2011). Invasive trees and shrubs have been recognized to be among the most problematic invaders (Richardson and Rejmánek, 2011; Richardson et al., 2014). They can alter ecosystem structure and functioning, and intensively compete with native species for space, resources, and light. Nature conservation as well as land- based industries, such as agriculture and forestry, are negatively affected by non-native tree and shrub invasions (Pimentel, 2002; Bellard et al., 2016). Consequently, rapid and cost-efficient management solutions are in high demand by land managers across the world. Successful control or eradication depend on the availability of precise distribution data (e.g., field maps) of invasive plants in management areas. The earlier the populations of an invasive plant are detected at initial stages of invasion, the higher the cost-efficiency and probability of success (Rejmánek, 2000). However, fine-scale field maps requiring regular updates generate high personnel, data, and software costs that often hinder invasive species management efforts (Spring et al., 2017).
Several studies addressing the management of invasive plant species demonstrate the great potential of remote sensing techniques for detecting, mapping and predicting the spatial spread of plant invaders, in particular when using multispectral or hyperspectral sensors (Huang and Asner, 2009; He et al., 2011; Bradley, 2014). Early detection and monitoring of invading plant species using satellite or airborne imagery can provide a valuable basis for control efforts at both the local and landscape level (Bradley and Mustard, 2006; Vilà and Ibáñez, 2011). However, the precise mapping of invasive trees and shrubs, especially of small individuals such as seedling and saplings, is still a challenge. For example, the spatial resolution of satellite-based imagery is often not high enough to facilitate detection of isolated individuals or even small populations. In contrast, the spatial resolution of aerial images collected by conventional aircrafts may well be sufficient, but customized aerial image flights are expensive and, therefore, not economically viable for most invasive species management practitioners, especially when high repetition rates are required.
Unmanned Aerial Systems (UAS), popularly known as drones, introduce a new remote sensing technique that may become an applicable and affordable alternative to conventional approaches, as they reduce costs and increase the spatial resolution of aerial images (Wan et al., 2014; Dvořák et al., 2015; Chabot et al., 2016; Hill et al., 2016; Müllerová et al., 2016, 2017). The technical development, component miniaturization, and increased sales in recent years resulted in the rapid growth of UAS as an environmental remote-sensing platform. By contrast, conventional acquisition of aerial images by airplanes is usually more elaborate and expensive, requires more operating personnel and detailed long-term scheduling. Consequently, its use is mostly restricted to surveys that need to cover large areas (50–100 km2) with low temporal repetition rates. However, for environmental monitoring issues, especially focusing on small or mid-sized areas with a certain need for higher coverage rates, UAS technologies are far more economical, flexible, and faster, while requiring only one or two persons to conduct the survey, which involves image acquisition in the field following set up of the particular mission according to specific needs (Anderson and Gaston, 2013; Colomina and Molina, 2014). Since the technical preparation and launch of a UAS mission can usually be completed in less than 1 h, even small time windows are enough for the acquisition of high-resolution image data to detect invasive plants or monitor their spread over time.
Small model aircrafts, also called fixed-wing UAS, as an alternative to widely used multirotor drones, have proved successful as an environmental remote sensing platform (Laliberte et al., 2011; Anderson and Gaston, 2013; Colomina and Molina, 2014; Müllerová et al., 2017). Due to the uplift generated by airflow over the wings and more efficient aerodynamics, these platforms provide the advantage of longer flight times at higher speeds and greater payloads and, thus, can cover larger survey areas per flight compared to multirotor UAS. Moreover, the simple structure and control electronics are less susceptible to daily usage, reducing maintenance efforts and repair costs. Several companies (e.g., senseFly, QuestUAV, Gatewing, Trimble) offer ready-to-fly fixed-wing UAS (including full autopilot control and camera sensors) which fulfill the criteria for practical applications in environmental management.
However, the number of known practical applications of UAS by land managers is still relatively low. The main reasons for this may be the high acquisition costs of professional fixed-wing UAS, technical complexities, or missing skills in operating such systems. Additionally, necessary expert knowledge in image processing and analysis is often lacking, and commercial Geographic Information Systems (GIS) and remote sensing software are expensive. As a consequence, interpretation of aerial photography within the field of invasive species management is still often limited to time-consuming visual image interpretation. These circumstances might discourage responsible managers from using present UAS-based remote sensing methods in their daily work routines.
The idea behind the work described in this paper is to encourage land managers to use UAS to map and monitor invasive plant species for eradication and control purposes. A straightforward, low-cost UAS-based approach (total hardware costs less than 2,000 US dollars) that provides field maps for invasive species management based on easy to handle, affordable equipment and open-source software is presented. Although this approach does not take varying costs into account (such as man/hour, perhaps depending on wage-level and skills), it can be applied by personnel with only basic prior knowledge of image processing and GIS. Besides data acquisition itself, we present the steps of data processing and image analysis using free, open-source image analysis and GIS software, and provide a concise workflow scheme. Moreover, we highlight the vast potential of UAS-acquired remote sensing products to support environmental monitoring and mapping of invasive species.
An example of Acacia mangium (Willd.) invasion in a savanna-type ecosystem, called Mussununga, in the Brazilian Atlantic Forest domain is used to illustrate our approach. A. mangium is one of the most aggressive invasive plant species in open ecosystems in southeastern and northern Brazil, with substantial negative effects on conservation, agriculture, forestry, and land reclamation (Aguiar et al., 2014; The Horus Institute National Database of Invasive Alien Species Brazil, 2017). In this study, we operated a small fixed-wing UAS equipped with two types of camera sensors, true-color RGB and Color-Infrared (CIR), to investigate the potential of low-budget, easy to handle remote sensing technology to map the distribution of invasive A. mangium.
Materials and Methods
Study Site and Target Plant Species
The study area is located in the Atlantic Forest domain in Brazil, at coordinates 17°41′35″ S and 39°28′40″ W, in the municipality of Caravelas, southeastern Bahia State (Figure 1). The climate is classified as Tropical with no dry season (Af) in the Köppen classification system (Alvares et al., 2013), with annual mean precipitation around 1750 mm (Saporetti-Junior et al., 2012), and mean temperature around 26°C. Vegetation in the region is highly fragmented and predominantly composed of Atlantic rainforest remnants, Mussununga, eucalyptus plantations, pasture and crops. Mussununga is a heterogeneous savanna-type formation of different physiognomies, from grasslands, dominated by few species of monocots; savanna, composed of one layer of herbaceous plants and another layer of scattered woody plants; and woodland formed by a closed canopy (Saporetti-Junior et al., 2012; Ferreira et al., 2014; Lima et al., 2015). These vegetation patches are spread out in a matrix of Eucalyptus plantation and Brazilian Atlantic Forest (IBGE, 2004) having rounded to amoeboid shapes which greatly vary in size (less than one to hundreds of hectares). Mussununga vegetation is strictly associated with nutrient-poor, acidic, sandy soils formed through podzolization as a consequence of high humidity and hydromorphism (Saporetti-Junior et al., 2012; Ferreira et al., 2014). Our Mussununga study area was dominated by grasses and monocots with scattered patches of dwarf shrubs and small trees (Figure 2A).
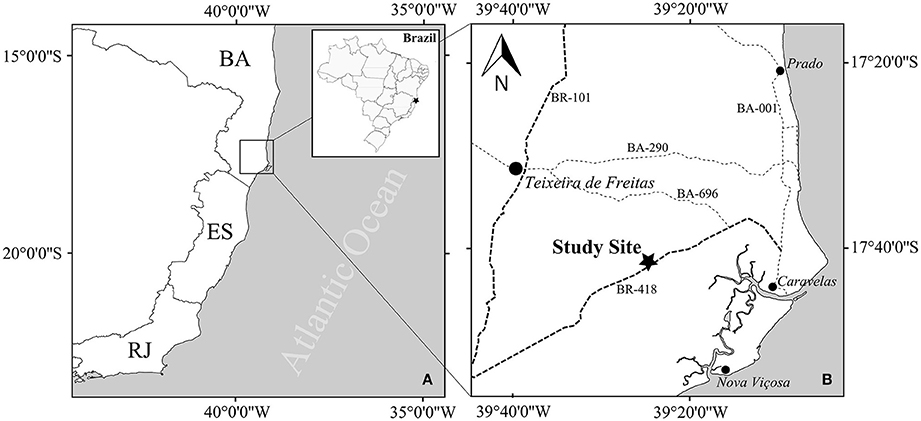
Figure 1. (A) The study was conducted in southeastern Brasil in the state of Bahia (BA). Additional displayed states are: Espirito Santo (ES), Minas Gerais (MG) and Rio de Janeiro (RJ) (B) The mussununga study site is located between the cities of Caravelas, Nova Viçosa and Teixeira de Freitas along the federal road BR-418. The minimum distance to the Atlantic Ocean coast is ~35 km.
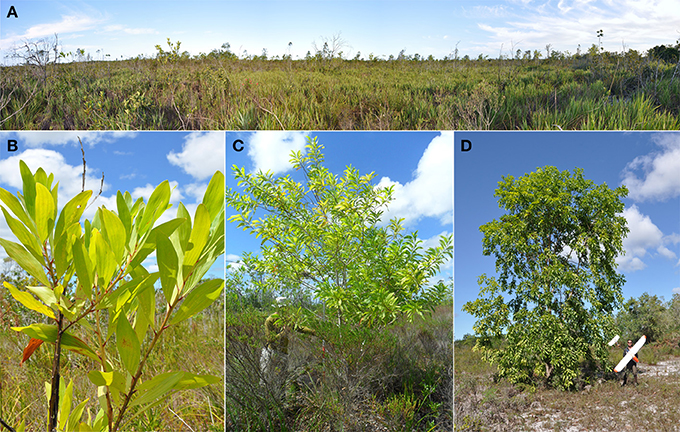
Figure 2. (A) Panoramic photograph of the studied mussununga formation dominated by heterogeneous savanna-type vegetation (B) Acacia mangium is characterized by large, bright green phyllodes (C) The growth habit of A. mangium varied from many small (<4 m) up to (D) few tall (>8 m) trees.
Acacia mangium is indigenous to Australia, Papua New Guinea, and Indonesia. It is widely planted around the world, mostly with the purpose of soil rehabilitation due to its fast growth and nitrogen fixation (National Research Council, 1983). In Brazil, the species is recorded from North (Roraima and Amapa states) to South (Rio Grande do Sul state) (The Horus Institute National Database of Invasive Alien Species Brazil, 2017). Introduced around the 1970s as an alternative for the reclamation of degraded areas, it is still planted in forest stands for firewood, timber, fence posts, and support for black pepper crops (Halfeld-Vieira and Nechet, 2009). Acacia mangium is adapted to climates with a short dry period, mean annual rainfall between 1,000 and 4,500 mm, temperatures from 15 to 34°C, acidic soils with a low level of nutrients, and degraded areas (National Research Council, 1983; Delnatte and Meyer, 2012).
Besides being well adapted to these environmental conditions, A. mangium is a good competitor in high lighting conditions (Osunkoya et al., 2005) and is widely distributed in lowland Atlantic forest domains in the southeast of Brazil, invading degraded areas, pastures, eucalyptus plantations and Mussununga. In regenerating forest invaded by A. mangium where the canopy closed in short time and biomass increased in a few years, dominance by the invasive species delayed colonization by native species and had an adverse impact on biodiversity (Le Maitre et al., 2011). Likewise, invasion by A. mangium in Mussununga formations is expected to accelerate biodiversity loss and alter plant communities.
Acacia mangium is characterized by some unique physiognomies within the Mussununga formation making this invader a good candidate for mapping through remote sensing. Particularly, the bright green, large phyllodes (flattened leaf stalks; Figure 2B) are helpful in distinguishing A. mangium from the surrounding savanna-type vegetation. In addition, it usually grows taller than most native plant species in this formation (Figures 2C,D, 3).
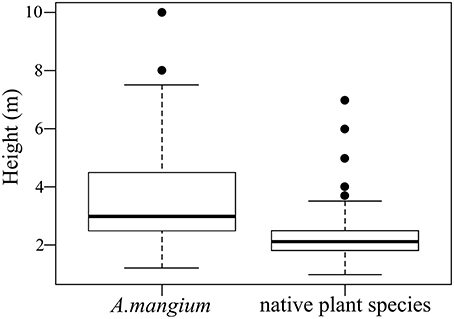
Figure 3. Box plot showing the statistics of vegetation height for Acacia mangium and native plant species in Mussununga ecosystems. Horizontal lines represent the arithmetic means (middle line) ± standard deviation (upper and lower lines); outer horizontal lines represent the minimum and maximum values; o, outliers; m, meters.
Unmanned Aerial System
A UAS consists of an aerial platform, associated sensors and control equipment (Valavanis and Vachtsevanos, 2015). The unmanned aerial platform, the autopilot control system and the camera sensors used to match the specific requirements (Table 1) of this remote sensing technique as an innovative invasive plant management tool are described in the following sections.
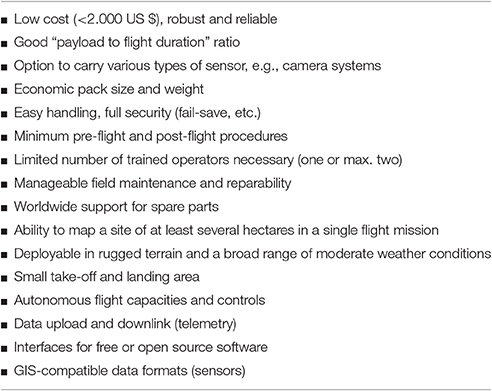
Table 1. List of the specific requirements of an Unmanned Aerial System (UAS) as an innovative invasive plant species remote sensing tool.
Unmanned Aerial Platform
We used an easy-to-build fly fixed-wing platform with the comparably low total cost of around 1,100 US dollars (SkyWalker 2014 with 1,900 mm wingspan; Figure 4). It is easy to control and has excellent crashing resistance, which is important to ensure safe landings even in rugged terrain. Large wingspans enable long flight times (>60 min) with a cruise speed of ~40 km h−1 and a maximum payload of 800 g. The platform was equipped with common electronic model aircraft components (Table 2) to ensure a global spare part supply and proper maintenance. In comparison to the standard version of the airframe, two slight modifications were made. First, a small door (10 × 8 cm) was cut on one side of the fuselage to improve the accessibility of the camera sensor in the field. Second, a round hole (6 cm diameter) was drilled in the bottom of the fuselage to enable a downward view of the camera sensors. A neutral glass filter was glued into the created fuselage hole to protect the camera lens against dust and mechanical stress. Several parts of the UAS were painted in bright orange to make it more visible from a distance.
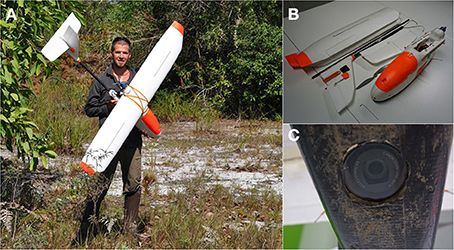
Figure 4. (A) The fixed-wing Unmanned Aerial System (UAS) used, a SkyWalker 2014 with a wingspan of 1,900 mm. The image shown is being published with the consent of the subject (B) The UAS can be totally disassembled in a few minutes for easy transportation with one single Allen key (C) The downward pointing camera lens is protected against dust and mechanical stress by a neutral glass filter glued to the fuselage.
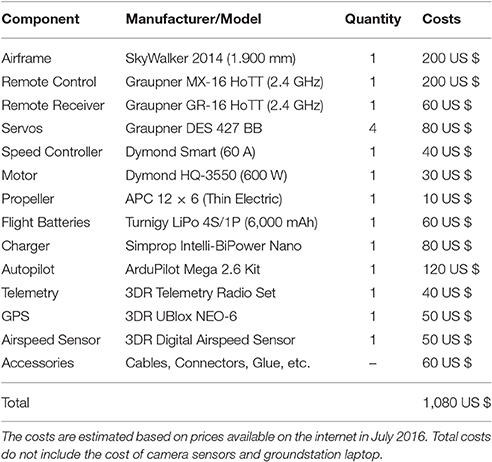
Table 2. Basic configuration list with respective costs of the used fixed-wing Unmanned Aerial System components.
Autopilot Control System (APM)
The fixed-wing platform was equipped with the open-source autopilot system ArduPilot Mega 2.6 (APM 2.6; http://ardupilot.com). This autopilot operates with an external GPS and compass for navigation, a triple axis accelerometer, gyro for stabilization, and a barometric pressure sensor for precise altitude control. The airspeed can be controlled with the GPS. However, we used an external digital airspeed sensor (pitot-static probe connected to a differential pressure sensor) to assist the UAS to fly at constant airspeed, especially under windy or unstable weather conditions. By using the autopilot system, both semi-autonomous (automatic waypoint flight including manual take-off and landing) and full autonomous (automatic waypoint flight including automatic take-off and landing) missions can be performed. Due to the restricted space of the study area and because the APM 2.6 does not include any automatic obstacle detection technique, we preferred to use manual take-off and landing procedures.
All relevant parameters (e.g., battery status, position in space, flight altitude, airspeed) were transmitted by the long-range telemetry system to a ground station in real-time during flight. The ground station itself consisted of a regular laptop (around 250 US dollars) with installed APM Mission Planner software and a receiver antenna system connected to a standard USB port. To ensure continuous signal reception, the receiver antenna was attached to a telescopic fishing rod with Velcro, which allowed it to be extended up to three meters in height using a USB extension cable.
Camera Sensors
To generate a broad range of meaningful digital aerial images, both a true color (RGB) camera (Canon PowerShot SX230 HS) and a modified color-infrared (CIR) camera (Canon PowerShot SD780 IS) were used. Both cameras offer a reasonably good image quality at affordable prices (less than 350 US dollars per camera), are widely available, and comparatively small and lightweight. Thus, they ensure an appropriate ratio of payload capacity to flight duration. The main technical features of these cameras are presented in Table 3. The Canon PowerShot SX230 HS included a built-in GPS, enabling direct storage of coordinates, altitude, camera orientation and corresponding date/time in the resulting image-EXIF metadata.
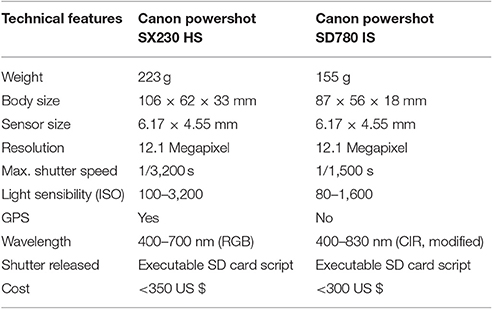
Table 3. Main features of the digital cameras used for image data acquisition.
The internal “hot mirror filter” of the Canon PowerShot SD780 IS located in front of the Charge Coupled Device (CCD) was removed to enable recording of near infrared (NIR) reflection of objects, next to green and blue. This option is offered by some specialized companies, but it can also be done on one's own if the technical know-how is available. For this study, the internal hot mirror was replaced by a neutral glass filter, which created the additional advantage of fitting conventional external filters on the lenses, generating various spectral modes of photography such as true or false-color (near) infrared images (Ritchie et al., 2008; Zhang et al., 2008). For instance, an external cyan color filter blocks the visible red light but let through NIR radiation (up to about 830 nm) that is recorded by the red CCD-band. As a result, color-infrared (CIR) imagery was created.
Camera settings were adjusted to compensate for the constant movement of the fixed-wing UAS during flight. We set the camera for shutter priority mode (normally called “Tv”) at high speed of over 1/1,000 s at an appropriate high ISO setting (>400). Under this setting, most of the motion blur effects can be effectively avoided. Furthermore, a free software script (Canon Hack Development Kit; CHDK) was installed on the SD memory card of both camera sensors to enable a fixed focus mode, a defined control shutter speed/lens aperture combination, and shutter release in suitable time intervals. Images taken during one mission were stored in the camera's internal memory card. Simple frames made of soft EPO foam were constructed for both cameras to minimize vibration blur in photographs and to protect the cameras in the case of rough landings. The system was mounted with Velcro tape in the fixed-wing aerial platform fuselage for easy, quick changes of cameras during field work.
Image Data Acquisition
Flight Mission Planning
The open-source software APM Mission Planner was used for planning, saving and loading an autonomous survey mission into the UAS. This specialized software includes a fully-featured ground station application for the APM 2.6 autopilot system used in this study. Also, the UAS platform can be configured and customized for optimum performance, while mission logs created by the autopilot can be downloaded and analyzed immediately after the flight. Turning points were therefore defined outside the Area of Interest (AOI) at some distance from its borders to ensure proper coverage, generating a larger total flight area. The waypoints calculated by the Auto Waypoint (WP) function automatically took into account all relevant selected parameters, such as flight altitude, flight angle and photo overlap according to the selected camera sensor. The Return to Launch (RTL) feature was chosen to ensure an automatic “homecoming” of the UAS once data acquisition was completed. From this point, we disarmed the autopilot and took over all rudder functions to land the UAS manually in the pre-defined landing zone.
Flight altitude above ground level was set to 100 m in this study, generating a ground footprint of 123.2 × 92.4 m with a pixel resolution of 3.08 cm for each RGB image and 104.4 × 78.3 m with a pixel resolution of 2.61 cm for each CIR image. The forward photo overlap was programmed to 80% and the sideward overlap to 60%, respectively. The ground speed of the UAS was set to 8 m s−1 (~30 km h−1). The camera trigger interval between both surveys was adjusted based on values calculated using the APM Mission Planner.
Ground Survey
Once in the field, we verified the flight plans regarding the actual geographical and environmental conditions by doing a pre-flight field survey before the UAS was launched. The survey included ground and weather observations, topographic information to identify or adjust launch/recovery sites and other important characteristics of the terrain. We set the flight paths against the wind, as flying parallel to the wind leads to constant course corrections by the UAS and results in angled imagery. The background maps for mission planning were stored offline beforehand to support such adjustments. This was important because internet access was not available in the field. The pre-programmed mission was then uploaded to the drone before take-off. Furthermore, 15 Ground Control Points (GCP) marked by Compact Discs each 12 cm in diameter that were sprayed with white paint to increase visibility from the air were placed randomly throughout the AOI. Their respective locations were registered with a Garmin GPSMap 60CSx (~4 m accuracy). Additionally, GPS ground truth data for A. mangium and other dominating species or plant forms (e.g., grasses) were collected. Maximum height and number of individuals (when grouped) were registered for each A. mangium ground truth point, complemented by one field photograph.
Aerial Survey
The Mussununga site in this study was mapped in two single flights, one for RGB and one for CIR imagery. An additional person assisted the operating pilot during the flights, monitoring all parameters transmitted to the ground station which were relevant to the mission and the UAS. Each flight lasted ~45 min, including manual take-off and manual landing. Due to the occurrence of strong winds and thermal activities ±3 h around solar noon, the flights were performed in early morning hours. Light conditions were influenced by partial cloud cover and a low elevation angle of the sun during the period of image acquisition. Short heavy rains left some flooded spots in the northern part of the AOI just before the CIR sensor flight was launched. Significant variations of illumination, sun position, cloud cover and haze might have an impact on the spectral authenticity of the data and should, therefore, be adjusted in the image processing phase.
Image Data Processing
Figure 5 gives an overview of software modules and the steps of image processing and analysis used in this study. Before processing, we removed five images (out of 212) in the original RGB data set and eight images (out of 193) in the CIR data set due to their very poor overall quality caused by strong motion-blurring, high-angle obliqueness and under or overexposure effects. Images with further minimal quality issues were not removed to avoid potential gaps in the final, aligned orthoimagery. Furthermore, we preselected images with a specific focus in the AOI to optimize the subsequent processes by minimizing the total amount of images. These remaining images underwent an optional image equalization process (stretching) to reduce illumination differences.
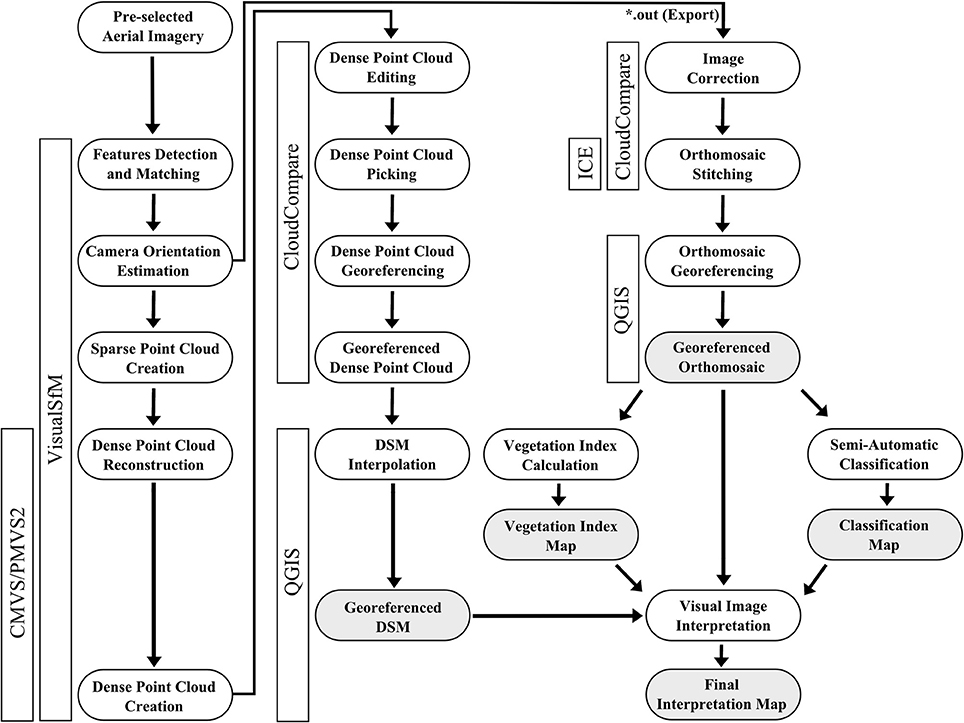
Figure 5. Workflow diagram for UAS imagery processing and analysis using free open-source software programs. The software used for single processing steps in this study are presented in vertical boxes. Final products are displayed in gray boxes.
Image Feature Detection and Matching
Freely available VisualSfM software (Wu, 2013) was used for image feature detection and matching. The matching of the image features was based on an algorithm that identifies the corresponding feature in the rest of the available image data set. Since this calculation is quite complex and time-consuming for a full data frame, we used the option to execute a preemptive version of the matching approach. As a result, it was possible to calculate a matrix showing the matching correlation between the images. During this feature matching process, the MaxSIFT parameter determined the number of features per image used for matching. We lowered the default value (8,192) of the MaxSIFT parameter by half which provided a good balance between calculation time and accuracy of results.
Digital Surface Model (DSM) Generation
After the matching process, an image bundle adjustment resulting in estimated image positions and sparse point cloud reconstruction was performed. Before the necessary cloud densification, we used VisualSfM integrated manual tools to align the images without estimated parameters. Pairs of images with weak linkages were detected and additional feature detection and matching were performed for the given pairs using the Spanning Forest and Spanning Tree tools. In this manner, a model was manually defined to generate sufficient numbers of adjusted images. The image parameters estimated were saved in *.OUT format and used for the image orthorectification process (see chapter 2.4.4). The final point densification was performed using the CMVS/PMVS2 package. In VisualSfM both packages are used concurrently, although it can be divided into two parts. First, CMVS determined the number of clusters in which the input data are divided. These were then passed to the PMVS2 for point densification and finally stored in a *.PLY format.
Since VisualSfM does not support the direct calculation of digital surface models (DSM), the 3D surface was calculated using CloudCompare and Quantum GIS (QGIS), two free software packages which can calculate DSM from dense point cloud data sets (*.PLY format). Georeferencing was performed with the point picking tool in CloudCompare by manually picking the white GCPs and assigning their corresponding coordinates to the dense point cloud. The resulting georeferenced dense point cloud was imported and interpolated in QGIS with an Inverse Distance Weighted (IDW) algorithm to create the final georeferenced DSM. For validation, a linear regression model was calculated to assess the relationship between predicted (DSM) and measured (field survey) canopy heights for 60 randomly selected A. mangium ground truth points.
Orthomosaic Export and Georeferencing
Due to the lack of an orthophoto export feature in VisualSfM, a combination of CloudCompare and Microsoft Image Composite Editor (ICE) was utilized. CloudCompare has options for importing output files of VisualSfM containing estimations of camera parameters (*.OUT format). As part of importation, CloudCompare provides an option for imagery corrections based on parameters included in the file. The imagery was corrected with CloudCompare and loaded in Microsoft ICE for orthomosaic creation. We selected the Planar Motion mode as these methods minimize possible perspective distortions in the images during the mosaicking process. Please note, if Microsoft ICE auto selects the Rotating Motion mode, this may be an indication of remaining oblique or blurred images in the set processed by CloudCompare. Deleting these interfering images may facilitate the mosaicking process. As the image output from CloudCompare and Microsoft ICE is not georeferenced, final georeferencing of the orthomosaics was done with QGIS using the integrated Georeferencer GDAL plugin and the corresponding coordinates of visible white GCPs.
Image Data Analysis
VIS-NIR-Based Vegetation Indices
To test the capabilities of VIS-NIR-based vegetation indices (VI), we focused on the Green Normalized Difference Vegetation Index (GNDVI) and the Green Difference Vegetation Index (GDVI)—both are popular and frequently used chlorophyll indices—using the Raster Calculator in QGIS. Additionally, we calculated a modified Triangular Vegetation Index (mTVI) which originally belongs to so-called narrowband VI (Broge and Leblanc, 2001). Formulae of the applied VI are presented in Table 4. The discrimination capability of each VI was analyzed by ANOVA and Tukey's post-hoc test.
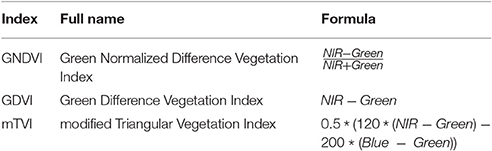
Table 4. Set of tested spectral vegetation indices calculated with the Raster Calculator in QGIS in the present study.
Semi-Automatic Classification
Image data classification was conducted with the open-source software Semi-Automatic Classification Plugin for QGIS developed by Congedo (2016). We selected the orthorectified RGB mosaic for semi-automatic classification. At first, we created three non-vegetation classes, namely shadow, bare soil and road, and three vegetation classes, namely A. mangium, grasses and other vegetation. A minimum number of 100 samples was collected for each class, so called Regions Of Interest (ROI), using the plugin Integrated ROI Pointer. All ROIs were previously validated visually by field-collected ground truth data. Subsequently, we used a minimum distance classification algorithm that applies Euclidean spectral distances between spectral signatures of image pixels and training signatures to classify the image.
Classification accuracy was evaluated by defining more than 500 random points which were manually classified through on-screen interpretation of the available RGB image information together with collected field data. Based on the class assignments, a confusion matrix was calculated to assess the classification accuracy including overall, user's, and producer's classification accuracy, as well as Kappa Index of Agreement (KIA) statistics.
Multilayer Visual Image Interpretation
Taking superimposed boundaries of the previously generated image layers in a combined QGIS project (Figure 6) as a basis, we pinpointed A. mangium trees through a hierarchical visual image interpretation strategy. The workflow was initialized by grid calculation (50 × 50 m mesh size) using the Vector Grid tool of QGIS to systematize and facilitate spatial image interpretation. Subsequently, only unequivocally identifiable A. mangium areas were transformed into polygon features and map layers of vegetation indices were loaded to search for further Acacia plants that had not been previously identified in the grid cells. Again, only clearly detectible A. mangium trees or small groups were mapped to optimize processing time. This step was repeated for the obtained classification and DSM layer.
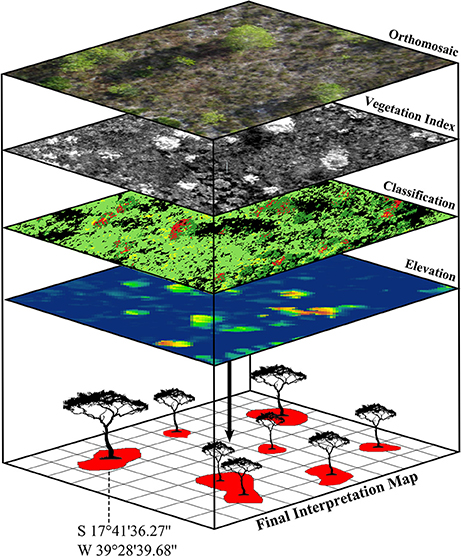
Figure 6. To map the distribution of invasive tree species we digitally superimposed the boundaries of differently calculated image layers (raster and vector data) and conducted an advanced visual image interpretation. The resulting coordinates of identified single invasive trees can be used for the application of control measures in the field.
To assess the quality of the multilayer-based visual image interpretation, we applied a buffer zone (in this case 4 m) around each A. mangium ground truth point to offset GPS errors or other inaccuracies and checked whether the manually digitized A. mangium polygons fit in this tolerance radius. For this purpose, A. mangium ground truth data was separated into five tree-height classes (1) <3 m, (2) 3–5 m, (3) 5–7 m, (4) 7–10 m, (5) 0–10 m, thus enabling a height-specific accuracy assessment.
Results
Orthomosaics
A total area of ~25 ha was covered by aerial RGB and CIR imagery with ground pixel resolution of less than 4 cm. However, to reduce image data processing and analysis time, the imagery outside of the AOI (i.e., the Mussununga under study) was discarded. Hence, the final stitched orthomosaics covered an area of ~13 ha (Figure 7). A visual inspection of the two entire orthomosaics revealed some blur and distortion effects (<5% of total area), as well as light fluctuations (<10% of total area). RGB orthoimagery was affected by strong cast shadows resulting in partial loss of image details. CIR orthoimagery, in contrast, was less affected by cast shadows but includes some underexposed areas due to the presence of clouds. Since partially the same GCP positions were used during acquisition of RGB and CIR images, spatial shifts could be detected between the two orthorectified mosaics. As a consequence, one-to-one pixel co-registration of both data sets failed due to glaring perspective distortions. Nevertheless, both aerial images showed no significant pixel gaps or missing parts. To illustrate image processing results and methods of analysis in more detail we selected an one-hectare subscene intensely invaded by A. mangium.
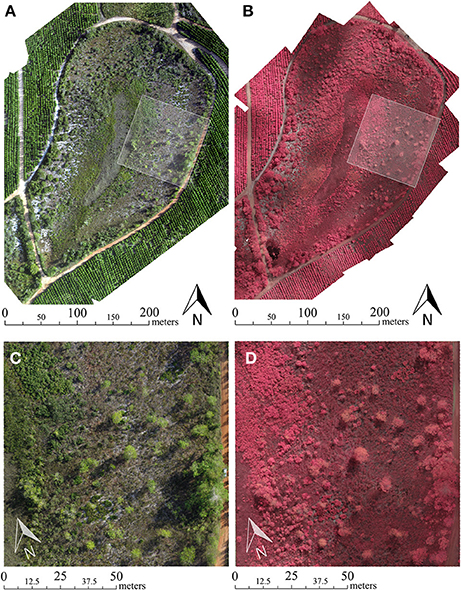
Figure 7. (A) Final orthorectified RGB and (B) Color-infrared (CIR) mosaic of the investigated mussununga study site (C,D) Detailed views of a highly invaded 100 × 100 m plot by Acacia mangium (see white transparent box in (A,B) for RGB and CIR imagery, respectively. This section is used to illustrate additional results.
Digital Surface Model
The interpolated DSM proved to be a valuable representation of surface elevation over the study area. As a result, elevated objects, in this case, larger trees or shrubs, were clearly recognizable visually (Figure 8). The linear regression model indicated a strong correlation (R2 > 0.89 with N = 60) between the predicted DSM and field measurements of A. mangium heights (Figure 9).
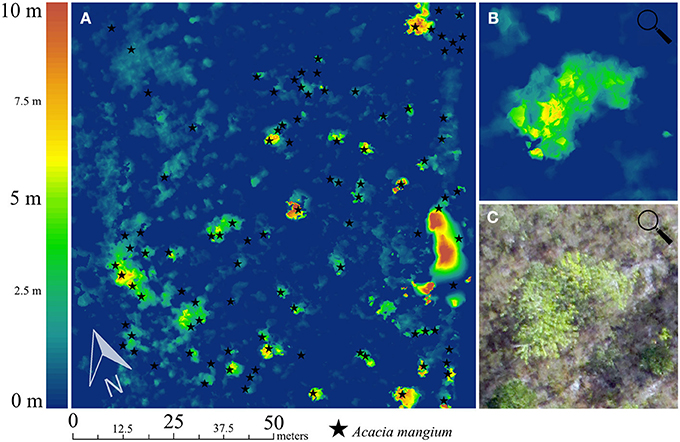
Figure 8. (A) Digital Surface Model (DSM) of a highly invaded 100 × 100 m mussununga plot. Ground truth points of Acacia mangium are displayed as black stars. (B) Zoom into image showing detailed DSM of small A. mangium group (N = 3) and (C) the corresponding RGB orthophoto. The maximum height of the A. mangium group was estimated at 5.7 m in the field.
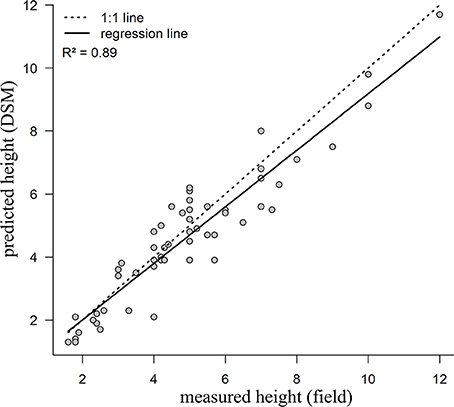
Figure 9. Linear regression fit between predicted heights for Acacia mangium (N = 60) based on Digital Surface Model (DSM) and heights measured in the field (in meters).
VIS-NIR-Based Vegetation Indices
The resulting grayscale maps of the calculated VIS-NIR-based vegetation indices are presented in Figure 10. The associated boxplots are shown in Figure 11. The GNDVI showed high aptitude to differentiate photosynthetic active vegetation (i.e., plant biomass) from other surface types such as bare soils (P < 0.001). However, the application of the GNDVI revealed some limitations in the distinction between different plant species or vegetation types. Particularly, A. mangium and grasses had similar pixel values (P = 0.776). In this case, the calculated GDVI was favorable. The applied Tukey post-hoc test showed significant pixel value differences between all classes (P < 0.001). The modified TVI was most promising in detecting A. mangium since pixel values for this distinct species differ significantly from the pixel values related to surrounding native grasses and herbaceous/woody vegetation (particularly if applied to A. mangium individuals with new, bright green phyllodes).
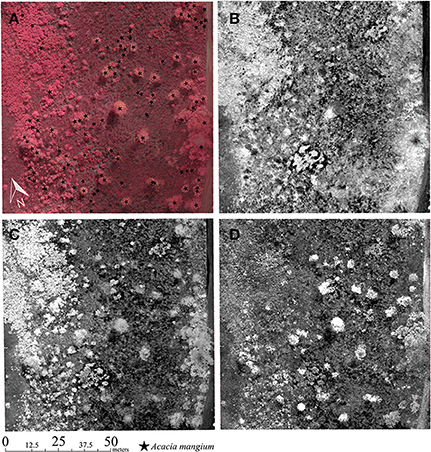
Figure 10. (A) Color-infrared (CIR) Orthomosaic image section with Acacia mangium ground truth points and (B) corresponding Green Normalized Difference Vegetation Index (GNDVI) (C) Green Difference Vegetation Index (GDVI) and (D) modified Triangular Vegetation Index (mTVI). The mTVI is particularly promising for the detection of invasive A. mangium trees in mussununga formation.
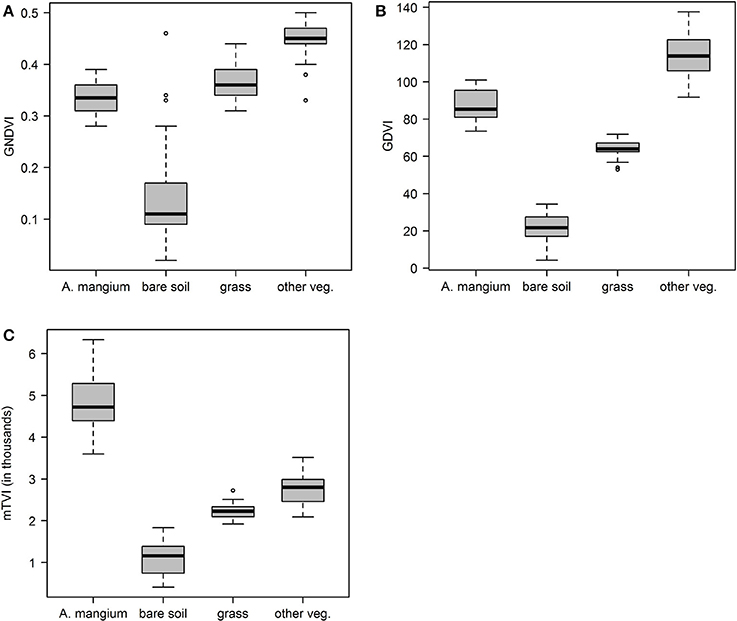
Figure 11. Box plots showing the statistics of the calculated vegetation indices. Box plots represent (A) Green Normalized Difference Vegetation Index (GNDVI), (B) Green Difference Vegetation Index (GDVI) and (C) modified Triangular Vegetation Index (mTVI). Horizontal lines represent the arithmetic means (middle line) ± standard deviation (upper and lower lines); outer horizontal lines represent the minimum and maximum values; o, outliers; m, meters.
Semi-Automatic Classification
The resulting classification map is presented in Figure 12. The semi-automatic pixel-based classification revealed an overall accuracy level of 85.4% and overall KIA of 0.82 using all six classes (Table 5). Producer's accuracy achieved best results for shadow (98.6%), followed by bare soil (97.4%), road (97.1%), other vegetation (84.3%), grasses (74.5%), and A. mangium (73.1%). User's accuracy performed best for road (100%) and bare soil (99.3%) classes. The A. mangium class reached a user's accuracy of 95.9%, followed by shadow (83.6%), grasses (81.4%), and other vegetation (69.5%).
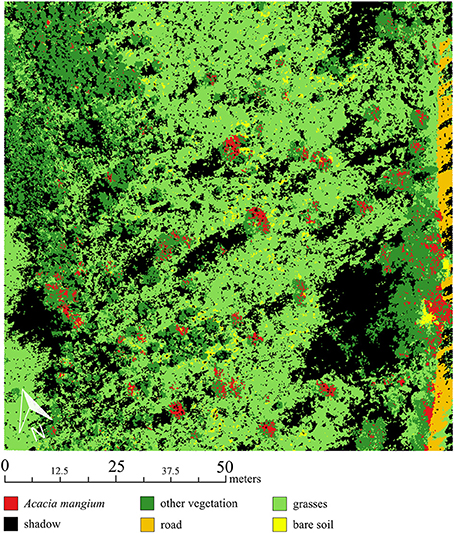
Figure 12. Classification map obtained from the Semi-Automatic Classification Plugin developed by Congedo (2016). The class other vegetation included native herbaceous and woody plants. Strong cast shadow effects are generated by low-angled sunlight during image acquisition.
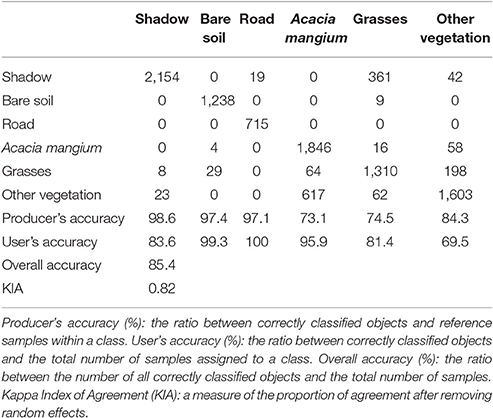
Table 5. Confusion matrix and accuracy results of semi-automatic classification using the Semi-Automatic Classification Plugin (Congedo, 2016) in open-source Quantum GIS.
Multilayer Visual Image Interpretation
The final A. mangium distribution map obtained from multilayer visual image interpretation is shown in Figure 13. The image interpretation revealed an overall accuracy rate of 82.7% for the correct identification of A. mangium (Table 6). Using aggregated tree heights of A. mangium, the height classes 3–5 m and 5–7 m were detected with higher accuracy, 91.8 and 88.2%, respectively. In comparison, A. mangium trees lower than 3 m or between 7 and 10 m were more difficult to detect, with 77.1 and 66.7% accuracy, respectively.
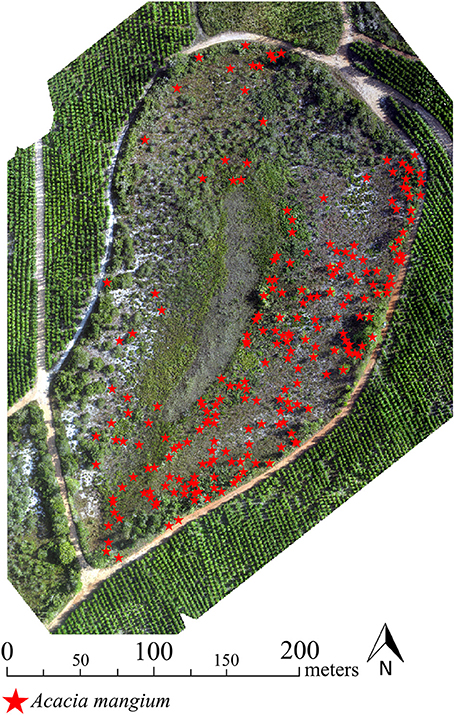
Figure 13. Final map showing potential location points of invasive Acacia mangium trees in the studied mussununga formation obtained through multilayer visual image interpretation.
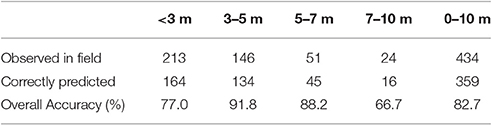
Table 6. Accuracy assessment of the multilayer visual image interpretation. Acacia mangium ground truth data was separated in different height classes.
Discussion
Applicability of Low-Cost UAS
In this study, we present an innovative, integrated remote sensing approach which combines low-cost UAS techniques with open-source GIS and freely available image processing software. The methodology described allowed us to map invasive A. mangium trees with high accuracy with a reasonable effort. The classification algorithm based on the training data can be applied to image data collected by the same camera sensor at new sites, and the resulting maps can improve the information base for invasive plant management. In general, this approach can allow environmental managers to monitor the distribution and spread of invasive plants in similar situations once the classification models are adjusted to the respective species. Environmental managers should be strongly encouraged to use low-cost UAS approaches to avoid high costs and time-consuming field surveys, especially in sites of low accessibility (Wan et al., 2014; Chabot et al., 2016; Hill et al., 2016; Müllerová et al., 2017). Minimizing in situ mapping and control operations is also an added advantage for using UAS, because reduction in habitat disturbance can encourage the recovery of native plants that are threatened by biological invasion (Mack and D'Antonio, 1998; Huston, 2004).
Several studies have already used UAS acquired image data successfully for detecting and monitoring invasive plants. However, these studies used either expensive high-end UAS (e.g., Michez et al., 2016) or commercial image processing and analysis software. For example, Müllerová et al. (2017) used a self-built, low-cost fixed-wing UAS to detect invasive Robinia pseudoacacia in a recently published study, but applied commercial stitching software. Such sophisticated software products are usually expensive, often exceeding 3,000 US dollars for a single license. Our results show that open source software may provide sound alternatives, from image data pre-processing to image analysis.
Technical Considerations
There are also drawbacks related to low-cost software and techniques. Compared to commercial photogrammetric processing software, Microsoft ICE image processing may lead to poorer geometric accuracy. However, it is the best free-of-charge option for UAS photogrammetric application and suitable for UAS applications unless high geometric accuracy (<2 m) is required (Gross and Heumann, 2016). Consumer-grade camera sensors have spectral limitations and provide poorer image quality compared to commercial-grade camera sensors: in RGB and CIR orthomosaics, both imagery blurring and partial distortion effects are noticeable. Blurring can be caused by fast movements of the aerial platform during image acquisition, e.g., due to wind or turbulence, as well as by faulty images used in the mosaicking. This can generate errors in the visual or automatic analysis of the image data and reduce the accuracy of automatic photogrammetric processing algorithms. In this study, only a few photos had to be removed because of their poor quality. Some of the remaining images, however, also showed some quality loss. Thus, using such Do-it-Yourself approaches always includes a tradeoff between removing low quality images and avoiding potential gaps in the final orthoimagery. A high overlap of individual images is necessary to provide flexibility in the use or removal of single low-quality images. The detection and removal of blurred images are currently done manually, and is a time-consuming, error-prone process, particularly with large image sets. Further, the removal of low quality images can negatively influence subsequent post-processing steps since less data are available. Fortunately, new studies dealing with automatic detection of blurred images in UAV image sets have been published recently (Ribeiro-Gomes et al., 2016; Sieberth et al., 2016).
Some spectral limitations of the CIR imagery are a consequence of the camera sensor modification. Since we used a cyan filter (which blocks the visible red light), the sensor recorded only in the NIR, green and blue channels. Most traditional vegetation indices, however, include the red band. As a consequence, we used the green band instead in order to calculate modified VIs. This limits comparability of indices based on images from modified low-cost cameras and from professional sensors (or literature values). Nevertheless, UAS-based application of modified low-cost cameras are promising for detecting and mapping invasive plants, although the results may vary among species of interest because vegetation is characterized by strong reflectance in the NIR.
Remote-Sensing Approaches
Remotely-sensed vegetation indices (VI) have been extensively used for monitoring and detecting invasive tree species (Huang and Asner, 2009; Huang et al., 2010; He et al., 2011; Bradley, 2014). VI related to physical leaf features like greenness, chlorophyll or water/ moisture content, richness in lignin, nitrogen, and cellulose have especially proved to be highly effective in differentiating Acacia species from surrounding vegetation (Larsson, 1993; Oldeland et al., 2010; Große-Stoltenberg et al., 2016). The vegetation indices applied in this study were highly efficient in distinguishing invasive A. mangium trees from surrounding native Mussununga vegetation. In particular, the modified Triangular Vegetation Index (mTVI) separated A. mangium well. This index originally belongs to narrowband VI (Broge and Leblanc, 2001). Nevertheless, prior applications of the mTVI in a remote sensing study by the authors (Lehmann et al., 2016) also revealed high potential to distinguish plant species using imagery acquired with a self-modified CIR camera sensor.
In addition to spectral features, the DSM computed from the UAS-based aerial RGB images provided clues for the recognition of invasive A. mangium because it grows taller than the surrounding vegetation. We found a strong correlation between predicted and measured tree heights. This was facilitated by the flat terrain in the study area. However, in areas with substantial elevation differences, an underlying terrain model must be considered. Similar studies showed the potential of canopy-height models generated from UAS image data. Zarco-Tejada et al. (2014) used high-resolution image data to generate a precise DSM and a Digital Terrain Model (DTM) of their study site. By subtracting the DSM from the DTM, an informative canopy height model of the forest in the study was created. They concluded that surface models derived from UAS-acquired high-resolution image data can be as accurate as those generated with expensive, computationally more complex light detection and ranging (LIDAR) systems currently used in agricultural and environmental applications. Still, the Structure from Motion-based generation of canopy-height models that we applied in this study can be challenging to non-experts in remote sensing. The use of open-source software for this purpose also involves some obstacles as it requires a stepwise combination of various software modules, in contrast to expensive commercial software in which all required functions are combined in one product.
The classification strategies used in this study denote a further problem: only partial tree crown areas were recognized and correctly classified as A. mangium. This is possibly due to the low illumination angle of the morning hours when the UAS was flown. In general, pixel-based clustering algorithms only use the spectral values of each pixel, but neglect texture and, hence, often result in image speckle and overall inaccuracies when applied to fine-resolution imagery. Object based image analysis (OBIA) can be suitable to improve classification results and reduce these speckle (“salt-and-pepper”) effects (Blaschke, 2010). In contrast to pixel-based analysis, OBIA includes the geometric properties of the target plant species, such as dimension or texture. Open-source software already shows high potential in using this method (ORFEO Toolbox for Grass GIS), but the application is still complex and availability of algorithms is limited compared with commercial software (e.g., eCognition). In this study, visual image interpretation, in addition to the pixel-based classification, improved the identification of A. mangium, even in large areas.
Integration of UAS-Based Remote Sensing into Management of Invasive Plant Species
Evidently UAS offer capabilities for mapping the occurrence, dynamic or extent of invasive plant species in an area. Furthermore, UAS acquired remote sensing data generate additional valuable geospatial information for management. Bare soil cover, for example, can be quantified from vegetation index maps. We were able to map bare soil areas with high accuracy using simple semi-automatic classification. As mentioned before, disturbance increases opportunities for the spread of invasive plants (Lorenzo et al., 2010; Le Maitre et al., 2011) in open areas, on bare soil and other modified sites such as roadsides, trails, and degraded vegetation. These areas should, therefore, be a priority for preventative monitoring and early detection of invasive species followed by eradication or control.
There are three major approaches for managing invasive alien species. The first one refers to the prevention of species introductions to countries. Despite recent efforts to discriminate species for deliberate introductions and improve control of involuntary introductions, the rate of species introductions has not declined at the global level (Seebens et al., 2017). The second approach refers to early detection and rapid response for eradication or containment, and the third to sustained control over time once populations have grown too large or too widespread to be eradicated (Wittenberg and Cock, 2001). Species that invade forests can unfortunately not be mapped from the air, but most invasive plants thrive in open ecosystems, belonging to the group of pioneer species. The UAS technology can strongly contribute to improve current methods of inventory and prioritization for the eradication or control of these plants, as covering large areas on foot, often in difficult or inaccessible terrain, can be counterproductive or simply not viable in terms of cost, safety or practicability. Detection at early stages of invasion provides the best chance for successful eradication or control, as both cost and effort are still low and more feasible. UAS can greatly increase the opportunities for early detection in open ecosystems such as Mussununga, coastal scrub (“restingas” in Brazil), wetlands, grasslands, savannas and degraded areas, especially when the invasive plants are taller or somehow stand out in the native vegetation matrix—as acacias in Mussununga.
In any given area the control of invasive plants is initially easier, as there tend to be more individuals to locate and remove. As work progresses, finding isolated or few remaining plants becomes more challenging, leading to increased costs and work hours to locate them. It is often relevant to locate and remove mature plants first to prevent the seed production and renew the seed bank in the soil. Finding these plants is often difficult, especially in sloping terrain, coastal dunes or in patches of high and low vegetation where visibility on the ground is limited. UAS have high potential in facilitating the location of such plants. Even if not 100% precise, excluding areas where invasive plants clearly do not occur can still save much time and effort in the field.
Open areas of high susceptibility to invasion can be identified in UAS-based imagery, then surveyed by targeted field sampling. Further, aerial imagery can be processed into geo-referenced orthomosaics right after the completion of UAS flights for immediate control. Such UAS-based aerial image maps are more up-to-date and offer higher spatial resolution compared to freely available products, such as imagery from Google Earth. UAS can, thus, be used to support immediate management actions in the field as well as monitor the results of control efforts, especially when the ideal time to revisit specific sites to repeat control operations on remaining plants or on new plants grown from the seed bank is not clear, which is often the case. Revisiting control sites is crucial to prevent new plants from reaching maturity, replenishing the seed bank in the soil and renewing the invasion process.
Conclusion
Potential uses of UAS will rapidly increase as the technology and related software is steadily developed further. However, some relevant elements will remain important. The key to success in UAS-based aerial photography is thorough pre-flight preparation, including careful flight planning. Part of the planning process should always involve defining specifications for the desired digital (photographic) end-product before going into the field. The main mission requirements need to be defined and analyzed to determine all relevant flight parameters. For instance, legal regulations and site accessibility are important aspects of the practical application of UAS technology. Authorization from national companies and landowners may be necessary to conduct UAS research. It may also be important to acquire an insurance policy. In view of all the possible requirements, a review of local laws and regulations is always vital. Careful pre-flight planning and logistical preparations tend to eliminate the majority of potential mission problems. Still, mishaps cannot be avoided completely and should, therefore, be taken into account. Accordingly, spare parts and backup equipment are often essential for completing a mission successfully.
Despite some aforementioned limitations regarding sensor technology, image processing and analysis software used in this study, the results demonstrate significant potential for practical application of UAS in the management of invasive species. Managers can use this new approach to effectively carry out ground surveys and, then, implement eradication or control actions as well as monitor reinvasion and define the best time to revisit sites under control. Not only the rapid development in the area of drone technology in recent years, but also the growing development of new, open-source software products for increasingly more complex and detailed image processing and analyses, have high potential for applied natural-area management. The authors of this study believe that drones, in combination with open-source software, will play an important role in invasive plant management in the future. Organizations working on natural area management around the world already have access to new, easy to use remote sensing UAS technologies that can increase management effectiveness and reduce planning as well as operational costs and field efforts.
Author Contributions
JL conceived and designed the study. JL, JT, GH, and TB performed field work and data acquisition. JL processed the image data and conducted the image analyses together with TP and JT. SZ discussed the results with the focus on invasive plant management. All authors discussed and commented on the manuscript.
Funding
This study contributes to the project “INSPECTED.NET” funded by the European Union's Seventh Framework Programme FP7-PEOPLE-2010-IRSES (Proposal No. 269206). We acknowledge support by Open Access Publication Fund of University of Muenster.
Conflict of Interest Statement
The authors declare that the research was conducted in the absence of any commercial or financial relationships that could be construed as a potential conflict of interest.
Acknowledgments
We wish to acknowledge the support of Ecodrones Brasil (http://www.ecodrones.com.br) for technical and also personnel support during the field campaign. We also would like to thank Tércia Vargas dos Santos, Amilcar Walter Saporetti Junior and Maria Carolina Nunes Alves da Silva for assisting in the field.
References
Aguiar, J., Barbosa, R. I., Barbosa, J. B. F., and Mourão, J. (2014). Invasion of Acacia mangium in Amazonian savannas following planting for forestry. Plant Ecol. Divers. 7, 359–369. doi: 10.1080/17550874.2013.771714
Alvares, C. A., Stape, J. L., Sentelhas, P. C., de Moraes Gonçalves, J. L., and Sparovek, G. (2013). Köppen's climate classification map for Brazil. Meteorol. Z. 22, 711–728. doi: 10.1127/0941-2948/2013/0507
Anderson, K., and Gaston, K. J. (2013). Lightweight unmanned aerial vehicles will revolutionize spatial ecology. Front. Ecol. Environ. 11, 138–146. doi: 10.1890/120150
Bellard, C., Cassey, P., and Blackburn, T. (2016). Alien species as a driver or recent extinctions. Biol. Lett. 12:20150623. doi: 10.1098/rsbl.2015.0623
Blaschke, T. (2010). Object based image analysis for remote sensing. ISPRS J. Photogramm. Remote Sens. 65, 2–16. doi: 10.1016/j.isprsjprs.2009.06.004
Bradley, B. A. (2014). Remote detection of invasive plants: a review of spectral, textural and phenological approaches. Biol. Invasions 16, 1411–1425. doi: 10.1007/s10530-013-0578-9
Bradley, B. A., and Mustard, J. F. (2006). Characterizing the landscape dynamics of an invasive plant and risk of invasion using remote sensing. Ecol. Appl. 16, 1132–1147. doi: 10.1890/1051-0761(2006)016[1132:CTLDOA]2.0.CO;2
Broge, N. H., and Leblanc, E. (2001). Comparing prediction power and stability of broadband and hyperspectral vegetation indices for estimation of green leaf area index and canopy chlorophyll density. Remote Sens. Environ. 76, 156–172. doi: 10.1016/S0034-4257(00)00197-8
Chabot, D., Dillon, C., Ahmed, O., and Shemrock, A. (2016). Object-based analysis of UAS imagery to map emergent and submerged invasive aquatic vegetation: a case study. J. Unmanned Veh. Syst. 5, 27–33. doi: 10.1139/juvs-2016-0009
Colomina, I., and Molina, P. (2014). Unmanned aerial systems for photogrammetry and remote sensing: a review. ISPRS J. Photogramm. Remote Sens. 92, 79–97. doi: 10.1016/j.isprsjprs.2014.02.013
Congedo, L. (2016). Semi-Automatic Classification Plugin Documentation. doi: 10.13140/RG.2.2.29474.02242/1
Delnatte, C., and Meyer, J.-Y. (2012). Plant introduction, naturalization, and invasion in French Guiana (South America). Biol. Invasions 14, 915–927. doi: 10.1007/s10530-011-0129-1
Dvořák, P., Müllerová, J., Bartaloš, T., and Brůna, J. (2015). Unmanned aerial vehicles for alien plant species detection and monitoring. ISPRS - Int. Arch. Photogramm. Remote Sens. Spat. Inf. Sci. 1, 83–90. doi: 10.5194/isprsarchives-XL-1-W4-83-2015.
Ferreira, V. B. R., Nascimento, M. T., and de, M. L. F. T. (2014). Floristic and phytogeographic pattern of native field in southeastern Brazil. Acta Bot. Bras. 28, 465–475. doi: 10.1590/0102-33062014abb3556
Große-Stoltenberg, A., Hellmann, C., Werner, C., Oldeland, J., and Thiele, J. (2016). Evaluation of Continuous VNIR-SWIR spectra versus narrowband hyperspectral indices to discriminate the invasive Acacia longifolia within a Mediterranean Dune Ecosystem. Remote Sens. 8:334. doi: 10.3390/rs8040334
Gross, J. W., and Heumann, B. W. (2016). A statistical examination of image stitching software packages for use with unmanned aerial systems. Photogramm. Eng. Remote Sens. 82, 419–425. doi: 10.14358/PERS.82.6.419
Halfeld-Vieira, B. A., and Nechet, K. L. (2009). First report of powdery mildew of Acacia mangium in Brazil. Summa Phytopathol. 35:237. doi: 10.1590/S0100-54052009000300016
He, K. S., Rocchini, D., Neteler, M., and Nagendra, H. (2011). Benefits of hyperspectral remote sensing for tracking plant invasions. Divers. Distrib. 17, 381–392. doi: 10.1111/j.1472-4642.2011.00761.x
Hill, D. J., Tarasoff, C., Whitworth, G. E., Baron, J., Bradshaw, J. L., and Church, J. S. (2016). Utility of unmanned aerial vehicles for mapping invasive plant species: a case study on yellow flag iris (Iris pseudacorus L.). Int. J. Remote Sens. 38, 8–10. doi: 10.1080/01431161.2016.1264030
Huang, C., and Asner, G. P. (2009). Applications of remote sensing to alien invasive plant studies. Sensors 9, 4869–4889. doi: 10.3390/s90604869
Huang, Y., Thomson, S. J., Lan, Y., and Maas, S. J. (2010). Multispectral imaging systems for airborne remote sensing to support agricultural production management. Int. J. Agric. Biol. Eng. 3, 50–62. doi: 10.3965/j.issn.1934-6344.2010.01.050-062
Huston, M. A. (2004). Management strategies for plant invasions: manipulating productivity, disturbance, and competition. Divers. Distrib. 10, 167–178. doi: 10.1111/j.1366-9516.2004.00083.x
IBGE - Instituto Brasileiro de Geografia e Estatística (2004). Mapa da vegetação do Brasil. Escala 1:5,000,000. Rio de Janeiro: IBGE. Available online at: http://mapas.ibge.gov.br/tematicos/vegetacao.html. (Accessed on 17 January 2017).
Laliberte, A. S., Winters, C., and Rango, A. (2011). UAS remote sensing missions for rangeland applications. Geocarto Int. 26, 141–156. doi: 10.1080/10106049.2010.534557
Larsson, H. (1993). Linear regressions for canopy cover estimation in acacia woodlands using Landsat-TM,-MSS and SPOT HRV XS data. Int. J. Remote Sens. 14, 2129–2136. doi: 10.1080/01431169308954025
Lehmann, J. R. K., Münchberger, W., Knoth, C., Blodau, C., Nieberding, F., Prinz, T., et al. (2016). High-resolution classification of South Patagonian Peat Bog microforms reveals potential gaps in up-scaled CH4 fluxes by use of Unmanned Aerial System (UAS) and CIR Imagery. Remote Sens. 8:173. doi: 10.3390/rs8030173
Le Maitre, D. C., Gaertner, M., Marchante, E., Ens, E.-J., Holmes, P. M., Pauchard, A., et al. (2011). Impacts of invasive Australian acacias: implications for management and restoration. Divers. Distrib. 17, 1015–1029. doi: 10.1111/j.1472-4642.2011.00816.x
Lima, R. A. F., de Mori, D. P., Pitta, G., Melito, M. O., Bello, C., Magnago, L. F., et al. (2015). How much do we know about the endangered Atlantic Forest? Reviewing nearly 70 years of information on tree community surveys. Biodivers. Conserv. 24, 2135–2148. doi: 10.1007/s10531-015-0953-1
Lorenzo, P., González, L., and Reigosa, M. J. (2010). The genus Acacia as invader: the characteristic case of Acacia dealbata link in Europe. Ann. For. Sci. 67, 101p1–101p11. doi: 10.1051/forest/2009082
Mack, M. C., and D'Antonio, C. M. (1998). Impacts of biological invasions on disturbance regimes. Trends Ecol. Evol. 13, 195–198. doi: 10.1016/S0169-5347(97)01286-X
Mack, R. N., Simberloff, D., Lonsdale, W. M., Evans, H., Clout, M., and Bazzaz, F. A. (2000). Biotic invasions: causes, epidemiology, global consequences, and control. Ecol. Appl. 10, 689–710. doi: 10.1890/1051-0761(2000)010[0689:BICEGC]2.0.CO;2
Michez, A., Piégay, H., Jonathan, L., Claessens, H., and Lejeune, P. (2016). Mapping of riparian invasive species with supervised classification of Unmanned Aerial System (UAS) imagery. Int. J. Appl. Earth Obs. Geoinf. 44, 88–94. doi: 10.1016/j.jag.2015.06.014
Müllerová, J., Bartaloš, T., Brůna, J., Dvořák, P., and Vítková, M. (2017). Unmanned aircraft in nature conservation: an example from plant invasions. Int. J. Remote Sens. 38, 8–10. doi: 10.1080/01431161.2016.1264030
Müllerová, J., Brůna, J., Dvořák, P., Bartaloš, T., and Vítková, M. (2016). “Does the data resolution/origin matter? Satellite, airborne and UAV imagery to tackle plant invasions,” in ISPRS - International Archives of the Photogrammetry, Remote Sensing and Spatial Information Sciences, Vol. XLI-B7 (Prague), 903–908. doi: 10.5194/isprs-archives-XLI-B7-903-2016
National Research Council (1983). Mangium and Other Fast-Growing Acacias for the Humid Tropics. Washington, DC: National Academy Press.
Oldeland, J., Dorigo, W., Wesuls, D., and Jürgens, N. (2010). Mapping bush encroaching species by seasonal differences in hyperspectral imagery. Remote Sens. 2, 1416–1438. doi: 10.3390/rs2061416
Osunkoya, O. O., Othman, F. E., and Kahar, R. S. (2005). Growth and competition between seedlings of an invasive plantation tree, Acacia mangium, and those of a native Borneo heath-forest species, Melastoma beccarianum. Ecol. Res. 20, 205–214. doi: 10.1007/s11284-004-0027-4
Pimentel, D. (2002). “Economic and environmental threats of alien plant, animal, and microbe invasions,” in Biological Invasions - Economic and Environmental Costs of Alien Plant, Animal and Microbe Species, ed D. Pimentel (Boca Raton, FL: CRC Press), 307–329.
Rejmánek, M. (2000). Invasive plants: approaches and predictions. Aust. Ecol. 25, 497–506. doi: 10.1046/j.1442-9993.2000.01080.x
Ribeiro-Gomes, K., Hernandez-Lopez, D., Ballesteros, R., and Moreno, M. A. (2016). Approximate georeferencing and automatic blurred image detection to reduce the costs of UAV use in environmental and agricultural applications. Biosyst. Eng. 151, 308–327. doi: 10.1016/j.biosystemseng.2016.09.014
Richardson, D. M., Hui, C., Nuñez, M. A., and Pauchard, A. (2014). Tree invasions: patterns, processes, challenges and opportunities. Biol. Invasions 16, 473–481. doi: 10.1007/s10530-013-0606-9
Richardson, D. M., and Rejmánek, M. (2011). Trees and shrubs as invasive alien species – a global review. Divers. Distrib. 17, 788–809. doi: 10.1111/j.1472-4642.2011.00782.x
Ritchie, G. L., Sullivan, D. G., Perry, C. D., Hook, J. E., and Bednarz, C. W. (2008). Preparation of a low-cost digital camera system for remote sensing. Appl. Eng. Agric. 24, 885–894. doi: 10.13031/2013.25359
Saporetti-Junior, A. W., Schaefer, C. E. G. R., Soares, M. P., Araújo, D. S. D., and Meira-Neto, J. A. A. (2012). Influence of soil physical properties on plants of the mussununga ecosystem, Brazil. Folia Geobot. 47, 29–39. doi: 10.1007/s12224-011-9106-9
Seebens, H., Blackburn, T. M., Dyer, E. E., Genovesi, P., Hulme, P. E., Jeschke, J. M., et al. (2017). No saturation in the accumulation of alien species worldwide. Nat. Commun. 8:14435. doi: 10.1038/ncomms14435
Sieberth, T., Wackrow, R., and Chandler, J. H. (2016). Automatic detection of blurred images in UAV image sets. ISPRS J. Photogramm. Remote Sens. 122, 1–16. doi: 10.1016/j.isprsjprs.2016.09.010
Spring, D., Croft, L., and Kompas, T. (2017). Look before you treat: increasing the cost effectiveness of eradication programs with aerial surveillance. Biol. Invasions 19, 521–535. doi: 10.1007/s10530-016-1292-1
The Horus Institute National Database of Invasive Alien Species Brazil (2017). Available online at: http://i3n.institutohorus.org.br/www (Accessed on 23 February, 2017).
Valavanis, K. P., and Vachtsevanos, G. J. (2015). Handbook of Unmanned Aerial Vehicles. Springer Publishing Company, Incorporated. Available online at: http://www.springer.com/de/book/9789048197064
Vilà, M., Espinar, J. L., Hejda, M., Hulme, P. E., Jarošík, V., Maron, J. L., et al. (2011). Ecological impacts of invasive alien plants: a meta-analysis of their effects on species, communities and ecosystems. Ecol. Lett. 14, 702–708. doi: 10.1111/j.1461-0248.2011.01628.x
Vilà, M., and Ibáñez, I. (2011). Plant invasions in the landscape. Landsc. Ecol. 26, 461–472. doi: 10.1007/s10980-011-9585-3
Wan, H., Wang, Q., Jiang, D., Fu, J., Yang, Y., and Liu, X. (2014). Monitoring the invasion of Spartina alterniflora using very high resolution unmanned aerial vehicle imagery in Beihai, Guangxi (China). Sci. World J. 2014:e638296. doi: 10.1155/2014/638296
Wittenberg, R., and Cock, M. J. W. (eds.). (2001). “Invasive alien species: a toolkit of best prevention and management practices,” in CAB International (Wallingford), 228. doi: 10.1079/9780851995694.0000
Wu, C. (2013). “Towards linear-time incremental structure from motion,” in 2013 International Conference on 3D Vision - 3DV (Seattle, WA), 127–134.
Zarco-Tejada, P. J., Diaz-Varela, R., Angileri, V., and Loudjani, P. (2014). Tree height quantification using very high resolution imagery acquired from an unmanned aerial vehicle (UAV) and automatic 3D photo-reconstruction methods. Eur. J. Agron. 55, 89–99. doi: 10.1016/j.eja.2014.01.004
Keywords: Acacia mangium, drone, invasive alien species, Mussununga, RPAS, remote sensing, UAV, QGIS
Citation: Lehmann JRK, Prinz T, Ziller SR, Thiele J, Heringer G, Meira-Neto JAA and Buttschardt TK (2017) Open-Source Processing and Analysis of Aerial Imagery Acquired with a Low-Cost Unmanned Aerial System to Support Invasive Plant Management. Front. Environ. Sci. 5:44. doi: 10.3389/fenvs.2017.00044
Received: 10 March 2017; Accepted: 28 June 2017;
Published: 11 July 2017.
Edited by:
Nancy F. Glenn, Boise State University, United StatesReviewed by:
Julius B. Adewopo, International Institute of Tropical Agriculture, NigeriaMaggi Kelly, University of California, Berkeley, United States
Copyright © 2017 Lehmann, Prinz, Ziller, Thiele, Heringer, Meira-Neto and Buttschardt. This is an open-access article distributed under the terms of the Creative Commons Attribution License (CC BY). The use, distribution or reproduction in other forums is permitted, provided the original author(s) or licensor are credited and that the original publication in this journal is cited, in accordance with accepted academic practice. No use, distribution or reproduction is permitted which does not comply with these terms.
*Correspondence: Jan R. K. Lehmann, jan.lehmann@uni-muenster.de