Assessment of the Impacts of Climate Change on Maize Production in the Southern and Western Highlands Sub-agro Ecological Zones of Tanzania
 Philbert M. Luhunga
- Research Section, Tanzania Meteorological Agency, Dar es Salaam, Tanzania
The Intergovernmental Panel on Climate Change (IPCC) fourth assessment report confirmed that climate change is unequivocal. It is coming to us faster with larger impacts and bigger risks than even most climate scientists expected as recently as a few years ago. One particular worry is the disastrous consequence to agriculture and food security sectors in many parts of the world, particularly in developing countries. Adaptation is the only option to reduce the impacts of climate change. However, before planning adaptation policies or strategies to climate change, it is important to assess the impacts of climate change at regional and local scale to have scientific evidence that would guide the formulation of such policies or strategies. In this study the impacts of climate change on rain-fed maize (Zea Mays) production in the southern and western highlands sub-agro ecological zones of Tanzania are evaluated. High resolution climate simulations from the Coordinated Regional Climate Downscaling Experiment_Regional Climate Models (CORDEX_RCMs) were used as input into the Decision Support System for Agro-technological Transfer (DSSAT) to simulate maize yield in the historical climate condition (1971–2000), present (2010–2039), mid (2040–2069), and end (2070–2099) centuries. Daily rainfall, solar radiations, minimum and maximum temperatures for the historical (1971–2000) climate condition and future climate projections (2010–2099) under two Representative Concentration Pathways (RCPs) RCP4.5 and RCP 8.5 were used to drive DSSAT. The impacts of climate change were assessed by comparing the average maize yields in historical climate condition against the average of simulated maize yields in the present, mid and end centuries under RCP4.5 and RCP8.5. Results of future maize yields estimates from DSSAT driven by individual RCMs under both RCP scenarios (RCP 4.5 and RCP 8.5) differs from one RCM to another and from one scenario to another. This highlight the uncertainty associated with the projection. Results from the ensemble average of the yields indicated that maize yields will decline in future climate condition by 3.1 and 5.3% under RCP 4.5 and RCP8.5, respectively. High decreases in maize yield of 9.6% are expected in the end centuries under RCP 8.5. The main reason for decline in maize yields during future climate is the increase in temperatures that will shorten the length of growing seasons. Seasonal minimum temperature and maximum temperature are expected to increase by 1.84 and 1.53°C, respectively under RCP 4.5 and by about 2.72 and 2.2°C, respectively, under RCP 8.5. Therefore it is recommended that more studies need to be carried, especially by crop breeders to find maize varieties that can withstand the impacts of increased temperatures over southern and western highlands sub-agro ecological zones of Tanzania.
Introduction
The economy of Tanzania heavily depends on the agriculture sector, which account for about half of gross production and employ about 80% of the labor force (Ahmed et al., 2011). It also contributes to about 30% of export earnings and 65% of raw materials for domestic industries (URT, 2008). However, the sector has performed very poor in recent decades in such a way that its full contribution to achieve food security in Tanzania has not been realized (Maliondo et al., 2012). Studies have revealed that the poor performance of the agriculture sector is attributed to over dependence on rain-fed agriculture as well as increasing erratic climate change and variability (Ehrhart and Twena, 2006; Enfors and Gordon, 2008; Müller et al., 2011). Moreover, previous studies by (Mwandosya et al., 1998; Agrawala et al., 2003; IPCC, 2007; Thornton et al., 2009, 2010; Ahmed et al., 2011; Arndt et al., 2011; Rowhani et al., 2011) have indicated that, the future climate change and variability may present even more serious challenges on agriculture sector in Tanzania. The Intergovernmental Panel on Climate Change (IPCC, 2007) has emphasized that in developing countries, including Tanzania, by 2020, between 75 and 250 million of people are predicted to be exposed to increased water stress due to climate change. The yields from rain-fed agriculture could be reduced by up to 50%. Agricultural production, including access to food, in many African countries, including Tanzania is projected to be severely compromised. This would further adversely affect food security and exacerbate malnutrition.
Several studies that address climate change impacts on crop production have been done in Tanzania (e.g., Mwandosya et al., 1998; Agrawala et al., 2003; URT, 2003; Ehrhart and Twena, 2006; IPCC, 2007; Enfors and Gordon, 2008; Thornton et al., 2009, 2010; Ahmed et al., 2011; Arndt et al., 2011; Müller et al., 2011; Rowhani et al., 2011). These studies have used climate change projections derived directly from the General Circulation Models (GCMs) to evaluate the impacts of climate change on rain-fed crop production in Tanzania. However, the GCMs classically run at 300 or 500 km space resolutions and are designed to simulate global or continent climate characteristics like global or continent temperature or rainfall amount. The coarse space resolution of the GCMs severely limits the direct application of their output in regional and sub-regional decision making (Masson and Knutti, 2011; Ramirez-Villegas and Challinor, 2012). This limitation is particularly challenging for country like Tanzania with high regional heterogeneity of its climate influenced by different topographic features (Mountain Kilimanjaro with the altitude of 5,895 m, Lake Victoria in the North, Lake Nyasa and River Ruvuma in the South and Lake Tanganyika in the West). Moreover the study by van Wart et al. (2013) underscored that GCMs climate change projections provide poor simulation of crop yield.
The poor performance of GCMs in estimating crop yields call into questions of the many prior evaluations of climate change impact on crop production in Tanzania. Furthermore, adaptation and mitigation policies developed based on GCMs simulation are not realistic and might pose significant challenges for anticipatory adaptation in the country. Therefore, credible evaluation of climate change impacts on rain-fed crop production using high resolution downscaled GCM simulations in Tanzania is required. This study evaluate the impacts of climate change on rain-fed maize production over southern, western highlands sub-agro ecological zones of Tanzania using high resolution climate simulations from the Coordinated Regional Climate Downscaling Experiment_Regional Climate Models (CORDEX_RCMs).
Data and Methodology
Study Area
The southern western Highlands agro ecological zone is located in the southern and western parts of Tanzania (Figure 1). The area is dominated by highlands with undulating plains to dissected hills and mountains (URT, 2006).
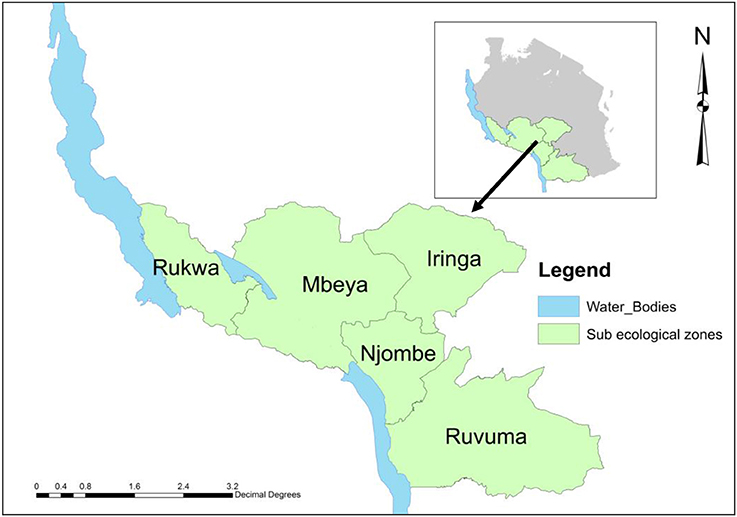
Figure 1. The area of study.
The southern and western highland ecological zone are divided into three sub-ecological zones, namely Southern-sub ecological zone-which includes the broad ridge from North Morogoro to North Lake Nyasa, covering part of Iringa, Mbeya, Southwestern-sub ecological zone-which includes the Ufipa plateau in Sumbawanga and the Western sub ecological zone-which includes areas along the shore of Lake Tanganyika in Kigoma and Kagera (URT, 2006). This study will be focused on the first two sub-agro ecological zones: Southern and the Southwestern sub ecological zones.
The southern and southwestern sub ecological zones respectively lie between 1,200–1,500 m and 1,400–2,300 m altitudes above mean sea level (URT, 2006). The zones contain some of the country's most fertile lands (Milder et al., 2013). The southern and the Southwestern sub ecological zones contain the main four major staple food production regions (Iringa, Mbeya, Ruvuma and Rukwa). These regions are the grain basket of Tanzania growing maize. Rainfall pattern over southern and southwestern sub ecological zones is Unimodal, falling from December to April on average of 100–200 mm per month. In recent years, rainfall has decreased whilst temperature has increased over regions receiving Unimodal patterns of rainfall (TMA, 2011). This trend of decreased rainfall and increased temperature may affect the future crop yields from rain-fed agriculture.
Data
Regional Climate Models
Climate simulations from three CORDEX Regional Climate Models (RCMs) forced by three GCMs were used as input into the crop model to simulate maize yields. Table 1 list the details of the CORDEX RCMs and driving GCMs used in this study. Most CORDEX RCMs operate with the spatial resolution of 0.44° by 0.44° which is approximately equivalent to 50 km by 50 km. For detailed descriptions of model physics and dynamics included in different CORDEX RCMs the reader may consult Nikulin et al. (2012).
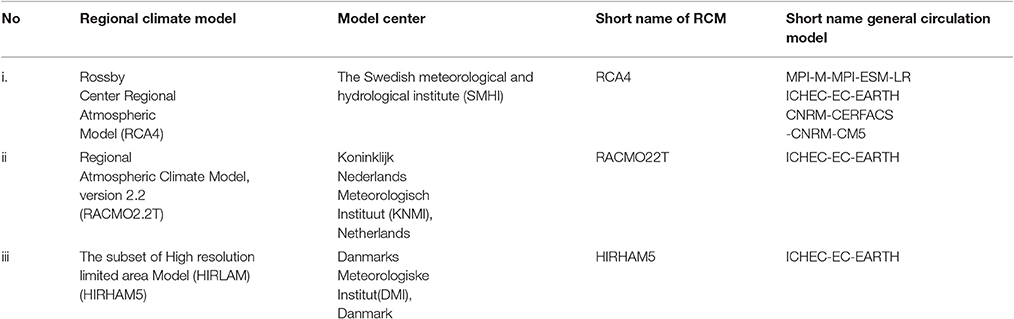
Table 1. CORDEX RCMs and the driving GCMs.
Daily rainfall, maximum and minimum temperatures, and solar radiations simulated by CORDEX RCMs under historical climate condition (1971–2000) and future climate projections (2010–2099) for two Representative Concentration Pathways (RCP4.5) and (RCP 8.5) scenarios were used for driving the crop model. Since climate models simulate climate variables such as at each grid point, interpolation technique of Near Neighbor (NN) was used to obtain climate variables close to areas where farming practices is carried out. The NN is the simplest interpolation technique which assumes that the climate variable of the areas of interest is equal to the climate variables at nearest grid point (Luhunga et al., 2016). Interpolated climate variables (daily rainfall, maximum and minimum temperatures and solar radiations) from individual CORDEX RCMs were used to drive the crop model to simulate maize growth, development and yields in the Southern and the southwestern sub ecological zones.
In the southern and western highlands sub-agro ecological zones of Tanzania, the CORDEX_RCMs generally simulate climate variables (rainfall, temperatures and solar radiations) differently (Figures 2–8). All individual models including the ensemble average misses to reproduce the phase change and the magnitude of rainfall in present climate (Figure 2). RCA4-CNRM indicate yearly maximum of rainfall in November, where in observed the maximum occurs in January. HIRHAM5-ICHEC and RACMO22T-ICHEC indicates one rainfall maximum in January, while in observation there are two rainfall maxima, one occurs in January and the other occurs in March. All in all, CORDEX_RCMs seems to produce too much rainfall in the southern and western highlands sub-agro ecological zones of Tanzania.
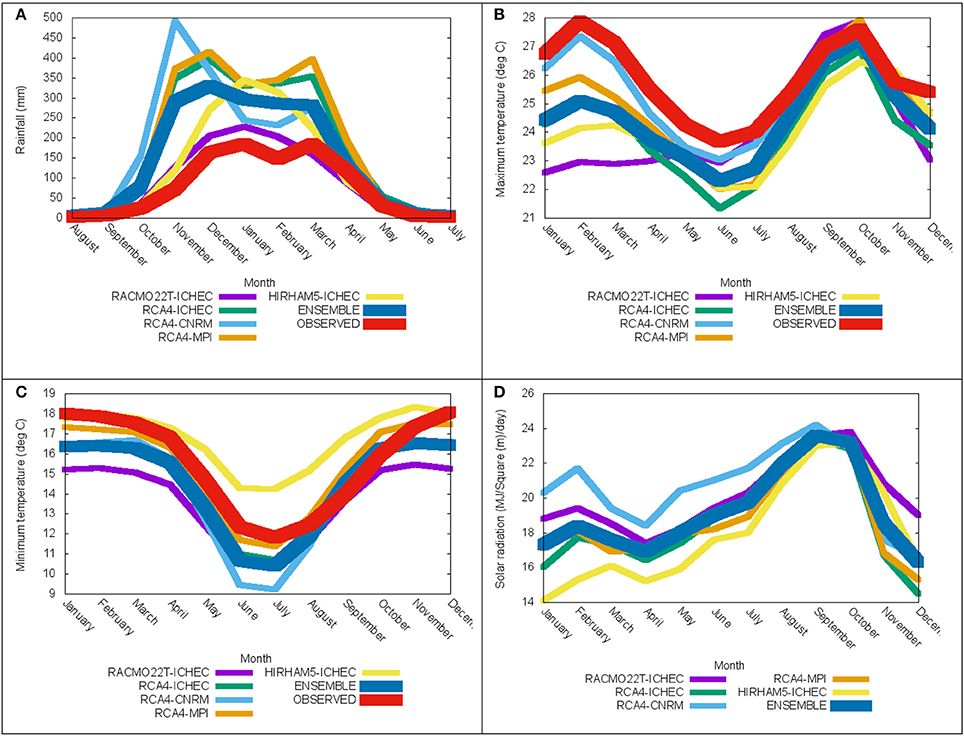
Figure 2. Long-term (1971–2000) annual cycle of climate variables over southern and western highlands sub-agro ecological zones of Tanzania (A) rainfall, (B) maximum temperature, (C) minimum temperature, and (D) Solar radiation.
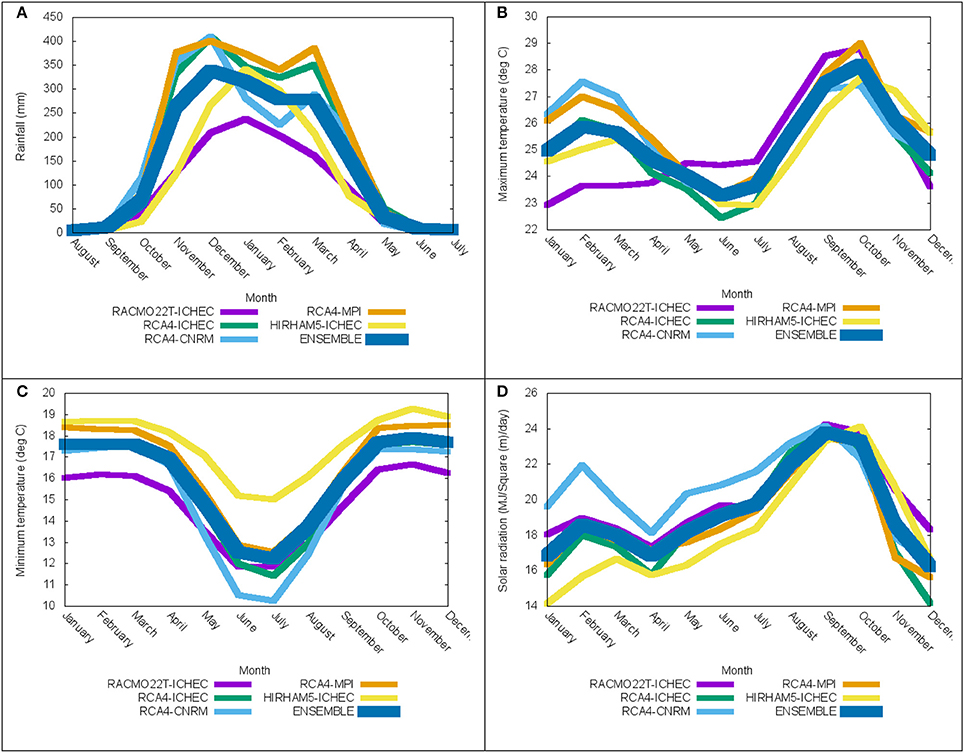
Figure 3. Long-term (2010–2039) annual cycle of climate variables over southern and western highlands sub-agro ecological zones of Tanzania under RCP8.5 (A) rainfall, (B) maximum temperature, (C) minimum temperature, and (D) Solar radiation.
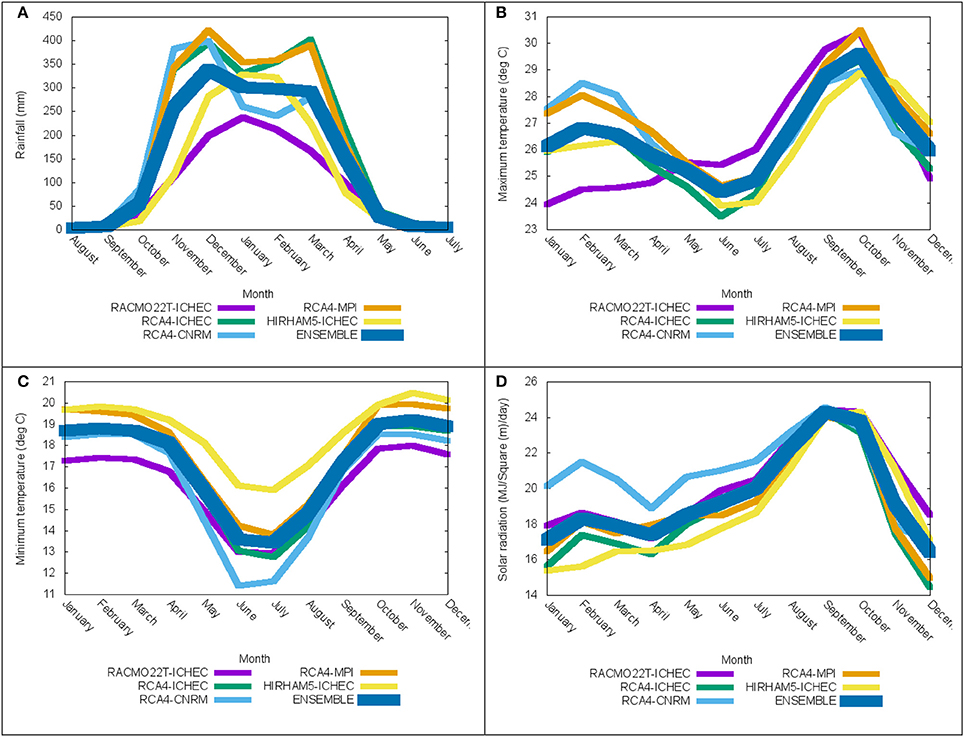
Figure 4. Long-term (2040–2069) annual cycle of climate variables over southern and western highlands sub-agro ecological zones of Tanzania under RCP8.5 (A) rainfall, (B) maximum temperature, (C) minimum temperature, and (D) Solar radiation.
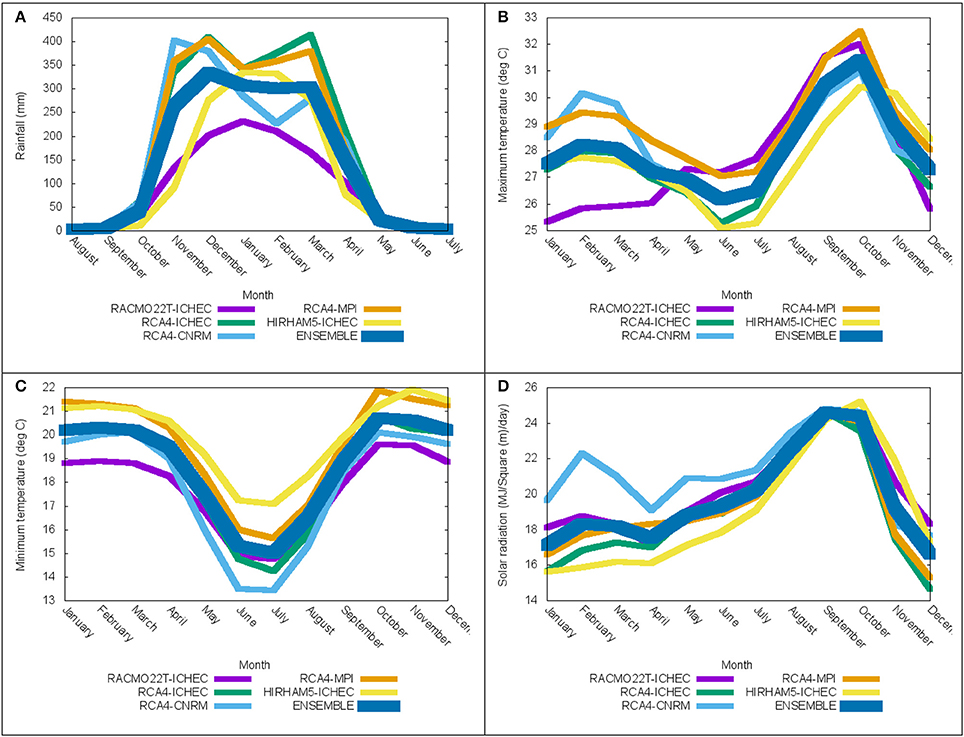
Figure 5. Long-term (2070–2099) annual cycle of climate variables over southern and western highlands sub-agro ecological zones of Tanzania under RCP8.5 (A) rainfall, (B) maximum temperature, (C) minimum temperature, and (D) Solar radiation.
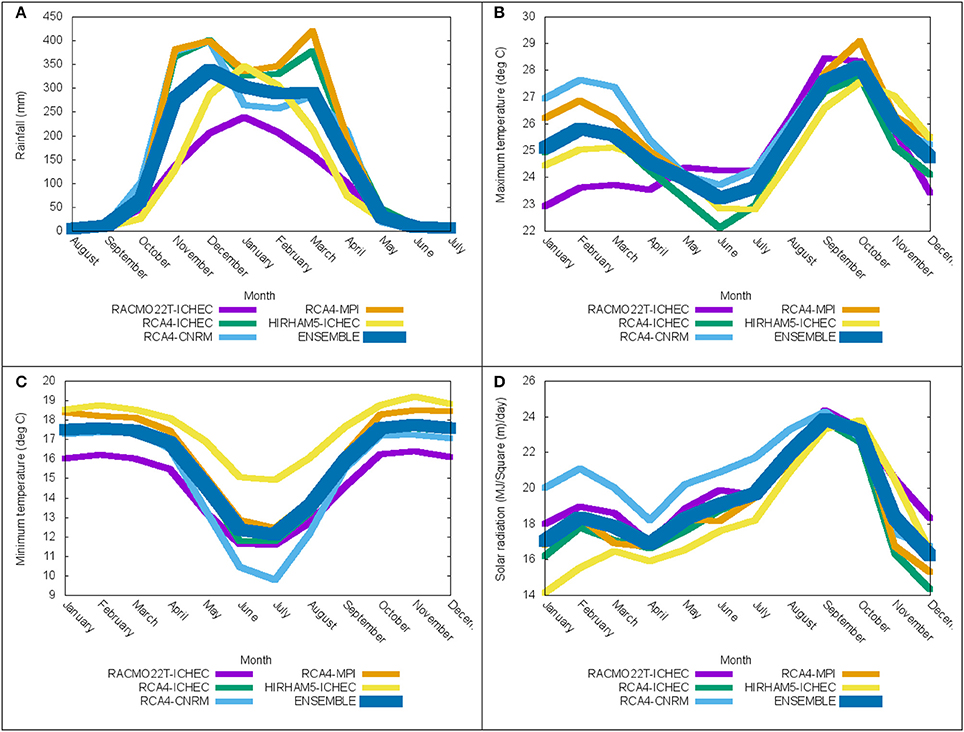
Figure 6. Long-term (2010–2039) annual cycle of climate variables over southern and western highlands sub-agro ecological zones of Tanzania under RCP4.5 (A) rainfall, (B) maximum temperature, (C) minimum temperature, and (D) Solar radiation.
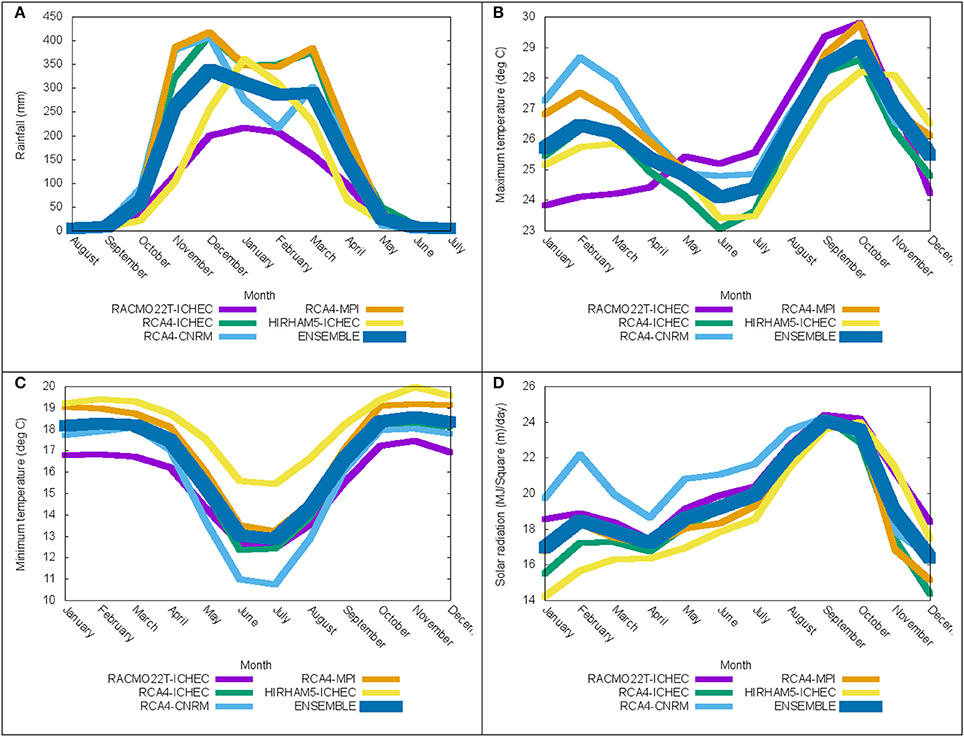
Figure 7. Long-term (2040–2069) annual cycle of climate variables over southern and western highlands sub-agro ecological zones of Tanzania under RCP4.5 (A) rainfall, (B) maximum temperature, (C) minimum temperature, and (D) Solar radiation.
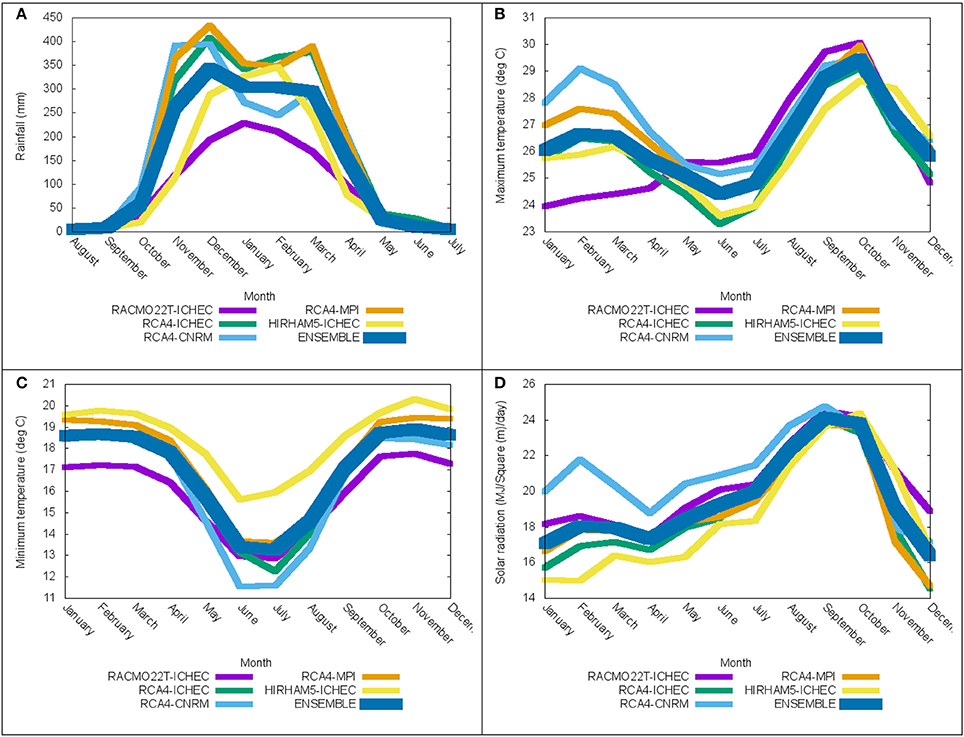
Figure 8. Long-term (2070–2099) annual cycle of climate variables over southern and western highlands sub-agro ecological zones of Tanzania under RCP4.5 (A) rainfall, (B) maximum temperature, (C) minimum temperature, and (D) Solar radiation.
The models simulate the annual cycle of minimum and maximum temperature fairly well (Figures 2B,C). However, the models spreads are large in simulating maximum temperature from January to July and decreases from August to December. In general all individual models and the ensemble average underestimate the magnitude of maximum temperature. The models captured fairly the magnitude of minimum temperature (Figure 2C).
The variation of the performance of CORDEX_RCMs to simulate seasonal cycle of climate variables, where some capture the phase and magnitude fairly well and others misses completely might be the source of uncertainties in the simulated maize yields over the southern, southwestern sub-ecological zones of Tanzania. It is important to note here that source of uncertainties may arise from both the RCMs and the driving GCMs. This can be analyzed when a same RCM driven by different GCMs and different RCMs forced by the same GCM simulate climate variables differently. For instance here RCA4 driven by three different GCMs (ICHEC, CNRM and MPI) simulate annual cycle of rainfall, temperatures, and solar radiation over the Southern and the southwestern sub ecological zones differently (Figure 2). Moreover, HIRHAM5, RACMO22T, and RCA4 forced by same GCM (ICHEC) simulate annual cycles of rainfall, temperatures and solar radiations differently (Figure 2). The most important information to note here is that the error from the RCMs and the driving GCMs contribute roughly equally.
The projection of annual cycle of climate variables in the southern and western highlands sub-agro ecological zones of Tanzania as simulated by CORDEX_RCMs under two Representative Concentration Pathway (RCP 4.5 and RCP 8.5) are presented in Figures 3–8. The models seem to reproduce the annual cycle of historical climate in the future climate condition. However, temperatures (minimum and maximum) are expected to increase in future climate. More increase in temperature is expected from September to October under the business as usual scenario (RCP 8.5).
Soil Profiles and Management Practices
A total of 8 soil profiles excavated within the study region are used. The hydrological properties of each soil profile were estimated using soil water properties calculator where the input variables include soil types (sand, silt, or clay) and organic matter (Saxton and Rawls, 2009). The output variables from the soil water properties calculator includes drained lower limit (SLLL; mm mm−1), drained upper limit (SLDUL; mm mm−1), saturation (SLSAT), and water content for each soil layer (Table 2).
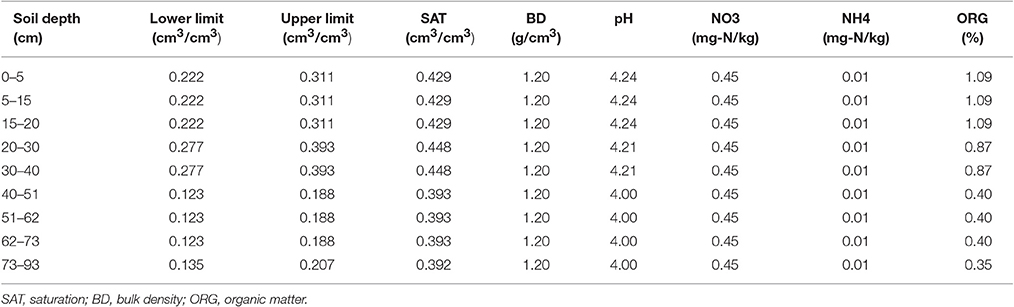
Table 2. Soil physical and chemical characteristics over Mbeya region, Tanzania.
In this study, the management practices were obtained from house hold survey conducted within the study regions. While actual and previous maize yields information were obtained from a comprehensive household panel survey database (The National Bureau of Statistics, 2012) (Table 3). Other management information such as planting density, planting and harvesting dates and the type of maize cultivars used per farm were obtained from interview conducted across the study region. This information was used to create crop model input data files.
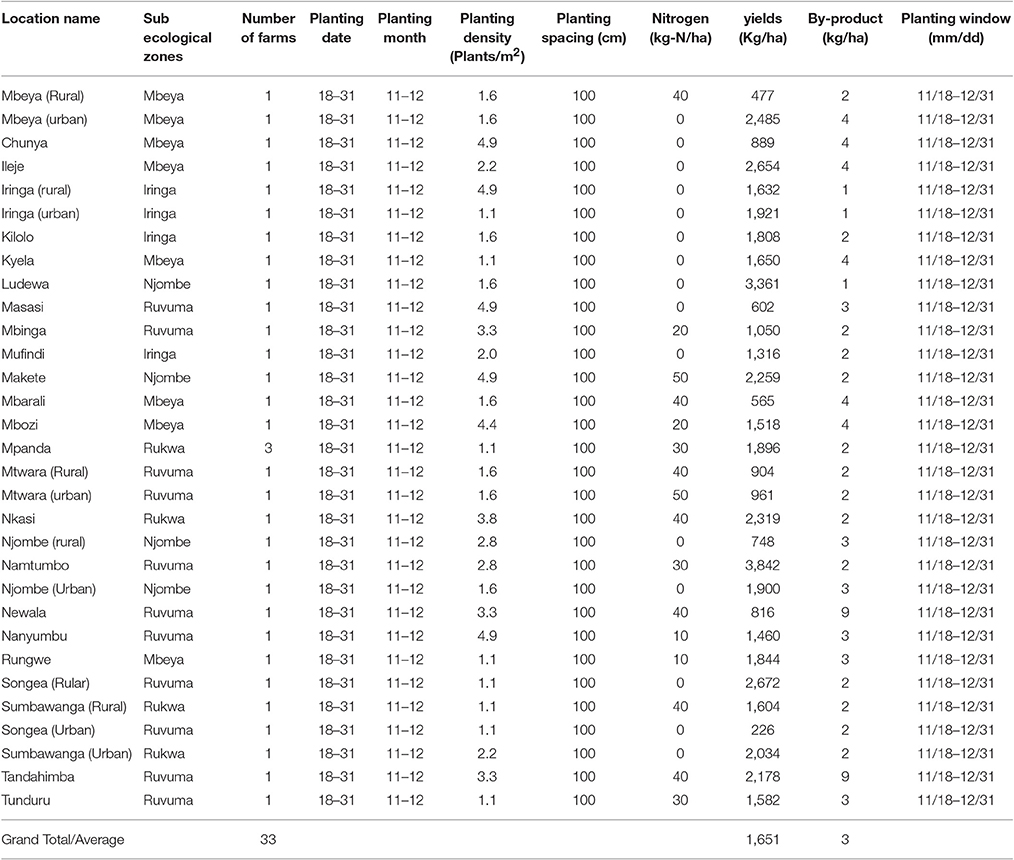
Table 3. Datailed information about the farms used to create crop model data input files.
Crop Model, Crop Model Input Files and Model Calibration
The Decision Support System for Agro-technological Transfer (DSSAT) (Jones et al., 2003) is an explanatory crop model that can quantitatively explain the processes and mechanisms that influence the behavior of the system (plant organs: leaf, stem, roots, and processes: growth, photosynthesis, transpiration etc.) (Luhunga et al., 2016). This model has been used intensively by different researchers, educators, consultants, extension agents, grower, policy and decision makers' worldwide (Hoogenboom et al., 2012). In this study DSSAT v4.5 was used to simulate maize yields over the southern western Highlands agro ecological zone. For detailed description of DSSAT v4.5 the reader may consult (Hoogenboom et al., 2012; Luhunga et al., 2016). DSSAT require soil profile, weather and crop management information to simulate yields. Weather information requested to run DSSAT includes daily values of incoming solar radiation (MJ/m2-day), maximum and minimum daily air temperature (°C), and daily rainfall (mm) totals. The dry and wet bulb temperatures and wind speed data may also be included as option data.
The model input files were created using a new protocol of the Agricultural Model inter-comparison and Improvement Project (AgMIP). For detailed description on how to create the model input files using AgMIP the reader may refer (Luhunga et al., 2016). Moreover DSSAT, particularly the Crop–Environment–Resource–Synthesis (CERES)-Maize model was calibrated over different regions using observed maize yield data for one season that was obtained from different districts in the southern and western highlands sub-agro ecological zones of Tanzania (Table 3). The calibration results indicate that the area averaged observed maize yields in the southern and western highlands sub-agro ecological zones of Tanzania was 1,651 kg/ha (Table 3), while the simulated area averaged maize yields was 1,723 kg/ha. This makes the area bias of simulated maize yields to be −72 kg/ha. It is also important to note that the standard deviation of the observed and simulated maize yields across different districts was 843 kg/ha and 652 kg/ha, respectively.
Simulation Setting on Assessing the Impact of Climate Change on Rainfed Maize Production
The impacts of climate change on maize production in the Southern and the southwestern sub ecological zones of Tanzania is assessed using a dynamic crop growth model CERES-maize which is the one of 28 different crop models embedded within DSSAT version 4.5. In order to simulate the impacts of climate change on maize development and yields and limit effects of other processes such as impacts of atmospheric carbon dioxide on yields through photosynthesis process. The crop model was run under fixed atmospheric carbon dioxide concentration (of 360 ppm) in the historical, present and future climate condition. Therefore changes in maize yields analyzed here are primarily from the effects of change in climate variables which are derived from CORDEX_RCMs simulation of historical, present and future climate conditions under RCP 4.5 and RCP 8.5 scenarios. It is important to note that results presented in this paper are for the growing season in the Southern and southwestern sub ecological zones which start from November to May (Table 3).
Results
Changes in Climate Variables during Growing Season
The minimum and maximum temperatures in the Southern and southwestern sub ecological zones are projected to increase in the future. Table 4 indicates that HIRHAM5-ICHEC predict warmer future (present-mid-end centuries) with mean maximum temperature increases ranging from 1°C to 2°C under RCP 4.5 and from 1°C to 4°C under RCP 8.5 relative to the baseline condition of (24°C). The model also predict a warmer future (present-mid-end centuries) with mean minimum temperature increases ranging from 1°C to 2°C under RCP 4.5 and from 1°C to 3°C under RCP 8.5 relative to the baseline condition of (18°C). The mean seasonal rainfall total is predicted by HIRHAM5-ICHEC to decline by 2, 4.7, and 0.2% during present, mid and end centuries, respectively under RCP 4.5, relative to the baseline condition of (1,246 mm). Moreover HIRHAM5-ICHEC predict decline of rainfall total by 5.5, 3.9, and 2% during present, mid and end centuries, respectively under RCP 8.5, relative to the baseline condition of (1,246 mm). Solar radiation is predicted HIRHAM5-ICHEC to remain constant during future climate condition under RCP 4.5 and RCP 8.5.
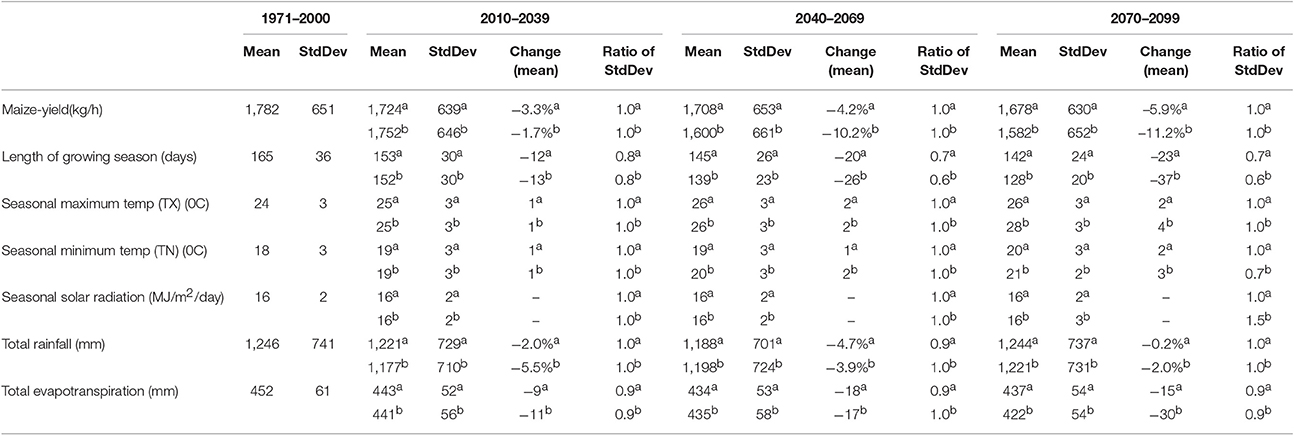
Table 4. Maize yields and seasonal climatic variable as simulated by crop model fed with climate data from HIRHAM5-RCM for aRCP 4.5 and bRCP 8.5.
Projected mean minimum and maximum temperature change by RACMO22T-ICHEC shows a warmer future in the Southern and southwestern sub ecological zones (Table 5). RACMO22T-ICHEC predict mean maximum temperature increases of 1°C from present to mid century, and 2°C increase in the end century under RCP 4.5, relative to the baseline condition of (23°C). The model also predict mean maximum temperature increases of 1°C, 2°C, and 3°C in present, mid and end centuries, respectively under RCP 8.5, relative to the baseline condition of (23°C). Model RACMO22T-ICHEC predicts high increase in mean minimum temperature in the range of 2°C to 3°C during present and mid centuries under both RCP 4.5 and RCP 8.5 relative to the baseline condition of (14°C). In addition the mean minimum temperature increases of 3°C and 5°C under RCP 4.5 and RCP 8.5, respectively is expected in the end century. The mean seasonal rainfall is predicted by RACMO22T-ICHEC to increase by 1.9% during present century under RCP 4.5. However, decline in seasonal rainfall of 3.4% and 1.8% is expected during mid and end centuries, respectively under RCP 4.5, relative to the baseline condition of (919 mm). Similar to model HIRHAM5-ICHEC, RACMO22T-ICHEC predicts no change in solar radiation during future climate conditions under RCP 4.5 and RCP 8.5.
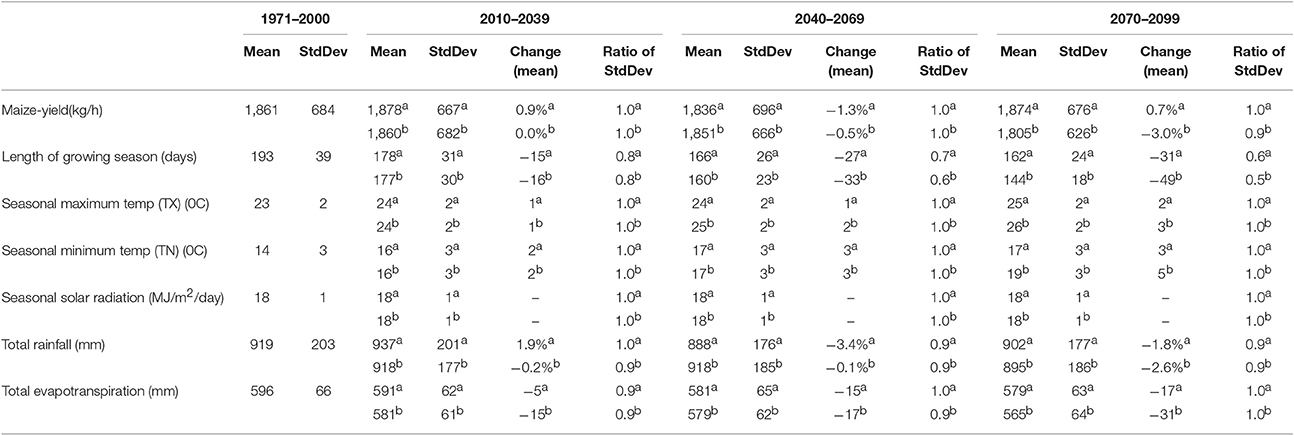
Table 5. Maize yields and seasonal climatic variable as simulated by crop model fed with climate data from RACMO-RCM for aRCP 4.5 and bRCP 8.5.
The model RCA4 forced by three GCMs (ICHEC, CNRM and MPI) predicts warmer future (Tables 6–8). In present century, model RCA4-ICHEC predicts the lowest increases in the mean maximum temperature of 0.8°C and 0.4°C under RCP 4.5 and RCP 8.5, respectively. The mean minimum temperature is predicted by RCA4-ICHEC to increases in the range of 1°C in present century to 3°C in end century, under RCP 4.5. Seasonal rainfall is predicted to increase by 2.8, 7.5, and 7.6% in present, mid and end centuries, respectively under RCP 4.5. In general RCA4 driven by all GCMs predicts warmer temperatures and increased in rainfall in future climate condition, under both RCP 4.5 and RCP 8.5.
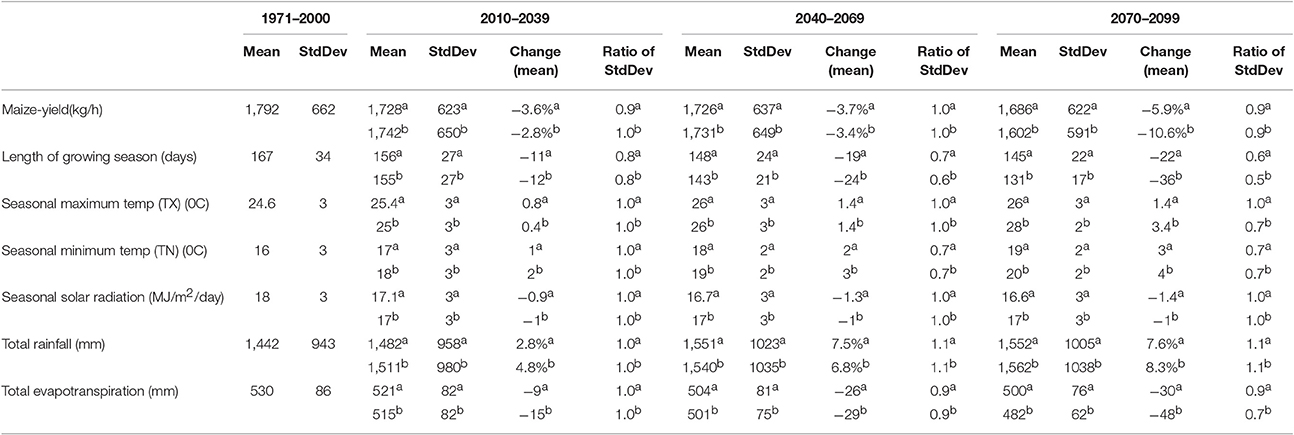
Table 6. Maize yields and seasonal climatic variable as simulated by crop model fed with climate data from RCA4-ICHEC-RCM for aRCP 4.5 and bRCP 8.5.
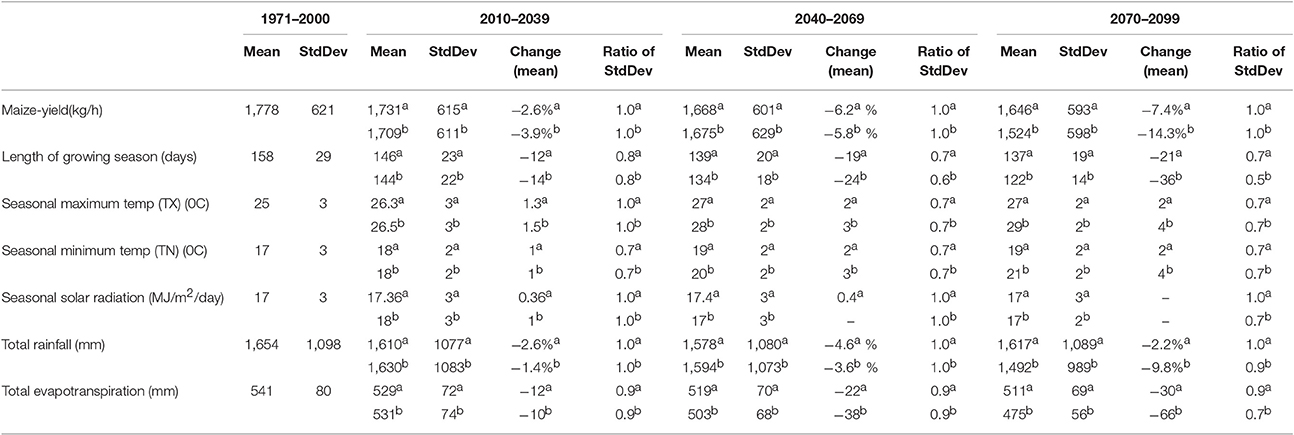
Table 7. Maize yields and seasonal climatic variable as simulated by crop model fed with climate data from RCA4-MPI-RCM for aRCP 4.5 and bRCP 8.5.

Table 8. Maize yields and seasonal climatic variable as simulated by crop model fed with climate data from RCA4-CNRM for aRCP 4.5 and bRCP 8.5.
Maize Yields Over Southern and Southwestern Sub Ecological Zones in Historical, Present, Mid and End Centuries
Temporal averages of maize yield over the Southern and southwestern sub ecological zones are presented in Tables 4–8. There are big variations in simulated baseline maize yield by different CERES-RCMs combinations. Highest baseline maize yield of 1,861 kg/ha is simulated by CERES-RACMO22T-ICHEC and lowest baseline maize yield of 1,518 kg/ha is simulated by CERES-RCA4-CNRM. The uncertainties associated by different CORDEX-RCMs can be analyzed, where CERES forced by different RCMs but similar GCM simulate maize yield differently. For instance baseline mean maize yield of 1,861 kg/ha and 1,782 kg/ha is simulated by CERES-RACMO22T-ICHEC and HIRHAM5-ICHEC respectively. This difference is associated by variations in formulations of the RCMs. Moreover, baseline mean maize yield of 1,792 kg/ha, 1,778 kg/ha, and 1,518 kg/ha is simulated by CERES-RCA4-ICHEC, CERES-RCA4-MPI, and CERES-RCA4-CNRM, respectively. These differences are associated with different formulation of the driving GCMs. These variations in simulated mean maize yield associated by variations in climate variables from individual CORDEX-RCMs suggest large uncertainties of the presented results from individual models.
In order to account the uncertainties from individual models, the ensemble average of the yields was constructed. Table 9 presents the results from the ensemble mean of the yields. Mean maize yield of 1,746 kg/ha is simulated over the Southern and southwestern sub ecological zones during historical climate. This result from the ensemble average of the yields differs greatly with those from individual models run and are considered to be robust to represent the impacts of climate change on maize yield over the Southern and southwestern sub ecological zones during historical, present, mid and end centuries.
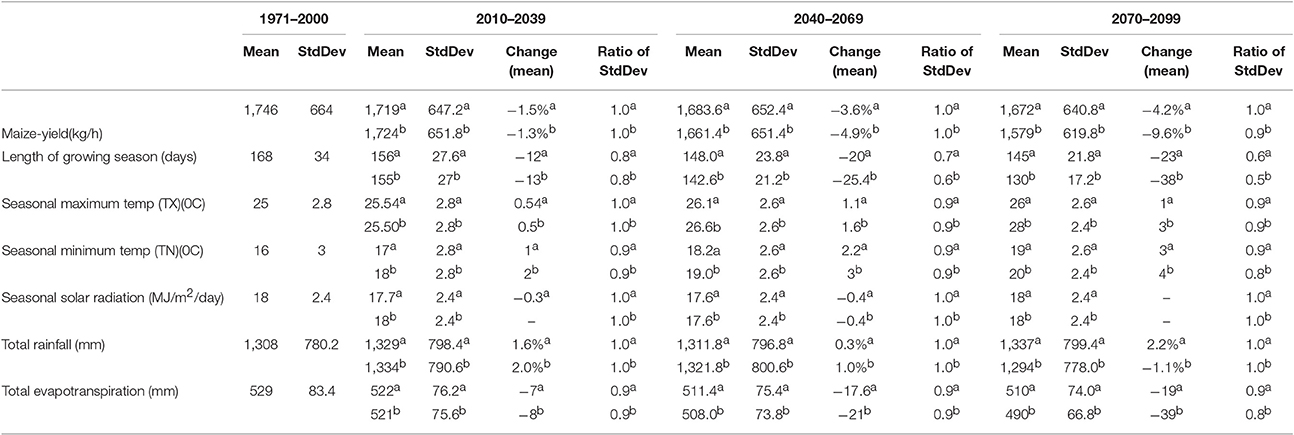
Table 9. Maize yields and seasonal climatic variable as simulated by crop model fed with climate data from ENSEMBLE-RCM for aRCP 4.5 and bRCP 8.5.
The percentage of yield changes in present (2010–2039), mid (2040–2069) and end (2070–2099) centuries under RCP 4.5 and RCP 8.5 are presented in Tables 4–9. It is clear from the presented results that the impacts of climate change on future maize yield are not considerably big in comparison to simulated baseline yield. Table 4 presents percentage changes in mean maize yield simulated by CERES-RACMO22T-ICHEC. It can be seen that, mean maize yields are predicted to decline by 3.3, 4.2, and 5.9% in 2010–2039, 2040–2069, and 2070–2099 respectively under RCP 4.5. More decrease of mean maize yield are projected under business as usual scenario (RCP 8.5), where a decline of 10.2 and 11.2% is projected in mid and end centuries, respectively.
Tables 4, 5 allows the analysis of the performance of RCMs in simulating future maize yield over the Southern and southwestern sub ecological zones where CERES-RACMO22T-ICHEC and CERES-HIRHAM5-ICHEC predicts changes in mean maize yield differently under RCP4.5 and 8.5. Model CERES-HIRHAM5-ICHEC predicts decline in mean maize yield by 3.3, 4.2, and 5.9% in 2010–2039, 2040–2069, and 2070–2099 respectively, under RCP 4.5. While model CERES-RACMO22T-ICHEC predicts increases in maize yield by 0.9% in present century, decline by 1.3% in mid century and increase by 0.7% in end century under RCP 4.5. Generally, the presented results of percentage changes in mean maize yield indicates that the Southern and southwestern sub ecological zones will feature decline in mean maize yield during mid and end centuries under both RCP4.5 and RCP8.5. However, RACMO-ICHEC and RCA4-CNRM driven simulations predicts increases in maize yields in present century under both CRP4.5 and RCP8.5. Table 9 shows ensemble averages of mean maize yield. It is clear that the ensemble predicts decreases in mean maize yield are expected in future climate under both RCP4.5 and RCP 8.5. Decline in mean maize yields of 1.3 and 9.6% are projected in present and end centuries, respectively under RCP 8.5.
Discussion
The uncertainties in the previous studies (e.g., Mwandosya et al., 1998; Agrawala et al., 2003) that evaluated the impacts of climate change on rainfed crop production in Tanzania that was associated by the use of climate change simulations from the old version course resolution GCMs provides salient evidence that much effort is needed to unravel the complexity of rainfed crop response to climate change in many agro-ecological zones of Tanzania. In this study, high resolution climate information from three Regional Climate Models (RCMs) driven by three General Circulation Models (GCMs) and process based crop model CERES- maize model embedded in DSSAT version 4.5, was used to simulate maize yields over the Southern and southwestern sub ecological zones during historical, current, mid, and end centuries under RCP 4.5 and RCP 8.5. The primary aim was to examine, how climate change will affect maize yields over the Southern and southwestern sub ecological zones. This zone contains some of the country's most fertile lands (Milder et al., 2013). Moreover the zone contains the main four major staple food production regions (Iringa, Mbeya, Ruvuma, and Rukwa). Therefore close examination on how climate change will impact future maize yields is important. The analysis presented here are limited within the growing season which starts from November and continues to June. The results of climate variables, length of growing season and mean maize yield simulated by CERES-maize model embedded in DSSAT are presented in Tables 4–8. The ensemble average of the mean maize yield and climate variable are presented on (Table 9). The mean maize yield simulated by CERES-maize model varies when DSSAT is fed with climate information from different individual RCM-GCM combination. The variations are associated with the formulation of the RCMs and GCMs. For instance different amount of maize yield in historical climate (1971–2000), present climate (2010–2039), mid (2040–2069) and end (2070–2099) centuries are simulated by CERES when forced RCMs (RACMO22T and HIRHAM5) both driven by the GCM (ICHEC-EARTH). This difference comes from difference in formulation of RCMs (RACMO22T and HIRHAM5). Moreover, different amount of maize yield are simulated by CERES when forced by same RCM derived by different GCMs. For instance CERES simulate different amount of maize yields even when forced by the same RCM (RCA4) driven by different GCMs (CNRM, ICHEC-EARTH, and MPI). In this case the difference comes from the variations of formulation of the driving GCMs.
In order to account the uncertainties of the maize simulation associated with climate variables from the climate models, the ensemble average of climate variables and maize yield was constructed in historical, present and future climate condition. Table 9 presents the results of the ensemble mean of the yields. It indicates that the average maize yields over the Southern and southwestern sub ecological zones during historical climate conditions was 1,746 kg/ha. Furthermore mean maize yield over Southern and southwestern sub ecological zones will be 1,719, 1,683.6, and 1,672 kg/ha in present, mid, and end centuries respectively. This results from the ensemble average differs greatly with those from individual models run and are considered to be robust to represent the historical, present and future climate change impacts on maize yields over the Southern and southwestern sub ecological zones.
Other results of interest in this study are the standard deviations of climate variables, length of growing season and maize yield over Southern and southwestern sub ecological zones. It can be seen from the presented results (Tables 4–9) that simulated maize yield across districts in the Southern and southwestern sub ecological zones varies almost similar during present historical climate condition. The variation is expected to decrease in future climate condition, indicating more similarity on maize yields production across districts in Southern and southwestern sub ecological zones. Moreover the standard deviation of climate variables are expected decrease in future climate projection.
It is important to note that temperatures are projected to increase over Southern and southwestern sub ecological zones. Different RCM-GCM combination projects increase in temperatures differently. However, all the RCMs-GCMs combinations agree that the Southern and southwestern sub ecological zones will experience high change in temperatures during the end century under RCP 8.5. Highest increase in TN of 5°C is projected by RACMO22T driven by ICHEC under RCP 8.5. The ensemble average also suggests highest change in temperatures over Southern and southwestern sub ecological zones during the end century under RCP 4.5 and RCP 8.5. TN will increase by 4°C under RCP 8.5 and TX will increase by 3°C under the same scenario (RCP 8.5). These increases in temperatures influence the decline in maize yields in the southern southwestern sub-ecological zones of Tanzania. The study by Moore et al. (2011) suggested that increase in temperatures reduce the length of growing season that can either decrease yields (if currently warm) or increase yields (if currently cool).
Conclusions
In this paper the assessment of the impacts of climate change on maize (Zea mays) production over the Southern and southwestern sub ecological zones was carried out using high resolution Regional Climate models (RCMs). The RCMs used are those driven by boundary condition from General Circulation Models (GCMs). Daily minimum, maximum temperatures, rainfall and solar radiations for the period of 1971–2000, 2010–2039, 2040–2069 and 2070–2099 were fed into the Decision Support System for Agro -technological Transfer (DSSAT) to simulate maize growth and yields. In addition to climate data, detailed field and house hold survey information (crop yield, soil, and management data inputs) were used to calibrate the crop model. Maize simulations were carried out under RCP4.5 and RCP8.5. It is found that crop model (DSSAT) simulate maize yield over the Southern and southwestern sub ecological zones differently when fed with climate data from different RCMs GCMs combinations. In general DSSAT simulates decreased in maize yields over the Southern and southwestern sub ecological zones during present mid and end centuries. This decrease is mainly due to the increase in temperatures that fasten maturity and hence decrease in yields. The maximum decrease in maize yields are projected during the end centuries under RCP8.5. The results presented in this paper may be useful to farmers and decision markers in planning on how to adapt the projected increase in temperatures. It is also recommended that more studies need to be carried out that addresses the impact of climate change on crop production in many agro ecological zones of Tanzania using high resolution climate change projections. It is important to note that one season actual crop yields data (2005/2006) was the only available data used to validate the crop model. This may be a limitation of this study, therefore more studies need to be carried that uses long time actual yields data to validate crop models to update the findings of this study.
Author Contributions
The author confirms being the sole contributor of this work and approved it for publication.
Conflict of Interest Statement
The author declares that the research was conducted in the absence of any commercial or financial relationships that could be construed as a potential conflict of interest.
Acknowledgments
PL would like to thank the Tanzania Meteorological Agency research section for providing computing facilities and CORDEX Africa for providing model data used in this study. The author would like to thank the reviewer for their useful comments that helped to improve this manuscript.
References
Agrawala, S., Moehder, A., Hemp, A., Van Aalst, M., Smith, J., Meena, H., et al. (2003). Development and Climate Change in Tanzania: Focus on Mount Kilimanjaro. Paris: OECD.
Ahmed, S. A., Diffenbaugh, N. S., Hertel, T. W., Lobell, D. B., Ramankutty, N., Rios, A. R., et al. (2011). Climate volatility and poverty vulnerability in Tanzania. Glob. Environ. Change 21, 46–55. doi: 10.1016/j.gloenvcha.2010.10.003
Arndt, C., Farmer, W., Strzepek, K., and Thurlow, J. (2011). Climate Change, Agriculture, And Food Security in Tanzania. Helsinki: United Nations University, UNU-WIDER.
Ehrhart, C., and Twena, M. (2006). Climate Change and Poverty in Tanzania: realities and response options for CARE. Background report. CARE International Poverty-Climate Change Initiative. Available online at: http://www.care.dk/multimedia/pdf/web_english/Climate%20Change%20and%20Poverty%20in%20Tanzania%20-%20Country%20Profile.pdf
Enfors, E., and Gordon, L. (2008). Dealing with drought: the challenge of using water system technologies to break dryland poverty traps. Glob. Environ. Change 18, 607–616. doi: 10.1016/j.gloenvcha.2008.07.006
Hoogenboom, G., Jones, J. W., Wilkens, P. W., Porter, C. H., Boote, K. J., Hunt, L. A., et al. (2012). Decision Support System for Agrotechnology Transfer (DSSAT) Version 4.5 [CD-ROM]. Honolulu: University of Hawaii.
IPCC (2007). Working Group II Fourth Assessment Report. Climate Change: Climate Change Impacts, Adaptation and Vulnerability. Available online at: http://www.ipcc.ch/SPM6avr07.pdf
Jones, J. W., Hoogenboom, G., Porter, C. H., Boote, K. J., Batchelor, W. D., Hunt, L. A., et al. (2003). The DSSAT cropping system model. Eur. J. Agron. 18, 235–265. doi: 10.1016/S1161-0301(02)00107-7
Luhunga, P., Chang'a, L., and Djolov, G. (2016). Assessment of the impacts of climate change on maize production in the Wami Ruvu basin of Tanzania. J. Water Climate Change 5, 142–164. doi: 10.2166/wcc.2016.055
Maliondo, S. M. S., Mpeta, E. J., and Olson, J. (2012). “Climate change and food security in Tanzania: an analysis of current knowledge and research gaps and recommendations for a research agenda,” in iAGRI Reference Background Paper (Columbus, OH). Available online at: http://www.iagri.org/research/research-papers
Masson, D., and Knutti, R. (2011). Climate model genealogy. Geophys. Res. Lett. 38:L08703. doi: 10.1029/2011GL046864
Milder, J. C., Buck, L. E., Hart, A. K., Scherr, S. J., and Shames, S. A. (2013). A Framework for Agriculture Green Growth: Greenprint for the Southern Agricultural Growth Corridor of Tanzania (SAGCOT). Dar es Salaam: SAGCOT Cent.
Moore, N., Alagarswamy, G., Pijanowski, B., Thornton, P., Lofgren, B., Olson, J., et al. (2011). East African food security as influenced by future climate change and land use change at local to regional scales. Clim. Change 110, 823–844. doi: 10.1007/s10584-011-0116-7
Müller, C., Cramer, W., Hare, W. L., and Lotze-Campen, H. (2011). Climate change risks for African agriculture. Proc. Natl. Acad. Sci. U.S.A. 108, 4313. doi: 10.1073/pnas.1015078108
Mwandosya, M. J., Nyenzi, B. S., and Luhanga, M. L. (1998). The Assessment of Vulnerability and Adaptation to Climate Change Impacts in Tanzania. Dar-es-Salaam: Centre for Energy, Environment, Science and Technology (CEEST).
Nikulin, G., Jones, C., Giorgi, F., Asrar, G., Büchner, M., Cerezo-Mota, R., et al. (2012). Precipitation climatology in an ensemble of CORDEX-Africa regional climate simulations. J. Clim. 3, 6057–6078. doi: 10.1175/JCLI-D-11-00375.1
Ramirez-Villegas, J., and Challinor, A. (2012). Assessing relevant climate data for agricultural applications. Agric. Forest Meteorol. 161, 26–45. doi: 10.1016/j.agrformet.2012.03.015
Rowhani, P., Lobell, D. B., Linderman, M., and Ramankutty, N. (2011). Climate variabilty and crop production in Tanzania. Agric. Forest Meteorol. 151, 449–460. doi: 10.1016/j.agrformet.2010.12.002
Saxton, K. E., and Rawls, W. J. (2009). Soil Water Properties Calculator (version 6.02). Available online at: http://hydrolab.arsusda.gov/soilwater/Index.htm
Tanzania Meteorogical Agency (TMA) (2011). Statement of the Status of Tanzania Climate in 2011. Dar es Salaam: Tanzania Met Agency.
The National Bureau of Statistics (2012). National Panel Survey 2009-2010. Available online at: http://www.nbs.go.tz
Thornton, P. K., Jones, P. G., Alagarswamy, G., and Andresen, J. (2010). Spatial variation of crop yield response to climate change in East Africa. Glob. Environ. Change 19, 54–65. doi: 10.1016/j.gloenvcha.2008.08.005
Thornton, P. K., Jones, P. G., Owiyo, T., Kruska, R. L., Herrero, M., Orindi, V., et al. (2009). Climate change and poverty in Africa: mapping hotspots of vulnerability. Afr. J. Agric. Resource Econ. 2, 24–44.
United Republic of Tanzania (URT) (2003). Initial National Communication under the United Nations Framework Convention on Climate Change (UNFCCC). Dar es Salaam. Available online at: http://unfccc.int/resource/docs/natc/tannc1.pdf
United Republic of Tanzania (URT) (2006). National Adaptation Programme of Action (NAPA) for Tanzania. Available online at: http://file:///C:/Users/user/Downloads/NAPATanzania%20(2).pdf
United Republic of Tanzania (URT) (2008). Study on Strategies for Addressing Negative Effects of Climate Change in food Insecure Areas of Tanzania. Dar es Salaam: Ministry of Agriculture, Food and Cooperatives. Ministry of Agriculture, Food and Cooperatives.
Keywords: climate change, CORDEX, regional climate models, maize yields, crop modeling
Citation: Luhunga PM (2017) Assessment of the Impacts of Climate Change on Maize Production in the Southern and Western Highlands Sub-agro Ecological Zones of Tanzania. Front. Environ. Sci. 5:51. doi: 10.3389/fenvs.2017.00051
Received: 08 May 2017; Accepted: 02 August 2017;
Published: 17 August 2017.
Edited by:
Tomas Halenka, Charles University, CzechiaReviewed by:
Nathaniel Newlands, Science and Technology, Government of Canada, CanadaKazuya Nishina, National Institute for Environmental Studies, Japan
Copyright © 2017 Luhunga. This is an open-access article distributed under the terms of the Creative Commons Attribution License (CC BY). The use, distribution or reproduction in other forums is permitted, provided the original author(s) or licensor are credited and that the original publication in this journal is cited, in accordance with accepted academic practice. No use, distribution or reproduction is permitted which does not comply with these terms.
*Correspondence: Philbert M. Luhunga, philuhunga@yahoo.com