A Gas Chromatographic Method for the Determination of Bicarbonate and Dissolved Gases
 John H. Loughrin
 Stacy W. Antle
 Jason Polk
- 1Food Animal Environmental Systems Research Unit, United States Department of Agriculture, Agricultural Research Service, Bowling Green, KY, United States
- 2Department of Geology and Geography, Center for Human GeoEnvironmental Studies, Western Kentucky University, Bowling Green, KY, United States
A gas chromatographic method for the rapid determination of aqueous carbon dioxide and its speciation into solvated carbon dioxide and bicarbonate is presented. One-half mL samples are injected through a rubber septum into 20-mL vials that are filled with 9.5 mL of 0.1 N HCl. A one mL portion of the headspace is withdrawn and injected onto a gas chromatograph equipped with a thermal conductivity detector. Using the dimensionless Henry's constant for carbon dioxide and an adaptation of the Henderson-Hasselbalch equation, carbon dioxide in the samples can be categorized among solvated, bicarbonate, and carbonate forms. Natural water samples as well as wastewater from a municipal sewage treatment plant and a swine rearing operation were analyzed by this method and the results compared favorably to those obtained by titration. Samples stored for up to 5 weeks showed no significant changes in carbon dioxide concentrations. In addition, using flame ionization and electron capture detectors, methane and nitrous oxide concentrations in the samples were also measured.
Introduction
Measuring alkalinity and hardness is important in gauging a waters buffering capacity and hence its ability to resist rapid changes in pH due to runoff, rain, and acid spills as well as its potential for scale formation in pipes, pumps, and boilers. Alkalinity is usually reported in bicarbonate equivalents, since calcium and magnesium bicarbonates are usually the most important buffering agents in nature (Boyd et al., 2016). Bicarbonate is also important since it represents the largest pool of carbon dioxide in most waters (Raymond et al., 2008). In karst waters in particular, wherein dissolved carbonate materials cause high concentrations of bicarbonate, the buffering capacity is increased and can have an influence on other water quality parameters and the precipitation of minerals that can impact infrastructure (Ford and Williams, 2007).
The most common means of measuring alkalinity and buffering is by titration of water samples with a weak or strong acid depending on the anticipated buffering capacity of the sample (APHA, AWWA, and WEF, 1998). This requires minimal equipment and gives acceptable results in most cases; however, when a significant portion of the alkalinity is due to other ions such as ammonium, hydroxide, silicates, borates, and phosphates, bicarbonate concentrations may be overestimated. The presence of interference from non-carbonate alkalinity may be assumed based on the shape of the titration curve, however in any case it is recommended that titration be performed with 48 h of sample collection and preferably within 24 h (APHA, AWWA, and WEF, 1998; United States Geological Survey, 2012).
In this paper, we present a rapid and convenient gas chromatographic (GC) method for the determination of bicarbonate buffering in water. It allows for the collection of numerous samples in the field and long term storage for subsequent laboratory analysis. Depending on the capability of the GC instrument other dissolved greenhouse gases may also be analyzed. Since carbon dioxide is measured directly, interference from other contributors to alkalinity is eliminated. We also discuss methods and means by which the accuracy of the technique could be enhanced.
Materials and Methods
Sample Collection
Water and wastewater samples were collected from the Barren River in Warren County, KY, the Bowling Green Municipal Utilities wastewater treatment plant in Bowling Green, KY just after large solids screening and from deep pit storage at a local swine producer. For analysis of sample integrity over time, samples were collected from Meadow Creek in Taylor County, KY. The samples were kept in a cooler and transported back to the laboratory where samples were taken for gas chromatographic (GC) analyses.
One-half mL of water was withdrawn from the water samples using a disposable syringe equipped with an 18-gauge needle. The syringe needle was used to pierce the septum on a 20-mL headspace vial that was filled with 9.5 mL of 0.1 N HCl. The samples were then analyzed by gas chromatography as described below.
Samples were analyzed for alkalinity as titratable bicarbonate by the Hydroanalytical Lab at Western Kentucky University within 48 h of receipt using standard method 2320 B (APHA, AWWA, and WEF, 1998).
Gas Chromatographic Analysis
Methane, CO2, and N2O (nitrous oxide) were analyzed on a Varian Model CP-3800 (Agilent Technologies, Santa Clara, CA) GC modified for greenhouse gas (GHG) analysis by RSC Group LLC (Katy, TX). The GC was equipped with a model 1041 on-column injector operated at 75°C and 263 kPa which was connected to a 10-port gas-sampling valve and pressure-actuated solenoid valve. One-half mL of vial headspace was injected using a syringe temperature of 35°C and syringe flush time of 30 s with 250 μL of the sample transferred onto a 1.8 m by 1.6 cm o.d. column packed with 80/100 mesh Hay Sep Q (Varian Associates) with a He flow rate of 55 mL min−1 for methane analysis. The column was connected to a thermal conductivity detector (TCD) operated at 120 °C and with a filament temperature of 200°C for CO2 analysis. From the TCD, the sample went to a flame ionization detector operated under the following conditions: N2 makeup gas 15 mL min−1, H2 30 mL min−1, air 300 mL min−1, temperature 275°C.
Another portion of the sample was split by means of the gas switching valve to another 10 port gas sampling solenoid valve, and a portion of this sample was transferred to a 1.8 m by 1.6 cm o.d. Silicosteel column also packed with 80/100 mesh Hay Sep Q with a N2 carrier flow rate of 55 mL min−1 for N2O analysis. This column was connected to an electron capture detector (ECD) operated at 300°C.
The GC column oven was operated with an initial temperature of 50°C for 4 min. and then programmed at 50°C min−1 to 100°C and held at this temperature for 1 min. Quantification was performed by five point calibrations from 96,160 to 1,000 μg L−1 for CO2 and 203,000 to 10,165 μg L−1 for CH4 in N2 and one point calibration for N2O of 2.0 μg L−1 in N2.
Dissolved GHG and other forms of CO2 (, ) were measured by collecting 0.5 mL water samples using a disposable syringe with 18-gauge needle. The syringe needle was used to pierce the septum on a 20-mL headspace vial that was filled with 9.5 mL of 0.1 N HCl. Gases were analyzed as described below.
Total CO2 (solvated CO2, , and ) concentrations in water were calculated as:
Where 20 equals a multiplication factor to account for the dilution of the sample within the vial, 0.8 equals the dimensionless Henry's constant (KH) for CO2 and Conc equals the CO2 concentration in the gas vial in μg L−1. The sum of the and concentrations were determined by adaptation of the Henderson-Hasselbalch equation (Po and Senozan, 2001):
Where pH equals the pH of the solution and 6.35 equals the pka1 for H2O +CO2↔ +OH−. Carbonate was calculated by the formula:
with the variables the same as in (2) and substituting pka2 of 10.33 for ↔ +H+. Bicarbonate concentrations were calculated by subtracting concentrations from those calculated in Equation (3) from the concentrations calculated in Equation (2). Solvated CO2 concentrations were calculated by subtracting the values calculated from Equation (2) from those calculated in Equations (1) and (3). In our treatment of CO2, H2CO3 concentration was included along with that of hydrated CO2, since ascribing the partitioning between the species was beyond our means and also because the hydration constant (kh) for CO2 is low (1.2 × 10⁻³), so that H2CO3 constitutes less than one percent of the two species combined (Archer, 1999).
Aqueous CH4 and N2O (dissolved and suspended gaseous) concentrations in the wastewater were calculated by Equation (1) using dimensionless Henry's constants of 27.02 and 1.1, respectively and molar masses of 16.04 mg mmol−1 and 44.01 mg mmol−1, respectively (Howard and Meylan, 1997; Jacinthe and Groffman, 2001).
Results and Discussion
Table 1 presents a comparison of the results of alkalinity (as ) tests by GC and titration. In the river and municipal wastewater samples, analysis by GC estimated bicarbonate concentrations to be 81 and 38% higher respectively than did titration. For samples taken from a swine waste storage pit, however, GC results were 3.6% lower than those obtained by titration, possibly due to interferences with alkalinity measurements. In all cases, nonetheless, standard deviations obtained using titration were lower than those obtained by GC. Both analytical methods had acceptable relative standard deviations (RSD) for analytes in the 1,000 parts per million or less range (Taverniers et al., 2004).
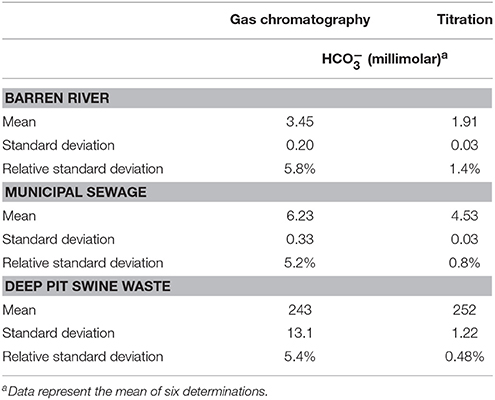
Table 1. Alkalinity as equivalents by gas chromatography and titration.
We were limited by our equipment to using 20 mL headspace vials for analysis. Given the difficulty associated with measuring 0.5 mL water solids reproducibly, we feel sure that RSD could be improved by using vials and, hence, larger water aliquots. In addition, our autosampler was not equipped with a vial heater. Henry's constants vary with temperature so that constant vial temperatures could have resulted in lower RSD (DeWulf et al., 1995). Henry's constants also vary with ionic strength but given that samples were diluted 20-fold in the headspace vials, we feel this contributes very little to analysis variation.
Vial size also affects results, in that injecting a portion of the headspace shifts the equilibrium between the gases partitioned in the gas and liquid phases. Injecting a smaller portion of the headspace onto the GC either by smaller sized injections or using larger vials could lead to more accurate results.
The complete analyses for dissolved gases in the environmental samples as determined by GC are presented as Table 2. In addition to bicarbonate, carbonate and solvated carbon dioxide (sCO2) concentrations were calculated as well for dissolved methane and nitrous oxide. Due to hydrogen bonding, solvated carbon dioxide is surrounded by a “shell” of water molecules. Solvated carbon dioxide reacts with water to form carbonic acid:
While carbonic acid dissociates to a proton and bicarbonate:
The hydration constant (kh) for sCO2 to form H2CO3 in water is low (1.2 × 10⁻³ in salt water), so that H2CO3 concentrations were considered negligible and were not calculated (Soli and Byrne, 2002).
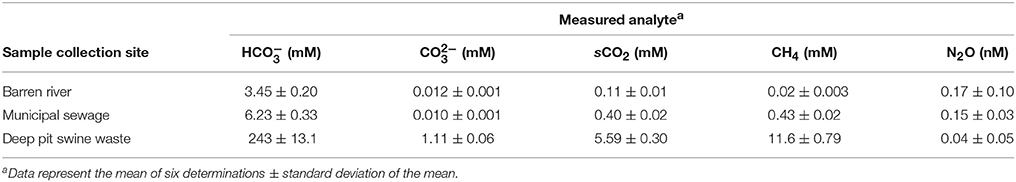
Table 2. Bicarbonate, carbonate and dissolved gas analyses.
Solvated methane in the river samples were only about 2 mM (0.3 mg L−1). As expected, they were much higher in municipal water (0.43 mM) and especially swine waste (11.6 mM). In contrast, nitrous oxide concentrations were greatest in river and municipal sewage while it was virtually undetectable in swine waste. This was not unexpected given that nitrous oxide is not formed in anaerobic conditions in the absence of exogenous electron acceptors that sustain anaerobic respiration (Jetten et al., 1999).
No significant changes in measured bicarbonate concentrations were seen in samples over 5 weeks of storage (Figure 1). This is an advantage to titration techniques in that analysis is recommended within 48 h of sample collection and preferably with 24 h. In addition, the samples must be kept cool to minimize loss of CO2 or growth of microorganisms that might affect results (APHA, AWWA, and WEF, 1998).
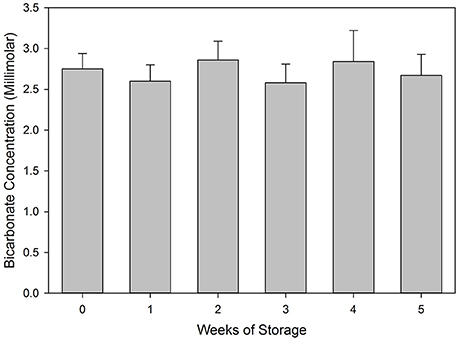
Figure 1. Bicarbonate concentrations measured in samples taken from Meadow Creek at up to 5 weeks in storage. Data represent the mean of six determinations plus standard deviation of the mean.
In conclusion, this method allows for the rapid measurement of dissolved gases and carbonate species in water. If measurement of only carbon dioxide and carbonates is desired, this method may be used with an inexpensive GC equipped with only a TCD or FID equipped with a methanizer accessory.
Author Contributions
All authors listed have made a substantial, direct and intellectual contribution to the work, and approved it for publication.
Conflict of Interest Statement
The authors declare that the research was conducted in the absence of any commercial or financial relationships that could be construed as a potential conflict of interest.
Acknowledgments
We thank Zachary Berry for technical assistance. This research was part of United States Department of Agriculture–Agricultural Research Service National Program 214: Agricultural and Industrial Byproducts. Mention of a trademark or product anywhere in this article is to describe experimental procedures, does not constitute a guarantee or warranty of the product by the USDA, and does not imply its approval to the exclusion of other products or vendors that may also be suitable.
References
APHA, AWWA, and WEF. (1998). Standard Methods for the Examination of Water and Wastewater, 20th Edn. Washington, DC: American Public Health Assoc., American Water Works Assoc., and Water Environment Federation.
Archer, D. (1999). Modeling CO2 in the Ocean: A Review. Available online at: http://geosci.uchicago.edu/~archer/reprints/archer.1999.rev_modeling.pdf. Accessed 15 Jul. 2016.
Boyd, C. E., Tucker, C. S., and Somridhivej, B. (2016). Alkalinity and hardness: critical but elusive concepts in aquaculture. J. World Aquac. Soc. 47, 6–41. doi: 10.1111/jwas.12241
DeWulf, J., Drijvers, D., and Van Langenhove, H. (1995). Measurement of Henry's law constant as function of temperature and salinity for the low temperature range. Atmos. Environ. 29, 323–331. doi: 10.1016/1352-2310(94)00256-K
Ford, D., and Williams, P. (2007). Karst Hydrology and Geomorphology. Hoboken, NJ: John Wiley and Sons Ltd.
Howard, P. H., and Meylan, W. H. (1997). Handbook of Physical Properties of Organic Chemicals. Boca Raton, FL: Chemical Rubber Corporation Press.
Jacinthe, P. A., and Groffman, P. M. (2001). Silicone rubber sampler to measure dissolved gases in saturated soils and waters. Soil Biol. Biochem. 33, 907–912. doi: 10.1016/S0038-0717(00)00236-4
Jetten, M., Strous, M., Pas-Schoonen, K., Schalk, J., van Dongen, U., van de Graaf, A., et al. (1999). The anaerobic oxidation of ammonium. FEMS Lett. FEMS Microbiol. Rev. 22, 421–437. doi: 10.1111/j.1574-6976.1998.tb00379.x
Po, H. N., and Senozan, N. M. (2001). The henderson-hasselbalch equation: its history and limitations. Chem. Educ. 78, 1499–1503. doi: 10.1021/ed078p1499
Raymond, P. A., Oh, N. H., Turner, R. E., and Broussard, W. (2008). Anthropogenically enhanced fluxes of water and carbon from the Mississippi River. Nature 451, 449–452. doi: 10.1038/nature06505
Soli, A. L., and Byrne, R. H. (2002). CO2 system hydration and dehydration kinetics and the equilibrium CO2/H2CO3 ratio in aqueous NaCl solution. Mar. Chem. 78, 65–73. doi: 10.1016/S0304-4203(02)00010-5
Taverniers, I., De Loose, M., and Van Bockstaele, E. (2004). Trends in quality in the analytical laboratory. II. Analytical method validation and quality assurance. Trends Anal. Chem. 23, 535–552. doi: 10.1016/j.trac.2004.04.001
United States Geological Survey (2012). Web-Based Alkalinity Calculator v. 2.12. Available online at: http://or.water.usgs.gov/alk/ (Accessed August 2016).
Keywords: alkalinity, bicarbonate, carbon dioxide, dissolved gas, greenhouse gas, methane, nitrous oxide
Citation: Loughrin JH, Antle SW and Polk J (2017) A Gas Chromatographic Method for the Determination of Bicarbonate and Dissolved Gases. Front. Environ. Sci. 5:65. doi: 10.3389/fenvs.2017.00065
Received: 16 June 2017; Accepted: 29 September 2017;
Published: 28 November 2017.
Edited by:
Nicolas Kalogerakis, Technical University of Crete, GreeceReviewed by:
Suleyman I. Allakhverdiev, Russian Academy of Sciences, RussiaGuangming Jiang, The University of Queensland, Australia
Copyright © 2017 Loughrin, Antle and Polk. This is an open-access article distributed under the terms of the Creative Commons Attribution License (CC BY). The use, distribution or reproduction in other forums is permitted, provided the original author(s) or licensor are credited and that the original publication in this journal is cited, in accordance with accepted academic practice. No use, distribution or reproduction is permitted which does not comply with these terms.
*Correspondence: John H. Loughrin, john.loughrin@ars.usda.gov