Subseasonal Predictability of Boreal Summer Monsoon Rainfall from Ensemble Forecasts
 Nicolas Vigaud
 Andrew W. Robertson
 Michael K. Tippett
 Nachiketa Acharya
- 1International Research Institute for Climate and Society, Earth Institute at Columbia University, New York, NY, United States
- 2Department of Applied Physics and Applied Mathematics, Columbia University, New York, NY, United States
- 3Department of Meteorology, Center of Excellence for Climate Change Research, King Abdulaziz University, Jeddah, Saudi Arabia
Subseasonal forecast skill over the broadly defined North American (NAM), West African (WAM) and Asian (AM) summer monsoon regions is investigated using three Ensemble Prediction Systems (EPS) at sub-monthly lead times. Extended Logistic Regression (ELR) is used to produce probabilistic forecasts of weekly and week 3–4 averages of precipitation with starts in May–Aug, over the 1999–2010 period. The ELR tercile category probabilities for each model gridpoint are then averaged together with equal weight. The resulting Multi-Model Ensemble (MME) forecasts exhibit good reliability, but have generally low sharpness for forecasts beyond 1 week; Multi-model ensembling largely removes negative values of the Ranked Probability Skill Score (RPSS) seen in individual forecasts, and broadly improves the skill obtained in any of the three individual models except for the AM. The MME week 3–4 forecasts have generally higher RPSS and comparable reliability over all monsoon regions, compared to week 3 or week 4 forecast separately. Skill is higher during La Niña compared to El Niño and ENSO-neutral conditions over the 1999–2010 period, especially for the NAM. Regionally averaged RPSS is significantly correlated with the Maden-Julian Oscillation (MJO) for the AM and WAM. Our results indicate potential for skillful predictions at subseasonal time-scales over the three summer monsoon regions of the Northern Hemisphere.
1. Introduction
Monsoon systems of the Northern Hemisphere including the North American (NAM), West African (WAM) and Asian (AM) summer monsoons, are all characterized by marked seasonality and strong variability on seasonal, annual and decadal time-scales (Adams and Comrie, 1997; Lebel et al., 2000; Krishnamurthy and Kinter, 2003). These variations have significant and sometimes devastating societal impacts in regions where populations depend mainly on rain-fed agriculture and are already extremely vulnerable (Gadgil and Rao, 2000; Sultan et al., 2005; Ingram and Hunt, 2015). Climate forecast information beyond the seasonal cycle could thus be valuable as it is well suited for disaster risk and preparedness actions (World Meteorological Organization, 2013). Predictions between medium-range weather (up to 2 weeks) and seasonal climate (from 3 to 6 months) forecasts have recently received increasing interest due to a better understanding of climate phenomena on subseasonal time-scales, particularly the Madden-Julian Oscillation or MJO (Zhang, 2013) and modeling advances (Vitart, 2014). Sources of predictability at subseasonal time-scales include the inertia of sea surface temperature (SST) anomalies and the MJO (Waliser et al., 2003; Waliser, 2011; Neena et al., 2014), stratospheric processes (Baldwin and Dunkerton, 2001; Scaife and Knight, 2008) and memory in soil moisture (Koster et al., 2010), snow cover (Lin and Wu, 2011) and sea ice (Holland et al., 2011). The skill of a particular forecast will depend on how active these phenomena are during the forecast period and how strongly they impact the region considered. Over monsoon regions, the influence of El Niño-Southern Oscillation (ENSO), the MJO and land-surface processes are particularly pronounced rising the question to which extent useful S2S forecasting is achievable.
Significant correlations between monsoonal rainfall and Niño3.4 suggest that ENSO causes global tropical monsoon rainfall variability and may in turn give rise to skillful predictions at subseasonal time-scales but these relationships have been non-stationary for most monsoon regions over the past 50 years (Yim et al., 2014). Earlier studies did not suggest strong relationships between the NAM and ENSO (Namias, 1991; Adams and Comrie, 1997), however the continental-scale anomalous anticyclone prevailing in summer over North America during La Niña and contrasting with weaker impacts during El Niño (Wang et al., 2007) might be of relevance to the NAM. Over West Africa, Sahelian rainfall relationships to ENSO have only been evidenced since the 1990s (Semazzi et al., 1988; Rowell et al., 1992; Janicot et al., 1996), El Niño (La Niña) being associated with dry (wet) conditions over the Sahel. More recently Joly and Voldoire (2009) identified one robust feature, through which the WAM is influenced during the developing phase of ENSO or the decay of some long-lasting La Niña, consisting of modulations of the Walker circulation and a Kelvin wave response in the high troposphere. For the AM, severe droughts in India have almost always been accompanied by El Niño events, however not all El Niño events have produced severe droughts (Gadgil et al., 2005). While El Niño warming generates anomalous precipitation and hence ascent in the central-to-east Pacific, it concomitantly leads to anomalous subsidence over the Indian Ocean region acting to suppress convection. Krishna Kumar et al. (2006) found that events with the warmest sea surface temperature anomalies in the central equatorial Pacific are more effectively leading to drought-producing subsidence over India than events with the warmest signature in the eastern equatorial Pacific.
The MJO is often cited as the main source of subseasonal predictability. NAM precipitation is influenced by the MJO particularly over southern Mexico (Higgins and Shi, 2001), but Lorenz and Hartmann (2006) also found that associated westerly wind anomalies in the eastern tropical Pacific lead, from several days to over a week later, to above-normal rainfall in the monsoon regions of Arizona, New Mexico and northwest Mexico. These changes occur through modulations in the strength of low-level easterly waves off the coast of Mexico, which in turn trigger the development of moisture surges from the Gulf of California and could indicate potentials for predictability. During the monsoon season, convection over West Africa is modulated by the propagation of low frequency waves within the MJO and Rossby peaks (Janicot et al., 2009; Pohl et al., 2009; Mohino et al., 2012; Niang et al., 2016). The good skill of some models from the Atmospheric Model Intercomparison Project (AMIP) in capturing the main characteristics of the summer MJO and its influence on convection and rainfall over West Africa suggests that it may be possible to predict anomalous convection locally with a time lead of 15–20 days (Niang et al., 2016). Intraseasonal fluctuations of the AM are not periodic but are manifested as two dominant bands in the spectra of rainfall, OLR and circulation data on time scales of 10–20 days and 30–60 days (Krishnamurthy and Kinter, 2003). Evidence for an eastward propagation of convection associated with the northward propagation of the monsoon trough in the 30–60 day time-scale, suggests that the MJO exerts an influence on the active and break cycles of monsoon rainfall (Yasunari, 1979; Lau and Chan, 1986; Singh et al., 1992; Annamalai and Slingo, 2001), which could translate into potential subseasonal predictability. Moreover, Jie et al. (2017) have recently identified potentials for skillful predictions up to 30 days for strong events of the Boreal Summer Intraseasonal Oscillation (BSISO) considered as a specific mode of the tropical Intraseasonal Oscillation (ISO) that prevails in boreal summer (Wang and Xie, 1997).
Based on experience from probabilistic seasonal climate and medium-range forecasting, calibration of model probabilities is needed to account for model deficiencies and produce reliable forecasts (Goddard et al., 2001; Wilks, 2002; Tippett et al., 2007). By contrast to seasonal timescales, submonthly hindcasts (reforecasts) are often characterized by their shorter length and fewer ensemble members which represent additional challenges. While the value of the model output statistics (MOS) approach to improve weather probabilistic forecasts has been demonstrated (Hamill et al., 2004), little analysis has been yet done at subseasonal time-scales (DelSole et al., 2017; Vigaud et al., 2017). There is also a need to investigate if skill can be enhanced by multi-model ensemble techniques, as has been demonstrated for seasonal (Robertson et al., 2004) and medium range (Hamill and Whitaker, 2006) forecasting. Extended Logistic Regression (ELR) includes the quantile threshold along with the ensemble mean as predictor and produces mutually consistent quantile probabilities that sum to one property (Wilks and Hamill, 2007; Wilks, 2009). This study produces weekly and week 3–4 Multi-Model Ensemble (MME) precipitation terciles probabilities forecasts from three individual EPS reforecasts over summer monsoon regions of the Northern Hemisphere, using ELR applied at each gridpoint to the individual model forecasts which are subsequently averaged together with equal weighting. The paper is outlined as follows. The data and method are presented in section 2 together with diagnostics relative to the ELR model setup when applied to weekly-varying precipitation tercile averages. The skill of starts during the May–Aug seasons are examined for the NAM, WAM and AM separately in section 3, first at weekly resolution. Attempts at improving skill through week 3–4 averages are then discussed alongside their skill relationships to ENSO and the MJO. Conclusions are summarized in section 4.
2. Data and Methods
2.1. Observation and Model Datasets
Daily precipitation fields from the European Centre for Medium-Range Weather Forecasts (ECMWF), National Centers for Environmental Prediction (NCEP) CFSv2 and the China Meteorological Administration (CMA) subseasonal forecasts for week 1, week 2, week 3, and week 4 of the reforecasts (i.e., the periods from [d+1;d+7] to [d+22;d+28] for a forecast issued on day d) were obtained from the Subseasonal-to-Seasonal (S2S) database (Vitart et al., 2017) through the IRI Data Library (IRIDL) portal. These EPS have different native resolutions (from 125 km at the Equator with 40 vertical levels for CMA to 16/32 km and 91 vertical levels for ECMWF) and are archived on a common 1.5° grid in the S2S database. The ensemble members (51 for ECMWF, 4 for NCEP and CMA) and reforecasts length (between 44 and 60 days lead from the NCEP CFSv2 to CMA) depend on the modeling center as indicated in Table 1; see Vitart et al. (2017) for further details. In particular, ECMWF is the only model for which reforecasts are generated on the fly twice a week (11 members every Monday and Thursday), while those from NCEP and CMA are generated 4-times daily from fixed model versions. We thus consider in the following weekly cumulated precipitation based on ECMWF reforecasts that are generated for Monday starts from May to Aug 2015, on which NCEP and CMA 4 members daily reforecasts have been sampled from their respective 1999–2010 and 1994–2014 periods of issuance. There are 240 reforecasts (20 starts per season over 12 years) for each model used in this study. The common period when all three EPS reforecasts are available is 1999–2010, and that is the period used in our analysis. Subsequently, S2S data were spatially interpolated onto the GPCP 1-degree horizontal grid before the ELR forecast probabilities obtained from the three individual models are averaged to form MME tercile precipitation forecasts from which the skill of starts in May-Aug is assessed over the three continental summer monsoon regions.
Table 1. ECMWF, NCEP, and CMA forecasts attributes as archived in the Subseasonal-to-seasonal (S2S) database at ECMWF.
To produce comparable sets of forecasts, the Global Precipitation Climatology Project (GPCP) version 1.2 (Huffman et al., 2001; Huffman and Bolvin, 2012) daily rainfall estimates on a 1-degree grid, available from 1996 to October 2015, are used as observational data for the calibration and verification of the reforecasts over the 1999–2010 period of analysis for all three regions.
2.2. Extended Logistic Regression Model
Distributional regressions are well suited to probability forecasting, i.e., when the predictand is a probability of exceedance rather than a measurable physical quantity, allowing the conditional distribution of a response variable to be derived given a set of explanatory predictors. In this context, logistic regression can be extended to produce the probability p of the verifying observation V not exceeding the quantile q,
by including an additional explanatory variable g(q) which is a function of the quantile q as follows:
where f and g are here linear functions of the EPS ensemble mean and quantile q respectively. This definition of ELR leads to mutually consistent individual threshold probabilities (Wilks and Hamill, 2007; Wilks, 2009); see section 2.3. Ultimately, these allow flexible choice of threshold probabilities according to users need (Barnston and Tippett, 2014). Here, ELR is computed for q equal to the 33rd and 67th percentiles of the precipitation distribution to produce tercile category probabilities that are referred as ELR forecasts in the rest of this study.
The observed climatological tercile categories corresponding to the 33rd and 67th percentile from GPCP weekly cumulated precipitation estimates are defined separately at each gridpoint for each start within the May-Aug (May 4th to Aug 24th Mondays start dates) season (i.e., 12 starts) and each lead (week 1–4) following a leave-one year-out approach. Next, (1) the ELR parameters are estimated separately for each model, gridpoint, calendar start date and lead using all years except the one being forecast, (2) forecasted terciles probabilities are cross-validated for the remaining year (validation set), i.e., leave-one year-out methodology, (3) Multi-Model Ensembles (MME) are constructed by simple averaging of the three individual forecast probabilities (MME forecasts in the following).
2.3. ELR Model Setup
For forecasts of weekly averages, the climatological observed tercile categories are computed over 3-week windows formed by the forecast target week and a week on either side. The year being forecast is left out of the climatology calculation which uses the 33 weeks from the remaining 11 years. Wider windows did not improve the skill of the cross-validated forecasts contrasting with the findings of Wilks (2009). A “dry mask” is used and ELR forecasts are only produced when and where the 33rd percentile is non-zero, since otherwise the lower tercile boundary is not well-defined. The MME is obtained by averaging individual forecasts with equal weighting.
In additon, we also considered forecasts for the week 3–4 target period (from d+15 to d+28 for forecasts issued on day d). This corresponds to a 2-week target at 2-week lead (Zhu et al., 2014). The tercile categories were derived using a 6-week window, including the 2-week target formed by week 3 and 4 leads and two weeks on either side; wider windows did not improve forecast skill.
Figure 1 shows an example of the regressions computed from ECMWF reforecasts for Aug 3–9 2000, fitted using a 3-week window centered on the Aug 3rd week at the gridpoint at [13.5°N;91.5°W] just off the Guatemala Pacific coast where there is some skill in summer. Regressions are based on observed terciles of GPCP observation over this 3-week window (Jul 27th to Aug 16th). Forecasted probabilities of non-exceedance of the 0.33 and 0.67 quantiles obtained from Equation (1) for different values of the ensemble mean weekly accumulated precipitation forecasts (x axis) are characterized by parallel lines for different leads (week 1–4) in agreement with the ELR formulated as per Equation (1) yielding logically consistent sets of forecasts, i.e., cumulative probabilities for smaller predictand thresholds cannot exceed those for larger thresholds (Wilks, 2009). The nonzero slope of the lines is an indication of forecast skill. As the lead time increases, the regression have slopes that are closer to zero and their departures from the climatological probabilities decrease. Once weekly terciles are defined under cross-validation, the ELR model is then trained out-of-sample on the same pool of weeks (i.e., 3-week windows centered on the target week, over 11 years) by fitting forecasts equations at each point, lead and start separately for each S2S model. Regression coefficients obtained then allow to produce forecasted weekly precipitation terciles probabilities. Finally the different forecasted terciles probabilities from the three models are averaged (i.e., with equal weights) to produce MME forecasts.
Figure 1. Extended Logistic Regressions plotted for ECMWF hindcasts issued Aug 3rd 2000 at [13.5°N;91.5°W] and fitted using 3-week windows over 11 years for terciles definition and training. Forecasted probabilities of non-exceedance of the 0.33 (thick lines) and 0.67 (thin lines) quantiles respectively computed from Equation (1) for different values of the ensemble mean weekly accumulated precipitation forecasts (x axis, in mm) are shown by parallel lines at different leads (week 1–4) yielding to logically consistent sets of forecasts. The distribution of ECMWF ensemble mean weekly rainfall over the 1999–2010 period at this gridpoint is plotted as bins centered on integer multiple of 10 in the lower panel for the respective leads.
2.4. Skill Metrics
The skill of tercile category precipitation forecasts obtained from the above ELR model are evaluated using two standard metrics for probabilistic forecasts. First, reliability diagrams are plotted to evaluate their reliability, resolution and sharpness (Wilks, 1995; Hamill, 1997), computed by pooling all land points over the broader North American, West African and Asian summer monsoon domains (see Figures 5–7, respectively). These broad geographical windows encompass regions with different rainfall regimes, some of which might be only adjacent to the core monsoons, such as the semi-arid southwest United States for instance. Ranked Probability Skill Scores (RPSS; Epstein, 1969; Murphy, 1969, 1971; Weigel et al., 2007) maps complement the above diagnostics with spatial information and quantify the extent to which the ELR-calibrated predictions are improved compared to climatological frequencies.
2.5. Significance Testing
In section 3.3, RPSS is averaged for starts during specific phases of ENSO and the MJO, and are tested for statistical significance using Monte Carlo simulations based on many random forecasts subsets (i.e., 100,000) drawn from the entire pool of forecasts with starts during the May–Aug period, from which the 90th percentile RPSS is compared to these from ENSO/MJO phase samples. Monte Carlo simulations are also used to assess the significance of the correlations of area averages and principal components of week 3–4 MME RPSS with the observed Niño3.4 index and RMM1 and RMM2 MJO indices from Wheeler and Hendon (2004), as well as their best linear combination.
3. Results
3.1. Weekly Averages
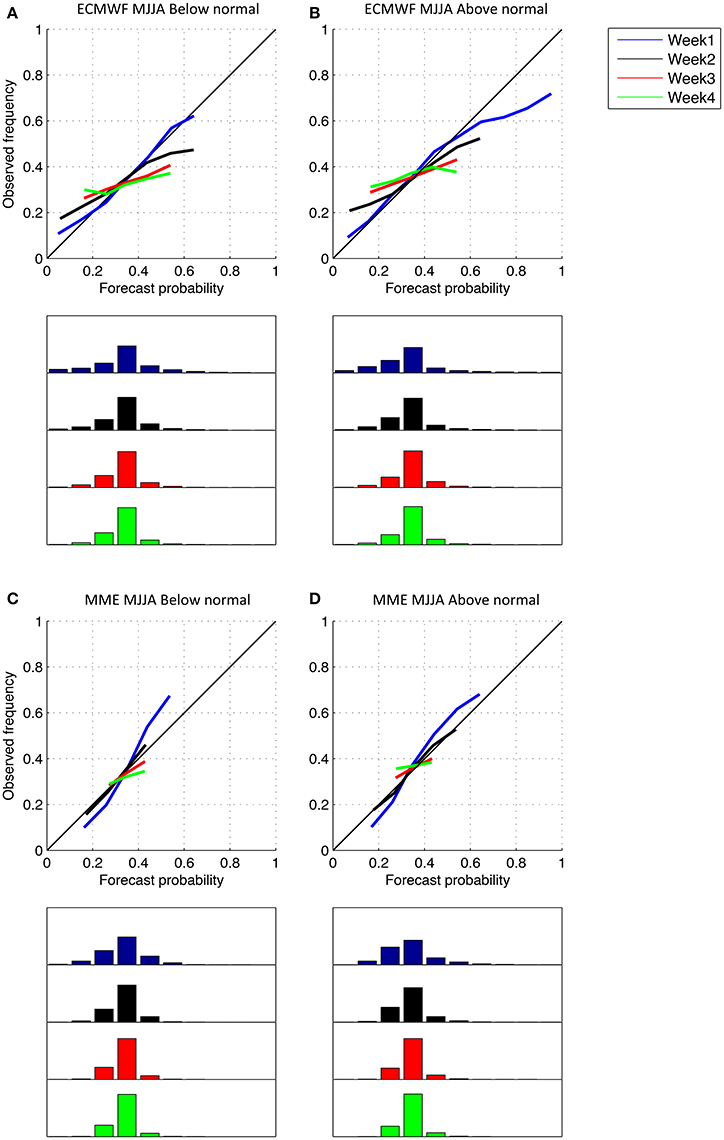
Reliability diagrams for weekly ECMWF precipitation tercile category forecasts from all weekly starts during the May-Aug season and each land gridpoints from the NAM domain in Figure 5, are displayed in Figures 2A,B for the below- and above-normal categories respectively. These exhibit reasonable skill for week 1 in terms of reliability and resolution, as shown by blue curves close to the diagonal and distant from the climatological 0.33 horizontal line (zero resolution line, not plotted) respectively. The corresponding histograms for week 1 ECMWF forecasted categories are spread across all bins characterizing high sharpness. Relatively few forecasts favor the above-normal category, and they show a tendency toward over-confidence when they are strong. As lead time increases, the sharpness decreases and maximum frequencies become concentrated around climatology (0.33, i.e., fourth bin). This is concomitant with decreasing slopes from week 1 and week 2 onwards when reliability and resolution sharply drop. NCEP and CMA forecasts exhibit qualitatively similar results (not shown) but are overall less skillful than ECMWF. MME forecasts are characterized slightly greater slopes for week 2 leads in particular, indicating increased reliability and resolution for the MME as compared to individual model forecasts. However, the sharpness of the MME becomes very low at long lead (Figures 2C,D); week 3 and week 4 MME forecasts show only small deviation from equal odds, and those lack reliability. Qualitatively similar findings are found for the WAM and AM regions, where individual models (Figures 3A,B, 4A,B and MME forecasts (Figures 3C,D, 4C,D) display good reliability but lower sharpness at week 1 lead when compared to the NAM, especially for the WAM. Skill decreases at higher leads with decreasing sharpness, but greater slopes (i.e., closer to the 45° line) for the MME indicate more reliability than for individual forecasts. Week 3 forecasts are slightly more reliable than for the NAM and almost flat lines for week 4 leads reflect low skill.
Figure 2. Reliability diagrams for the below- and above- normal categories from ECMWF forecasts (A,B) and the MME of ECMWF, NCEP, and CMA forecasts (C,D) for starts in May-Aug computed for landpoints of the North American summer monsoon region shown in Figure 5, with color coding based on week leads. The frequencies with which each category is forecasted are indicated as bins centered on integer multiple of 0.10 in histograms plotted under the respective tercile category diagram. The bins are projected along the same x-axis (forecast probabilities from 0 to 1) and scaled from 0 to 100%. Note that only bins with more than 1% of the total number of forecasts in each category are plotted in the relative diagrams for each lead.
Figure 3. Similar to Figure 2 but for landpoints of the West African monsoon region shown in Figure 6.
Maps of RPSS for individual models and the MME are shown for the NAM in Figure 5. In week 1, Figure 5 displays positive individual forecast skill depending on the model, with maximum scores over land located over Central America and to the north and northwest of the Gulf of Mexico; over neighboring oceanic regions, maximum skill is found off the Central American coast in the Pacific. In week 2, these regions are still characterized by larger RPSS but with much lower magnitude, while RPSS values for week 3 and week 4 are near zero or negative everywhere except over southern Central America and off the coast in the Pacific for ECMWF and NCEP forecasts. The CMA forecasts are less skillful over all three monsoon regions. Multi-model combination results in a slight RPSS increase in week 1 and 2 compared to the most skillful individual model (ECMWF), particularly over Central America, the southwest US and off the coast in the Pacific, while from week 3 skill only remains over southern Central America. The greatest benefit of the MME is that it largely removes the small negative RPSS values.
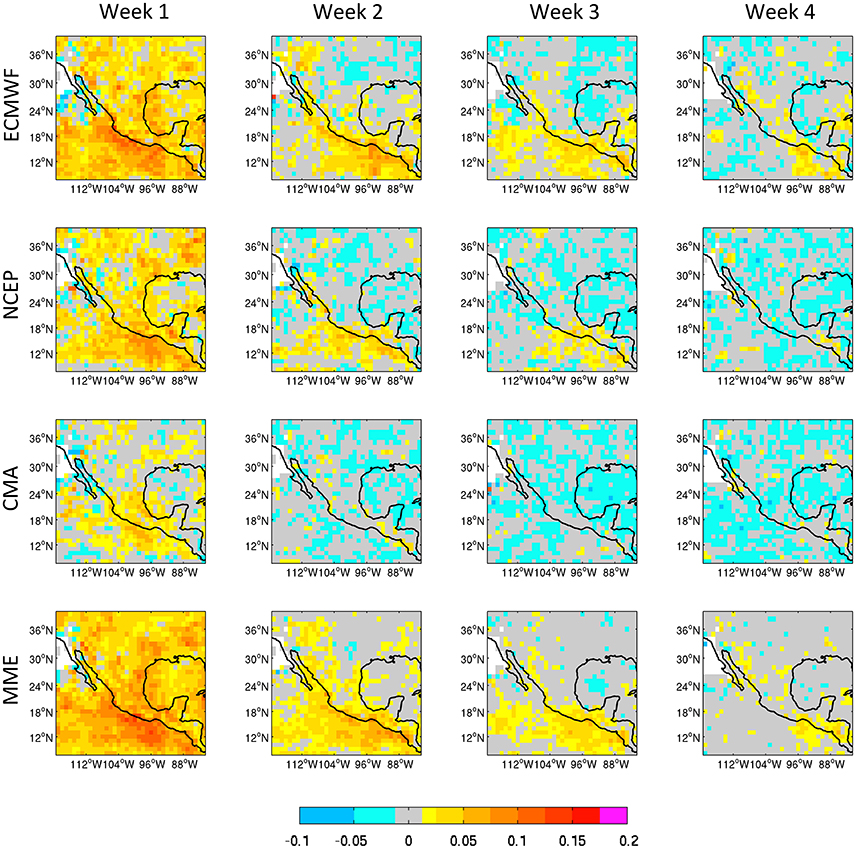
Figure 5. Ranked Probability Skill Scores (RPSS) for ECMWF, NCEP, and CMA terciles precipitation forecasts as well as their MME for starts during the May-Aug season. The different columns correspond to different leads from 1 to 4 weeks.
Over West Africa, RPSS in week 1 and 2 is much lower than for the NAM with small positive values along the Guinean and Atlantic coastal regions south of 18°N in latitudes (Figure 6). These poor scores could be related to the low predictability of Mesoscale Convective Systems (MCS) generally leading to heavy precipitation events over the region but which are not well predicted in current EPS (Swinbank et al., 2016). RPSS values for week 3 and week 4 are near zero or negative everywhere except for small patches near the coasts in NCEP and ECMWF models. The MME again enhances skill compared to the best individual model and largely eliminates the small negative RPSS values.
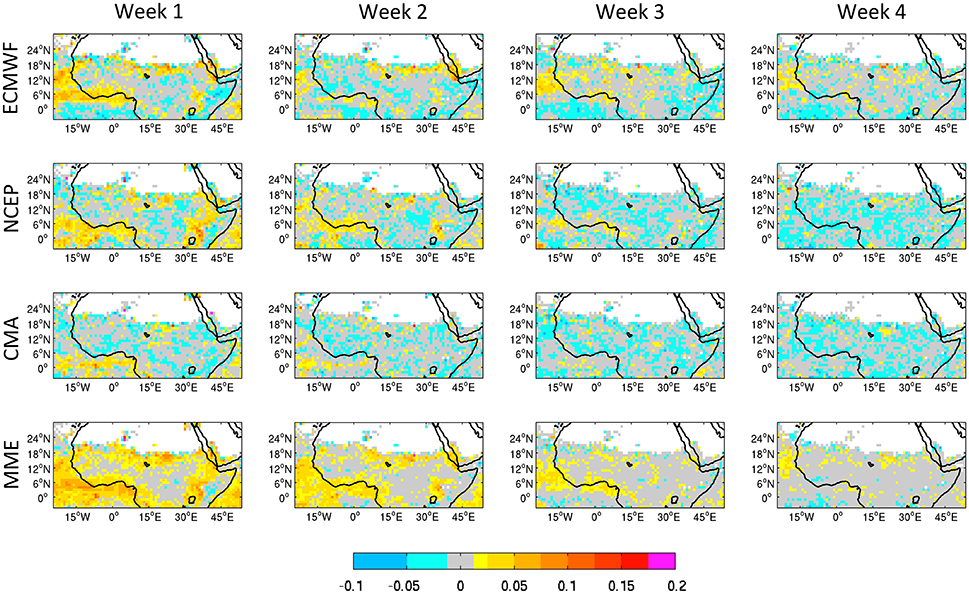
Figure 6. Similar to Figure 5 but for the West African monsoon region.
For the AM, RPSS values are maximum in week 1 and 2 extending from the south of Pakistan across India, except along the west coast, and southern China toward northern regions of Southeast Asia (Figure 7) for ECMWF and NCEP, while reasonable skill is shown for surrounding oceanic regions. From week 3, only ECMWF still exhibits skill over the central Indian peninsula, Bangladesh and southern China, recalling the monsoon precipitation footprint. As a result, MME forecasts are more skillful compared to individual models up to week 2, with maximum skill extending along a meridional band stretching from northeastern India to southern China, but from week 3, the skill of the MME is lower than for ECMWF thus making questionable the value of a MME based on these three EPS for this region. Note that the latter includes South and Southeast Asia but not East Asian summer monsoon regions (Ding and Chan, 2005; Huang et al., 2012).
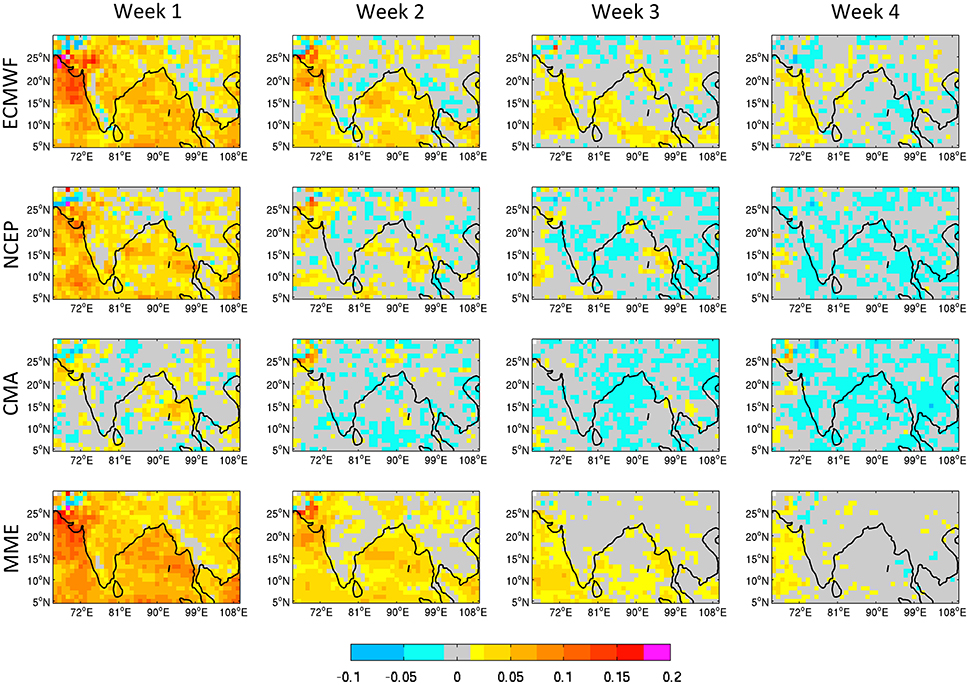
Figure 7. Similar to Figure 5 but for the Asian monsoon region.
3.2. Week 3–4 Averages
Figure 8 shows reliability diagrams computed over the three monsoon regions for the below- and above-normal categories for 2-week week 3–4 averages, from the individual models and their resulting MME with starts during the May-Aug season. Week 3–4 averages are characterized by lower slopes than week 3 forecasts but greater than those for week 4 lead (Figures 2–4), indicating some improvements in terms of reliability. The gain from multi-model ensembling is increased (greater slopes) for week 3–4 compared to weekly averages. Figures 9A–D display the percentage of forecast probabilities that do not fall in the climatology bin 0.3–0.4, as a complementary measure of sharpness. For both ECMWF and the MME, the percentage of forecasts with probabilities different from climatology, and thus sharpness, is increased for week 3–4 averages compared to week 3 and week 4 forecasts over all three regions, with greater increases for ECMWF than for the MME.
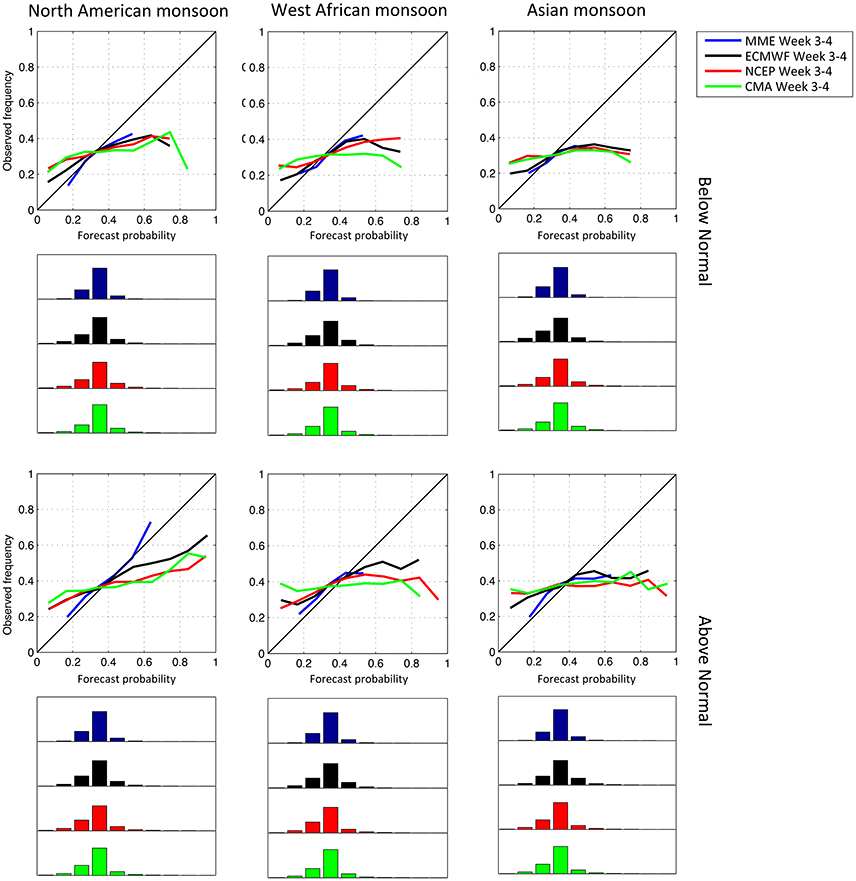
Figure 8. Week 3–4 reliability diagrams for the below- (top) and above-normal (bottom) categories from ECWMF (black), NCEP (red), and CMA (green) forecasts with starts in May–Aug together with their MME (blue) computed for landpoints of the North American (left), West African (center) and Asian (right) summer monsoon regions. The frequencies with which each category is forecasted are indicated as bins centered on integer multiple of 0.10 in histograms plotted under the respective tercile category diagram for each forecast in their respective colors. The bins are projected along the same x-axis (forecast probabilities from 0 to 1) and scaled from 0 to 100%. Note that only bins with more than 1% of the total number of forecasts in each category are plotted.
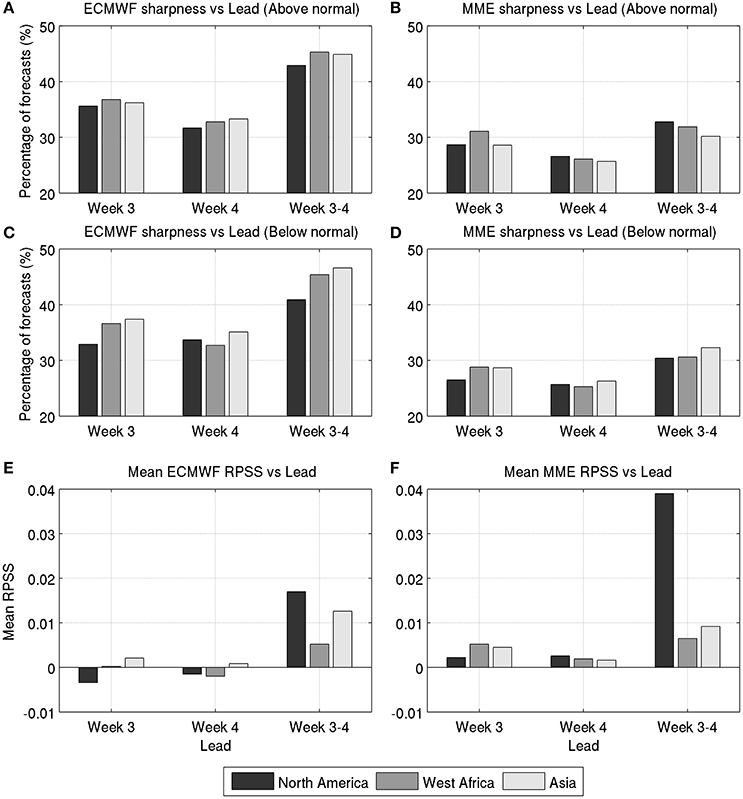
Figure 9. Percentages of forecasts in all bins except for the 4th bin (0.33) shown in Figures 2–4 for week 3, week 4, and week 3–4 forecasts from ECMWF (A,C) and the MME of ECMWF, NCEP, and CMA forecasts (B,D) for the Above and Below normal categories, together with related RPSS spatially averaged over each monsoon region (E,F).
RPSS averaged for all starts over each monsoon region separately are shown in Figures 9E,F for week 3, week 4 and week 3–4 forecasts from ECMWF and the MME respectively. For both ECMWF and the MME, higher RPSS values are found for week 3–4 averages compared to week 3 and week 4 forecasts. Moreover, the average week 3–4 RPSS is greater for the MME than for ECMWF over the NAM and WAM but not for the AM. In agreement with these findings, maps of RPSS for week 3–4 MME outlooks shown in Figure 10 for all starts within the May-Aug season confirm that week 3–4 averages are more skillful than weekly forecasts at week 3 lead over each region, an aspect which is less pronounced for the AM (Figures 5–7, bottom panels). This is indicated by higher scores, as for the NAM over southern Central America (Figure 10A), illustrating the added value of pooling together week 3 and 4 leads. In addition, week 3–4 averages exhibit broader areas of skill increase over West Africa compared to week 3, where not only coastal regions of the tropical Atlantic and Guinea Gulf are characterized by higher scores but also the Sahel south of 20°N stretching across the whole subcontinent as far as the Ethiopian highlands exhibiting maximum skill (Figure 10B). Skill is also increased for continental AM regions but to a lesser extend as reflected by lower slopes in the reliability diagrams (Figure 8) compared to the two other monsoon sectors. Week 3–4 averages display maximum scores extending from northeastern parts of the domain across the Indian peninsula to southern China and Burma (Figure 10C), where no skill was found in weekly forecasts. For the three monsoon domains, higher skill is found for regions adjacent to the ocean that are generally drier than the core monsoon suggesting that the ocean plays a role in regional predictability.
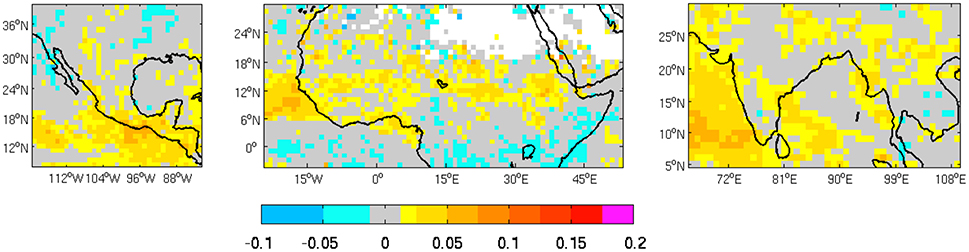
Figure 10. Ranked Probability Skill Scores (RPSS) for terciles precipitation week 3–4 forecasts from the MME of ECMWF, NCEP, and CMA forecasts for all starts within the May-Aug season.
3.3. Modulation of Skill by ENSO and the MJO
To examine the skill from week 3–4 further, time-series for the RPSS of week 3–4 MME forecasts averaged over each monsoon region and the MJO RMM1 and RMM2 of Wheeler and Hendon (2004) as well as the observed Niño3.4 index are plotted in Figure 11, and their respective temporal correlations are given in Table 2. For the NAM, periods when week 3–4 MME RPSS is reaching maximum values in Figure 11A coincide with local minima in Niño3.4, an aspect which is emphasized by significant anti-correlations (−0.23) in Table 2, while no significant relationship is found with the MJO, except with RMM2 during La Niña (−0.29). Over West Africa, mean RPSS is negatively/positively correlated with Niño3.4/MJO RMM2 (−0.27/0.13), consistent with maximum RPSS values coinciding with Niño3.4 minima but RMM2 peaks (Figure 11B). The best MJO RMMs combination exhibits relationships of the same magnitude as RMM2. For the AM, RPSS is negatively related to Niño3.4 (−0.28) and MJO RMM1 (−0.19), with similar magnitude to the best RMMs combination, agreeing with RPSS peaks for Niño3.4/MJO RMM1 minima (Figure 11C).
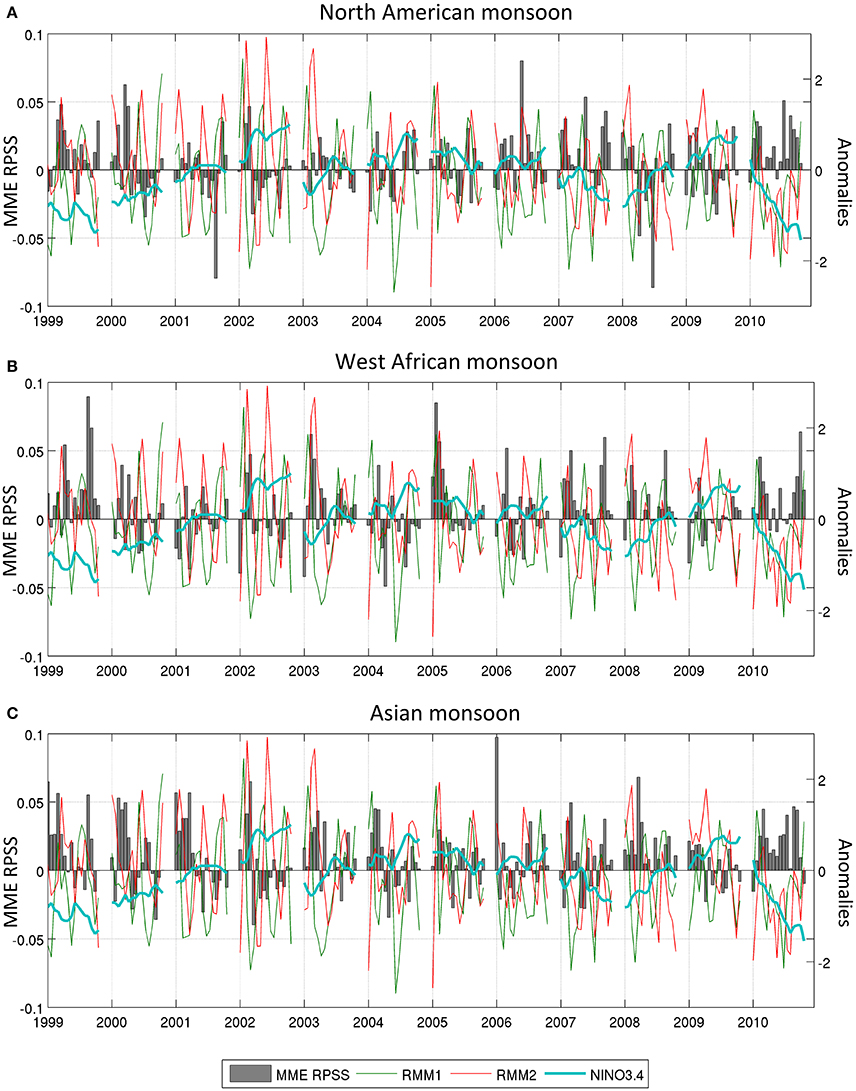
Figure 11. MME Week 3–4 RPSS averaged over the North American (A), West African (B), and Asian (C) continental monsoon regions (bars) together with observed Niño3.4 index (cyan) and MJO measured by the RMM1 (green) and RMM2 (red) indices of Wheeler and Hendon (2004). Corresponding correlations can be found in Table 2.
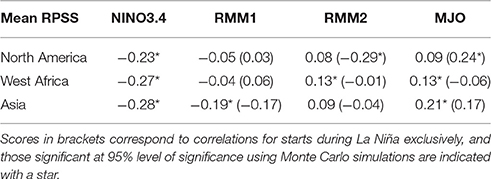
Table 2. Correlations between May–Aug week 3–4 MME RPSS averaged over continental monsoon regions and observed NINO3.4 index (2nd column), MJO measured by the RMM1 (3rd column) and RMM2 (4th column) indices of Wheeler and Hendon (2004) and their best linar combination (5th column).
Figure 12 shows week 3–4 MME RPSS averaged over land gridpoints of the three monsoon regions for starts during distinct ENSO conditions (neutral when the absolute value of Niño3.4 is smaller than 0.5, El Niño and La Niña for Niño3.4 greater than 0.5 and lower than −0.5 respectively) and MJO phases to get further insights on the stratification of skill according to each signal. For all regions, contrasting mean RPSS values suggest that skill is significantly enhanced for starts during La Niña, while the asymmetry between ENSO phases suggests non-linearities in skill relationships to ENSO; however, the small 11-year 1999–2010 sample contains no strong El Niño events (see Figure 11). The apparent non-linearity could be due to the more pronounced circulation anomalies during La Niña than El Niño for the NAM (Wang et al., 2007) but also El Niño relationships to droughts for the WAM and AM (Krishna Kumar et al., 2006; Joly and Voldoire, 2009) translating in less skill while predicting low rainfall amounts compared to La Niña. Maximum RPSS is found for all regions during MJO phase 7 (not significant for the WAM), when convection is enhanced over the Western Pacific. For the AM, maximum RPSS found also for phases 6, 8, 1, and 2 suggest better skill for monsoon break events occuring predominantly during these MJO phases (Pai et al., 2011), compared to active episodes most frequent during phase 4 for which mean RPSS is minimum. For the NAM and WAM, lowest RPSS are found during MJO phase 3 when convection is enhanced over the Indian Ocean. During MJO phase 7, RMM1 and RMM2 are respectively negative and positive, while it is the opposite for phases 3 and 4, thus these results are consistent with mean RPSS anti-correlations with RMM1 for the AM and positive correlations with RMM2 for the WAM shown in Table 2.
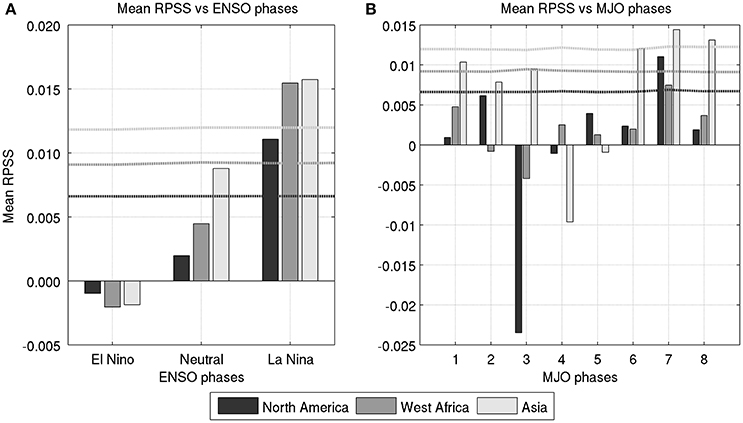
Figure 12. Mean MME Week 3–4 RPSS averaged over continental monsoon regions for observed phases of Niño3.4 index (A) and MJO phases (B) measured by the RMM1 and RMM2 indices of Wheeler and Hendon (2004). Black, gray, and light gray lines correspond to the 90% level of significance over the respective North American, West African and Asian summer monsoon regions using Monte Carlo simulations.
Next, a Principal Components Analysis (PCA) is applied to week 3–4 MME RPSS (total values; the mean is not removed) over land points of each monsoon domain at weekly resolution. This approach allows one to examine if the regional structure of skill can be decomposed in geographically coherent patterns of variability, as illustrated in Figure 13, top panels showing the spatial correlations typical of the first Principal Components (PCs) for each region. Despite the rather small part of total variance explained (10, 7, and 6% for the NAM, WAM and AM), RPSS PC1s are significantly and negatively correlated to RPSS spatially averaged over land points for each monsoon domain (around −0.9 for the WAM and AM, and above −0.5 for the NAM), indicating that PC1 represents the spatially coherent component of RPSS variability in each region. The patterns associated with the first PCs bear some similarities to those of correlations between weekly GPCP rainfall and both observed Niño3.4 and MJO indices (Figure 13, lower panels). Scores obtained for Niño3.4 are generally not significant which might reflect the small sample of events across the short period of study. For the NAM, maximum PC1 loadings over Central America coincide with the pattern of highest negative correlations between weekly rainfall and MJO RMMs, however loadings over land are weaker than for the WAM and AM, agreeing with quantitatively weaker relationships between mean RPSS and MJO indices (Table 2). For the WAM, parts of PC1 loadings are consistent with maximum correlations between rainfall and RMM1 (also Niño3.4 to a lesser extent) along southern coastal regions of the Guinea Gulf/tropical Atlantic and over the Ethiopian highlands to the east. Over Sahelian regions west of 20°E, PC1 displays more scattered loadings but recall significant correlations between weekly precipitation and RMM2 which have also low spatial coherence and are consistent with significant and positive mean RPSS correlations with RMM2 (Table 2). Both patterns might reflect the poor observations available locally that could translate in some uncertainties in GPCP estimates, and thus in their relationships to ENSO and MJO and skill measures of week 3–4 averages. For the AM, PC1 loadings also bear similarities to correlation patterns between weekly rainfall and both MJO RMMs: PC1 scores are maximum from the Indian peninsula to northern regions of Southeast Asia and resemble the monsoon footprint partly embedded in rainfall correlations with RMM2 contrasting with skill in the northeast and south Indian peninsula similar to rainfall correlations with RMM1 and consistent with RPSS anti-correlations with RMM1 (Table 2).
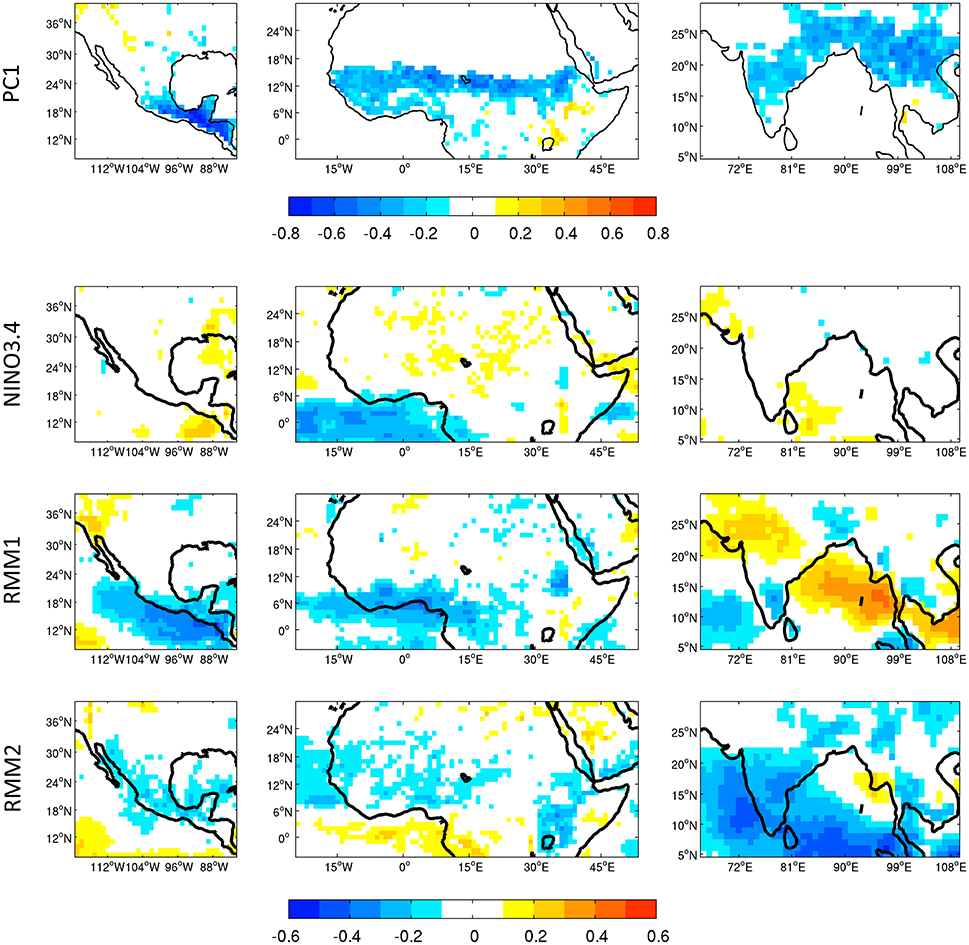
Figure 13. Top panels display spatial correlation patterns of raw week 3–4 MME RPSS Principal Components (PCs) for starts during the May-Aug season. Other panels show May–Aug correlations between GPCP weekly precipitation and observed weekly Niño3.4 index (2nd raw) and MJO RMM1 (3rd raw) and RMM2 (bottom raw) indices of Wheeler and Hendon (2004). Only scores significant at 95% level of significance using Monte Carlo simulations are plotted.
RPSS PC1s all exhibit significant correlations with the observed Niño3.4 index (0.4, 0.24, and 0.2 for the NAM, WAM, and AM respectively) agreeing with mean RPSS anti-correlations with Niño3.4 (Table 2) and higher values for La Niña starts over all monsoon regions (Figure 12A). Significant PC1 correlations with the observed MJO for the AM (0.15 and -0.20 for RMM1 and RMM2) and WAM (-0.15 for RMM2) but none for the NAM. These results agree with those of mean RPSS shown in Table 2 and indicate relationships to skill as shown in Figure 13, top panels, consistently with the decreasing strength of MJO-induced modulations of monsoonal rainfall from Asia (Krishnamurthy and Kinter, 2003) to West Africa (Niang et al., 2016) and North America, where MJO influence is most limited geographically (Higgins and Shi, 2001; Lorenz and Hartmann, 2006). PC1 relationships to RMM2 and the similar magnitude of PC1 correlations with Niño3.4 and the best MJO RMMs combination for the AM might reflect the complexity of scale interactions between ENSO and MJO activity (Figure 12). Regressing out one signal from the other lowers the relationships with PC1s which all remain significant (not shown).
4. Conclusions
The skill from S2S forecasts using ECMWF, NCEP, and CMA week 1–4 leads to form a MME by equal pooling has been examined by applying ELR to produce forecasted precipitation terciles probabilities at weekly resolution for the North American (NAM), West African (WAM) and Asian (AM) summer monsoon regions, over the 1999–2010 period for which all three EPS reforecasts are available. Terciles are computed using, for each start and lead, a 3-week window centered on the target week, then the ELR model is trained out-of-sample using the same pool of weeks. To accomodate the discontinuity between zero rain and rainy events in the observed precipitation PDFs, forecasts are only made for weeks where and when the lower tercile is non-zero. The resulting calibrated weekly precipitation terciles forecasts are characterized by good reliability but low sharpness and, as expected, decreasing skill with lead times. Skill sharply drops after one and two weeks (Figures 2–4), and remains low for greater leads over all three regions as well as for their MME (Figures 5–7). For the AM, only ECMWF shows positive skill from week 3, the MME consequently exhibits lower skill thus questioning the value of a weekly MME based on these three EPS locally.
To improve skill and because it is sensible to increase averaging windows with increasing lead (Zhu et al., 2014), week 3 and week 4 leads are combined together to produce forecasts of week 3–4 precipitation tercile probabilities. The tercile definition has been adapted using 6-week windows centered on the 2-week target formed by week 3 and 4 leads. The ELR model is subsequently trained on the same pool of weeks defined separately for each start in an out-of-sample manner. The sharpness of the forecasts obtained is still low but increased compared to both week 3 and 4 leads (Figures 9A–D), alongside better reliability than week 4 forecasts and more gain for the MME compared to individual models (Figure 8). When compared to RPSS from weekly forecasts, week 3–4 outlooks have more skill than week 3 and week 4 averages over the three monsoon regions (Figures 9E,F, 10). Regions adjacent to the ocean display higher skill suggesting a possible role for the ocean with regards to regional predictability. Recently, Bombardi et al. (2017) found that subseasonal forecasts generally outperform climatology when predicting the onset date of the monsoon, and for the AM, Moron et al. (2017) found a drop in the spatial coherence of interannual variations of subseasonal to seasonal anomalies in the core of the monsoon season in comparison to onset and withdrawal phases, hence suggesting that the skill of the subseasonal outlooks hereby discussed might be higher for forecast starts in spring and early summer than for starts within the core monsoon season. The timing and strength of the developing monsoonal circulation that advects moisture into continental core monsoon regions is generally influenced by neighboring SSTs and other external factors, while the role of the land surface is relatively passive then due to its dryness. In contrast, local land surface feedbacks can sustain rainfall during the core monsoon season through local-scale moisture “recycling” as has been observed for the AM region (Meehl, 1994; Koster et al., 2004). These differing mechanisms are expected to yield more predictability during the onset phase compared to the core season for continental summer monsoon regions at subseasonal and seasonal time-scales (Moron et al., 2017). Skill and predictability of onset date is not explicitly examined here.
Next, skill relationships to ENSO and the MJO are examined by averaging RPSS over land gridpoints of each monsoon sector domain (Table 2 and Figures 11, 12), and by applying a PCA to week 3–4 MME RPSS for each region separately (Figure 13, top panels). RPSS PC1s are all significantly correlated with mean RPSS over each monsoon continental domain, and both are related to ENSO. For all monsoon regions, skill is greater for starts during La Niña compared to El Niño and neutral conditions (Figure 12A). The asymmetry between both phases could be due to the small sample of ENSO episodes during the 11-year period (see Figure 11) but could also be related to more pronounced circulation anomalies during La Niña than El Niño for the NAM (Wang et al., 2007) and El Niño relationships to droughts for the WAM and AM (Krishna Kumar et al., 2006; Joly and Voldoire, 2009). These non-linearities could explain the rather low linear correlations in Table 2 at least for the NAM, where scores are increased significantly during La Niña. Moreover, enhanced skill for starts during cold ENSO phases might be related to increased predictability of monsoon onset dates. Over the AM region for instance, the onset is hastened during La Niña episodes, while the pattern of latent heat release that drives the monsoon flow (Slingo and Annamalai, 2000) is noisier during the core season, when the monsoon is then less sensitive to, and thus less predictible from, large-scale SST forcings (Moron and Robertson, 2014; Moron et al., 2017).
Across all monsoon domains, RPSS is maximum during MJO phase 7 (Figure 12B) when latent heating anomalies in the warm pool remotely increase convection over the WAM and NAM through an equatorial wave mechanism (Matthews, 2004; Lavender and Matthews, 2009) that could lead to more skillful predictions over both regions. For the AM, additional maximum RPSS during phases 6, 8, 1, and 2 indicate bettter skill for monsoon breaks compared to active episodes most frequent during phase 4 and for which skill is minimum, in agreement with greater spatial coherence and predictability than for the core of the monsoon season (Moron et al., 2017). For the NAM and WAM, skill is minimum during MJO phase 3 when convection is enhanced over the Indian Ocean, in turn increasing the activity of AEWs within the WAM and tropical Atlantic TCs (Zhang, 2013; Klotzbach and Oliver, 2015) linked to Gulf moisture surges feeding in the NAM (Pascale and Bordoni, 2016), which synoptic nature might be less predictible. Contrasting skill relationships to MJO phases 7 and 3–4 suggest potential skill improvement when RMM1 and RMM2 are respectively negative and positive, consistently with mean RPSS and PC1 correlations with MJO RMMs for the AM and WAM in particular. For both regions, PC1 patterns bear similarities to those of correlations between weekly rainfall and MJO RMMs (Figure 13, lower panels), while no relationship is evidenced for the NAM.
Overall, our diagnostics provide evidence of substantial skill in all three summer monsoon regions, while opportunities for skillful predictions can be increased as shown for starts during La Niña and MJO phase 7.
Author Contributions
NV designed and ran the ELR calibration approach used in this paper alongside diagnostics of the subsequent multi-model ensemble forecasts over the three summer monsoon regions of the Northern Hemisphere. AR and MT provided expertise for the ELR methodology design as well as for the diagnostics of multi-model ensemble output. NA provided expertise for the interpretation of multi-model ensemble results over the Asian Monsoon region.
Funding
The authors acknowledge the financial support of the NOAA Next Generation Global Prediction System (NGGPS) NA15NWS4680014 grant.
Conflict of Interest Statement
The authors declare that the research was conducted in the absence of any commercial or financial relationships that could be construed as a potential conflict of interest.
Acknowledgments
The authors are grateful to the reviewers whose comments improved the manuscript and acknowledge the use of forecasts available through the S2S database recently published under the WWRP/WCRP S2S project (http://s2sprediction.net). Calculations were performed using IRI resources and the S2S subset archived on the IRI Data Library (IRIDL, http://iridl.ldeo.columbia.edu/). The IRIDL was also used to access GPCP 1DD data provided by the NASA/Goddard Space Flight Center's Mesoscale Atmospheric Processes Laboratory, which develops and computes the 1DD as a contribution to the GEWEX Global Precipitation Climatology Project.
References
Adams, D., and Comrie, C. (1997). The North American monsoon. Bul. Am. Met. Soc. 78, 2197–2213. doi: 10.1175/1520-0477(1997)078<2197:TNAM>2.0.CO;2
Annamalai, H., and Slingo, J. M. (2001). Active/break cycles: diagnosis of the intraseasonal variability of the Asian summer monsoon. Clim. Dyn. 18, 85–102. doi: 10.1007/s003820100161
Baldwin, M., and Dunkerton, T. (2001). Stratospheric harbingers of anomalous weather regimes. Science 294, 581–584. doi: 10.1126/science.1063315
Barnston, A., and Tippett, M. (2014). Climate information, outlooks, and understanding – where does the IRI stand? Earth Perspect. 1, 1–17. doi: 10.1186/2194-6434-1-20
Bombardi, R., Pegion, K., Kinter, J., Cash, B., and Adams, J. (2017). Sub-seasonal predictability of the onset and demise of the rainy season over monsoonal regions. Front. Earth Sci. 5:14. doi: 10.3389/feart.2017.00014
DelSole, T., Trenary, L., Tippett, M., and Pegion, K. (2017). Predictability of week 3-4 average temperature and precipitation over the contiguous United States. J. Clim. 30, 3499–3512. doi: 10.1175/JCLI-D-16-0567.1
Ding, Y., and Chan, J. (2005). The East Asian summer monsoon: an overview. Meteor. Atm. Phys. 89, 117–142. doi: 10.1007/s00703-005-0125-z
Epstein, E. (1969). A scoring system for probability forecasts of ranked categories. J. Appl. Meteor. 8, 985–987. doi: 10.1175/1520-0450(1969)008<0985:ASSFPF>2.0.CO;2
Gadgil, S., Rajeevan, M., and Nanjundiah, R. (2005). Monsoon prediction - why yet another failure? Curr. Sci. 88, 1389–1400.
Gadgil, S., and Rao, P. (2000). Farming strategies for a variable climate - a challenge. Curr. Sci. 78, 1203–1215.
Goddard, L., Mason, S., Zebiak, S., Ropelewski, C., Basher, R., and Cane, M. (2001). Current approaches to seasonal to interannual climate predictions. Int. J. Climatol. 21, 1111–1152. doi: 10.1002/joc.636
Hamill, T. (1997). Reliability diagrams for multicategory probabilistic forecasts. Wea. Forecasting 12, 736–741. doi: 10.1175/1520-0434(1997)012<0736:RDFMPF>2.0.CO;2
Hamill, T., and Whitaker, J. (2006). Probabilistic quantitative precipitation forecasts based on reforecast analogs: theory and application. Mon. Wea. Rev. 134, 3209–3229. doi: 10.1175/MWR3237.1
Hamill, T., Whitaker, J., and Wei, X. (2004). Ensemble reforecasting: Improving medium-range forecast skill using retrospective forecasts. Mon. Wea. Rev. 132, 1434–1447. doi: 10.1175/1520-0493(2004)132<1434:ERIMFS>2.0.CO;2
Higgins, R., and Shi, W. (2001). Intercomparison of the principal modes of interannual and intraseasonal variability of the North American monsoon system. J. Clim. 14, 403–417. doi: 10.1175/1520-0442(2001)014<0403:IOTPMO>2.0.CO;2
Holland, M. M., Bailey, D. A., and Vavrus, S. (2011). Inherent sea ice predictability in the rapidly changing Arctic environment of the Community Climate System Model version 3. Clim. Dyn. 36, 1239–1253. doi: 10.1007/s00382-010-0792-4
Huang, R., Chen, J., Wang, L., and Lin, Z. (2012). Characteristics, processes, and causes of the spatio-temporal variabilities of the East Asian monsoon system. Adv. Atm. Sci. 29, 910–942. doi: 10.1007/s00376-012-2015-x
Huffman, G., Adler, R., Morrissey, M., Bolvin, D., Curtis, S., Joyce, R., et al. (2001). Global precipitation at one-degree daily resolution from multi-satellite observations. J. Hydrometeor. 2, 36–50. doi: 10.1175/1525-7541(2001)002<0036:GPAODD>2.0.CO;2
Huffman, G., and Bolvin, D. (2012). GPCP version 1.2 One-Degree Daily (1DD) Precipitation Dataset Documentation. Asheville, NC: WDC-A, NCDC.
Ingram, S., and Hunt, R. (2015). Human Vulnerability to Dry Periods. Traditional Arid Lands Agriculture: Understanding the Past for the Future. Tucson: University of Arizona Press.
Janicot, S., Moron, V., and Fontaine, B. (1996). Sahel droughts and ENSO dynamics. Geophys. Res. Lett. 23, 515–518. doi: 10.1029/96GL00246
Janicot, S., Mounier, F., Gervois, S., Hall, J. S., Leroux Sultan, B., et al. (2009). The dynamics of the West African monsoon. Part IV: analysis 2590-day variability of convection and the role of the Indian monsoon. J. Clim. 22, 1541–1565. doi: 10.1175/2008JCLI2314.1
Jie, W., Vitart, F., Wu, T., and Liu, X. (2017). Simulations of Asian Summer Monsoon in the sub-seasonal to seasonal prediction project (S2S) database. Q. J. R. Meteor. Soc. 143, 2282–2295, doi: 10.1002/qj.3085
Joly, M., and Voldoire, A. (2009). Influence of ENSO on the West African Monsoon: temporal aspects and atmospheric processes. J. Clim. 22, 3193–3210. doi: 10.1175/2008JCLI2450.1
Klotzbach, P., and Oliver, E. (2015). Modulation of Atlantic basin tropical cyclone activity by the Madden-Julian Oscillation (MJO) from 1905 to 2011. J. Clim. 28, 204–217. doi: 10.1175/JCLI-D-14-00509.1
Koster, R., Dirmeyer, P., Guo, Z., Bonan, G., Chan, E., Cox, P., et al. (2004). Regions of strong coupling between soil moisture and precipitation. Science 305, 1138–1140. doi: 10.1126/science.1100217
Koster, R. D., Mahanama, S. P. P., Yamada, T. J., Balsamo, G., Berg, A. A., Boisserie, M., et al. (2010). Contribution of land surface initialization to subseasonal forecast skill: first results from a multi-model experiment. Gephys. Res. Let. 37:L02402. doi: 10.1029/2009GL041677
Krishna Kumar, K., Rajagopalan, B., Hoerling, M., Bates, G., and Cane, M. (2006). Unraveling the mystery of Indian monsoon failure during El Niño. Science 314, 115–119. doi: 10.1126/science.1131152
Krishnamurthy, V., and Kinter, J. (2003). The Indian Monsoon and Its Relation to Global Climate Variability. Chapter 10, Global Climate. Heidelberg: Springer.
Lau, K., and Chan, P. H. (1986). Aspects of the 40-50 day oscillation during the northern summer as inferred from Outgoing Longwave Radiation. Mon. Wea. Rev. 114, 1354–1367. doi: 10.1175/1520-0493(1986)114<1354:AOTDOD>2.0.CO;2
Lavender, S., and Matthews, A. (2009). Response of the Wwest African monsoon to the Madden-Julian oscillation. J. Clim. 22, 4097–4116. doi: 10.1175/2009JCLI2773.1
Lebel, T., Delclaux, F., Barbe, L. L., and Polcher, J. (2000). From GCM scales to hydrological scales: rainfall variability in West Africa. Stochastic Environ. Res. Risk Assess. 14, 275–295. doi: 10.1007/s004770000050
Lin, H., and Wu, Z. (2011). Contribution of the autumn Tibetan plateau snow cover to seasonal prediction of North American winter temperature. J. Clim. 24, 2801–2813. doi: 10.1175/2010JCLI3889.1
Lorenz, D., and Hartmann, D. (2006). The effect of the MJO on the North American monsoon. J. Clim. 19, 403–417. doi: 10.1175/JCLI3684.1
Matthews, A. (2004). Intraseasonal variability over tropical Africa during northern summer. J. Clim. 17, 2427–2440. doi: 10.1175/1520-0442(2004)017<2427:IVOTAD>2.0.CO;2
Meehl, G. (1994). Influence of the land surface in the Asian summer monsoon: external conditions versus internal feedbacks. J. Clim. 7, 1033–1049. doi: 10.1175/1520-0442(1994)007<1033:IOTLSI>2.0.CO;2
Mohino, E., Janicot, S., Douville, H., and Li, Z. (2012). Impact of the Indian part of the summer MJO on West Africa using nudged climate simulations. Clim. Dyn. 38, 2319–2334. doi: 10.1007/s00382-011-1206-y
Moron, V., and Robertson, A. (2014). Interannual variability of Indian summer monsoon rainfall onset date at local scale. Int. J. Climatol. 34, 1050–1061. doi: 10.1002/joc.3745
Moron, V., Robertson, A. W., and Pai, D. S. (2017). On the spatial coherence of sub-seasonal to seasonal Indian rainfall anomalies. Clim. Dyn. doi: 10.1007/s00382-017-3520-5. [Epub ahead of print].
Murphy, A. (1969). On the ranked probability skill score. J. Appl. Meteor. 8, 988–989. doi: 10.1175/1520-0450(1969)008<0988:OTPS>2.0.CO;2
Murphy, A. (1971). A note on the ranked probability skill score. J. Appl. Meteor. 10, 155–156. doi: 10.1175/1520-0450(1971)010<0155:ANOTRP>2.0.CO;2
Namias, J. (1991). Spring and summer 1988 drought over the contiguous United States - Causes and prediction. J. Clim. 4, 254–265. doi: 10.1175/1520-0442(1991)004<0054:SASDOT>2.0.CO;2
Neena, J. M., Lee, J. Y., Waliser, D., Wang, B., and Jiang, X. (2014). Predictability of the Madden-Julian oscillation in the Intraseasonal Variability Hindcast Experiment (ISVHE). J. Clim. 27, 4531–4543. doi: 10.1175/JCLI-D-13-00624.1
Niang, C., Mohino, E., Gaye, A. T., and Omotosho, J. B. (2016). Impact of the Madden Julian Oscillation on the summer West African monsoon in AMIP simulations. Clim. Dyn. 48, 2297–2314. doi: 10.1007/s00382-016-3206-4
Pai, S., Bhate, J., Sreejith, O., and Hatwar, R. (2011). Impact of MJO on the intraseasonal variation of summer monsoon rainfall over India. Clim. Dyn. 36, 41–55. doi: 10.1007/s00382-009-0634-4
Pascale, S., and Bordoni, S. (2016). Tropical and extratropical controls of gulf of California surges and summertime precipitation over the southwestern United States. Mon. Wea. Rev. 144, 2695–417. doi: 10.1175/MWR-D-15-0429.1
Pohl, B., Janicot, S., Fontaine, B., and Marteau, R. (2009). Implication of the Madden-Julian Oscillation in the 40-day variability of the West African monsoon. J. Clim. 22, 3769–3785. doi: 10.1175/2009JCLI2805.1
Robertson, A., Lall, U., Zebiak, S. E., and Goddard, L. (2004). Improved combination of multiple atmospheric GCM ensembles for seasonal prediction. Mon. Wea. Rev. 132, 2732–2744. doi: 10.1175/MWR2818.1
Rowell, D., Folland, C., Maskell, K., Owen, J., and Ward, M. (1992). Modelling the influence of global sea surface temperatures on the variability and predictability of seasonal Sahel rainfall. Geophys. Res. Lett. 19, 905–908. doi: 10.1029/92GL00939
Scaife, A., and Knight, J. (2008). Ensemble simulations of the cold European winter of 2005/6. Q. J. R. Meteor. Soc. 134, 1647–1659. doi: 10.1002/qj.312
Semazzi, F. H. M., Mehta, V., and Sud, Y. (1988). An investigation of the relationship between sub-saharan rainfall and global sea surface temperatures. Atmos. Ocean 26, 118–138. doi: 10.1080/07055900.1988.9649293
Singh, S. V., Kripalani, R. H., and Sikka, D. R. (1992). Interannual variability of the Madden Julian Oscillations in Indian summer monsoon rainfall. J. Clim. 5, 973–978. doi: 10.1175/1520-0442(1992)005<0973:IVOTMJ>2.0.CO;2
Slingo, J., and Annamalai, H. (2000). 1997: the El Niño of the century and the response of the Indian summer monsoon. Mon. Wea. Rev. 128, 1778–1797. doi: 10.1175/1520-0493(2000)128<1778:TENOOT>2.0.CO;2
Sultan, B., Baron, C., Dingkuhn, M., Sarr, B., and Janicot, S. (2005). Agricultural impacts of large-scale variability of the West African monsoon. Agric. Meterol. 128, 93–110. doi: 10.1016/j.agrformet.2004.08.005
Swinbank, R., Kyouda, M., Buchanan, P., Froude, L., Hamill, T., Hewson, T. D., et al. (2016). The TIGGE Pproject and its achievements. Bull. Amer. Met. Soc. 97, 48–67. doi: 10.1175/BAMS-D-13-00191.1
Tippett, M., Barnston, A., and Robertson, A. (2007). Estimation of seasonal precipitation tercile-based categorical probabilities from ensembles. J. Clim. 20, 2210–2228. doi: 10.1175/JCLI4108.1
Vigaud, N., Robertson, A. W., and Tippett, M. K. (2017). Multi-model ensembling of subseasonal precipitation forecasts over North America. Mon. Wea. Rev. 145, 3913–3928. doi: 10.1175/MWR-D-17-0092.1
Vitart, F. (2014). Evolution of ECMWF sub-seasonal forecast skill scores. Q. J. R. Meteor. Soc. 140, 1889–1899. doi: 10.1002/qj.2256
Vitart, F., Ardilouze, C., Bonet, A., Brookshaw, A., Chen, M., Codorean, C., et al. (2017). The subseasonal to seasonal (S2S) prediction project database. Bull. Am. Meteorol. Soc. 98, 163–173. doi: 10.1175/BAMS-D-16-0017.1
Waliser, D. (2011). Predictability and Forecasting. Chapter 12, Intraseasonal Variability of the Atmosphere-Ocean Climate System. Heidelberg: Springer.
Waliser, D. E., Laun, K. M., Stern, W., and Jones, C. (2003). Potential predictability of the Madden Julian Oscillation. Bull. Amer. Meteor. Soc. 84, 33–50. doi: 10.1175/BAMS-84-1-33
Wang, B., and Xie, X. (1997). A model for the boreal summer intraseasonal oscillation. J. Atmos. Sci. 54, 72–86. doi: 10.1175/1520-0469(1997)054<0072:AMFTBS>2.0.CO;2
Wang, Z., Chang, C.-P., and Wang, B. (2007). Impacts of El Niño and La Niña on the US climate during northern summer. J. Clim. 20, 2165–2177. doi: 10.1175/JCLI4118.1
Weigel, A., Liniger, M., and Appenzeller, C. (2007). The discrete Brier and ranked probability skill scores. Mon. Wea. Rev. 135, 118–124. doi: 10.1175/MWR3280.1
Wheeler, M., and Hendon, H. (2004). An all-season real-time multivariate MJO index: development of an index for monitoring and prediction. Mon. Wea. Rev. 132, 1917–1932. doi: 10.1175/1520-0493(2004)132<1917:AARMMI>2.0.CO;2
Wilks, D. (2002). Smoothing forecast ensembles with fitted probability distributions. Q. J. R. Meteor. Soc. 128, 2821–2836. doi: 10.1256/qj.01.215
Wilks, D. (2009). Extending logistic regression to provide full-probability-distribution MOS forecasts. Meteor. Appl. 16, 361–368. doi: 10.1002/met.134
Wilks, D., and Hamill, T. (2007). Comparison of Ensemble MOS methods using GFS reforecasts. Mon. Wea. Rev. 135, 2379–2390. doi: 10.1175/MWR3402.1
World Meteorological Organization (2013). Sub-seasonal to Seasonal Prediction. Geneva: World Meteorological Organization.
Yasunari, T. (1979). Cloudiness fluctuations associated with the northern hemisphere summer monsoon. J. Meteor. Soc. Jpn. 57, 227–242. doi: 10.2151/jmsj1965.57.3_227
Yim, S.-Y., Wang, B., Liu, J., and Zhiwei, Y. (2014). A comparison of regional monsoon variability using monsoon indices. Clim. Dyn. 43, 1423–1437. doi: 10.1007/s00382-013-1956-9
Zhang, C. (2013). Madden Julian Oscillation: bridging weather and climate. Bul. Amer. Meteor. Soc. 94, 1849–1870. doi: 10.1175/BAMS-D-12-00026.1
Keywords: subseasonal to seasonal forecasting, forecast calibration, multi-model ensembling, Madden Julian oscillation, El Nino-Southern oscillation, North American monsoon, West African monsoon, Asian monsoon
Citation: Vigaud N, Robertson AW, Tippett MK and Acharya N (2017) Subseasonal Predictability of Boreal Summer Monsoon Rainfall from Ensemble Forecasts. Front. Environ. Sci. 5:67. doi: 10.3389/fenvs.2017.00067
Received: 06 June 2017; Accepted: 04 October 2017;
Published: 20 October 2017.
Edited by:
Raquel Nieto, University of Vigo, SpainReviewed by:
Rodrigo J. Bombardi, George Mason University, United StatesAna María Durán-Quesada, University of Costa Rica, Costa Rica
Lin Wang, Institute of Atmospheric Physics (CAS), China
Copyright © 2017 Vigaud, Robertson, Tippett and Acharya. This is an open-access article distributed under the terms of the Creative Commons Attribution License (CC BY). The use, distribution or reproduction in other forums is permitted, provided the original author(s) or licensor are credited and that the original publication in this journal is cited, in accordance with accepted academic practice. No use, distribution or reproduction is permitted which does not comply with these terms.
*Correspondence: Nicolas Vigaud, nicolas.vigaud@gmail.com