Enhancing the Energy Efficiency of Wastewater Treatment Plants through Co-digestion and Fuel Cell Systems
 Marta Gandiglio
 Andrea Lanzini
 Alicia Soto1
  Pierluigi Leone
- 1Energy Department, Politecnico di Torino, Torino, Italy
- 2Energiteknik. KTH, Stockholm, Sweden
- 3Department of Mechanical and Industrial Engineering, University of Illinois at Chicago, Chicago, IL, United States
The present work provides an overview of technological measures to increase the self-sufficiency of wastewater treatment plants (WWTPs), in particular for the largely diffused activated sludge-based WWTP. The operation of WWTPs entails a huge amount of electricity. Thermal energy is also required for pre-heating the sludge and sometimes exsiccation of the digested sludge. On the other hand, the entering organic matter contained in the wastewater is a source of energy. Organic matter is recovered as sludge, which is digested in large stirred tanks (anaerobic digester) to produce biogas. The onsite availability of biogas represents a great opportunity to cover a significant share of WWTP electricity and thermal demands. Especially, biogas can be efficiently converted into electrical energy (and heat) via high temperature fuel cell generators. The final part of this work will report a case study based on the use of sewage biogas into a solid oxide fuel cell. However, the efficient biogas conversion in combined heat and power (CHP) devices is not sufficient. Self-sufficiency requires a combination of efficient biogas conversion, the maximization the yield of biogas from the organic substrate, and the minimization of the thermal duty connected to the preheating of the sludge feeding the anaerobic digester (generally achieved with pre-thickeners). Finally, the co-digestion of the organic fraction of municipal solid waste (OFMSW) into digesters treating sludge from WWTPs represent an additional opportunity for increasing the biogas production of existing WWTPs, thus helping the transition toward self-sufficient plants.
Introduction
Different studies have focused on solutions to increase the energy efficiency of WWTPs. The goal of having WWTPs as net energy producers is an ambitious yet feasible one (Mccarty et al., 2011; Hao et al., 2015). The self-sufficiency target is deemed an achievable one since wastewater already contains two to four times the amount of energy required for the wastewater treatment process (Tchobanoglous et al., 2009; WERF, 20161).
Reducing energy consumption and increasing the efficiency of energy production are both required to have positive energy WWTPs. Measures to reach self-sufficient WWTPs include:
• Process optimization: installing smart meters (Longo et al., 2016), developing control systems for the optimal operation of aeration systems and water pumps (Daw et al., 2012; EPA, 2013). EPRI has estimated that, in wastewater facilities, 10–20% energy savings can be reached through a better control and optimization of the process (Copeland, 2014).
• Enhanced biogas yield: currently, anaerobic digestion (AD) biogas can only provide around 50% of the total energy consumption (Hao et al., 2015). However, sludge pre-treatments (WERF, 2016) can lead to an increase of the biomethane yield.
• Efficient on-site combined power and heat (CHP) generation: the use of fuel cell systems can increase further the on-site electricity generation, which is key to self-sufficiency.
• Co-digestion of sludge with food waste is also an interesting option to increase the overall biogas output.
The present work provides first a literature review on energy efficiency measures in WWTP, starting from the accounting of energy consumption among the different treatment stages and then analyzing possible methods toward self-sufficiency.
The second part focuses on a case study analysis: starting from available data on an existing large size WWTP located in Turin (IT), a proposal for energy efficiency improvement is presented, including sludge co-digestion with Organic Fraction of Municipal Solid Wastes (OFMSW) and the use of a high efficiency CHP generator, a Solid Oxide Fuel Cell (SOFC).
The study aims at providing a summary on available literature works on the wide topic of “energy efficiency in WWTPs,” by analyzing the current situation and energy consumption, and method to reach self-sufficiency. The main novelty is related to the coupling of a detailed review on energy efficiency in WWTP and measures to reach self-sufficiency with a real example of the possible effect on a real plant. The case study is thus a powerful example of application of the methods presented, and it is able to provide the reader with a clear view on a possible path for the final goal of reduction in energy consumption in the WWTP sector.
WWTPs Distribution in Europe
The European Environmental Agency (EEA) published a completed database of the existing WWTPs in Europe, divided by Country and with specific information for each plant (European Environment Agency, 2015). The analysis of its database is fundamental to provide the reader with a view on the WWTP sector, for what concerns size, entering load and capacity, distribution and other information. Even if the EEA has tried to collect information on the process layout by building the database, the columns are empty (information not available) for a large number of plants. For this reason, the analysis has been focused on three main data: location (EU country), entering load (PE), capacity (PE).
The database includes 30,044 rows (waste water treatment sites), but only 26,889 plants (89%) provide results on capacity and/or entering load. The presented analysis is related only to WWTP for which information is available. The mean entering load among all the WWTPs is 26,889 PE: this value, confirmed also by single countries (see Figures 1, 2), shows how the plants size distribution is composed of a huge number of small-medium size sites. If a minimum plant size for biogas production is considered (internal energy generation is crucial for the goal of self-sufficiency), only 5,141 plants (19.1%) are large enough to include anaerobic digestion. When talking about energy efficiency in WWTPs, it is fundamental to take into account the distribution and the size of the systems. As will be discussed later, if energy self-sufficiency is already feasible in medium and large size systems, a deeper discussion should be performed for small size plants, where specific energy consumption is higher and centralization not always possible because of geographical limitations.
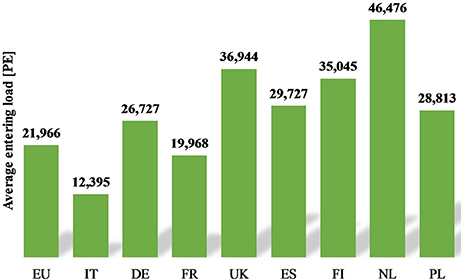
Figure 1. Average entering load per country (author own elaboration of data from European Environment Agency, 2015).
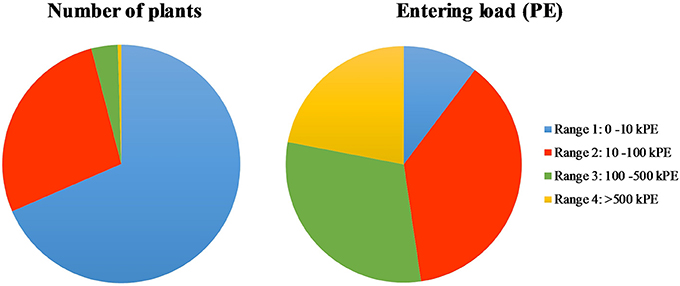
Figure 2. Distribution of WWTP in terms of number of sites and entering loads (author own elaboration of data from European Environment Agency, 2015).
Overall WWTP Layout
In Figure 3, the simplified layout of a typical activated sludge WWTP is shown. Entering raw wastewater is first treated to remove bulk solid parts and sands (preliminary treatments). Later, water is sent to the primary treatment stage, where primary sedimentation occurs. Aeration tanks and secondary sedimentation follow, being part of the so called “secondary treatment” which is usually pointed as the most energy intensive stage of a typical WWTP. Treated water is the recycled: it can be send to local rivers/seas, used for industry (e.g., fire system), for agricultural irrigation or green areas/fields watering. From the two sedimentation stages, a sludge flow is produced. Sludge is sent to a sludge treatment stage (which can be anaerobic digestion with biogas production) where it is stabilized and dried. Dried stabilized sludges are then exploited for agriculture fertilizers, cement plants or sent to landfills, depending on the local directive on sludge treatment and use. Sludge flow are classified into primary and secondary sludge, according to the water treatment from which they are generated. Primary sludge is produced by gravitational sedimentation and has a high organic matter content, easily biodegradable. Under optimal digestion conditions, methane yield from primary sludge can reach 315–400 Nm3/ton of organic dry matter. Secondary sludge is the result of the biological treatment of waste water and has a lower degradable percentage: for this reason, under optimal digestion conditions, methane yield is only 190–240 Nm3/ton of organic dry matter (Bachmann, 2015).
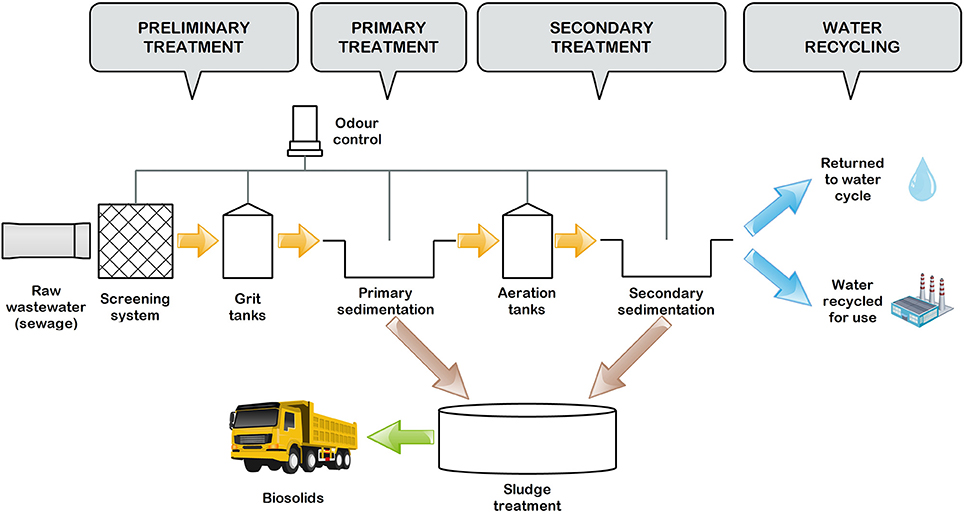
Figure 3. Overall layout of a WWTP.
Review on Methods to Increase the Energy Efficiency of WWTPs
WWTPs are usually ranked as one of the most important energy consumers managed by municipalities. The Energy-Water Nexus report, focused on Energy Use in the Water Sector in US (Copeland, 2014) mentions the high consumption of water production and treatment. Around 4–13% of US electricity generation is linked to water-related energy use, with peaks of 19% in California (Daw et al., 2012). The data is confirmed by the Water Environment & Reuse Foundation (WERF) report, where is mentioned that the 16,000 publicly owned US WWTP are consuming 1 to 4% of total energy production (Crawford and Sandino, 2010). Shen et al. also mentions that 3-4% of the national electrical demand goes for WWTP, corresponding to 30.2 billion kWh per year and more than 21 million metric tons of GHG emission (Shen et al., 2015). The US Electric Power Research Institute (EPRI) mentioned that WWTPs are accounting for 0.8% of total electrical consumption in the US (Electric Power Research Institute and Water Research Foundation, 2013), while WERF reports indicate 22 TWh of energy consumption in WWT sector (WERF, 2016).
In Europe, Eurostat declared that, in 2009, expenditure on wastewater management and treatment was around 0.60% of GDP (Molinos-Senante et al., 2014). Cao Ye Shi and Cao (2011) mentioned that around 1% of the electricity consumption of a country fell into WWTPs. Torregrossa et al. said that the total EU consumption by WWTPs is matching the total energy consumption of Serbia (Torregrossa et al., 2016).
In Europe, the quality of effluents from WWTPs is legislated by the EU Urban Wastewater Directive (91/271/EEC). The Directive mandates the protection of the environment from pollution coming from industries and sectors having a high organic load (Jonasson, 2007). Belloir et al. mentioned that WWT industry is the fourth largest energy intensive segment in UK, with an annual consumption of 7703 GWh/y, accounting for 1% of annual GHG emissions (Belloir et al., 2015).
The Ireland Sustainable Energy Authority (SEAI) has identified that 55–70% of energy consumed by local authorities is used for water services, equal to 105 kWh per capita (Awe et al., 2016).
The process engineering goal is “a diversion of as much organics, i.e., energy, from the aerobic liquid train to the anaerobic solids train. Compliance with nutrient removal requirements remains the overriding objective,” as written by Wett et al. (2007). More stringer future effluents requirements are expected in the future, together with optimization of operational costs. The challenge lies in balancing these two opposing interests.
WERF reports, together with other literature works, have underlined how the energy content potentially available in water is higher than standard WWTP energy consumption (WERF, 2016). However, through the conventional combination of aerobic water treatment coupled with anaerobic digestion, only a portion of the inlet energy is recovered (Mccarty et al., 2011). The US Environmental Protection Agency (EPA) also published in 2012–2014 guidelines and handbooks for energy efficiency and sustainability in water and wastewater facilities, where benefits, methods and ways to improve energy efficiency are presented (Environmental Protection Agency, 2012; EPA, 2014, 2013). In the following sections, the authors show some examples of recent benchmarking studies and energy handbooks/manuals.
Benchmarking Studies
Benchmarking has been defined as the between indicators of plant performance and a certain number of existing plants. It is a way to start the procedure of energy optimization in WWTP. Austria has developed benchmarking activities since the late nineties, as discussed by Wett et al. (2007), while Molinos-Senante et al. (2014) have developed an entire analysis on the advantages of benchmarking activates in WWTPs. Comparative analysis allows to identify pros and cons of each WWTP and helps to save costs: recently a significant number of publications have focused on producing performance indicators for wastewater services using benchmarking procedures. The Enerwater EU project aims to “develop, validate and disseminate an innovative standard methodology for continuously assessing, labeling and improving the overall energy performance of WWTPs” (Enerwater EU project official website). The evaluation of the WWTPs economic performance is the starting point for identifying potential savings. Available benchmarking methodologies, from the work of Molinos-Senante et al. (2014), are:
- Partial indicators: the method consists in the “application of ratios between outputs and inputs.” (Molinos-Senante et al., 2014). The advantage is that the indicators are easy to calculate and interpret; as a drawback, these indicators fail to account for the relationships among the different factors.
- Total factor productivity: the method evaluates “the physical output produced by the use of a given quantity of inputs. Because WWTPs have multiple outputs and inputs, the ratio of the weighted sum of outputs with respect to the weighted sum of inputs is used to calculate the total factor productivity index” (Molinos-Senante et al., 2014).
- Statistical techniques: for example, Ordinary Least Squares (OLS), Corrected Ordinary Least Squares (COLS) models and Stochastic Frontier Analysis (SFA). These techniques require a lot of input data.
- Data Envelopment Analysis (DEA) methodology: a non-parametric technique for performing evaluations, which can manage different input and outputs (Molinos-Senante et al., 2014).
Benchmarking activities can be also classified into metric benchmarking and process benchmarking. Metric benchmarking is a quantitative comparative study that can be used between companies which are comparable and evaluation parameters are quality, environmental efforts, and costs for a defined time. Process benchmarking, on the other side, compares only specific processes inside a single facility (Jonasson, 2007).
Benchmarking activities are also performed by the Task Group of IWA (International Water Association): the work is currently led by the IWA Task Group for benchmarking of control strategies. A benchmark simulation model has been developed by the Task Group and is used for control strategies development for organic and nitrogen removal (Jonasson, 2007; IWA Task Group on Benchmarking of Control Strategies for Wastewater Treatment Plants, 2014). Furthermore, different benchmarking activities have been developed and are under development worldwide: from the Water and Sanitation Program-South Asia (WSP-SA), the Bavarian water conservation authority and the Swedish Water & Wastewater Association (SWWA).
Sustainability indicators for WWTP have been deeply discussed by Muga and Mihelcic (2008), where traditional economic, environmental and societal indicators are discussed. The work compares traditional mechanical WWTP with lagoon and terrestrial water treatments. Among the three options, mechanical WWTP are the most expensive and energy intensive but are also able to reach higher outlet water quality and require a lower area.
A typical result from benchmarking studies in WWTPs is the trend of electrical energy consumption as function of the entering load (as will be shown in Figure 5). From the aggregation of available data on existing plants, a set of points can be produced and a trend can be drawn. Other WWTPs can place their data (entering load and energy consumption) inside the graph and discover if their performance are below or above the trend for a certain country or geographical area. This trend could be also used to set limits and guidelines in national or international regulations. The electrical consumption can be analyzed not only as a unique value for the entire plant but can also include the share of consumptions the different plant processes: in this way, a more detailed plant analysis can be done.
Energy Handbooks/Manuals
An alternative to benchmarking activities is the development of energy manuals. Both Swiss ministry and North Rhine Westphalia developed best practice manuals for WWTP, in 1994 and 1999 respectively, related to energy efficiency, reduction in operational cost and GHG emissions. They include a manual in which energy consumption at traditional WWTPs is described and a clear-structured strategy for the implementation of energy optimization is provided (Wett et al., 2007). The process suggested for the WWTP optimization includes two stages: first, a screening phase, to understand the loads and the plant structure, followed by a short-term optimization measures, usually related to plant management, which do not require any investment. The second phase is a plan for medium and long-term plant optimization measures for energy optimization and includes a detailed techno-economic analysis of every single stage of the process. Thanks to these manuals and guidelines, different plants in EU have reached near self-sufficiency or complete self-sufficiency in the last decade. Paragraph 4.2.4 will analyze existing optimized plants.
The UK environment agency has released a report called “Transforming wastewater treatment to reduce carbon emissions,” outlining five key strategies: “Source control, Least-carbon end-of-pipe/process addition, Greater operational efficiencies, Redeveloping existing treatment processes and Renewable energy generation” (Sadler et al., 2009; Belloir et al., 2015).
The US Water Environment & Reuse Foundation has published different guidelines to reach net-zero energy water facilities (WERF). From their models and plant analysis, WERF researches concluded that 40% lower energy consumption can be reached only by the consistent use of best practices. Furthermore, they underlined the importance of savings in the blowers electricity consumption thanks to improved operation and maintenance procedures and exploitation of biogas in high efficiency CHP systems.
In the Netherlands, the foundation for applied water research has published in 2010 a roadmap for the WWTP of 2030 (STOWA Foundation for applied water research, 2010). The document focuses on the concept of “NEW” plants, which should move from the waste approach to the resource approach, by managing the three available basic resources: Nutrients, Energy and Water (NEW). The roadmap is developed by assumptions on the features of future WWTPs, in relation to demographic, economic, social, technological, ecological and environmental policy directions and impacts on the WWTP sector. Effluent quality, costs and energy neutrality have been detected as the factors with the highest priority.
Energy Consumption in WWTPs
This section present a general overview on energy consumption in WWTP and the role of the high energy intensive sections of the process (e.g., secondary treatment/ biological process). After discussing current and target plant consumptions, a list of possible ways to improve the plant energy efficiency and reach self-sufficiency is presented, with a review on the available literature works. The last section is about real examples of best practices in terms of energy efficiency in WWTPs.
Electricity is the main energy source required in WWTPs, accounting for around 25–50% of the operating costs of traditional activated sludge plants (Foladori et al., 2015). This data is confirmed in the work of Panepinto et al. (2016), which mentions that in a typical WWTP 25–40% of operating costs is due to electricity consumption. This value varies in the range of approximately 0.3–2.1 kWh/m3 of treated wastewater. EPRI report also mentions a similar value: energy consumption ranges from 0.413 to 0.87 kWh/m3 depending on the plant size (Electric Power Research Institute and Water Research Foundation, 2013). The share of energy into operating costs is also shown in the work of Husmann (2009), where energy is the higher slice in the OPEX yearly value, accounting for around 35%, followed by chemicals, disposal, maintenance and personnel. The report pointed out that most impacting elements in the energy consumption of a conventional WWTP are the aeration of mixed liquor (55–70%), primary and secondary settling with sludge pumping (15.6%) and sludge dewatering (7%). These data are also confirmed by WERF report (Crawford and Sandino, 2010). Shen et al. (2015), while analyzing the US WWTP sector, underlined that electric energy accounts for over than 30% of the total operation and maintenance cost and up to 80% of the GHG emission. The EPRI report suggest again that 52% of WWTP energy consumption is used for aeration, 12% for pumping and 30% for bio-solids processing, thus confirming previous data (Electric Power Research Institute and Water Research Foundation, 2013).
When mentioning energy consumption, the present work is referring to the overall electrical energy consumption. In WWTPs, not only electrical energy is consumed but also chemical (fuel) energy, labor energy and thermal energy. On the other hand, as discussed by Belloir et al. (2015), the largest portion of the overall annual primary energy consumption is electrical.
Thermal energy can be also not negligible, especially for non-optimized plants. But a large portion of thermal energy is trapped inside the inlet wastewater to the plant, and is usually unexploited. Especially in cold climates, this temperature difference could be used as a heat source for a heat pump in order to recover extra thermal energy (WERF, 2014b, 2016). Furthermore, digested sludge exiting from anaerobic digester is usually found at 36°C (mesophilic digester). This could be another available heat source, but it is commonly not included in the sludge dewatering process. In many available WERF reports it is mentioned that wastewater contains nearly 5–10 times the amount of energy needed for the WWT process (1.93 kWh/m3 energy content with 500 mg/l COD, while typical energy consumptions ranges from 0.3 to 0.8 kWh/m3, Hao et al., 2015). In particular, 90% of this energy is thermal (due to the water heat capacity), 20% chemical (express by the COD) and less than 1% hydraulic (potential and kinetic) (WERF, 2014b, 2016). This means that, if properly recovered, this energy could eliminate WWTP net consumption and generate an extra production. Anyway, the comparison between the energy contained in the inlet waste water and the plant energy consumption should also consider the conversion efficiency between the different energy forms: the amount of inlet energy which could be recovered in terms of useful electrical (or thermal) energy is high but currently unquantifiable and reliant on the energy conversion processes.
WERF estimated that US could make the 100 largest WWTP facilities (which are 17% of the total WWTP energy consumption) energy neutral by investing around 4.8 billion $ but saving 41 million barrels of oil and avoiding 18 million tons of CO2.
Chemical energy contained in WWTP can be partially recovered by means of sludge anaerobic digestion, where biogas is produced and can be exploited for electricity and/or heat production. Thermal energy recovery is more challenging instead because of the low-grade heat available in the inlet wastewater, which is difficult to be captured due to poor efficiency at the low temperatures and the risk for inlet wastewater to foul heat exchangers. For what concerning hydraulic energy, although the low energy content in wastewater, the technology to convert this into electrical energy (via turbines or kinetic devices) is well known, with an efficiency up to 90%.
Different works are available in literature on energy audit, energy benchmarking and energy analysis of WWTPs. Results are summarized in Table 1 and discussed below. In the table, energy consumption is expressed in kWh per PE or kWh per cubic meter. The conversion among the values is not performed since this requires the knowledge of the organic load in the entering water and the PE definition according to the area of the world. For this reason, results are provided in their current form as found in literature.
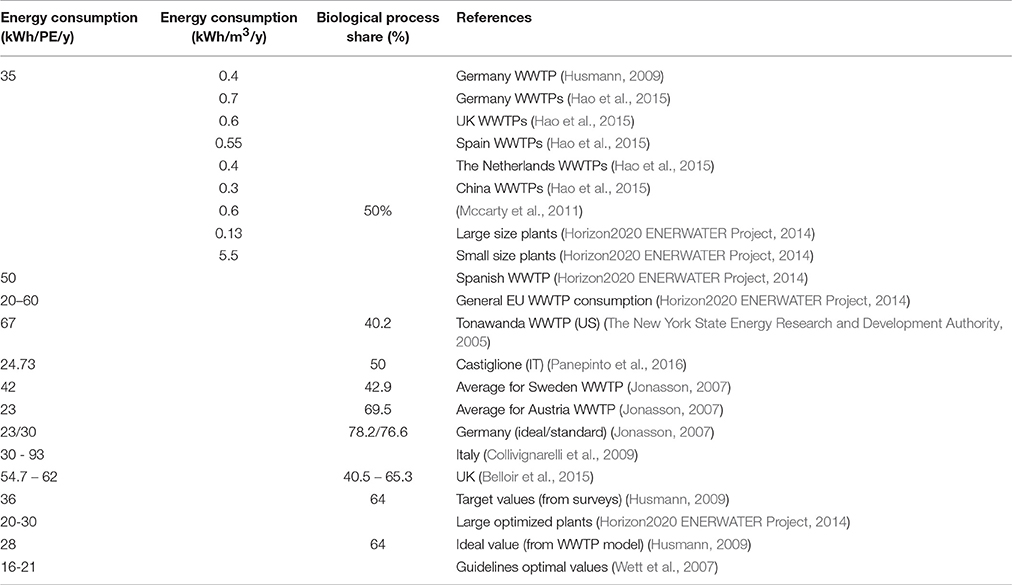
Table 1. Comparison of specific energy consumption data and biological process influence for different sources.
Chinese WWTPs generally have a lower energy consumption (~0.3 kWh/m3/y, see Table 1) with respect to EU and US plants: this is related, when consumption is expressed per cubic meter of waste water, to the low COD of Chinese wastewater, usually around 300 mg/L against 500–800 mg/L of other countries. The low organic content means a low electrical consumption but also a more difficult path to reach the carbon neutrality (Hao et al., 2015).
Presented values for Sweden, Austria, and Germany (between 23 and 42 kWh/PE/y from Jonasson, 2007, see Table 1) are related to large size systems (>50,000 PE). Tonawanda WWTP (67 kWh/PE/y) is also a medium large plant and serves around 200,000 PE (calculated from the data on the entering load and a PE definition of 60 g BOD per day according to Directive 91/271/EEC).
Foladori et al. (2015), on the other side, have analyzed the energy consumption of five small WWTPs, with an entering load <10,000 PE, from 582 to 9,727 PE. Results are analyzed after an energy audit period of two years in the five plants: the processes to which is related the higher energy consumption are oxidation/ aeration, recirculation of settled sludge and aerobic stabilization. Inefficiencies related to blowers were solved by moving from a continuous to an intermittent operating regime, which enable the plant to obtain the same useful effect while strongly reducing energy consumption.
Data referred to the UK WWTPS (Table 1), are two values derived by the analysis of two sites (Belloir et al., 2015). This work showed how sites with similar energy consumption rate and similar shares, can require different optimization approaches.
Thanks to the WERF foundation, many data are also available for US WWTPs. One of the available report mentions that more than half of energy consumption is linked to aeration process (54.1%), confirming data shown in Table 1 (Crawford and Sandino, 2010). Furthermore, 14.3% of energy consumption is related to pumping systems and another 14.2% to anaerobic digestion mixing.
In Italy, a detailed energy balance has been performed for the Castiglione WWTP (Turin, IT). The same plant will be the one considered for the case study (section Co-digestion Case Study) of the presented work. The plant is serving 2.7 million PE and shows an energy request of 66.78 GWh/y of electricity, of which about 50% from aeration in oxidation tanks, and 49.15 GWh/t of thermal energy, of which 93% for the sludge line (Table 1).
Based on the macroscale analysis, the EPRI report for the US approximates that a realistic achievable potential for water and wastewater industry by 2030 is approximately 8% of baseline (Electric Power Research Institute and Water Research Foundation, 2013). The data is confirmed by Longo et al, where the overall energy savings from WWTP operational optimization and technology improvements is estimated between 5 and 30% (Longo et al., 2016).
In Europe, an ongoing Horizon 2020 project named Enerwater, is trying to develop a standard approach to evaluate WWTPs (Enerwater EU project official website2; Longo et al., 2016). Starting from an initial sample of 610 WWTPs, the project has then focused on 388 plants between US, EU and Asia, which have been analyzed and compared. As described above, energy consumption can be expressed as function of the influent flow rate, person equivalent and COD removed. In the work of Longo et al. (2016), Enerwater members have listed all available benchmarking analyses on WWTPS, underlining advantages and criticalities of each study. The final output is a trend able to correlate the PE served by the WWTP and the energy consumption in terms of kWh per kg of COD removed. The trend is clear: energy consumption is exponentially reducing when moving from small to larger plants, as discussed before, and an asymptotic value of around 0.5 kWh/kgCOD removed seems to be detectable. Data are also grouped by country and type of technology, but there is not a visible trend based on those indexes. From the analysis of the influence of different plant section, it is confirmed that generally for medium to large plants, the treatment sections characterized by higher energy consumption are biological oxidation, lifts (pumping and sludge recirculation) and generally mechanical dewatering of sludge and/or aerobic sludge digestion if present.
Criticalities
One critical issue in the analysis of the energy consumption is related to the size of the system and the effluent requirements in terms of purification. The unit power consumption decreases asymptotically as the plant size increases, and increases as effluent requirements becomes more stringent. In the work of Awe et al. (2016), it is mentioned that a 4,000 m3/d WWTP consumes 0.591 kWh/m3, while a 378,500 m3/d plant consumes 0.272 kWh/m3. Furthermore, if advanced nitrification is performed in the smallest site, energy consumption increases from 0.591 to 0.780 kWh/m3. This is confirmed also by Table 1, where data referred to the Italian small WWTPs show a higher specific energy consumption. Panepinto et al. (2016) have also underlined this criticality, even underlining that the effect of the size is not linear. As can be seen in Table 2, quite low consumption rates (20–25%) are related to large systems, and are already quite close to the optimal values suggested by the guidelines available (see the work from Wett et al., 2007). On the other hand, energy consumption increases from 25 to more than 60% in other analyzed plants, not always “small” in terms of size.
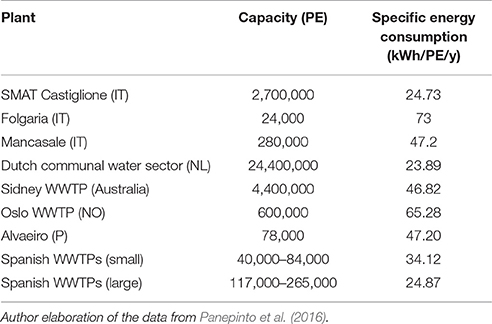
Table 2. Analysis of WWTP energy consumption in relation with the plant capacity.
The analysis of small WWTPs is justified by the high number of existing micro and small plants: in EU, according to the EEA maps on existing urban WWTPs (European Environment Agency, 2015), the largest group of plants, in almost all countries, is below 50,000 PE and the average entering load per plant in EU is 21,966 PE. However, as mentioned above, small size plants can show higher energy costs and different share among the processes (Foladori et al., 2015).
The link generally seen between nominal capacity (PE) and specific electrical consumption is also confirmed by Figure 4, where state-of-the-art electrical consumption is shown as function of the plant capacity and decrease from more than 60 kWh/PE/y for small WWTPs (<10,000 PE) to less than 45 kWh/PE/y for larger systems (>100,000 PE). In the Enerwater project, link between PE/ inlet flow rate and specific energy consumption has been analyzed for hundreds of EU plants (see Figure 5): small plants seem to have a very different behavior in terms of energy consumption, while the trend reach asymptotically a stable value when the size reaches values around 100,000 PE.
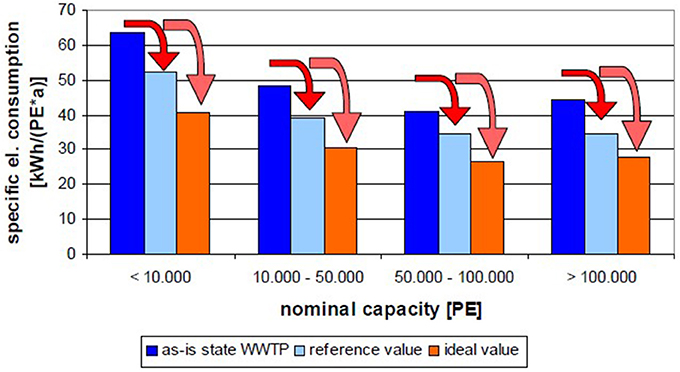
Figure 4. Average results of all executed studies from the work of Husmann (2009).
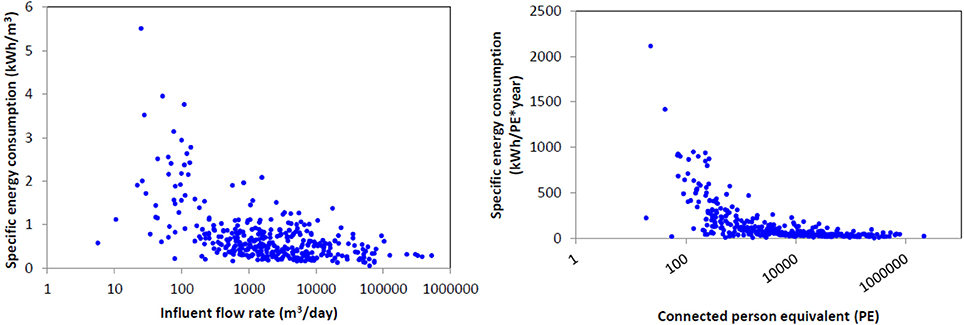
Figure 5. Correlation between PE/ inlet flow rate and specific energy consumption (Horizon2020 ENERWATER Project, 2014).
This is also confirmed by a similar study by Goldstein and Smith (2002) where inlet water flow rate is shown in relation to specific electrical consumption. Despite the water treatment process analyzed (trickling filters, activated sludge, advanced treatments), the electrical consumption is always reducing when plant size is increasing.
Nevertheless, in all the cases WWTPs show room for plant optimization and reduction in energy consumption, despite their size.
Another criticality which could lead to wrong discussions in the comparison among different plant is the PE definition used for the calculation of the specific energy consumption. Most of the EU WWTPs are oversized and the plant capacity (in PE or entering load/water) can differ from served PE. In the work from Foladori et al. (2015), design capacity for the five analyzed small plants was around the double with respect to the served population. On a EU basis, according to the EEA database values (European Environment Agency, 2015), the average ratio among served PE and design capacity is higher than 80%. Furthermore, when WWTPs are operating at a entering load lower than their actual capacity, the specific energy consumption starts to increase, as shown in Deines (2015).
Target/Ideal Energy Consumptions
Wett et al. (2007) report target values for WWTP optimization in terms of electricity consumption (20–25 kWh/PE/y for the whole process and 16–21 kWh/PE/y for the biological process): a specific biogas yield (>475 l/kg volatile dry solid entering in the anaerobic digester) and a self-sufficiency rate (electric energy 90%, thermal energy 99%). This optimal view is not 100% self-sufficiency but it is close to the final goal. In this work, target and ideal energy consumption values are also reported. Table 1 shows, in the last rows, target energy consumption data from guidelines, Enerwater project and models.
Process Optimization
Opportunities for efficiency improvement in WWTP exist in numerous categories as upgrading to more efficient apparatus, improving energy and plant management and energy generation on-site. On the contrary, barriers are found in terms of capital costs and reluctance to change well-known practices (Copeland, 2014).
The energy content of wastewater is includes the heat and the organic constituents found in the inlet wastewater (Tchobanoglous et al., 2009). The chemical energy content of wastewater is around 13 MJ/kg COD, while heat energy is 41.9 MJ/10°C m3 and is usually 2–4 times higher than the plant energy request, data confirmed also by WERF (2014b).
With traditional existing WWTPs, not optimized, around 25–50% of the energy consumption can be covered by internal energy generation (Mccarty et al., 2011). Further improvements are indeed required to reach self-sufficiency.
As already mentioned, energy efficiency of WWTPs can be also increased by means of thermal recovery, untapped in the inlet wastewater (influent) and in sludge exiting from the anaerobic digester. In Stockholm (SW), for example, a WWTP with a maximum capacity of 450,000 m3/d generates about 597,000 MWh of low-temperature heat using 199,000 MWh electricity through heat pumps ((ESMAP), 2012).
Wett et al. (2007) presented an interesting overview on the concept of self-sufficiency in WWTP systems. The work analyzed Central EU initiatives for operational optimizations, which lead to an average potential for energy saving of 30–50% for existing utilities. The well-known Strass WWTP (Austria), the first plant able to reach self-sufficiency (and currently shows a +8% electricity production, sold to the grid) is also discussed. Among the different available pathways to reach the goal of self-sufficiency, the authors mention two-stage biological WWT, on-line control of intermittent aeration for enhanced nitrogen removal, CHP plants and de-ammonification.
Most common energy intensive processes in WWTP are:
1. Aeration systems (where oxygen is provided for aerobic biological treatment by means of blowers). This energy use is strongly influenced by population of aerobic bacteria, influent loading, effluent quality, process type, size, and age of the treatment plant.
2. Mechanical pumping (required to transfer wastewater within the plant). This is usually related to friction in channels and pipes and to inefficiencies in pumps and motors.
This two processes will be discussed below.
Secondary Biological Treatment (Aeration)
Energy consumption for aeration process is generally between 0.18 and 0.8 kWh/m3. As mentioned by Longo et al. (2016), “aeration is an essential process in the majority of WWTPs and accounts for the largest fraction of plant energy costs, ranging from 45 to 75% of the plant energy expenditure.”
Jonasson (2007) mentioned that the biological process normally accounts for 50–80% of the total electrical energy consumption. According to this study, only 9% of the used electrical energy in WWTP in Sweden was produced by the plant itself. The same document also analyzed Austrian WWTPs: here, almost 70% of energy consumption is related to secondary treatment (mechanical and biological). Table 1, together with many literature sources (Awe et al., 2016) confirms the high share of the biological process in the plant energy consumption. The high share of activated sludge process aeration in energy consumption is also confirmed by WERF reports, where 60% is mentioned (WERF, 2016).
Panepinto et al. (2016) analyzed the SMAT Castiglione WWTP, the fifth largest WWTP in Europe with an installed capacity of 2,700,000 PE. The plant current energy consumption is not tremendously high, especially if compared to other plants (see Table 2), but the authors have identified many opportunities for energy saving. About 25% of energy saving could be reached thanks to optimization of primary settling efficiency by means of coagulants, 20–36% with aeration in oxidation tanks controlled with automatized control of Dissolved Oxygen (DO) and Sludge Retention Time (SRT) and 64% with Optimization of dissolved air flotation in to solids thickening.
The aeration system requires more energy than any other process, but it also shows the highest potential for energy savings. To decrease the aerobic treatment of biological sludge, COD reduction needs to be as high as possible, while retention time must be as low as possible. Because of the variable inlet wastewater, oxygen addition in the aeration process must be controlled and adjusted with feedbacks from on-line measurements. Replacement of old aeration systems with new and more efficient aeration machines is another key element for energy saving.
Aeration blower and filter blower modifications were suggested as key actions for WWTPs self-sufficiency already in 1998 by NYSERDA in their analysis of six existing WWTPs (The New York State Energy Research and Development Authority, 1998). Blowers are usually operated continuously 24/7 and relief valves are often opened when air is not required. A partial and intermittent operation of blowers would guarantee the same effect with a reduced energy consumption. Such modifications have not a high impact in terms of treatment process, efficiency, and costs.
A dynamic model for the optimization of the aeration process is also presented by Fikar et al. (2005). The author built a model able to determine the optimal aeration strategy for small-size activated sludge WWTPs, which could then be used in existing WWTP control system to minimize energy consumption.
The NETL report on strategies for WWTPs mentioned that aeration and oxidation basins, which accounts for 77.9% of energy consumption, represent the plant sections in which the highest saving could be obtained. In particular, 90% saving can be generated by turning off mixers when aerators operate (Daw et al., 2012).
Pumps
Other important consumers in WWTPs are pumps (18.9%) (Daw et al., 2012). From the NYSERDA report, 40.18% of the Tonawanda WWTP (US) is related to secondary treatment, 11.32% to heating and ventilation, 9.19% to pumping and the rest to other processes (The New York State Energy Research and Development Authority, 2005). Pumps elevation differences because of different geographical location could also generate higher electricity consumption.
Pumps are large energy consumers in WWTPs and the differences in terms of energy efficiency between pumps are important (Awe et al., 2016). Awe et al. (2016) mentioned that “Variable Frequency Drives (VFDs) can be used to vary the speed of pump to match the flow conditions and affinity laws for centrifugal pumps suggest that even a small reduction in motor speed can reduce pump energy by as much as 50%.”
Others
Other WWTP sections where energy consumption could be reduced thanks to new processes and components upgrading are:
• Primary treatment. Improved primary treatment increases the volatile solids content of wastewater solids removed prior to biological treatment and available for energy recovery such as through anaerobic digestion (WERF, 2016).
• Secondary treatment. Besides a more efficient management of the aeration line coupled with more efficient and new blowers, secondary treatment could be also removed and integrated in a unique step with the anaerobic digestion. Anaerobic treatment of raw wastewater is currently under research and would lead to a direct conversion for wastewater organic material to biogas (Husmann, 2009; WERF, 2016).
• Chemicals. The main contribution in chemicals consumption is the use of carbon for the denitrification process. Furthermore, if a WWTP presents chemical phosphorus removal process, the costs for metal salts for the chemical flocculation process are high (Jonasson, 2007).
• As already mentioned, WWTP self-sufficiency can be reached thanks to technology upgrading but this change should be coupled with the development of a highly educated and well-paid workforce, a high level of plant automation and use of advanced process analysis tools (WERF, 2010).
Improvements in Biogas Productivity
Biogas production
Anaerobic digestion is used to treat (and convert) primary and secondary sludge produced by the aerobic treatments (Seadi et al., 2012). The general process consists of sludge thickening, digesting, further stabilizing and disposal (Hanjie, 2010).
Around 30% of a WWTP's operating costs is used for sludge treatments (Shen et al., 2015). The Enerwater project also confirmed that the energy consumed at different stages of treatment and final disposal of sludge may represent a major fraction of the overall electricity balance for a plant (Longo et al., 2016).
The WERF report for North America WWTP states that anaerobic digestion can recover approximatively 30–40% of the overall current energy consumption through a CHP system (Crawford and Sandino, 2010). However, according to Shen et al. (2015), less than 10% of WWTPs in the US are producing biogas for energy production. Even if 48% of the total wastewater flow in the US is treated with AD, most of the biogas is flared. WERF factsheet indeed reports that the “advancement of under-utilized anaerobic digestion with the recovery and use of biogas for heat, energy or vehicle fuels” as one of three key pillars for energy efficiency in WWTP, together with “develop viable low energy treatment alternatives to activated sludge secondary processes” and “focus further research on sustainable alternatives for renewable energy from wastewater sources” (WERF, 2016). The available chemical energy in wastewater (accounting for 20% of total wastewater energy) can thus partially be recovered by means of anaerobic digestion.
According to Jonasson (2007), in Sweden about 35% of the biogas from WWTPs is used for heat production, 26% for electricity generation, 14% for vehicle fuel, 12% sent in local gas networks and 13% torching.
Biogas production in WWTPs is usually performed in medium and large size systems. Shen et al. (2015) mentioned a minimum size for AD production of 5 MGD (equal to 22,730 m3/day of influent), but they also detect 96 plants in US which are performing AD at smaller sizes, with an average flow lower than 1 MGD (4,546 m3/day). A typical specific biogas production from sewage sludge, from the work of Bachmann (2015), is 18–26 l of biogas/PE/day.
Sludge pre-treatments
The WERF energy factsheet mentions several new technologies that can enhance the digestibility of solids by breaking open the bacterial cells: “thermal hydrolysis, mechanical disintegration, and electrical pulse treatment” (WERF, 2016). According to WERF, solids pretreatment has the potential to more than double the readily biodegradable fraction, resulting in a 30–60% increase in biogas production compared to anaerobic digesters digestion without pretreatment.
The International Energy Agency published a dedicated report on feedstock pretreatments (Montgomery and Bochmann, 2014). The authors mention that “some substrates can be very slow to break down because they contain chemicals that inhibit the growth and activity of the microorganisms, they create physical problems like floating, foaming or clumping, and block impellors and pipes in biogas plants or their molecular structure is poorly accessible to microorganisms and their enzymes. In relation to the third point, various pretreatment technologies have been developed in recent years to increase the availability for AD of sugars and other small molecules in biogas substrates, particularly in lignocellulosic material. These pretreatment technologies aim to make AD faster, potentially increase biogas yield, make use of new and/or locally available substrates, and prevent processing problems such as high electricity requirements for mixing or the formation of floating layers” (Montgomery and Bochmann, 2014). Pretreatments techniques are divided into physical (mechanical, thermal, ultrasound and electrochemical), chemical (alkali, acid, and oxidative), biological (microbiological and enzymatic) and combined (steam explosion, extrusion and thermochemical). A similar review on sludge pre-treatments able to increase biogas production is found in the work of Hanjie (2010).
In the work of Awe et al. (2016), a Cambi Thermal Hydrolysis Process (THP) is analyzed, as installed in the Ringsend WWTP (Dublin, IR). The author mentions that the THP system key advantage is the improvement of volatile solids destruction, and hence improved biogas yield at low retention times in subsequent mesophilic anaerobic digestion. Biogas yields at Ringsend WWTP have remained relatively constant with the yearly average of 410 m3/t DS (Dry Solid). Thanks to a CHP system, the plant is now able to cover 50% of electrical and thermal loads.
Anaerobic Digestion Energy Efficiency
Anaerobic treatments and digestion are also linked with a potentially high specific energy consumption. The anaerobic treatment processes need mixers to keep the sludge in suspension. For maximizing energy efficiency it is fundamental to make the mixers and the basin volume fit together. Furthermore, the energy consumption could be reduced by means of online control systems (for example, by turning off the mixers for a period without affecting the treatment process—intermittent mixing—the electrical energy usage will decrease) (Jonasson, 2007). In the NYSERDA 1998 report the authors were already mentioning as a potential improvement the digester mixing systems (The New York State Energy Research and Development Authority, 1998).
Ninety percent (90%) energy saving could be reached in the huge Castiglione WWTP (IT), thanks to mixing optimization in anaerobic digesters, 15% with one-stage mesophilic anaerobic digestion with dual fuel CHP engine and 80–88% with sludge heating and dewatering (Panepinto et al., 2016). In this analysis, a decisive contribute in the improvement of energy efficiency of a WWTP is associated with the optimization of the anaerobic digestion.
Decreasing sludge volume always decreases the energy usage. Dewatered sludge gives a lower sludge volume and it is therefore less energy consuming to pump than hydrated sludge. High sludge content will also lead to energy savings in further treatment steps, like sludge combustion and drying. Jonasson (2007) mentioned that a reduction in TS of 1% would lead, in Sweden, to an energy saving of 18,000 € per year. Furthermore, increasing of 1°C sludge inlet temperature to the digester (in a defined working range) generates a yearly saving of 24,000 €. In the work of Bachmann (2015), an optimal dry solids content of 7% is proposed in the dewatering phase. The sludge can also be pre-treated by disintegration technologies for enhancing gas production yield.
Digested sludge treatment and disposal are also key topics in the current discussion on WWTP energy and environmental performance. Use as agricultural fertilizer is not allowed in all EU countries and sludge disposal can be expensive when a proper final use is not detected. Different literature works have analyzed this topic, from the environmental, energetic and legislative point of view (Fytili and Zabaniotou, 2008; Seadi et al., 2012).
High Efficiency CHP Generation
Energy production on-site
In this work, sludge is considered to undergo an anaerobic digestion process, without taking into account other options (incineration, gasification, pyrolysis, oxidation, hydrothermal treatments, Tyagi and Lo, 2013). In fact, anaerobic digestion is the process having the highest energy recovery compared to the positive effect on sludge stabilization. The main energy contributor in WWTPs is the biogas produced in the digester, but biogas production can also become the main source of GHG emissions when it is not properly managed. Consequently, efficient biogas production and utilization can significantly decrease energy consumption and carbon footprint of WWTPs (Jonasson, 2007).
Shen et al. (2015) analyzed the utilization of biogas in US WWTP: more than 55% of the plants do not use biogas for energy production (biogas is simply flared), for 21.8% of the plants the biogas use is unknown and the rest of the plant use biogas in ICEs, FCs, GTs, and others, with ICEs accounting for more than 12%. The use of biogas for energy production is higher in large plants, while decreases in small and medium size plants.
In Europe, the Task 37 of the International Energy Agency (IEA) has listed the available data on biogas production in WWTPs (Bachmann, 2015): countries for which some data were available, are listed in Table 3. Biogas production from WWTPs ranges from 7% (DE) to 49% (CH) of the country's total biogas production.
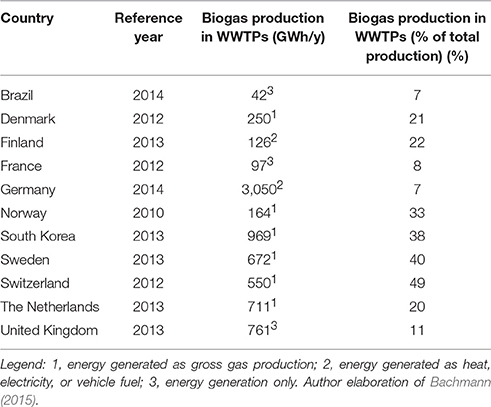
Table 3. Biogas production from WWTP in selected countries.
Bidart et al. (2014) have analyzed the potential for electricity production from WWTP in Chile, and compared to the natural gas production from WWTP, in case upgrading of biogas is performed (instead of traditional CHP). Results show that, in both scenarios, economic limits heavily penalize the energy potential available based on technical limits. Among the analyzed plants, 63% are competitive in terms of electricity production, and 58% in terms of biomethane production. Electricity production seems to be confirmed as the most interesting opportunity, in a wide range of system sizes, while biomethane production is suitable only for large plants (Bidart et al., 2014; Yentekakis and Goula, 2017).
In the work of Husmann (2009), the improvement of WWTPs from status quo to target to ideal, is related to an improvement in the specific gas production and specific gas reuse. In particular, specific gas production should increase from 370 to 450 to 475 l biogas/ kg SS, while gas reuse should move from 56 to 98 to 99%. Biogas production and optimal use is thus a key to reach the final goal of self-sufficiency.
Typical energy-related data on anaerobic digestion are (Bachmann, 2015):
• Electric energy generated: 10–20 kWh/PE/y
• Electric energy required for AD: 1–2.5 kWh/PE/y
• Electric energy for sludge dewatering: 0.5–3.5 kWh/PE/y
• Electric energy for sludge and digester heating: 8–16 kWh/PE/y
As can be seen, if electricity generated is compared to overall WWTPs plant consumption (Table 1), is clear that energy self-sufficiency could be reached only with a strong reduction in the plant specific energy consumption, coupled with an increase of the electric energy generated (by means of sludge pre-treatments, co-digestion, high efficiency CHP systems).
Solid oxide fuel cells as a best practice for biogas exploitation in CHP systems
According to available literature works, efficiency of biogas conversion by CHP ranges from 25 to 45% with traditional Internal Combustion Engines (ICEs) and Micro Gas Turbines (MGTs). In particular, when CHP size is lower than 100 kWe, electrical efficiency is in the range 25–35%; between 100 and 500 kWe the range is 35–40%; for large plants with sizes higher than 500 kWe, efficiency ranges from 38 to 45% (Bachmann, 2015).
The energy and economic sustainability of smaller plants is thus strongly influenced by the low efficiency of traditional CHP systems. In particular, energy autonomy seems more difficult for smaller plants: literature values show an energy coverage of 37% for plants smaller than 10,000 PE, and an energy autonomy between 68 and 100% for plants larger than 100,000 PE (Bachmann, 2015).
Fuel cells, in particular Solid Oxide Fuel Cells, can be seen as a potential alternative to traditional ICEs in WWTPs (Gandiglio et al., 2013; Tjaden et al., 2014; Curletti et al., 2015; D'Andrea et al., 2017; Rillo et al., 2017; Santarelli et al., 2017).
Main advantages related to SOFC co-generators are: very high efficiency (in the range 50–60%) not depending on the size (the efficiency is stable also at low sizes, e.g., tens of kWe), near-zero emissions to the environment (in terms of NOx, SOx, PM, VOC, etc.), possibility of modulating the power of the system in case of biogas shortages without the need of shutting down the machine.
On the other side, main technical barriers are linked with biogas contaminants management: biogas should be deeply cleaned from contaminants (sulfur, siloxanes, halogens, etc.) before being fed to the fuel cell, thus requiring a more sophisticate cleaning stage respect to traditional CHPs (Madi et al., 2015).
In the Collegno WWTP, located in the area of Turin, a 174 kWe SOFC fed by biogas produced on site will be installed in the framework of the DEMOSOFC European project (DEMOSOFC Project Official Website, 2016). The aim of the installation is the demonstration of the advantages of fuel cell based CHP system for biogas exploitation; in particular, the 174 kWe will be able to cover around 30% of the site electrical consumption (medium size WWTP, serving ~ 200,000 PE), which is now fully covered by electricity from the grid, since biogas is burned for heat-only production, or flared (Mehr et al., 2017). On the other side, challenges for industrial replication of the biogas-fed SOFC concept should also be faced and discussed, such as the deeper biogas cleaning respect to traditional ICEs. This topic is deeply discussed in the authors' previous works and others literature works (Papurello et al., 2014, 2015; Lanzini et al., 2017; Shiratori et al., 2017).
Sludge Co-digestion with Food Waste
In some cases, in addition to the reduction in resources expended, some wastewater facilities with anaerobic digesters can increase their production of biogas, which has the potential to generate heat, power, or electricity (WERF, 2014a). The WERF foundation published a dedicated report on co-digestion of solid products and sludges (WERF, 2014a). One of the main benefits related to co-digestion is the fully utilization of the existing assets (anaerobic digester). The NYSERDA 1998 report also underlined the possibility of reaching a 100% digester volume utilization by adding sludge from other WWTPs. Maximization of anaerobic digester utilization is in fact a key issue in most of existing WWTPs, because entering load is usually lower than plant capacity, as discussed in the previous section.
On the other hand, by adding different substrates to the digester (with different properties depending on the chosen co-feedstock) variations in the biogas generation rate, process stability, organic matter conversion are detected. Usually co-digestion is managed in order to maximize the digester utilization and the biogas production yield.
Table 4 shows biogas yields for typical co-digestion substrates. Biogas yield for sludge only is lower and could be enhanced thanks to co-digestion. Besides the list provided, co-digestion can be performed with glycerin from biodiesel production, airplane de-icing fluid waste, etc.
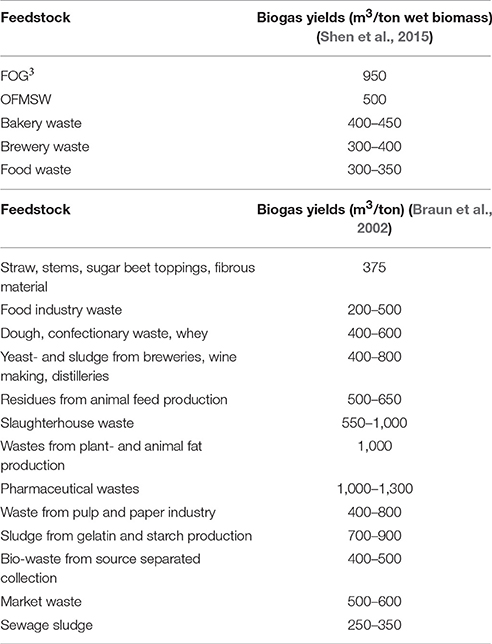
Table 4. Biogas yields for the most common co-digestion feedstock.
When co-digestion is performed, the final solid content in the inlet biomass should be also considered. Sludge anaerobic digestion is typically wet (maximum 15–20% solid content) and continuous stirred tank reactors and usually employed (feed is inserted in the reactor, which is continuously mixed, and at the same time an equal quantity of effluent is removed, De Mes et al., 2003). If the solid content increases over 30%, anaerobic digestion turns from wet to dry, and feeding/ mixing technologies should change accordingly. On one side high solid systems enable the reduction of the reactor size, require less process water and lower heating cots; on the other hand, mixing costs and feeding should be changed with respect to the wet conditions (De Mes et al., 2003).
Pre-treatment steps usually performed for all co-digestion feedstocks (for wet digestion processes) are: size reduction, removal of indigestible components and hygienization. In case of specific feedstocks (OFMSW, garden wastes, market wastes and some industrial wastes), extended pre-treatments might be required (chopping, sieving, metals removal, glass/sand/stones removal, homogenization) for wet digestion processes. For these substrates, dry digestion could also be a solution since material do not separate if solid content is kept higher than 25%. Some specific treatments (like hygienization) are required by law for potential pathogens-contaminated wastes. This process can be performed at three degrees of cleaning: sterilization, pasteurization and sanitation. In case of thermophilic digesters, these could be sometime considered equivalent to the thermal treatment (Braun et al., 2002).
Furthermore, co-digestion in WWTPs in subject to severe regulations in many countries and for this reason the legal scenario has to be studied carefully before scheduling the intervention (Bachmann, 2015).
From the point of view of the co-digestion feedstock supplier, co-digestion should be compared, in economic and environmental terms, to other alternatives for organic wastes exploitation as direct use as animal feed, direct use as soil conditioner/ fertilizer, upgrading to compost, upgrading to biogas, incineration (Braun et al., 2002). But this does not seems a problem. Co-digestion is in fact also interesting because of the high availability of organic substrates (Hickey and Ozbay, 2014; Vilarino et al., 2017). Kim et al. (2016) mentioned that that annual food waste in US could potentially generate the 0.12% of the total global electrical energy consumptions. Furthermore, anaerobic digestion of organic waste only could also generate criticalities in the process because of the low content in trace meals, excessive macro-nutrients, high C/N ratio and lipid content, and high variability of the composition. For this reason, the use in co-digestion with sewage sludge seems to be an optimal solution, especially in the circular economy framework.
In the already mentioned report from WERF (2014a), co-digestion was analyzed with six substrates: canola oil, restaurant grease, ethanol silage, cheese whey, chicken manure and biodiesel glycerin. Amount of co-digested feedstock was calculated to have a 20% COD increase respect to the sludge only. The different feedstock have been tested and compared to the thickened sludge only case study: in all the scenarios presented, biogas production was increased respect to the anaerobic digestion of sludge only. Better results are related to glycerin, grease and cheese whey, while chicken manure has a very reduced influence on the overall biogas production (because of the lower specific COD content respect to the other feedstocks). Glycerin and restaurant grease show, in the laboratory phase, an increase in biogas production from 35% (in the first 25 days) to 99% (in the second 25 days). On the others side, these substrates also show high viscosity, thus leading to possible criticalities in the pumping section and requirements for plant modifications.
In the work of Crawford and Sandino (2010), a series of case studies with novel energy optimization pathways and energy recovery technologies is shown. Among these, co-digestion with fats, oils and grease is suggested in an advanced thermophilic digester (called CBFT3). Thanks to this improvement, retention time (and consequently digester volume) can be reduced and gas production is increased of 50%. Forty percent of plant electrical consumption is now satisfied thanks to internal production in gas fed engines.
The WERF energy factsheet report also mentioned that energy recovery potential by means of AD with co-digestion is in the range 2–128%. Without co-digestion, the maximum energy recovery potential is only 60% (WERF, 2016). Co-digestion with FOG could lead to a biogas production 1.3 times higher respect to the standard process with sludge only.
In the same document, co-digestion with dairy manure is also suggested. Co-digestion seems to be related to three key drivers:
- Digesters are usually oversized. Addition of co-substrates can help to enhance gas and electricity production at low extra costs. The extra power produced may cover the energy needs of wastewater treatment at a reasonable cost (WERF, 2016).
- Co-digestion of manure and some organic wastes (i.e., cheese whey, vinegar waste) can offer better conditions for acidification and dilution, and thus improve digestibility.
- Agricultural biogas production from manure and other substrates alone (which has a relatively low gas yield) is economically not viable at current oil prices (WERF, 2016).
An example of WWTP with manure co-digestion is the: Inland Empire Utilities Agency (IEUA) Regional Plant 1 (RP-1), City of Ontario, California, US.
Shen et al. (2015) also confirmed advantages of co-digestion, by mentioning increase in biogas production (by balancing the C:N ratio and the biodegradability of sludge only digestion), extra revenues from biogas exploitation and development of a local and integrated waste-to-energy chain. The authors also mention that examples of co-digestion show how this practice could overcome significant economic challenges including higher methane yield, more efficient digester volume utilization and reduce bio-solids production. Sewage sludge usually shows low digestibility consequently AD performance could be limited with such a single feedstock. For this reason, as mentioned by Shen et al. (2015), “co-digestion of sludge with other organic wastes has received increasing attention in recent years, as WWTPs will potentially benefit from this practice.”
Typical co-substrate mixing rates in WWTP digesters are between 5 and 20% according to the work of Braun et al. (2002). Kim et al. (2016) also collected different works on co-digestion and analyzed the effect of the co-substrate percentage on the methane yield of the reactor. Unfortunately, there is not a clear correlation between co-digestion feedstock and methane yield among different works, because many other process parameters are influencing the biogas production rate.
According to the literature review, co-digestion will enhance the biogas production by 50–185% (sewage sludge co-digested with food waste), and 100–410% (sewage sludge co-digested with FOG; Awe et al., 2016). This data is also confirmed by the International Energy Agency report on co-digestion, where biogas productivity increase is in the range 40–200% (Braun et al., 2002). The same document also mention that plant electrical coverage could increase from 50% (when AD of sludge only is performed) to 80%.
On the other hand, despite the potential benefits, co-digestion may require new facilities for wastes pretreatment, extra gas-handling, and gas treatments. Opportunities and criticalities related to co-digestion are summarized in Table 5. As can be seen from the table, advantages are confirmed, especially by laboratory tests, but criticalities are also detected. This is also confirmed by Nghiem et al. (2017): in his recent work, the author mentions that, despite the rapid increase in the number of co-digestion studies at laboratory scale in the literature over the last couple of years, the number of pilot- and full-scale studies is still very limited.

Table 5. Opportunities and criticalities of sludge co-digestion.
Examples of Best Practices in WWTPs
Table 6 shows a list of best practices in WWTPs; the same examples are described in detail in the paragraph below.
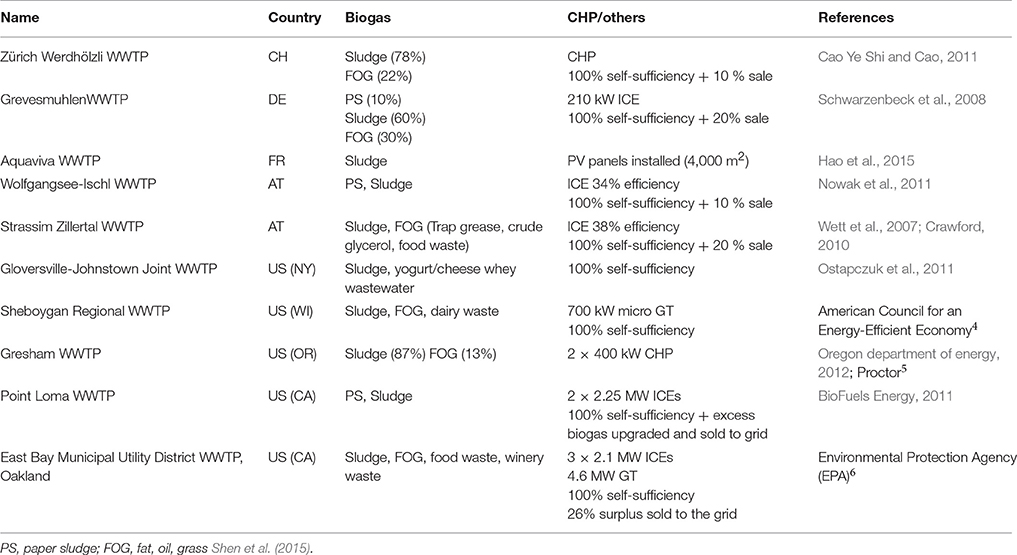
Table 6. List of current self-sufficient WWTPs.
An example of plant which has been fully analyzed from an energy point of view is the Town of Tonawanda WWTP in the US developed by (The New York State Energy Research and Development Authority, 2005). The analysis on the Tonawanda WWTP has suggested the installation of a centrifugal system for sludge dewatering, the replacement of a cryogenic system for oxygen production with a more innovative vacuum pressure swing adsorption, replacement of existing motor with high efficiency motors. The New York State Energy Research and Development Authority (NYSERDA) was analyzing energy efficiency in WWTPs already in 1998 when a work was published on the method to determine if process audit and electrical sub metering techniques are an effective practice of recognizing energy conservation chances at municipal WWTPs (The New York State Energy Research and Development Authority, 1998).
More than 65% of Swiss WWTPs have already experienced energy analysis, reaching an average energy cost reduction of 38%. Two-thirds of this cost reduction is related to the enhanced electricity production from biogas, one-third to “real” savings. The biological stage is the area in which major savings were reached (Wett et al., 2007).
Three hundred forty-four WWTPs in North Rhine Westphalia (Germany) have also experienced energy analysis. Results indicate that energy cost can be reduced by 50%. Austria also promoted benchmarking: all existing 950 WWTPs with a total of about 20 million design PE took part in a benchmarking process, which compares individual cost figures with overall national performance.
Here, the first self-sufficient Strass WWTP is found. The municipal WWTP offers a two stage biological treatment (high rate Bod removal followed by nitrification/denitrification) able to process loads varying from 60,000 to 250,000 PE weekly averages depending on tourist seasons (peaks are detected during winter season) (WERF, 2010). The percentage of energy self-sufficiency was progressively enhanced starting from 49% in 1996 to 108% in 2005. A big improvement in energy production was due to the installation of a new 8-cylinder CHP unit which provides 340 kW, in 2001. This high gas yield (26 L/PE) is converted into electrical energy with an average electrical efficiency of 38% (Wett et al., 2007). The plant focused on different pathways to reach self-sufficiency: reduction of chemical cost for sludge thickening (−50%), reduction in sludge dewatering cost (−33%), reduction in NH4 removal cost (−55%), reduction in consumption for side stream treatment, in particular for ammonia treatment (−44%), CHP efficiency (+21%, by installing a 40% efficiency ICE) (WERF, 2010). Here, air flow and aeration period for the secondary treatment are controlled by online ammonia measurement to reduce energy demand.
In the work of Husmann (2009), ongoing projects aiming at improving the energy efficiency of WWTPs are listed for different countries (Brazil, China, Colombia, France, Germany and Tunisia). Authors state a potential reduction in energy demand is in the range of 20–76%, with an average value of 42%.
Co-digestion Case Study
The following section aims at evaluating the possible effect of two energy efficiency actions on an existing large size plant, which is the SMAT Castiglione WWTP located in the North-west of Italy and serving the municipality of Torino (Italy). The plant is the fifth largest WWTP in Europe and is currently serving around 2.5 million P.E.; biogas is currently produced from the anaerobic digestion of sewage sludge and exploited in four large size ICEs, 1.4 MW electrical each (nominal size).
The proposed energy efficiency actions are:
(1) The use of co-digestion with local OFMSW, to increase the on-site biogas production;
(2) The installation of a high efficiency SOFC as CHP system for biogas energy valorization.
The current energy scenario at the Castiglione WWTP is shown in Table 7. There are six available anaerobic digesters (with a useful volume of 12,000 m3 each). Of these digesters, only five are usually in operation due to routine maintenance procedures. For this reason, all the analysis is based on five digesters, having an overall volume of 60,000 m3. Currently, digesters are fed by around 3,340 tons of sludge per day, with a total solid content of around 2 wt. % (TS). The produced biogas is 18,800 m3 per day, and feed ICEs. The on-site electrical and thermal demand coverages, including the production from a set of PV installed at the plant site, are 48.8 and 54.6%, respectively.
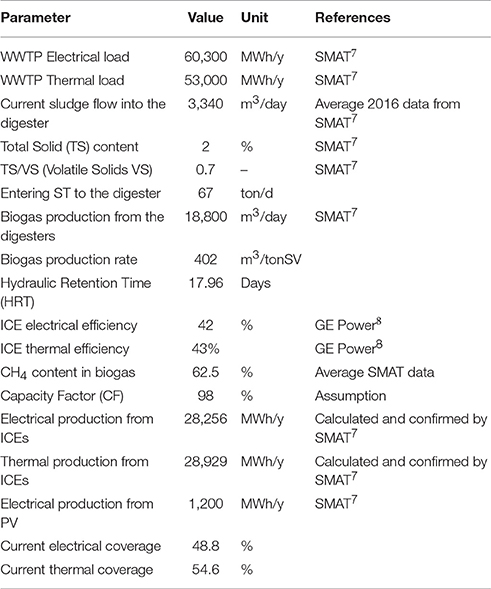
Table 7. Current scenario at SMAT Castiglione WWTP.
Starting from the presented scenario, the retrofit of the existing plant with a co-digestion system and a set of SOFC modules is considered. Below, details on the plant input data are presented.
Sludge Co-digestion with OFMSW
We assume that together with the currently available sewage sludge (SS) (from primary and biological treatments), the OFMSW collected in municipality of Torino is also available for co-digestion with sludge (Figure 6). Both achieved and feasible SS:OFMSW ratios have been then compared to other literature works to validate our initial assumption.
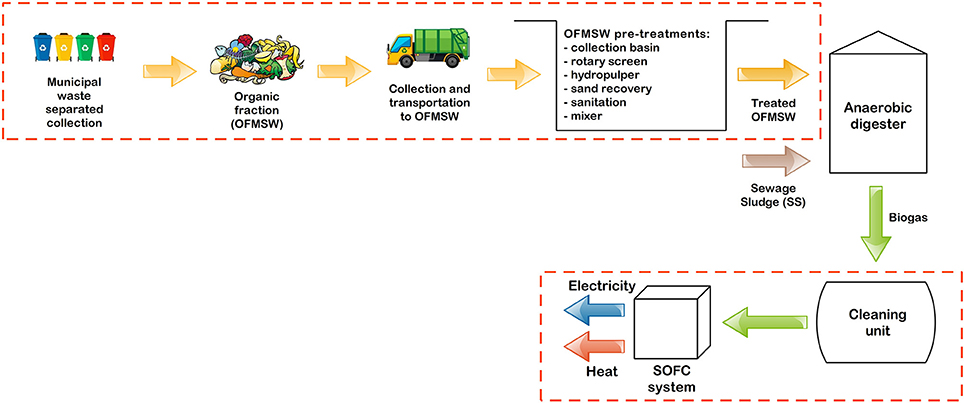
Figure 6. Proposed WWTP retrofitting for reaching energy self-sufficiency. Proposed actions are in red dashed boxes.
From the local authority for the protection and research on Environment (ISPRA), data are available on the separated waste collection (ISPRA, 2015). Especially, the organic fraction collected in the province of Torino is reviewed.
Starting from the Italian production of OFMSW from separated collection (6,071,500 tons OFMSW), and the number of Italian inhabitants, a specific production has been derived, equal to 99.86 kg OFMSW/capita/y. This datum (range 80–100 kg OFMSW/capita/y) is also found in the literature (Giacetti and Venturi, 2007).
Considering that municipal waste (MSW) generation per capita in Italy is around 500 kg/capita/y (Eurostat, 2017), OFMSW accounts then for around 20%. If only separated collection is considered, OFMSW share is between 30 and 40%.
Starting from the specific OFMSW production, the amount generated by the province of Turin can be determined, i.e., 230,477 tons of OFMSW are produced per year, with an average solid content (ST) of 8.8% (Bolzonella et al., 2005). The final solid content of the entering biomass (mixed sludge and OFMSW) is lower than 8.8% and is thus able to guarantee a wet anaerobic digestion with a continuous operation (as is performed currently). Higher solid contents would lead to dry digestion, which is usually performed in batch mode.
The Castiglione WWTP would be thus fed by a mixed feed of OFMSW (previously treated, mixed and homogenized) and sewage sludge. Biogas yield (in cubic meters of biogas produced per ton of VS entering the digester) has been derived from available data on WWTP for the current scenario (~400 m3/ton VS), while it has been taken from literature for the co-digestion scenario. In particular, different studies have been analyzed. The SS:OFMSW ratio is not the only parameter influencing the final production rate: temperature, volume of the digester, type of waste, dilution rate, and other parameters are strongly influencing the final productivity of the plant. Nonetheless, a direct relationship between ratio and performance is not always observed (see Table 8). An average and conservative value of 550 m3/ton VS has been chosen for this work.
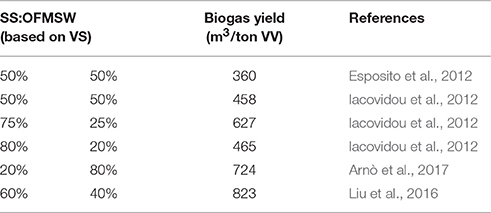
Table 8. Reference values for co-digestion productivity at different SS:OFMSW ratios.
For all the calculations, the VS/TS ratio has been assumed equal to 0.7 (taken from SMAT available data). Furthermore, a 10% reduction in the entering OFMSW has been accounted because of material losses in the pre-treatment stage which should be installed onsite (Nghiem et al., 2017). Mass balances at the inlet of the digester before and after the addition of co-digestion are presented in Table 9.
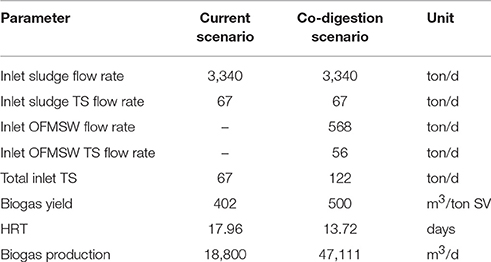
Table 9. Mass balance at the digester inlet and biogas production with and without co-digestion.
The resulting SS:OFMSW ratio in the co-digestion scenario is:
• 55:45 in terms of ST
• 76: 24 in terms of mass (tons)
• 85:15 in terms of volume (m3)
This data is in line with literature works on co-digestion, where a 50:50 VS/TS ratio is usually proposed (Mattioli et al., 2014; Koch et al., 2015; Kim et al., 2016; Arnò et al., 2017).
The biogas production increases by 151% thanks to co-digestion. Depending on the anaerobic digestion parameters and OFMSW composition, biogas production could vary (respect to the values obtained here and seasonally). However, literature works confirmed that biogas production can be doubled thanks to co-digestion (see Section Sludge co-digestion with food waste). Furthermore, co-digestion is usually performed as a best practice in self-sufficient WWTP (Table 6).
Biogas Exploitation in High Efficiency SOFC
The advantage of co-digestion is enhanced if biogas is exploited in high efficiency CHP systems, such as the SOFC. The SOFC electrical efficiency reaches 53–55% from clean biogas to AC power (Convion Fuel Cell Systems, 2016). Electrical efficiencies up to 60% and beyond have been also demonstrated in commercial systems (Lanzini et al., 2017). Furthermore, near zero emission of atmospheric pollutants is achieved. A comparison on the energy balance and plant load coverages with co-digestion is presented in Figure 7 and Table 10, with the option of biogas exploitation either in the SOFC or the ICE. Calculations have been performed with the same assumptions on CF, methane content and PV electrical production previously shown in Table 7.
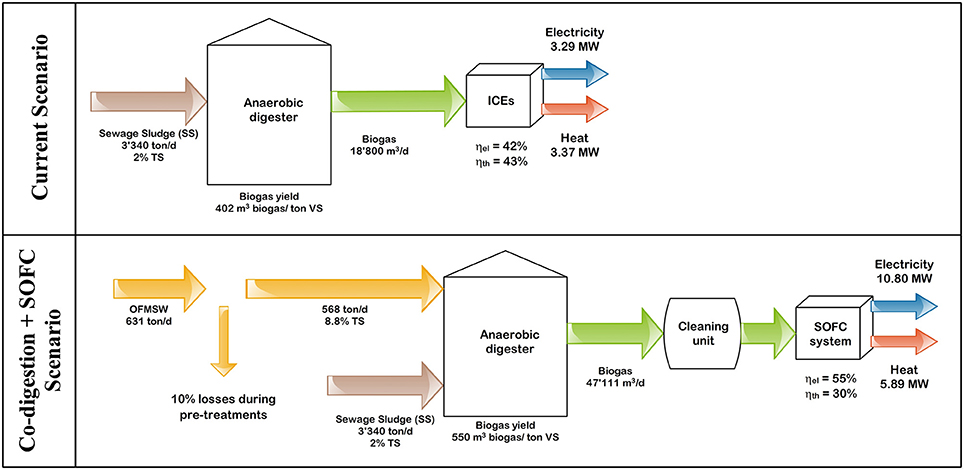
Figure 7. Comparison of current and proposed scenarios: energy and mass balances.
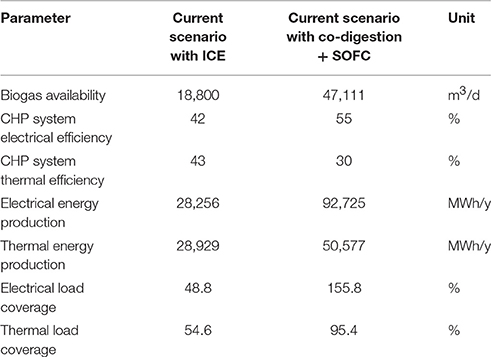
Table 10. Energy balance comparison between the current scenario and the co-digestion scenario with biogas exploitation in SOFC.
Thanks to the use of co-digestion and biogas exploitation in the SOFC, both electrical and thermal load could be covered, thus reaching a 100% self-sufficiency from the electrical point of view and a near-self-sufficiency from the thermal point of view.
The electrical production is indeed increased by 228% compared to the current scenario (due to the positive effect of co-digestion and SOFC). The overall thermal production is increased only by 75% since co-digestion provides a larger amount of biogas (positive effect) but the SOFC thermal efficiency is more than 10% lower compared to ICE (negative effect).
The goal of 100% self-sufficiency from the thermal point of view could be achieved by implementing a common practice in WWTPs, i.e., sludge pre-thickening. The thermal load is currently dominated by the production of hot water for sludge pre-heating (the sludge is indeed heated prior to entering the anaerobic digester). The high thermal load is due to the low TS content (2%) of the sludge. By pre-thickening (e.g., by means of a centrifugal system), the solid content can be easily doubled thus halving the thermal load. In the pre-thickening scenario, a thermal surplus is generated with respect to the current scenario.
Conclusion
The present work has provided a review on technological measures to increase the self-sufficiency of WWTPs. Since the operation of WWTP sites requires a large amount of electricity, the goal of energy self-sufficiency could be reached only by combining optimization/ improvement processes in different plant sections. The key sections in which plant owners efforts should be directed are the secondary biological treatment, where aeration is performed, and the water pumps.
Energy consumption reduction should be also coupled with an increase of the internal energy production, usually related to biogas from sewage sludges. Sludge pre-treatments and anaerobic digestion management are key drivers to increase biogas yield and reduce the energy consumption of the sludge line. Furthermore, use of co-digestion with other organic wastes is another potential way to increase onsite energy generation. Biogas can be then efficiently converted into electricity (and heat) via high temperature fuel cell generators.
The final part of this work has presented a case study based on the use of co-digestion of sludge and OFMSW in an existing WWTP and biogas exploitation into a high efficiency solid oxide fuel cell. Results show that the Castiglione WWTP (Italy), currently self-suppling only 50% of electrical and thermal loads, could fully reach electrical self-sufficiency thanks to the two proposed measures. Thermal load could also be covered if sludge pre-thickening is considered as another improvement for the site.
Future works will be devoted on economic and environmental analysis of the proposed case study, in order to determine how the proposed measures, especially co-digestion with OFMSW, would affect the plant economic and environmental path.
Author Contributions
MG: literature review analysis and case study development. AL: deep knowledge on biogas-fed SOFC installations, case study development. AS: literature review. PL: deep knowledge on biogas-fed SOFC installations, case study analysis. MS: deep knowledge on biogas-fed SOFC installations, case study analysis.
Conflict of Interest Statement
The authors declare that the research was conducted in the absence of any commercial or financial relationships that could be construed as a potential conflict of interest.
Acknowledgments
The research leading to these results has received funding from the Fuel Cells and Hydrogen 2 Joint Undertaking under grant agreement No. 671470 “DEMOSOFC (Demonstration of large SOFC systems fed with biogas from WWTP).” This Joint Undertaking receives support from the European Union's Horizon 2020 research and innovation program. SMAT S.p.a. is acknowledged for the sharing valuable data on the operation of Castiglione (TO) WWTP.
Abbreviations
AD, Anaerobic Digestion; CHP, Cogeneration Heat & Power; COD, Chemical Oxygen Demand; COLS, Corrected Ordinary Least Squares; CF, Capacity Factor; DO, Dissolved Oxygen; DS, Dry Solid; EEA, European Environmental Agency; EPRI, Electric Power Research Institute; FC, Fuel Cell; FOG, Fat Oil and Grass; GHG, Greenhouse Gas; GT, Gas Turbine; HRT, Hydraulic Retention Time; ICE, Internal Combustion Engine; MGD, Million Gallons per Day; MGT, Micro Gas Turbine; NEW, Nutrients, Energy and Water; OFMSW Organic Fraction of Municipal Solid Waste; OLS, Ordinary Least Squares; OPEX, Operating Expenditure; PE, Person Equivalent; PS, Paper Sludge; PV, PhotoVoltaics; SFA, Stochastic Frontier Analysis; SOFC, Solid Oxide Fuel Cell; SS, Sewage Sludge; THP, Thermal Hydrolysis Process; TS, Total Solid; VS, Volatile Solid; WERF, Water Environment Research Foundation; WWTP, Waste Water Treatment Plant.
Footnotes
1. ^WERF (Water Environment Research Foundation) Energy neutrality for the domestic wastewater industry is within reach.
2. ^Enerwater EU project official website. Available online at: http://www.enerwater.eu
3. ^FOG: Fat, Oil and Grease: Organic polar compounds derived from vegetable/plant or animal sources that are composed of long chain triglycerides.
4. ^American Council for an Energy-Efficient Economy Local Energy Efficiency Policy|ACEEE. Available online at: http://aceee.org/sector/local-policy/case-studies/sheboygan-wastewater-treatment-plant (Accessed May 9, 2017).
5. ^Proctor, P. Achieving Energy Independence atthe Gresham Wastewater Treatment Plant - WaterWorld. Available at: http://www.waterworld.com/articles/print/volume-27/issue-3/editorial-features/water-utility-management-special-section/achieving-energy-independence-at-the-gresham-wastewater-treatment-plant.html [Accessed May 9, 2017].
6. ^Environmental Protection Agency (EPA) Turning Food Waste into Energy at the East Bay Municipal Utility District (EBMUD). Available online at: https://www3.epa.gov/region9/waste/features/foodtoenergy/ (Accessed May 9, 2017).
7. ^SMAT La depurazione delle acque reflue urbane - l'impianto per l'area metropolitana torinese.
8. ^GE Power Jenbacher Type 4 Datasheet. Available online at: https://powergen.gepower.com/content/dam/gepower-pgdp/global/en_US/documents/product/Reciprocating Engines/Jenbacher/Type 4/jenbacher-type-4-fs-en-metric-2016.pdf (Accessed June 16, 2017)
References
Arnò, P., Fiore, S., and Verda, V. (2017). Assessment of anaerobic co-digestion in areas with heterogeneous waste production densities. Energy 122, 221–236. doi: 10.1016/j.energy.2017.01.066
Awe, O. W., Liu, R., and Zhao, Y. (2016). Analysis of energy consumption and saving in wastewater treatment plant : case study from Ireland. J. Water Sustain. 6, 63–76. doi: 10.11912/jws.2016.6.2.63-76
Bachmann, N. (2015). Sustainable Biogas Production in Municipal Wastewater Treatment Plants. IEA Bioenergy.
Belloir, C., Stanford, C., and Soares, A. (2015). Energy benchmarking in wastewater treatment plants: the importance of site operation and layout. Environ. Technol. 36, 260–269. doi: 10.1080/09593330.2014.951403
Bidart, C., Fröhling, M., and Schultmann, F. (2014). Electricity and substitute natural gas generation from the conversion of wastewater treatment plant sludge. Appl. Energy 113, 404–413. doi: 10.1016/j.apenergy.2013.07.028
BioFuels Energy (2011). Point Loma Wastewater Treatment Plant's Beneficial Use of Digester Gas. Available online at: http://scap1.org/POTWReferenceLibrary/BUDGProjectsFactSheet-SDGE2-7-11(2).pdf (Accessed May 9, 2017)
Bolzonella, D., Fatone, F., Pavan, P., and Cecchi, F. (2005). Anaerobic fermentation of organic municipal solid wastes for the production of soluble organic compounds. Ind. Eng. Chem. Res. 44, 3412–3418. doi: 10.1021/ie048937m
Braun, R., Holm-nielsen, J. B., and Seadi, T. A. L. (2002). Potential of co-digestion. IEA Bioener. 16, 1–16. doi: 10.1007/s11356-015-4998-1
Cao Ye Shi, and Cao, Y. S. (2011). Mass Flow and Energy Efficiency of Municipal Wastewater Treatment Plants. (IWA Publishing). Available online at: https://books.google.it/books?hl=it&lr=&id=l8t_sGkb2DcC&oi=fnd&pg=PR1&dq=Mass+flow+and+energy+efficiency+of+municipal+wastewater+treatment+plants&ots=3EeNTV9xyC&sig=sf756dBH-Ag6HbB1nLQjtY6vM80&redir_esc=y#v=onepage&q=Mass flow and energy efficiency of mun (Accessed May 4, 2017)
Collivignarelli, C., Bertanza, G., Collivignarelli, M. C., Zanaboni, S., and Abbà, A. (2009). Ottimizzazione del Servizio di Depurazione Delle Acque di Scarico Urbane: Massimizzazione dei Recuperi di Risorse (Acque e Fanghi) e Riduzione dei Consumi. SPRA - Istituto Superiore per la Protezione e la Ricerca Ambientale.
Convion Fuel Cell Systems (2016). Convion Product Focus. Available online at: http://convion.fi/
Copeland, C. (2014). Energy-Water Nexus: The Water Sector's Energy Use. Congressional Research Service.
Crawford, G. (2010). Best Practices for Sustainable Wastewater Treatment: Initial Case Study Incorporating European Experience and Evaluation Tool Concept. Water Intelligence Online. Available online at: https://scholar.google.com/scholar?q=Best+practices+for+sustainable+wastewater+treatment:+initial+case+study+incorporating+European+experience+and+evaluation+tool+concept (Accessed May 9, 2017)
Crawford, G., and Sandino, J. (2010). Energy Efficiency in Wastewater Treatment in North America: A Compendium of Best Practices and Case Studies of Novel Approaches. IWA Publishing.
Curletti, F., Gandiglio, M., Lanzini, A., Santarelli, M., and Maréchal, F. (2015). Large size biogas-fed Solid Oxide Fuel Cell power plants with carbon dioxide management : technical and economic optimization. J. Power Sources 294, 669–690. doi: 10.1016/j.jpowsour.2015.06.091
D'Andrea, G., Gandiglio, M., Lanzini, A., and Santarelli, M. (2017). Dynamic model with experimental validation of a biogas-fed SOFC plant. Energy Convers. Manag. 135, 21–34. doi: 10.1016/j.enconman.2016.12.063
Daw, J., Hallett, K., Dewolfe, J., and Venner, I. (2012). Energy Efficiency Strategies for Municipal Wastewater Treatment Facilities. National Renewable Energy Laboratory.
De Mes, T. Z. D., Stams, A. J. M., Reith, J. H., and Zeeman, G. (2003). “Methane production by anaerobic digestion of wastewater and solid wastes,” in Biomethane & Bio-hydrogen - Status and Perspectives of Biological Methane and Hydrogen Production, eds J. H. Reith, R. H. Wijffels, and H. Barten (Dutch Biological Hydrogen Foundation), 58–102.
Deines, A. (2015). Energy Production and Efficiency at Wastewater Treatment Plants, Director of Special Projects Water Environment Research Foundation.
DEMOSOFC Project Official Website (2016). Available online at: www.demosofc.eu (Accessed: Dec 20, 2015)
Electric Power Research Institute and Water Research Foundation (2013). Electricity Use and Management in the Municipal Water Supply and Wastewater Industries, 1–194. Available online at: http://www.epri.com/search/Pages/results.aspx?k=3002001433
Energy Sector Management Assistance Program (ESMAP) (2012). A Primer on Energy Efficiency for Water and Wastewater Utilities. Available online at: https://www.esmap.org/sites/esmap.org/files/FINAL_EECI-WWU_TR001-12_Resized.pdf (Accessed May 5, 2017).
Environmental Protection Agency (2012). Planning for Sustainability: A Handbook for Water and Wastewater Utilities. Washington, DC: Environmenmental Protection Agency.
Environmental Protection Agency (EPA) (2013). Energy Efficiency in Water and Wastewater Facilities - A Guide for Developing and Implementing Greenhouse Gas Reduction Programs. Washington, DC: Environmental Protection Agency.
Environmental Protection Agency (EPA) (2014). Moving Toward Sustainability: Sustainable and Effective Practices for Creating Your Water Utility Roadmap. Washington, DC: Environmental Protection Agency.
Esposito, G., Frunzo, L., Giordano, A., Liotta, F., Panico, A., and Pirozzi, F. (2012). Anaerobic co-digestion of organic wastes. Rev Env. Sci. Biotechnol. 11, 325–341. doi: 10.1007/s11157-012-9277-8.
European Environment Agency (2015). Urban Waste Water Treatment Maps. Available online at: http://www.eea.europa.eu/data-and-maps/uwwtd/interactive-maps/urban-waste-water-treatment-maps-1 (Accessed January 12, 2017)
Eurostat (2017). Municipal Waste Statistics - Statistics Explained. Available online at: http://ec.europa.eu/eurostat/statistics-explained/index.php/Municipal_waste_statistics (Accessed June 16, 2017)
Fikar, M., Chachuat, B., and Latifi, M. A. (2005). Optimal operation of alternating activated sludge processes. Control Eng. Pract. 13, 853–861. doi: 10.1016/j.conengprac.2004.10.003
Foladori, P., Vaccari, M., and Vitali, F. (2015). Energy audit in small wastewater treatment plants: methodology, energy consumption indicators, and lessons learned. Water Sci Technol. 72, 1007–1015. doi: 10.2166/wst.2015.306
Fytili, D., and Zabaniotou, A. (2008). Utilization of sewage sludge in EU application of old and new methods-A review. Renew. Sustain. Energy Rev. 12, 116–140. doi: 10.1016/j.rser.2006.05.014
Gandiglio, M., Lanzini, A., Santarelli, M., and Leone, P. (2013). Design and balance of plant of a demonstration plant with a Solid Oxide Fuel Cell fed by biogas from Waste-water and exhaust carbon recycling for algae growth. J. Fuel Cell Sci. Technol. 11:14. doi: 10.1115/FuelCell2013-18082
Giacetti, W., and Venturi, R. (2007). “Le raccolte differenziate dei rifiuti organici: sistemi di raccolta della frazione umida a confronto,” in La Raccolta Differenziata Dello Scarto Organico: L'importanza Della Qualità per L'intera Filiera del Compostaggio.
Goldstein, R. and Smith W. (2002). Water and Sustainability (Volume 4): U.S. Electricity Consumption for Water Supply and Treatment—The Next Half Century. Palo Alto, CA: EPRI.
Hanjie, Z. (2010). Sludge Treatment to Increase Biogas Production. 2–24. Available online at: http://www.sjostadsverket.se/download/18.79cc091012c369366d9800017089/1292253537712/LWR_EX_10_20.pdf
Hao, X., Liu, R., and Huang, X. (2015). Evaluation of the potential for operating carbon neutral WWTPs in China. Water Res. 87, 424–431. doi: 10.1016/j.watres.2015.05.050
Hickey, M. E., and Ozbay, G. (2014). Food waste in the United States: A contributing factor toward environmental instability. Front. Environ. Sci. 2:51. doi: 10.3389/fenvs.2014.00051
Horizon2020 ENERWATER Project (2014). ENERWATER D3.1: Indentification of Key Performance Indicators and ENERWATER Methodology, Horizon2020 ENERWATER Project.
Husmann, M. (2009). Improving Energy Efficiency in Waste Water Treatment: What Emerging Countries Can Learn from Experience Gained in the Developed World. Germany during Water Week; Pöyry Environment GmbH.
Iacovidou, E., Ohandja, D.-G., and Voulvoulis, N. (2012). Food waste co-digestion with sewage sludge e Realising its potential in the UK. J. Environ. Manage. 112, 267–274. doi: 10.1016/j.jenvman.2012.07.029
Istituto Superiore Per la Protezione e la Ricerca Ambientale (ISPRA) (2015). Rapporto Rifiuti Urbani - Edizione 2015. Available online at: http://www.isprambiente.gov.it/files/pubblicazioni/rapporti/rifiuti-urbani-2015/RapportoRifiutiUrbani_Ed.2015n.230_Vers.Integrale_agg22_12_2015.pdf (Accessed June 14, 2017).
IWA Task Group on Benchmarking of Control Strategies for Wastewater Treatment Plants (2014). Benchmarking of Control Strategies for Wastewater Treatment Plants. eds V. Krist, Gernaey, U. Jeppsson, P. A. Vanrolleghem, and J. B. Copp Available online at: http://www.iwapublishing.com/books/9781843391463/benchmarking-control-strategies-wastewater-treatment-plants (Accessed May 4, 2017)
Jonasson, M. (2007). Energy Benchmark for Wastewater Treatment Processes - A Comparison between Sweden and Austria. Lund: Department of Electrical Engineering and Automation Master.
Kim, M., Chowdhury, M. M. I., Nakhla, G., and Keleman, M. (2016). Synergism of co-digestion of food wastes with municipal wastewater treatment biosolids. Waste Manag. 61, 1–11. doi: 10.1016/j.wasman.2016.10.010.
Koch, K., Helmreich, B., and Drewes, J. E. (2015). Co-digestion of food waste in municipal wastewater treatment plants: effect of different mixtures on methane yield and hydrolysis rate constant. Appl. Energy 137, 250–255. doi: 10.1016/j.apenergy.2014.10.025
Lanzini, A., Madi, H., Chiodo, V., Papurello, D., Maisano, S., Santarelli, M., et al. (2017). Dealing with fuel contaminants in biogas-fed solid oxide fuel cell (SOFC) and molten carbonate fuel cell (MCFC) plants: degradation of catalytic and electro-catalytic active surfaces and related gas purification methods. Prog. Energy Combust. Sci. 61, 150–188. doi: 10.1016/j.pecs.2017.04.002
Liu, C., Li, H., Zhang, Y., and Liu, C. (2016). Improve biogas production from low-organic-content sludge through high-solids anaerobic co-digestion with food waste. Bioresour. Technol. 219, 252–260. doi: 10.1016/j.biortech.2016.07.130
Longo, S., d'Antoni, B. M., Bongards, M., Chaparro, A., Cronrath, A., Fatone, F., et al. (2016). Monitoring and diagnosis of energy consumption in wastewater treatment plants. A state of the art and proposals for improvement. Appl. Energy 179, 1251–1268. doi: 10.1016/j.apenergy.2016.07.043
Madi, H., Lanzini, A., Diethelm, S., Papurello, D., Van herle, J., Lualdi, M., et al. (2015). Solid oxide fuel cell anode degradation by the effect of siloxanes. J. Power Sour. 279, 460–471. doi: 10.1016/j.jpowsour.2015.01.053
Mattioli, A., Frison, N., and Bolzonella, D. (2014). Un buon monitoraggio aumenta la resa di biogas. Terra e Vita 39, 14–16. Available online at: http://terraevita.edagricole.it/wp-content/uploads/sites/11/2015/01/BA_14_05_Buon_monitoraggio.pdf
Mccarty, P. L., Bae, J., and Kim, J. (2011). Domestic wastewater treatment as a net energy producer - can this be achieved? Environ. Sci. Technol. 45, 7100–7106. doi: 10.1021/es2014264
Mehr, A. S., Gandiglio, M., MosayebNezhad, M., Lanzini, A., Mahmoudi, S. M., Yari, M., et al. (2017). Solar-assisted integrated biogas solid oxide fuel cell (SOFC) installation in wastewater treatment plant: energy and economic analysis. Appl. Ener. 191, 620–638. doi: 10.1016/j.apenergy.2017.01.070
Molinos-Senante, M., Hernandez-Sancho, F., and Sala-Garrido, R. (2014). Benchmarking in wastewater treatment plants: a tool to save operational costs. Clean Techn Env. Policy 16, 149–161. doi: 10.1007/s10098-013-0612-8
Montgomery, L. F. R., and Bochmann, G. (2014). Pretreatment of Feedstock for Enhanced Biogas Production (IEA Bioenergy), 1–24. Available online at: https://www.nachhaltigwirtschaften.at/resources/iea_pdf/reports/iea_bioenergy_task37_study_pretreatment.pdf
Muga, H. E., and Mihelcic, J. R. (2008). Sustainability of wastewater treatment technologies. J. Environ. Manage. 88, 437–447. doi: 10.1016/j.jenvman.2007.03.008
Nghiem, L. D., Koch, K., Bolzonella, D., and Drewes, J. E. (2017). Full scale co-digestion of wastewater sludge and food waste: bottlenecks and possibilities. Renew. Sustain. Energy Rev. 72, 354–362. doi: 10.1016/j.rser.2017.01.062
Nowak, O., Keil, S., and Fimml, C. (2011). Examples of energy self-sufficient municipal nutrient removal plants. Water Sci. Technol. 64, 1–6. doi: 10.2166/wst.2011.625
Oregon department of energy (2012). Bioenergy Optimization Assessment at Wastewater Treatment Plants. Available online at: http://www.oracwa.org/pdf/tetratech-odoe-rpt-final_3-20-2012.pdf (Accessed May 9, 2017)
Ostapczuk, R. E., Bassette, P. C., Dassanayake, C., Smith, J. E., and Bevington, G. (2011). Achieving zero net energy utilization at municipal WWTPs: the Gloversville-Johnstown Joint WWTP experience. Proc. Water Environ. Fed. 2011, 1191–1200. doi: 10.2175/193864711802836779
Panepinto, D., Fiore, S., Zappone, M., Genon, G., and Meucci, L. (2016). Evaluation of the energy efficiency of a large wastewater treatment plant in Italy. Appl. Energy 161, 404–411. doi: 10.1016/j.apenergy.2015.10.027
Papurello, D., Borchiellini, R., Bareschino, P., Chiodo, V., Freni, S., Lanzini, A., et al. (2014). Performance of a Solid Oxide Fuel Cell short-stack with biogas feeding. Appl. Energy 125, 254–263. doi: 10.1016/j.apenergy.2014.03.040
Papurello, D., Lanzini, A., Tognana, L., Silvestri, S., and Santarelli, M. (2015). Waste to energy: Exploitation of biogas from organic waste in a 500 Wel solid oxide fuel cell (SOFC) stack. Energy 85, 145–158. doi: 10.1016/j.energy.2015.03.093
Rillo, E., Gandiglio, M., Lanzini, A., Bobba, S., Santarelli, M., and Blengini, G. (2017). Life Cycle Assessment (LCA) of biogas-fed Solid Oxide Fuel Cell (SOFC) plant. Energy 126, 585–602. doi: 10.1016/j.energy.2017.03.041
Sadler, R., Georges, K., and Thornton, A. (2009). Evidence: Transforming Wastewater Treatment to Reduce Carbon Emissions. Available online at: https://www.gov.uk/government/uploads/system/uploads/attachment_data/file/291633/scho1209brnz-e-e.pdf
Santarelli, M., Briesemeister, L., Gandiglio, M., Herrmann, S., Kuczynski, P., Kupecki, J., et al. (2017). Carbon recovery and re-utilization (CRR) from the exhaust of a solid oxide fuel cell (SOFC): analysis through a proof-of-concept. J. CO2 Util. 18, 206–221. doi: 10.1016/j.jcou.2017.01.014
Schwarzenbeck, N., Pfeiffer, W., and Bomball, E. (2008). Can a wastewater treatment plant be a powerplant? A case study. Water Sci. Technol. 57. 1555–1561; doi: 10.2166/wst.2008.215
Seadi, T. Al Lukehurst, C., Saedi, T. Al Lukehurst, C., Seadi, T. and Al Lukehurst, C. (2012). Quality Management of Digestate from Biogas Plants Used as Fertiliser. IEA Bioenergy, Task. Available online at: http://www.iea-biogas.net/files/daten-redaktion/download/publi-task37/digestate_quality_web_new.pdf
Shen, Y., Linville, J. L., Urgun-Demirtas, M., Mintz, M. M., and Snyder, S. W. (2015). An overview of biogas production and utilization at full-scale wastewater treatment plants (WWTPs) in the United States: Challenges and opportunities towards energy-neutral WWTPs. Renew. Sustain. Energy Rev. 50, 346–362. doi: 10.1016/j.rser.2015.04.129
Shiratori, Y., Yamakawa, T., Sakamoto, M., Yoshida, H., Kitaoka, T., Tran, Q. T., et al. (2017). Biogas production from local biomass feedstock in the mekong delta and its utilization for a direct internal reforming solid oxide fuel cell. Front. Environ. Sci. 5:25. doi: 10.3389/fenvs.2017.00025
Tchobanoglous, G., Leverenz, H., and Gikas, P. (2009). “Impacts of new concepts and technology on the energy sustainability of wastewater management,” in Climate Change, Sustainable Development, and Renewable Energy Sources. (Thessaloniki: Environmental Council of the Aristotle University of Thessaloniki).
The New York State Energy Research and Development Authority (1998). On-Line Process Monitoring and Electric Submetering at Six Municipal Wastewater Treatment Plants. National Technical Reports Library.
The New York State Energy Research and Development Authority (2005). Municipal Waste Water Treatment Plant Energy Evaluation for Town of Tonawanda WWTP - Agreement No. 7185.
Tjaden, B., Gandiglio, M., Lanzini, A., Santarelli, M., Järvinen, M., and Jarvinen, M. (2014). Small-scale biogas-SOFC plant: Technical analysis and assessment of different fuel reforming options. Ener. Fuels 28, 4216–4232. doi: 10.1021/ef500212j.
Torregrossa, D., Schutz, G., Cornelissen, A., Hernández-Sancho, F., and Hansen, J. (2016). Energy saving in WWTP: daily benchmarking under uncertainty and data availability limitations. Environ. Res. 148, 330–337. doi: 10.1016/j.envres.2016.04.010
Tyagi, V. K., and Lo, S. L. (2013). Sludge: a waste or renewable source for energy and resources recovery? Renew. Sustain. Energy Rev. 25, 708–728. doi: 10.1016/j.rser.2013.05.029
Vilarino, M. V., Franco, C., and Quarrington, C. (2017). Food loss and waste reduction as an integral part of a circular economy. Front. Environ. Sci. 5:21. doi: 10.3389/fenvs.2017.00021
Water Environment Research Fundation (WERF) (2010). Sustainable Treatment: Best Practices from the Strass im Zillertal Wastewater Treatment Plant. Alexandria: Water Environment & Reuse Foundation.
Water Environment Research Fundation (WERF) (2016). WERF Energy Factsheet. Alexandria: Water Environment & Reuse Foundation.
Water Environment Research Fundation (WERF) (2014a). Co-Digestion of Organic Waste Products with Wastewater Solids. Alexandria: Water Environment & Reuse Foundation.
Water Environment Research Fundation (WERF) (2014b). Energy from Wastewater. Alexandria: Water Environment & Reuse Foundation.
Wett, B., Buchauer, K., and Fimml, C. (2007). “Energy self-sufficiency as a feasible concept for wastewater treatment systems,” in Procceedings of IWA Leading Edge Conference on Water and Wastewater Technologies, 21–24. Available online at: http://www.araconsult.at/download/literature/let07_wett_energy_selfsufficiency3.pdf (Accessed March 30, 2017).
Keywords: energy efficiency, waste water treatment plants, sewage sludge, sewage biogas, co-digestion, SOFC, fuel cells, energy self-sufficiency
Citation: Gandiglio M, Lanzini A, Soto A, Leone P and Santarelli M (2017) Enhancing the Energy Efficiency of Wastewater Treatment Plants through Co-digestion and Fuel Cell Systems. Front. Environ. Sci. 5:70. doi: 10.3389/fenvs.2017.00070
Received: 21 June 2017; Accepted: 10 October 2017;
Published: 30 October 2017.
Edited by:
Giulio Munz, University of Florence, ItalyReviewed by:
Santo Fabio Corsino, Università degli Studi di Palermo, ItalyJorge Arreola-Vargas, University of Guadalajara, Mexico
Copyright © 2017 Gandiglio, Lanzini, Soto, Leone and Santarelli. This is an open-access article distributed under the terms of the Creative Commons Attribution License (CC BY). The use, distribution or reproduction in other forums is permitted, provided the original author(s) or licensor are credited and that the original publication in this journal is cited, in accordance with accepted academic practice. No use, distribution or reproduction is permitted which does not comply with these terms.
*Correspondence: Marta Gandiglio, marta.gandiglio@polito.it