Site-Specific Multilevel Modeling of Potato Response to Nitrogen Fertilization
 Serge-Étienne Parent1*
  Michaël A. Leblanc1
  Annie-Claude Parent2
  Zonlehoua Coulibali1
  Léon E. Parent1
- 1Department of Soils and Agrifood Engineering, Université Laval, Québec, QC, Canada
- 2Department of Civil and Water Engineering, Université Laval, Québec, QC, Canada
Technologies of precision agriculture, digital soil maps, and meteorological stations provide a minimum data set to guide precision farming operations. However, determining optimal nutrient requirements for potato (Solanum tuberosum L.) crops at subfield scale remains a challenge given specific climatic, edaphic, and managerial conditions. Multilevel modeling can generalize yield response to fertilizer additions using data easily accessible to growers. Our objective was to elaborate a multilevel N fertilizer response model for potato crops using the Mitscherlich equation and a core data set of 93 N fertilizer trials conducted in Québec, Canada. Daily climatic data were collected at 10 × 10 km resolution. Soils were characterized by organic matter content, pH, and texture in the arable layer, and by texture and tools of pedometrics across a gleization-podzolization continuum in subsoil layers. There were five categories of preceding crops and five cultivar maturity orders. The three Mitscherlich parameters (Asymptote, Rate, and Environment) were most often site-specific. Sensitivity analysis showed that optimum N dosage increased with non-leguminous high-residue preceding crops, coarser soils, podzolization, drier climatic condition, and late cultivar maturity. The inferential model could guide site-specific N fertilization using an accessible minimum data set to support fertilization decisions. As decision-support system, the model could also provide a range of optimum N doses across a large spectrum of site-specific conditions including climate change.
Introduction
The main forcing variables for potato (Solanum tuberosum L.) growth and development are air temperature, photoperiod, intercepted radiation, precipitation, soils, and nutrient management (Hanks and Ritchie, 1991; White et al., 2007; Fortin et al., 2008). The potential yield of potato is the theoretical yield that can be achieved with a well-adapted cultivar grown from the best possible seeds under optimal conditions, including weather, soil, and agronomic practices (Haverkort and Struik, 2015).
The N fertilization limits the productivity of potato agroecosystems (Dueri et al., 2007; Hirel et al., 2007) but fertilizer N recovery varies from 10 to 70% in potato crops (Tran and Giroux, 1991). Because response curves show that economic loss is much larger with under- than over-fertilization, growers tend to apply more N than suggested by extension services (Joern and Vitosh, 1995; Prunty and Greenland, 1997). Reducing fertilizer N rates appears to be the only effective approach to reduce environmental risk (Peralta and Stockle, 2002). Fertilizer recommendations thus need to be adjusted more accurately to reflect site characteristics (Rajsic and Weersink, 2008). Nitrogen fertilizer trials can support decisions fitted to specific soil management zones (Cambouris et al., 2006).
Fertilization for optimum crop yield depends on soil quality (Boiteau et al., 2014), landform (Moulin et al., 2012), weather conditions (Sands et al., 1979), preceding crops (Li et al., 1999), the timing, location, and chemical form of the fertilizer being applied (Kelling et al., 2014), genetic factors such as longevity, growth rate (Gregory and Simmonds, 1992), nutrient requirements of cultivars (Saluzzo et al., 1999; Gianquinto and Bona, 2000; Zebarth et al., 2004; White et al., 2007), and economic considerations (Colwell, 1994). Although field trials could identify ex post nutrient optima at a specific location, optima cannot be generalized to conditions different from those of particular experiments (Kyveryga et al., 2007a,b). In order to adjust nutrient management to local conditions as required by precision agriculture (Inman et al., 2005), site-specific fertilizer applications rely on models' ability to capture the major yield-determining factors.
Meta-analysis (Tremblay et al., 2012), empirical (Hofman and Salomez, 2000), and process-based growth models (Kabat, 1995; Brisson et al., 2003) have been developed to model crop yield and N requirements. Meta-analysis allocates fertilizer trials to subgroups hence averaging out continuous input data such as fertilizer rates, and requires a data set large enough to build response subgroups of sufficient size, hence limiting the number of categories. Empirical models require measuring periodically soil nitrate content down to 60 cm as soil test N, and providing provisional N budgets and fair estimates of mineralization rates of soil organic matter and crop residues and their controlling factors such as pH, texture, and weather. Process-based models require large amounts of input data such as intercepted radiation and varietal parameters that are not readily available. Soil classification that provides information on subsoil properties important for plant growth is absent in such models.
Decision support systems for site-specific fertilization could be elaborated using a minimum data set of readily accessible weather, soil, and management data influencing key biological processes. Weather has a large influence on soil biological activity (Bolinder et al., 2007) and potato growth (Sands et al., 1979). Transformations of stable and labile organic matter are related to soil properties and weather variables available from local meteorological stations (Bolinder et al., 2013). Soil tests such as pH and organic matter content are provided by routine laboratories. Soil texture (and sometimes organic matter) as input variable can be measured using geophysical (Alfred et al., 2008) and spectrometric (Viscarra Rossel et al., 2016) methods. Soil series can be quantified as continuous variables using tools of pedometrics (Leblanc et al., 2016). Potato cultivars can be assigned to maturity groups as indicated by the supplier and government agencies.
Multilevel models (Pinheiro and Bates, 2000) have high generalization and interpolation capabilities. Where parameters of a non-linear model can be generated from linear combinations of variables, multilevel models can provide a broad and interpretable framework useful for descriptive modeling. Hence, multilevel models can synthesize readily available soil and meteorological data impacting on potato growth and development and thus provide an estimate for on-the-go fertilizer dosage adjusted to local conditions. Such models could also adjust N dosage to local yield potential (Inman et al., 2005).
Our objectives were to develop multilevel models to describe potato response to added N across gradients of weather, soil, and crop management and at plot scale, and to test model sensitivity using a dataset of fertilizer trials from Québec, Canada.
Theory
Mitscherlich Model
The law of minimum, popularized by J. von Liebig, states that growth is limited by the rarest resource, all other factors being equal. G. Liebscher came with the law of optimum, where a resource in minimum supply contributes more to production, the closer other production factors are to their optimum (de Wit, 1992). Liebig's and Liebscher's laws are statements that were formulated as mathematical expression. Several non-linear models are available to describe crop response to added nutrients (Dahnke and Olson, 1990). Curvilinear models often tend to recommend too much fertilizer in relation to the amount of yield increase obtained at or near maximum yield (Dahnke and Olson, 1990). Nevertheless, the Mitscherlich model has been found to be satisfactory for the site-by-site analysis of N fertilizer trials (Harmsen, 2000; Rajsic and Weersink, 2008; Valkama et al., 2013). We thus selected the Mitscherlich model given that the point where maximum yield is reached may also be indicated by the linear-plateau curve (Dahnke and Olson, 1990). Other non-linear models such as the linear-plateau and quadratic models showed poor performance (Supplementary Material 1) but could nevertheless be selected at need (Colwell, 1994; Bélanger et al., 2000).
In the Mitscherlich equation, the rate of yield increase gets progressively smaller as soil nutrient levels and nutrient additions increase, as follows (Rajsic and Weersink, 2008):
where Yield is crop production per unit area [M·S−1] (mass per surface), and Dose is fertilizer dosage per unit area [M·S−1]. The Mitscherlich parameters represented in Figure 1 are defined as follows:
• Asymptote is the yield [M·S−1] toward which the curve converges with increasing dose;
• Environment, represented on the left side of the abscissa intercept (x-axis), describes the fertilizer-equivalent dose provided by environmental conditions [M·S−1]; a more positive value for Environment returns a more negative intercept, indicating N credit provided by the environment; conversely, a negative value for Environment (positive x-intercept) indicates N loss from or N immobilization by the environment; the x-intercept in the Mitscherlich equation allows the possibility for different repeated measures to cross the y-axis (zero fertilizer) at different places for equal Environments and Rates, but different Asymptote values (to which a random effect can be assigned–see the Methodology section);
• Rate is the steepness of the curve relating Environment to Asymptote [dimensionless]. A higher Rate indicates a steeper curve.
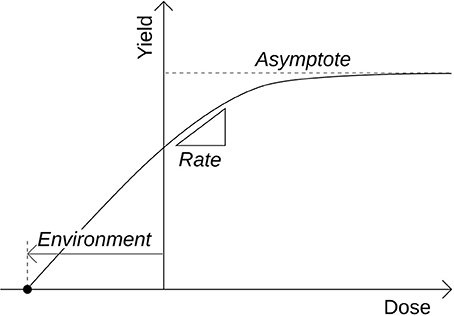
Figure 1. Scheme of the Mitscherlich parameters.
Optimal Economical Dose
The optimal nutrient dose is the point on the yield curve at which the additional cost of fertilizer is not justified by marginal yield gain with extra N (Shepherd, 2000). The optimal economic fertilizer dose was computed as follows (Colwell, 1994):
where Π is crude profit per cropped surface [$·S−1] (economic value per surface), V is the value of one unit of crop Yield [$], C is the cost of one fertilizer unit [$·M−1] (economic value per mass), I is the interest rate of return, t is the number of interest periods and Q represents the fixed costs [$]. Doseopt, the optimal fertilizer dose [M·S−1], is computed at the point on the curve where the first derivative of Π over Rate is null, as follows:
where Yield as a function of dose can be described by the Mitscherlich model (Equation 1). The equation for Mitscherlich optimum dosage is derived as follows:
Methodology
Data Set
The Québec potato data set is a collection of fertilizer trials conducted since 1970 between the US border (45th parallel) and the Northern limit of cultivation at the 49th parallel (Figure 2).
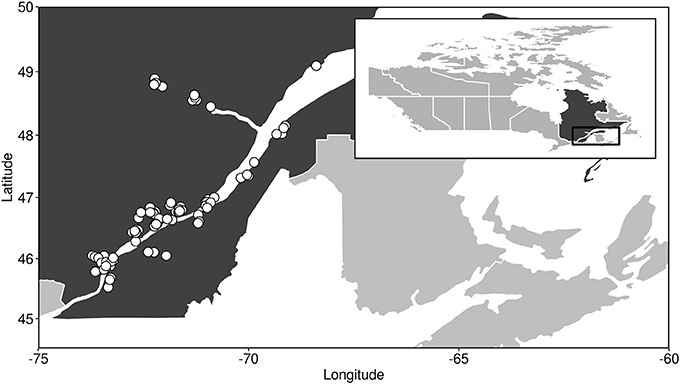
Figure 2. Location of experimental sites in the Québec potato data set.
The data set was cleaned to retain only N fertilizer trials conducted with sufficient P and K doses to avoid misguided trends and where minimum N dosage was less than or equal to 50 kg N ha−1 and maximum dosage was at least 100 kg N ha−1 to avoid fitting a response curve over a restricted range of doses. Trials were also inspected to assure the high quality of data, which led to the exclusion of one trial and one block of a trial. We retained a total of 2,166 observations from 284 experimental blocks in 93 N trials (sites). Most trials were arranged as randomized block designs, where random variables were Block nested in Trial. The dataset contained repeated treatments and specific variables (Table 1). Cultivars were amalgamated into ordinal maturity categories as reported on the web by the Canadian Food Inspection Agency (Table 1, Maturity order), and the preceding crops were grouped into the five meta-levels (Table 2). Grain corn, pearl millet, and rye were considered as high-residue crops because corn stubble was left on soil and pearl millet and rye were grown as high-yielding cover crops.
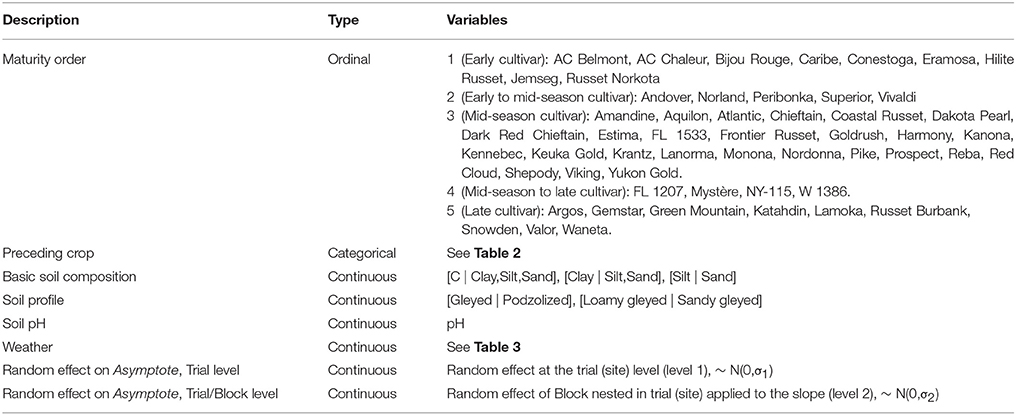
Table 1. Variables used in the multilevel models.
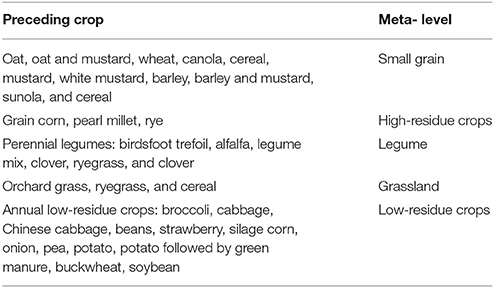
Table 2. Classification of preceding crops.
Compositional Data Analysis
Because several soil data such as particle-size distributions are compositional, techniques of compositional data analysis (CoDa) (Aitchison, 1986; Egozcue et al., 2003; Parent et al., 2013) are required to avoid generating methodological biases in the multilevel models.
Data related to soil texture are constrained to a constant sum, e.g., 100%. Such data are compositional and multivariate in nature (Pawlowsky-Glahn and Egozcue, 2006). There are D − 1 degrees of freedom for a D-part composition because one component can be computed by difference (Aitchison and Greenacre, 2002). Parent et al. (2013) stressed that such data should be log-ratio transformed prior to statistical analysis to avoid distorting the results with spurious correlations.
The isometric log-ratio (ilr) is a data-transformation technique that maps D-part compositional vectors as D − 1 orthonormal variables or dimensions interpreted as balances between predefined subsets of components (Egozcue et al., 2003). Balances can be designed in a (D − 1) × D matrix called sequential binary partition (SBP). In each row of the SBP, parts within subset “+” at numerator of the log ratio are contrasted with parts within subset “−” at denominator. Parts within subset “0” are excluded from the contrast. The composition is partitioned sequentially into non-overlapping subsets at every ordered row into two contrasts until the + and − subsets each contain a single part. Each balance is computed as isometric log-ratio (ilr) as follows (Egozcue et al., 2003):
where, for the kth balance (k ∈ [1:D − 1]) of a composition, rk and sk are the numbers of components in the “+” and the “−“ subsets, respectively, on the kth row of the SBP. Parts xi1xi2…xirk belong to the “+” subset at numerator and parts xj1xj2…xjsk belong to the “−” subset at denominator. The coefficient is a normalization coefficient used to obtain unitary vectors. In this paper, balances are designated as [subset at denominator | subset at numerator] (e.g., basic soil composition and soil profile in Table 1) to indicate that larger numbers at numerator make ilrs leaning to the right as in classical algebra. More details on the ilr-transformation applied to agricultural sciences can namely be found in Parent et al. (2013).
Soil Characteristics
Basic Soil Composition
The data set included soil texture of surface layers reported as % clay (0–0.002 mm), % silt (0.002–0.05 mm), and % sand (0.05–2 mm) (Bouyoucos, 1962) or as textural class (Soil Classification Working Group, 1998). Using centroids in the data set of Tabi et al. (1990), who surveyed Québec soils, textural classes were converted into percentages of sand, silt, and clay. Soil organic matter (SOM) content was quantified by combustion (Leco-CNS) or using the Walkley-Black procedure (Nelson and Sommers, 1982), assuming 58% C content in SOM. Soil texture was determined by sedimentation (Gee and Bauder, 1986). Organic matter as carbon content (C) and textural components were included into the soil simplex then transformed into isometric log-ratios as the [C | Clay, Silt,Sand], [Clay | Silt,Sand], and [Silt | Sand] balances.
Soil pH
Reported soil pH values were measured in water or in a 0.01 M CaCl2 solution (1:1 v/v). The pH(CaCl2) was converted into pH (water) as follows (Cescas, 1978):
Soil Profile Class
The potato fertilizer trials in the Québec data set have been conducted on 46 soil series. The subsoil has a large influence on crop growth, not least by regulating water availability (Piikki et al., 2015). Using soil profile morphological descriptions in Québec soil surveys, soil series were aggregated into a limited number of entities using a numerical clustering procedure (Leblanc et al., 2016). In brief, the textural gradient and the major pedogenic processes (gleization and podzolization) occurring in potato soil profiles were partitioned into three soil classes as follows: (1) loamy gleyed profiles (poorly drained loam), (2) sandy gleyed profiles (poorly drained sand), and (3) sandy podzolized profiles (well-drained sand). A set of fuzzy memberships to soil classes up to 100% was allocated to each observation to produce a continuous expression of soil type and thus facilitate modeling. Percentages were transformed into isometric log-ratios as [Gleyed | Podzolized] and [Loamy gleyed | Sandy gleyed] balances.
Weather Indices
Weather data were obtained from the Environment Canada system (Hutchinson et al., 2009). Climatic indices were collected as follows to characterize weather conditions that prevailed at experimental sites: the cumulative precipitation during the growing period—PPT, the Shannon diversity index for rainfall distribution—SDI (Tremblay et al., 2012), the crop evapotranspiration—ETC (Baier and Robertson, 1965; Allen et al., 1998), the number of growing degree days—GDD (Moulin et al., 2012), and the number of leaching events—NLE, i.e., precipitation events of at least 3 inches or 76 mm during 3 consecutive days (Chleborad, 2000; Liu et al., 2015). Weather indices were computed using the Canada daily precipitation and temperature data (University of Toronto, 2013). Table 3 provides equations to compute climatic indices for two growing periods: (1) beginning of the season (seedling) to 45 days after planting (DAP), approximately at beginning of tuber formation, and (2) 46 DAP to harvest. In general, N application is split between seeding and 45 DAP. Hence it was deemed informative to include two seasonal growing periods in the model.
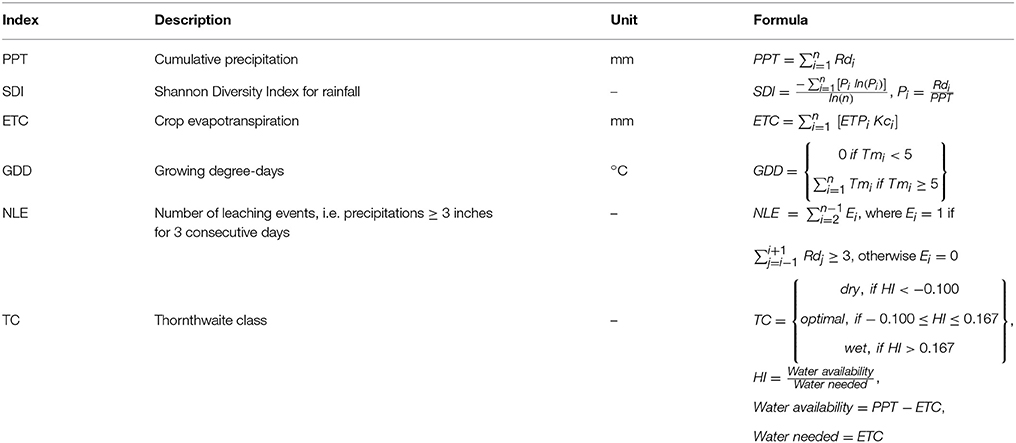
Table 3. Equations to compute climatic indices: Rd is daily rainfall, n is the number of days, ETP is potential evapotranspiration, Kc is crop coefficient depending on potato growth stage, and Tm is daily mean temperature.
Multilevel Model
Multilevel modeling is a statistical tool to assess the effects of driving variables on a response of features measured at different levels of randomization. Levels of interest in this study are blocks and trials: for each trial and each block within trials, we computed a random effect assumed to be normally distributed with zero mean and a computed variance-covariance matrix (Pinheiro and Bates, 2000).
Parameters of non-linear multilevel models can themselves be modeled from a set of features, usually by a linear combination of them—hence the “multilevel” concept can be understood through modeling the randomization and parameters of a non-linear model from the measured features. Asymptote, Rate, and Environment parameters of the Mitscherlich equation (Equation 1) were modeled as linear combinations of predictors with random effect applied to the intercept of the Asymptote parameter, as follows:
where Asymptote, Environment, and Rate are parameters of the Mitscherlich equation (1), β, γ, and δ are vectors of fixed effect coefficients associated to Asymptote, Environment, and Rate, respectively, X is the fixed effect model matrix (which could be designed differently for each parameter, but was set as similar across Asymptote, Environment, and Rate in this study for the sake of descriptive modeling), u is the vector of random effect coefficients, Z is the random effect model matrix and eA, eE, and eR are modeling errors associated to their respective subscript. In this paper, the term “parameters” refers to parameters of the first level model (Mitscherlich equation), i.e., Asymptote, Environment, and Rate. Also, the term “coefficients” refers to the β, γ, and δ vectors. Finally, the term “variables” refers to the predictors in X.
Random effects at levels of the trial and block were applied to the Asymptote parameter only, because maximum yield was likely to vary more among trials compared to Environment and Rate. No random effect was applied on Environment and Rate to avoid over-parametrization and facilitate model convergence. One random effect is computed for each trial (site), and another one is computed for each block within trials. The level 0 refers to no random effect, level 1 to random effects of trials only, and level 2 to random effects on both trials and blocks. Variables presented in Table 1 were included into a multilevel model subjected to the Mitscherlich equation. The preceding crop category was dummy-coded, i.e., each category except the reference one (which is included in the intercept—the small grain class was selected as reference) is analyzed in a new column where one (1) indicates category membership; otherwise zero (0) is indicated. The maturity order was transformed by linear encoding from −0.63 for order 1 to 0.63 for order 5 passing through 0 for order 3. Numerical variables were normalized to null mean and unit variance to ensure a common scale in the assessment of effects from coefficients.
The solution was reached from a set of Asymptote, Environment, and Rate starting values. Because different starting values could lead to different optima, we created a grid of 648 starting values among and selected the set returning the lowest Akaike information criterion (AIC). The multilevel mixed model provided estimates of the mean and covariance of regression coefficients. Coefficients were declared significant at P < 0.05.
The optimal economical fertilizer dosage (Equation 4) was computed for five case studies. Unit fertilizer costs (C) were set at 1.20 CDN $ kg−1 of N and unit crop price (V) at 275 CDN $ Mg−1. The interest (I), time (t), and fixed costs (Q) were set at zero. Because a single curve was presented per trial, the block (level 2) random effect was not considered, and the curves were computed using only the trial random effect (level 1).
Sensitivity Analysis
Sensitivity analyses were conducted by varying one variable (Table 1) at the time while keeping others at their mean values. Sensitivity analysis provides general trends. However, because an average situation may not occur in practice, the simulations should be interpreted with care.
Numerical Analysis
Numerical analyses were performed in the R statistical computing environment: the compositions package (van den Boogaart et al., 2014) to transform compositional data into isometric log-ratios; the dplyr package (Wickham et al., 2015) for general data manipulation; the ggplot2 package (Wickham and Chang, 2015) for data visualization; the mvoutlier package (Filzmoser and Gschwandtner, 2015) to identify outliers; the nlme package (Pinheiro et al., 2015) to fit non-linear multilevel models; the robCompositions package (Templ et al., 2015) to impute missing values robustly; the vegan package (Oksanen et al., 2015) for principal component analysis. The R code and data are available as Supplementary Material 1.
Results
Weather
Pearson correlations between weather variables (Figure 3) showed high correlation coefficients between cumulated precipitations and number of leaching events (0.83), between number of leaching events and evapotranspiration (0.81) and between evapotranspiration and growing degree-days (0.96). Principal component analysis (PCA) was performed across the two periods altogether, i.e., from the beginning of the season to 45 DAP and from 46 DAP to harvest, using all climatic indices. In agreement with Figure 3, the biplot of the PCA in Figure 4 showed redundant information between evapotranspiration (ETC) and growing degree-day (GDD) and between cumulated precipitations (PPT) and number of leaching events (NLE). We thus selected GDD, PPT, and SDI as weather indices and removed ETC and NLE that are indices more difficult to measure and compute.
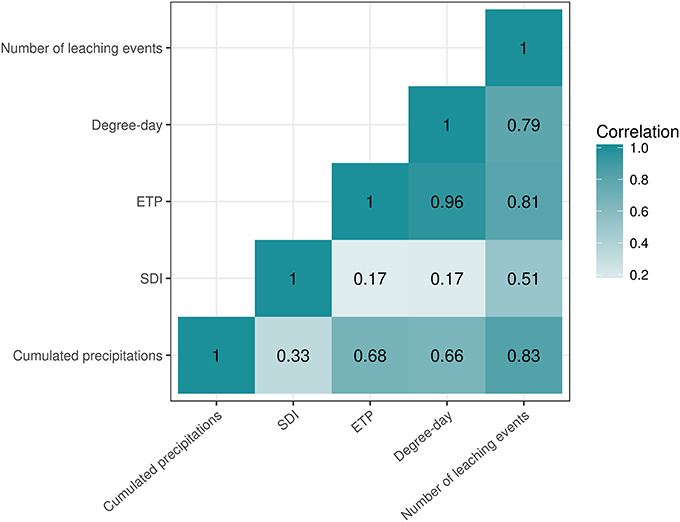
Figure 3. Pearson correlations between weather variables in the potato data set.
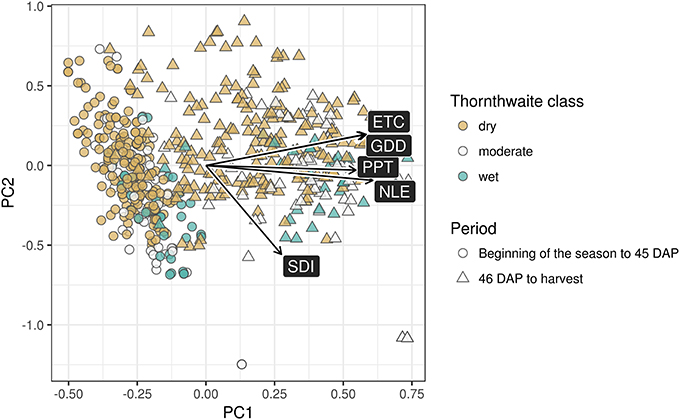
Figure 4. Biplot of the principal component analysis of weather indices (scaling 2).
Multilevel Model
The Mitscherlich equation fitted to the experimental data returned a R2 value of 0.70 for the random effects of blocks and trials, 0.66 for the random effects of trials only (similar to R2 obtained on non-irrigated sites by Bélanger et al., 2000), and 0.47 without random effect.
We also tested linear-plateau (y = min (a + bx, max yield)), quadratic (y = a + bx + cx2), and square-root () equations, that are often used for fertilizer-response models (Colwell, 1994). The linear-plateau model did not converge. Parameters a, b, and c of the quadratic and square-root models are difficult to interpret. The R2 values were lower for both the quadratic equation [0.66 at block level, 0.63 at trial level, and 0.43 without random effect] and square root equation [0.68 at block level, 0.65 at trial level, and 0.44 without random effect] compared to the Mitscherlich equation.
Mitscherlich Parameters
As indicated in the Methodology section, random effects are applied to the Asymptote parameter only at trial and at block levels to account for local variabilities. The random effect at the trial level was normally distributed (Shapiro-Wilk normality test with P = 0.58) with zero mean and standard deviation of 5.02. The random effect at block level was normally distributed (Shapiro-Wilk normality test with P = 0.14) with zero mean and standard deviation of 1.40. Considering that fixed effects on Asymptote ranged from −2.74 to 8.26 Mg ha−1 with an intercept at 35.2 Mg ha−1, the standard deviation of the trial-level random effect of 5.02 Mg ha−1 was large (14% of the intercept), possibly because other growth-limiting factors such as pest damage and some attributes of soil quality were not documented.
The distributions, paired points, and correlations between parameters Asymptote, Environment, Rate as well as the obtained optimal economical dose are shown in Figure 5. The correlations between parameters Environment and Rate were highly significant and negative (−0.696), indicating high collinearity in our application of the Mitscherlich equation (Equation 1). Moreover, the optimal dose was closely related with Rate using an approximate exponential relationship: larger Rates led to steeper slopes and consequently smaller optimal doses. The optimal dosage was moderately positively correlated with the Environment parameter (0.438), and was less dependent on the Asymptote (0.230).
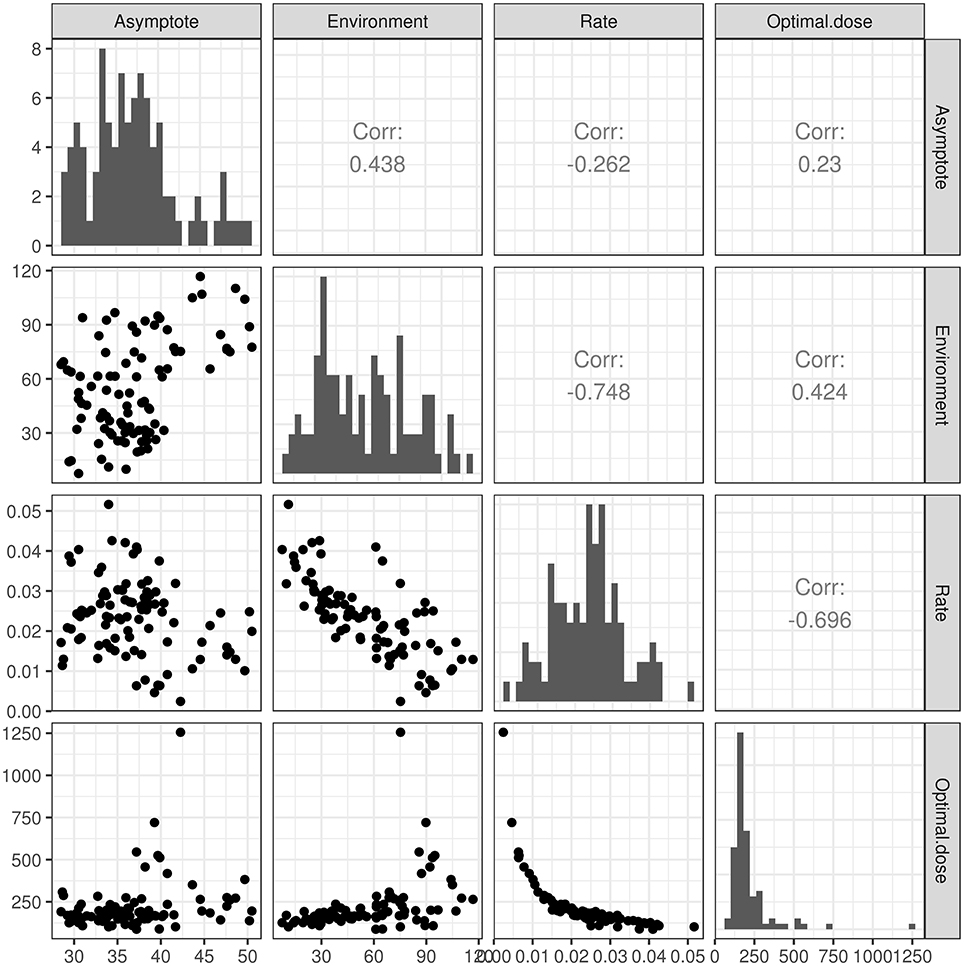
Figure 5. Pairs plot of Mitscherlich parameters and the optimal economical dose obtained with the potato data set. Lower: paired points. Diagonal: distribution histograms. Upper: Pearson correlations.
Coefficients
The means and confidence intervals of the linear coefficients of variables in the multilevel model are presented in Figure 6. The means, standard errors, and p-values of the coefficients are presented in detail in a separate table as Supplementary Material 2. Note that intercepts are values fitted by the model to account for the reference preceding crop (small grain), zero balances, and other sources of variation such as soil pH and climatic variables. Intercepts are thus catchalls not directly amenable to interpretation.
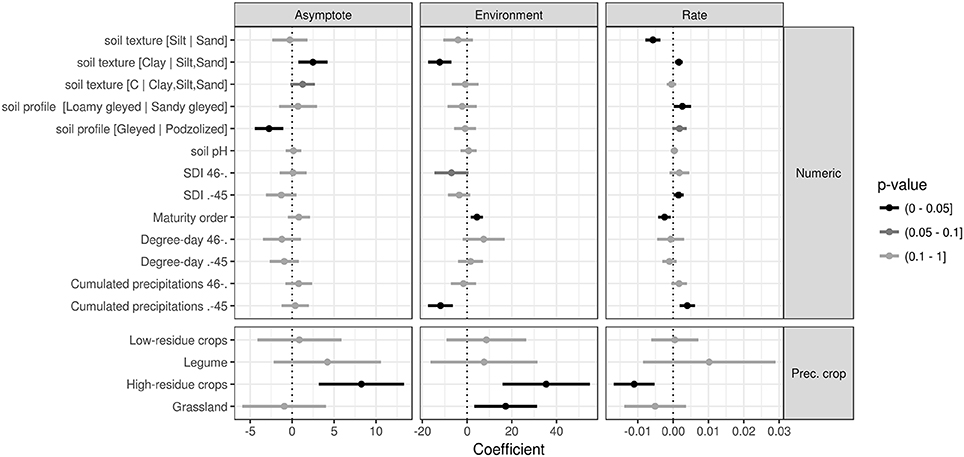
Figure 6. Regression coefficients of the nitrogen multilevel model with 95% confidence intervals.
Parameters Environment and Rate changed in opposite directions (Figure 6), in agreement with correlations between Mitscherlich parameters (Figure 5). Indeed, for given values of Asymptote, Rate must get gentler as the contribution of Environment to crop N supply increases (i.e., the value of Environment becomes more positive).
The characteristics of surface and subsurface soil layers significantly influenced at least one of the three Mitscherlich parameters. The coefficients associated with balances should be carefully interpreted. Because left hand-side components pull the balance variable toward more negative values, and conversely, a positive coefficient indicates that the parameter (i.e., Asymptote, Environment, or Rate) increases when the right-hand side of the balance increases in importance relatively to the left-hand side. For instance, the negative coefficient on Asymptote (Figure 6) associated with the [Gleyed | Podzolized] balance indicates that greater podzolization than gleization tends to decrease Asymptote. In a similar way, if clay increases in the surface soil layer the contribution of Environment to crop N supply also increases. The effect of soil pH on the three Mitscherlich parameters was not significant.
Asymptote
The parameter representing the maximum reachable yield, Asymptote, significantly (P = 0.0016) decreased with pedological group leaning toward the podzolized, well-drained, soil profiles (coefficient of variable [Gleyed | Podzolized] is negative). The soil texture balance [Clay | Silt,Sand] significantly (P = 0.0054) increased the Asymptote. All other things being equal, increasing the proportion of clay relatively to proportions of silt and sand would tend to decrease Asymptote. While soil organic matter accumulation showed no significant effect (P = 0.094), the high-residue preceding crops increased the Asymptote significantly (P = 0.0015) compared to the small grain class, indicating that organic matter quality could be an important driver for high yield. Other classes of preceding crops did not depart significantly from small grain.
Environment
The Environment, i.e., the parameter representing the fertilizer-equivalent dose provided by environmental conditions, decreased significantly (P = 3.9 × 10⁻⁶) with the [Clay | Silt,Sand] textural balance, indicating larger fertilizer-equivalent doses in fine-textured soils. The Environment increased significantly (P = 0.0015) as the cultivar maturity order increased, probably because cultivar of higher maturity is typically harvested later in the season. Increasing cumulated precipitations from beginning of season to 45 DAP significantly decreased the Environment parameter (P = 3.1 × 10⁻⁵). As preceding crops, high-residue crops and grassland increased Environment significantly (respectively, P = 0.00039 and P = 0.016) compared to small grain.
Rate
A relatively large proportion of the coefficients related to the Rate (the steepness of the response curve) showed significance (7 out of 17). While the [Clay | Silt,Sand] balance significantly (P = 0.0035) increased Rate, the [Silt | Sand] balance significantly (P = 1.4 × 10⁻⁷) decreased Rate, but the [C | Clay,Silt,Sand] balance had no effect (P = 0.51). The Rate tended to increase (P = 0.075) toward well-drained profiles (positive [Gleyed | Podzolized] coefficient), and increased significantly (P = 0.035) with the [Loamy | Sandy] balance of gleyed soil profiles. Cumulated precipitations showed significant (P = 0.00032) positive effect on Rate from the beginning of season to 45 DAP, but its effect from 46 DAP to harvest, also positive, was not significant (P = 0.13). The Shannon diversity index (SDI) only had a significant (P = 0.033) effect from the beginning of the season to 45 DAP. The Rate decreased significantly (P = 0.0081) as the cultivar maturity order increased. The high-residue crops preceding crop class decreased the Rate significantly (P = 0.00019) compared to small grain.
Simulations of N Response in Selected Trials
Trials 4, 71, 89, and 342 were selected to represent contrasting classes and levels of variables, as follows:
1. Trial 4. “Bijou Rouge” (maturity order 1) and grassland as preceding crop; subsoil texture is sandy and moderately podzolized; surface soil texture is sandy loam.
2. Trial 71. “Superior” (maturity order 2) grown under the wettest conditions after low-residue crops as preceding crops; the subsoil is highly gleyed and its texture is loamy; the texture of the surface soil is medium (loam).
3. Trial 157. “Russet Burbank” (maturity order 5) grown under highly podzolized, sandy subsoil; coarse soil in the arable layer (loamy sand) with high organic matter content; very high growing degree days through the first period and very low precipitations through the second period; small grain is the preceding crop class.
4. Trial 342. “W 1386” (maturity order 4) grown under highly podzolized, sandy subsoil; coarse soil in the arable layer (loamy sand) with high organic matter content (similar to trial 157); small grain is the preceding crop class; soil pH is higher than the 75% quantile.
The mean values of coefficients are presented in Figure 7.
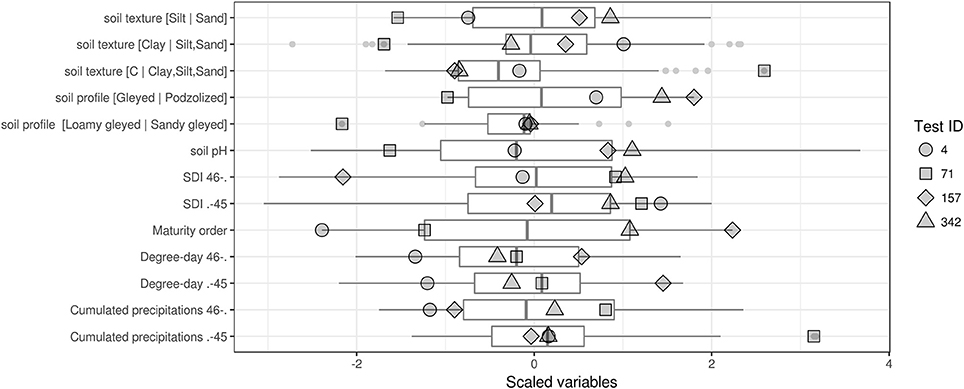
Figure 7. Boxplots of scaled numerical variables to evaluate the N-model.
Results of the fitted response curves of the selected trials are presented in Figure 8. The black dots are observations, and the symbols represent blocks. The curves are drawn using the trial-level random effect (level 1). The model was fitted across the whole data set: trials are specific application of the model. Unusual cases returning optimal doses lower than 50 kg N ha−1 (the minimum non-null dosage used in most trials) should be interpreted with care.
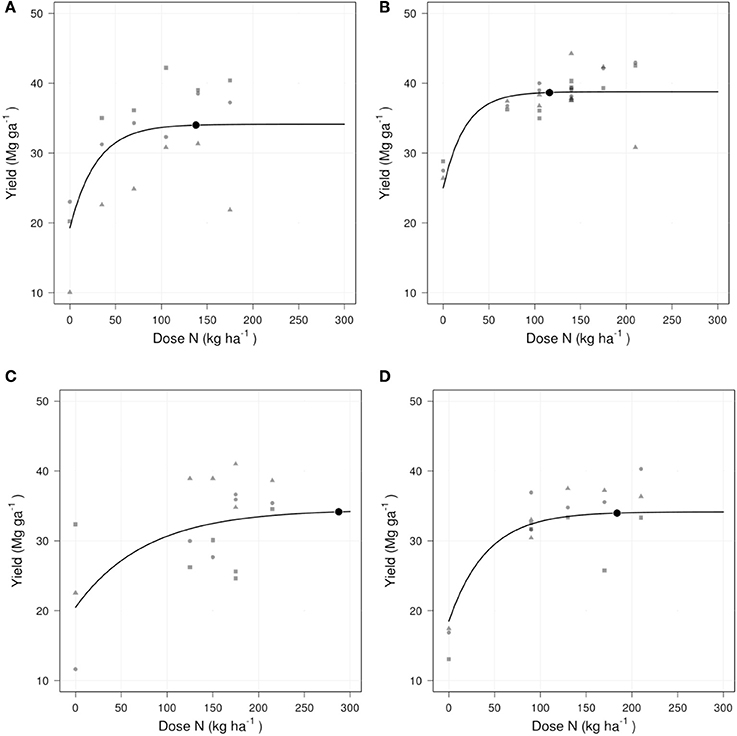
Figure 8. Estimated Mitscherlich curves obtained from the multilevel model. The line is computed from coefficients estimated by the multilevel model. Points are measures, and the symbols represent experimental blocks. Large filled circles are optimal doses and their associated yield. (A) Trial 4, (B) Trial 71, (C) Trial 157, and (D) 342.
Trial 4
Trial 4 (Figure 8A) returned an R2 value of 0.41, lower than the R2 value of 0.67 for the whole set of N experiments using the trial-level (level 1) random effects. The optimal dose computed from the estimated coefficients was 138 kg N ha−1. Without the random effect of 1.3 Mg ha−1, the Asymptote was 33 Mg ha−1, as limited by the low cultivar maturity order, the high SDI from the beginning of the season to 45 DAP and the high podzolization, but was compensated in part by the high [Clay | Sil,Sand] balance. The Environment parameter was low at 24 kg N ha−1, related to the high [Clay | Sil,Sand] texture balance (low clay content or high silt and sand contents) and the low numbers of growing degree-days from 46 DAP to harvest. It was however promoted by the grassland preceding crop class. The Rate, on the other hand, was high (0.035), thanks to the low [Silt | Sand] balance and the low cultivar maturity order, but was lowered by the grassland preceding crop class.
Trial 71
Trial 71 (Figure 8B) returned a high R2 value of 0.93. The optimal economic dose was 116 kg N ha−1. The Asymptote of 36 Mg ha−1 (without the random effect of 4.3 Mg ha−1) was near the median value obtained in the potato data set (36 Mg ha−1). The low [Gleyed | Podzolized] and high [C | Clay, Silt, Sand] balances (gleyfied and low organic content), that pushed the Asymptote up, was offset by the low [Clay | Silt,Sand] balance. The Environment supplied 35 kg N ha−1, apparently related to unusually high cumulated precipitations from beginning of season to 45 DAP. The contribution of the Environment enhanced due to the low [Clay | Silt,Sand] balance. Finally, the Rate was high (0.042), pushed up mainly by high cumulated precipitations from beginning of season to 45 DAP and the low [Silt | Sand] balance, but was lowered by the low [Loamy gleyed | Sandy gleyed] balance.
Trial 157
Trial 157 (Figure 8C) returned an R2 value of 0.42. The optimal dose was 288 kg N ha−1, i.e., beyond the maximal dose of the trial. The Asymptote was 29 Mg ha−1 (without the random effect of 5.9 Mg ha−1), which is among the lowest values obtained across the 93 trials. The Asymptote was mainly dragged down by a high podsolization, i.e., high [Gleyed | Podzolized] balance, although pushed up by the high maturity order of the Russet Burbank cultivar. The Environment parameter was of 69 kg N ha−1, which is above the median obtained in the potato data set (52 kg N ha−1), as dragged down by a high [Clay | Silt,Sand] balance but pushed up by a high maturity order and high numbers of growing degree-days for both periods. The Rate of 0.013 was quite low. The Rate was increased by a high [Gleyed | Podzolized] balance but decreased by the high maturity order, the high numbers of growing degree-days through the first period and low cumulated precipitation through the second period.
Trial 342
Trial 342 (Figure 8D) returned an R2 value of 0.55. The optimal dosage was 184 kg N ha−1. Without the random effect of 3.7 Mg ha−1, the Asymptote was 30 Mg ha−1, which was low mainly due to a high podzolization, i.e., high [Gleyed | Podzolized] balance. The Environment parameter was 32 kg N ha−1, which was also low, although Environment was promoted by the high maturity order of the W 1386 cultivar. The Environment was lowered by a very high [Silt | Sand] balance and a slightly low numbers of growing degree-days from 46 DAP to harvest. The Rate of 0.024 was equivalent to the median Rate of the potato data set (0.024). The Rate was lowered by the high [Silt | Sand] balance and high maturity order, and enhanced by a high [Gleyed | Podzolized] balance.
Sensitivity Analyses
Optimal Dosage
Optimal doses were computed over the range of a single parameter (Equation 1: Asymptote, Environment, and Rate), keeping the two other parameters at their median values, with unit fertilizer costs set at 1.20 CDN $ kg−1 of N and unit crop price at 275 CDN $ Mg−1. Results shown in Figure 9 are cuts taken from a hyper-plane. For a given parameter, slopes, and intercepts (for Asymptote and Environment) or trend (for Rate) depend on the values used for the two other parameters, as well as on the unit fertilizer cost and the unit crop price. However, it can be shown that holding other variables at constant values the slope of the Environment parameter was −1. While optimal doses slightly increased linearly with higher Asymptote, and decreased linearly where the contribution of the Environment increased, the impact on Rate was approximatively exponential—higher Rate returning steeper response curves. This sensitivity analysis agreed with the paired plots shown in Figure 5 and with case studies presented previously, where Rates had a major impact on optimal economical doses.
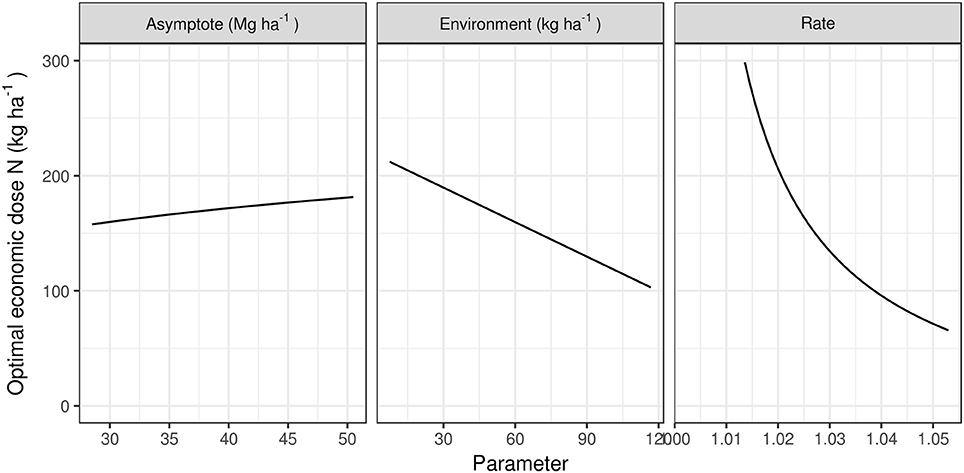
Figure 9. Sensibility analyses conducted on Mitscherlich parameters defined in Equation (1).
Multilevel Mixed Model Variables
We conducted a sensitivity analysis for each variable included in the model, with only one variable varying in each case. Other numeric variables were set to their mean in the data set (which was 0, since they were scaled), and the preceding crop was set to small grain when not tested for sensitivity. Varying numeric variables were set to the 25% quantile (low), the median, and the 75% quantile (high). The sensitivity analysis only accounted for the magnitude of the coefficients and avoided uncertainty. Results are presented in Figure 10.
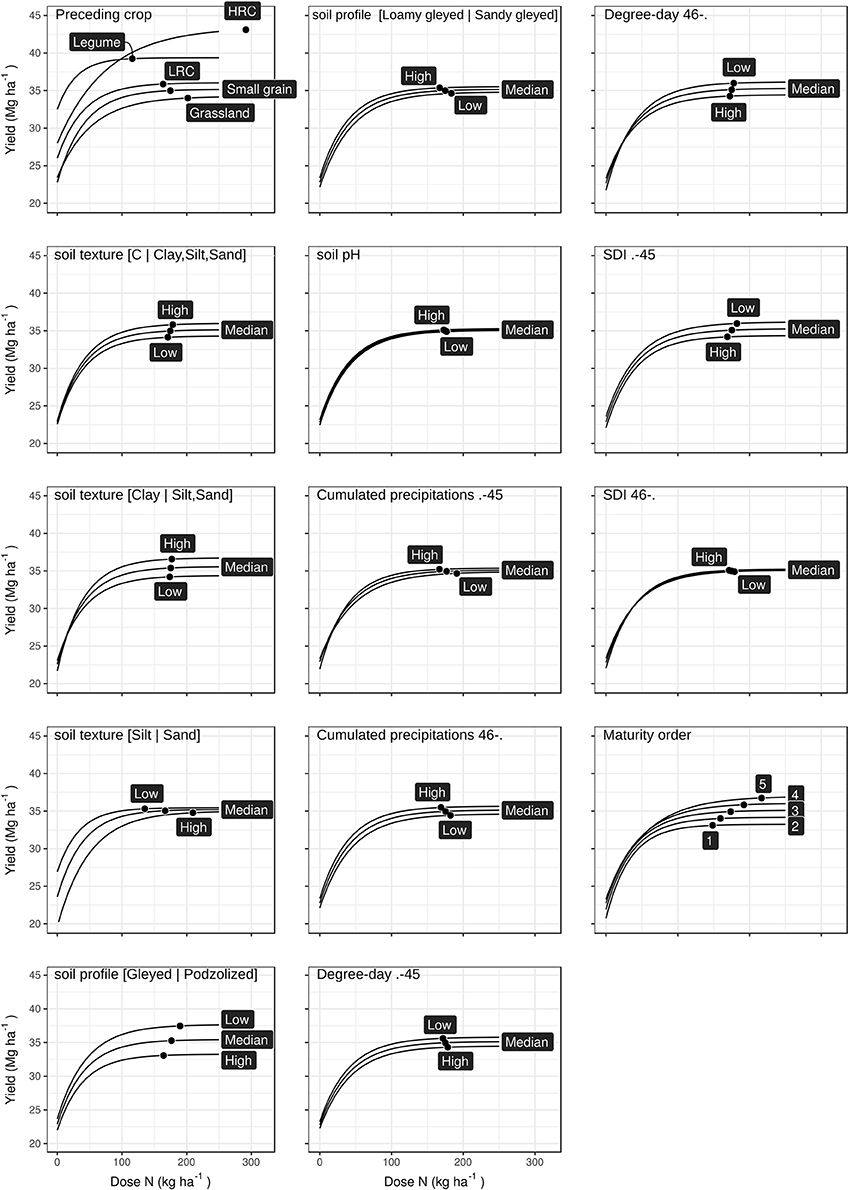
Figure 10. Sensitivity of the multilevel mixed model. In each case, small grain was the preceding crop.
The coefficient for soil profile class [Gleyed | Podzolized] was significant (Figure 6) and thus impacted on Asymptote (Figure 10, range: 33–38 Mg ha−1). More gleization (hence larger amounts of available water in the soil profile) led to higher yield. In the sensitivity analysis, the Environment ranged from 42.5 to 43.9 kg N ha−1 and Rate from 0.023 to 0.025. Average optimal N dosage varied between 164 and 190 kg N ha−1.
The [Silt | Sand] balance in the arable layer (Figure 10) resulted in a narrow range for Asymptotes, from 35.0 to 35.5 Mg ha−1. Environment ranged from 40 to 47 kg N ha−1, and Rate from 0.020 to 0.030. Although the Asymptote varied barely, the Environment and Rate parameter impacted on optimal dosage that varied between 135 and 210 kg N ha−1.
The preceding crop (Figure 10) influenced markedly the shape of the response curves. The Asymptote varied from 34 (grassland) to 43 (high-residue crops) Mg ha−1, Environment from 43 (small grain) to 78 (high-residue crops) kg N ha−1, and Rate from 0.013 (high-residue crops) to 0.034 (legume). The optimal doses ranged from 175 (low-residue crops) to 292 kg (high-residue crops) N ha−1 among preceding crop classes.
The maturity order from 1 to 5, i.e., 1 = early and 5 = late, (Figure 10) returned optimal doses ranging from 149 (maturity 1) to 217 (maturity 5) kg ha−1. The Asymptote varied from 33 (maturity 1) to 37 (maturity 5) Mg ha−1, while Environment ranged from 33 (maturity 1) to 53 (maturity 5) kg N ha−1, and Rate from 0.019 (maturity 5) to 0.030 (maturity 1).
Discussion
Selection of the Response Function
The Mitscherlich equation assumes sufficient supply of nutrients other than the one being varied to ensure constant exponential coefficient and the most efficient use of the nutrients being varied as prescribed by Liebscher's law of optimum. However, our application of Mitscherlich's equation incorporated the Liebscherian view that the Rate parameter in the Mitscherlich function (1) was not a constant, but depended on how local conditions are close to their optima.
Where ex-ante N recommended dosage proved to be lower than ex-post optimal dosage, it tended to occur on less productive sites (Rajsic and Weersink, 2008). Soil compaction increases soil strength and decreases soil physical fertility through decreasing storage and supply of water and nutrients, which leads to lower yields and higher fertilizer requirements (Hamza and Anderson, 2005; Stalham et al., 2005). Nevertheless, Inman et al. (2005) suggested that low-yielding areas in a field should receive less nutrient dosage. The present multilevel mixed model indicated that under stressful conditions, potato response to added N tended to level off at relatively low N dosage as suggested by Inman et al. (2005). As more limiting factors are relieved, nutrient use efficiency must increase. In the case of potato crops, irrigation scheduling (Haverkort and Struik, 2015), remedial measures against soil compaction (Stalham et al., 2005; Rees et al., 2015) and crop sequences could improve nutrient use efficiency.
On the other hand, growers often think that higher yields can be attained just by adding an incremental dosage of nutrients based on nutrient removal by the incremental yield computed by difference between yield target and some yield average. However, incremental dosage of fertilizers denies the law of diminishing returns and the law of optimum. Our results support the view that higher yields that could only be obtained with appropriate measures to raise the level of other factors closer to their optimum (de Wit, 1992) required more N input in average (Figure 9).
Input Variables
The Asymptote parameter was driven primarily by soil texture, soil profile morphology, and the preceding crop. Soil quality represented here by soil texture and the soil profile class is a primary driver of the potato agroecosystem productivity (Boiteau et al., 2014). The high-residue crops contributed to higher yield probably because (1) such crops were grown in the southern potato region of the St-Lawrence Lowlands where potato yields are higher; (2) labile organic matter temporarily immobilized soil N but contributed to water retention.
Although Environment is expressed in equivalent dosage units (e.g., kg N ha−1), it represents a set of conditions that determines yields at zero N supply from fertilizers. The model showed that the contribution of Environment to crop N supply increased with cultivar maturity class and high residue crops, and varied with the balances between the [Clay | Silt,Sand] balance. In terms of weather indices, higher cumulated precipitations across the first period drove the Environment parameter downward, possibly due to leaching. Organic matter decomposition could impact indirectly to Environment through its relationship with soil texture, moisture, and temperature (Andrén and Kätterer, 1997; Thomsen et al., 1999) that mediate carbon sequestration (Stewart et al., 2008).
The preceding crop may mop up soil nitrate or fix molecular nitrogen, hence potentially contributing to the N supply of the following potato crop (Alva et al., 2002; Tonitto et al., 2006). While annual cropping depletes soil organic N, crop rotations including forages and the addition of animal manure are N building management practices (Bolinder et al., 2010). Crop N uptake and crop residues low in N and hence high in C/N ratio can decrease the N losses, demonstrating the importance of the quality of organic inputs in the N budget of agroecosystems (Persson and Kirchmann, 1994). The composition of crop residues, mineral N concentration in the soil and soil aggregation determine the kinetics of N immobilization and the subsequent remobilization by feed-back effects (Mary et al., 1996). Grassland can accumulate large amounts of microbial biomass N by immobilizing mineral N in late spring and the fall (Corre et al., 2002), resulting in potential N credits of 55–99 kg N ha−1 after sod breakup (Neeteson, 1990; Li et al., 1999). Maize and ryegrass were found to increase N requirements compared to other preceding crops probably due to buildup of high-C/N organic matter in the soil.
As expected from Liebscher's law of optimum, the Rate parameter varied markedly with growth factors (8 out of 17 in Figure 6). The model showed that a silty soil surface texture, a sandy and podzolized (well-drained) soil profile, as well as cumulated precipitations and SDI from the beginning of the season to 45 DAP increased Rate; while late maturity and high-residue crops decreased it.
Although the potato harvested at tuber maturity generally reaches a plateau without negative effect of extra N dosage (Shepherd, 2000) except in case of late N applications affecting tuber quality (Hofman and Salomez, 2000), surplus N availability during the early growth stage can delay the transition from shoot accumulation to translocation of N to tubers until early August (Kleinkopf and Dwelle, 1978). As a result, early-harvested potatoes generally show yield decrease at high N dose by retarding maturity (Shepherd, 2000). Such yield decrease cannot be modeled by the ascending Mitscherlich curve. In this special case, other non-linear models, such as polynomial models, may be selected. However, most trials were conducted with storage rather than early harvest potatoes.
Model Sensitivity
Sensitivity analyses should be interpreted with care because the uncertainties about coefficients were not included. Sensitivity analyses showed that the source of water (rainfall or groundwater) influenced potato N requirements differently. Besides, mineral nitrogen is not available to the crop unless the water supply is within certain limits (Karvonen et al., 2000).
Case studies across weather indices (Figure 10) generated a narrow range of Asymptotes from 34 to 36 Mg ha−1, essentially due to the range of SDI from the beginning of season to 45 DAP. Moreover, Environment ranging from 29 to 48 kg N ha−1 and Rate from 0.024 to 0.028, slightly impacted on optimal N dosage that varied between 164 and 186 kg N ha−1, essentially due to cumulated precipitations from 46 DAP to harvest. Wetter soil conditions favor microbially mediated processes (Bolinder et al., 2007) and the diffusion of mineral N across the root zone hence facilitating N uptake (Karvonen et al., 2000). Dryer soil conditions generally increased N requirements possibly due to difficulties for fertilizer granules (most often 27-0-0, 18-46-0, and 11-52-0) to dissolve.
Wetter soil conditions increased nitrogen use efficiency (smaller optimal N for higher yield), indicating that the seasonal wet weather as defined here resulted in limited nitrate leaching events. The reported nitrate contamination of groundwater attributed to potato cropping (Levallois et al., 1998) may be the result of nitrate leaching during events outside the cropping growth period in the fall and winter and after snowmelt where soil surface is bare and water is abundant (Peralta and Stockle, 2002; Jiang et al., 2011).
The interaction between available water and nitrogen must differ between rainfall water that contacts the arable layer well-supplied with mineral N and the groundwater where mineral N is less abundant. The [Gleyed | Podzolized] plot shown in Figure 10 illustrates water supply to the root zone that originates from the groundwater where mineral N supply capacity must be much smaller due to lower microbial activity below the arable layer. Gleyed soils produced higher yield potential (Figure 6) and required more fertilizer N compared to podzolized soils. Soil pedogenesis (gleization and podzolization) should be interpreted in the context of soil texture. Soil texture defined by the [Silt | Sand] balance in the arable layer indicated that higher silt proportions relative to sand proportions had a minor influence on expected maximal yield, but considerably drove N requirement downward (Figure 10) by increasing the Rate parameter (Figure 6). Silt increases soil water-holding capacity, hence stimulating microbial activity and phosphate transfer from soil particles to the roots.
Where overhead irrigation or rainfall maintain moist conditions in the arable layer, microbial activity may be stimulated (Bolinder et al., 2007) therefore increasing mineral N available in the root zone. Subsurface irrigation of potato crops with controlled drainage that maintains adequate moisture conditions in the arable layer is known to use less water and may lead to higher fertilizer use efficiency compared to overhead irrigation (Satchithanantham, 2013). However, where subsurface drainage is installed in potato soils, drainage water may remove 14–70 kg N ha−1 from the soil profile (Madramootoo et al., 1992, 1995).
The preceding crop is known to influence soil N supply capacity through the C/N ratio of crop residues (Stevenson, 1986). The sensitivity analysis in Figure 10 shows that high-residue crops and grassland (generally showing high C/N ratios) require more fertilizer N compared to other preceding crops, especially legumes. Note that yield levels in Figure 10 must be interpreted with care because, compared to grassland grown mainly in northern regions, maize is grown as rotation crop in more southerly regions where potato yields are higher due to longer growing seasons.
It is generally agreed that N requirements differ among cultivars (Gianquinto and Bona, 2000; White et al., 2007). The daily rate of N accumulation in tubers is known to be higher for short and intermediate than long cycle cultivars (Kleinkopf et al., 1981; Saluzzo et al., 1999). For long cycle cultivars, a substantial fraction of the N remains in the aboveground biomass (Kleinkopf et al., 1981). The N input may also vary among cultivars with similar longevity (White et al., 2007). The present multilevel model classified the cultivar effect according to the assumed maturity order only. As expected, sensitivity analysis showed higher N requirements as tuber yield increased from early to late cultivars (Figure 10). Tuber yield has been shown to increase linearly with time from tuber formation to harvest (Fortin et al., 2010) as indicated, in the present study, by the effect of maturity group on tuber yield.
Using Multilevel Mixed Model to Estimate Optimal Economic Dose
Experiments to determine fertilizer N requirements for maximum and optimum tuber yields resulted in a wide range of N doses (Hill, 1984; White et al., 2007) depending on soil type and weather conditions, agronomic factors such as timing, location, and chemical form of the fertilizer applied, and genetic factors (Gregory and Simmonds, 1992). In general, N optima depended on the response model and yield target, market (Hill, 1984), weather, soil type, and cropping systems (Hanks and Ritchie, 1991), and cultivar (Gianquinto and Bona, 2000; White et al., 2007). Bélanger et al. (2000) obtained N optima ranging from 108 to 230 kg N ha−1, averaging 171 kg N ha−1. Our model simulations returned optimal N doses within a wide range of values, from 87 kg N ha−1 to an outlier of 1,255 kg N ha−1 (Figure 5). Indeed, some response curves were so gentle (low Rate parameters) that optimal N doses were far above the highest N treatment. Such specific local conditions must be interpreted with care. Nevertheless, we obtained N optima between the 25 and 75% quantiles of 150 and 219 kg N ha−1 with a median of 172 kg N ha−1. In the case of a descriptive model at field level where soil and managerial conditions are known, scenarios of climatic conditions could also be tested to facilitate selecting the most appropriate N dosage or past N management practices can be compared to those computed by the model.
The multilevel model presented here accounts for several factors that impact on potato yield. Marshall (2000) listed other factors including soil compaction and pest management. Using data from the Québec soil degradation survey (Tabi et al., 1990), we estimated that 65% of potato soils were degraded compared to grassland used as reference, mainly due to compaction and loss of organic matter. Because N requirements depend on yield potential (Inman et al., 2005) and tuber yield is higher in high- compared to low-quality soils (Stalham et al., 2005; Boiteau et al., 2014), more research is needed to elucidate the relationship between fertilizer requirements, water input, other soil quality attributers and tuber yield and quality as soil conditions and crop management are improved.
Conclusion
In this paper, we developed a multilevel optimization model using a Québec data set to assess potato N requirements across several combinations of growth-limiting factors and to provide a new insight into crop response patterns for use in precision farming. Geophysical technologies of precision agriculture, digital soil maps, and meteorological stations can provide input data at low cost to run the model. The general model contains categorical as well as continuous variables that can be interpolated to fit intermediate local conditions. The model can be expanded to include tuber quality such as tuber size and specific weight.
The model could be tested as a predictive one with additional data and the use of machine learning algorithms. The tactical decision to split the N into several soil or foliar applications will also require additional modeling effort using more detailed meteorological information from stations closest to the field.
Author Contributions
S-ÉP developed the concepts and models, interpreted the results, and co-authored the manuscript. ML developed the pedological aspects. A-CP developed the climatic aspects. ZC co-authored the manuscript. LP coordinated the reasearch, interpreted the results, and co-authored the manuscript.
Funding
The authors acknowledge the financial support of the Natural Sciences and Engineering Council of Canada (CRDPJ 385199–09) and Centre Sève (IE510141).
Conflict of Interest Statement
The authors declare that the research was conducted in the absence of any commercial or financial relationships that could be construed as a potential conflict of interest.
Supplementary Material
The Supplementary Material for this article can be found online at: https://www.frontiersin.org/articles/10.3389/fenvs.2017.00081/full#supplementary-material
Supplementary Material 1. R code and data archive at https://github.com/essicolo/site-specific-multilevel-modeling-of-potato-response-to-nitrogen-fertilization.
Supplementary Material 2. Mean, standard errors, and covariance of coefficients of the Nitrogen multilevel model.
Abbreviations
[M·S−1], unit of mass per surface; [$·S−1], unit cost per surface; C, carbon; CND, Canadian dollars; DAP, days after planting; ETC, crop evapotranspiration; GDD, number of growing degree days; ha, hectare; ILR, isometric log-ratio; Mg, mega gram (ton); N, nitrogen; NLE, number of leaching events; SOM, soil organic matter; PPT, cumulative precipitation during the growing period; SBP, sequential binary partition; SDI, Shannon diversity index for rainfall distribution; TC, Thornthwaite class.
References
Aitchison, J., and Greenacre, M. (2002). Biplots of compositional data. J. R. Stat. Soc. Ser. C Appl. Stat. 51, 375–392. doi: 10.1111/1467-9876.00275
Alfred, B., Daniels, J. J., and Ehsani, M. R. (2008). Handbook of Agricultural Geophysics. Boca Raton, FL: CRC Press.
Allen, R., Pereira, L. S., Raes, D., and Smith, M. (1998). Crop Evapotranspiration: Guidelines for Computing Crop Requirements. Irrigation and Drainage Paper No. 56; Rome: FAO.
Alva, A. K., Collins, H. P., and Boydston, R. A. (2002). Corn, wheat, and potato crop residue decomposition and nitrogen mineralization in sandy soils under an irrigated potato rotation. Commun. Soil Sci. Plant Anal. 33, 2643–2651. doi: 10.1081/CSS-120014469
Andrén, O., and Kätterer, T. (1997). ICBM: the introductory carbon balance model for exploration of soil carbon balances. Ecol. Appl. 7, 1226–1236.
Baier, W., and Robertson, G. W. (1965). Estimation of latent evaporation from simple weather observations. Can. J. Plant Sci. 45, 276–284. doi: 10.4141/cjps65-051
Bélanger, G., Walsh, J. R., Richards, J. E., Milburn, P. H., and Ziadi, N. (2000). Comparison of three statistical models describing potato yield response to nitrogen fertilizer. Agron. J. 92, 902–908. doi: 10.2134/agronj2000.925902x
Boiteau, G., Goyer, C., Rees, H. W., and Zebarth, B. J. (2014). Differentiation of potato ecosystems on the basis of relationships among physical, chemical and biological soil parameters. Can. J. Soil Sci. 94, 463–476. doi: 10.4141/cjss2013-095
Bolinder, M. A., Andrén, O., Kätterer, T., de Jong, R., VandenBygaart, A. J., Angers, D. A., et al. (2007). Soil carbon dynamics in Canadian Agricultural Ecoregions: quantifying climatic influence on soil biological activity. Agric. Ecosyst. Environ. 122, 461–470. doi: 10.1016/j.agee.2007.03.001
Bolinder, M. A., Fortin, J. G., Anctil, F., Andrén, O., Kätterer, T., de Jong, R., et al. (2013). Spatial and temporal variability of soil biological activity in the Province of Québec, Canada (45–58 °N, 1960–2009)—calculations based on climate records. Clim. Change 117, 739–755. doi: 10.1007/s10584-012-0602-6
Bolinder, M. A., Kätterer, T., Andrén, O., Ericson, L., Parent, L.-E., and Kirchmann, H. (2010). Long-term soil organic carbon and nitrogen dynamics in forage-based crop rotations in Northern Sweden (63–64°N). Agric. Ecosyst. Environ. 138, 335–342. doi: 10.1016/j.agee.2010.06.009
Bouyoucos, G. J. (1962). Hydrometer method improved for making particle size analyses of soils1. Agron. J. 54, 464. doi: 10.2134/agronj1962.00021962005400050028x
Brisson, N., Gary, C., Justes, E., Roche, R., Mary, B., Ripoche, D., et al. (2003). An overview of the crop model stics. Eur. J. Agron. 18, 309–332. doi: 10.1016/S1161-0301(02)00110-7
Cambouris, A. N., Nolin, M. C., Zebarth, B. J., and Laverdière, M. R. (2006). Soil management zones delineated by electrical conductivity to characterize spatial and temporal variations in potato yield and in soil properties. Am. J. Potato Res. 83, 381–395. doi: 10.1007/BF02872015
Cescas, M. P. (1978). Table interprétative de la mesure du pH des sols du Québec par quatre méthodes différentes. Le Naturaliste Canadien 105, 259–263.
Chleborad, A. F. (2000). Preliminary Method for Anticipating the Occurrence of Precipitation-Induced Landslides in Seattle, Washington, DC. Available online at: http://pubs.usgs.gov/of/2000/0469/report.pdf
Colwell, J. D. (1994). Estimating Fertilizer Requirements a Quantitative Approach. Wallingford: CAB International.
Corre, M. D., Schnabel, R. R., and Stout, W. L. (2002). Spatial and seasonal variation of gross nitrogen transformations and microbial biomass in a Northeastern US grassland. Soil Biol. Biochem. 34, 445–457. doi: 10.1016/S0038-0717(01)00198-5
Dahnke, W. C., and Olson, R. A. (1990). “Soil test correlation, calibration, and recommendation,” in Soil Testing and Plant Analysis, 3rd Edn, ed R. L. Westerman (Madison WI: Soil Science Society of America), 45–71.
de Wit, C. T. (1992). Resource use efficiency in agriculture. Agric. Syst. 40, 125–151. doi: 10.1016/0308-521x(92)90018-j
Dueri, S., Calanca, P. L., and Fuhrer, J. (2007). Climate change affects farm nitrogen loss – A Swiss case study with a dynamic farm model. Agric. Syst. 93, 191–214. doi: 10.1016/j.agsy.2006.05.005
Egozcue, J. J., Pawlowsky-Glahn, V., Mateu-Figueras, G., and Barceló-Vidal, C. (2003). Isometric logratio transformations for compositional data analysis. Math. Geol. 35, 279–300. doi: 10.1023/A:1023818214614
Filzmoser, P., and Gschwandtner, M. (2015). “mvoutlier”: Multivariate Outlier Detection Based on Robust Methods. Available online at: https://cran.r-project.org/web/packages/mvoutlier/index.html
Fortin, J. G., Anctil, F., Parent, L. É., and Bolinder, M. A. (2008). Comparison of empirical daily surface incoming solar radiation models. Agric. For. Meteorol. 148, 1332–1340. doi: 10.1016/j.agrformet.2008.03.012
Fortin, J. G., Anctil, F., Parent, L. É., and Bolinder, M. A. (2010). A neural network experiment on the site-specific simulation of potato tuber growth in Eastern Canada. Comput. Electron. Agric. 73, 126–132. doi: 10.1016/j.compag.2010.05.011
Gee, G. W., and Bauder, J. W. (1986). “Particle-size analysis,” in Methods of Soil Analysis: Part 1 - Physical and Mineralogical Methods, ed A. Klute (Madison, WI: Soil Science Society of America; Agronomy M), 383–411.
Gianquinto, G., and Bona, S. (2000). Management of Nitrogen and Water in Potato Production, eds A. J. Haverkort and D. K. L. MacKerron (Wageningen: Pers), 35–54.
Gregory, P. J., and Simmonds, L. P. (1992). “Water relations and growth of potatoes,” in The Potato Crop - The Scientific Basis for Improvement, ed P. M. Harris (Dordrecht: Springer Netherlands), 214–246.
Hamza, M. A., and Anderson, W. K. (2005). Soil compaction in cropping systems: a review of the nature, causes and possible solutions. Soil Tillage Res. 82, 121–145. doi: 10.1016/j.still.2004.08.009
Hanks, J., and Ritchie, J. T. (1991). Modelling Plant and Soil Systems. Madison, WI: American Society of Agronomy.
Harmsen, K. (2000). A modified mitscherlich equation for rainfed crop production in semi-arid areas: 1. Theory. NJAS Wageningen J. Life Sci. 48, 237–250. doi: 10.1016/S1573-5214(00)80016-0
Haverkort, A. J., and Struik, P. C. (2015). Yield levels of potato crops: recent achievements and future prospects. Field Crops Res. 182, 76–85. doi: 10.1016/j.fcr.2015.06.002
Hill, W. A. (1984). “Effect of nitrogen nutrition on quality af three important root/tubere crops,” in Nitrogen in Crop Production, ed R. Hauck (Madison, WI: American Society of Agronomy), 627–641.
Hirel, B., Le Gouis, J., Ney, B., and Gallais, A. (2007). The challenge of improving nitrogen use efficiency in crop plants: towards a more central role for genetic variability and quantitative genetics within integrated approaches. J. Exp. Bot. 58, 2369–2387. doi: 10.1093/jxb/erm097
Hofman, G., and Salomez, J. (2000). “Nitrogen decision support systems in potato production,” in Management of Nitrogen and Water in Potato Production, eds A. J. Haverkort and D. K. L. MacKerron (Wageningen: Wageningen Academic Pub), 219–232.
Hutchinson, M. F., McKenney, D. W., Lawrence, K., Pedlar, J. H., Hopkinson, R. F., Milewska, E., et al. (2009). Development and testing of canada-wide interpolated spatial models of daily minimum–maximum temperature and precipitation for 1961–2003. J. Appl. Meteorol. Climatol. 48, 725–741. doi: 10.1175/2008JAMC1979.1
Inman, D., Khosla, R., Westfall, D. G., and Reich, R. (2005). Nitrogen uptake across site specific management zones in irrigated corn production systems. Agron. J. 97:169. doi: 10.2134/agronj2005.0169
Jiang, Y. F., Zebarth, B., and Love, J. (2011). Long-term simulations of nitrate leaching from potato production systems in Prince Edward Island, Canada. Nutr. Cycl. Agroecosyst. 91, 307–325. doi: 10.1007/s10705-011-9463-z
Joern, B. C., and Vitosh, M. L. (1995). Influence of applied nitrogen on potato part I: yield, quality, and Nitrogen uptake. Am. Potato J. 72, 51–63. doi: 10.1007/BF02874379
Kabat, P. (1995). Modelling and Parameterization of the Soil-Plant-Atmosphere System a Comparison of Potato Growth Models. Wageningen: Pers.
Karvonen, T., MacKerron, D. K. L., and Kleemola, J. (2000). “Role of simulation and other modelling approaches in decision making,” in Management of Nitrogen and Water in Potato Production, eds A. J. Haverkort and D. K. L. MacKerron (Wageningen: Wageningen Academic Pub), 250–261.
Kelling, K. A., Arriaga, F. J., Lowery, B., Jordan, M. O., and Speth, P. E. (2014). Use of hill shape with various nitrogen timing splits to improve fertilizer use efficiency. Am. J. Potato Res. 92, 71–78. doi: 10.1007/s12230-014-9413-9
Kleinkopf, G. E., and Dwelle, R. B. (1978). “Effect of nitrogen fertilization on tuber set and tuber size,” in Proceedings of the Idaho Potato School (Aberdeen, ID), 26–28.
Kleinkopf, G. E., Westermann, D. T., and Dwelle, R. B. (1981). Dry matter production and nitrogen utilization by six potato cultivars. Agron. J. 73, 799–802.
Kyveryga, P. M., Blackmer, A. M., and Morris, T. F. (2007a). Disaggregating model bias and variability when calculating economic optimum rates of nitrogen fertilization for corn. Agron. J. 99:1048. doi: 10.2134/agronj2006.0339
Kyveryga, P. M., Blackmer, A. M., and Morris, T. F. (2007b). Alternative benchmarks for economically optimal rates of nitrogen fertilization for corn. Agron. J. 99:1057. doi: 10.2134/agronj2006.0340
Leblanc, M. A., Gagné, G., and Parent, L. E. (2016). “Numerical clustering of soil series using profile morphological attributes for potato,” in Digital Soil Morphometrics, eds A. E. Hartemink and B. Minasny (New York, NY: Springer), 253–266. doi: 10.1007/978-3-319-28295-4_16
Levallois, P., Thériault, M., Rouffignat, J., Tessier, S., Landry, R., Ayotte, P., et al. (1998). Groundwater contamination by nitrates associated with intensive potato culture in Québec. Sci. Tot. Environ. 217, 91–101. doi: 10.1016/S0048-9697(98)00191-0
Li, H., Parent, L. É., Tremblay, C., and Karam, A. (1999). Potato response to crop sequence and nitrogen fertilization following sod breakup in a Gleyed Humo-Ferric Podzol. Can. J. Plant Sci. 79, 439–446. doi: 10.4141/p98-042
Liu, G. D., Simonne, E. H., Morgan, K. T., and Hochmuth, G. J. (2015). Soil and Fertilizer Management for Vegetable Production in Florida. Horticultural Sciences. Available online at: http://edis.ifas.ufl.edu/cv101 (Accessed November 30, 2015).
Madramootoo, C. A., Wiyo, K. A., and Enright, P. (1992). Nutrient losses through tile drains from two potato fields. Appl. Eng. Agric. 8, 639–686.
Madramootoo, C. A., Wiyo, K. A., and Enright, P. (1995). Simulating tile drainage and nitrate leaching under a potato crop. Water Resour. Bull. 31, 463–473.
Marshall, B. (2000). “Precision farming for the management of variability,” in Management of Nitrogen and Water in Potato Production, eds A. J. Haverkort and D. K. L. MacKerron (Wageningen: Wageningen Academic Pub), 275–287.
Mary, B., Recous, S., Darwis, D., and Robin, D. (1996). Interactions between decomposition of plant residues and nitrogen cycling in soil. Plant Soil 181, 71–82. doi: 10.1007/BF00011294
Moulin, A. P., Cohen, Y., Alchanatis, V., Tremblay, N., and Volkmar, K. (2012). Yield response of potatoes to variable nitrogen management by landform element and in relation to petiole nitrogen – A case study. Can. J. Plant Sci. 92, 771–781. doi: 10.4141/cjps2011-005
Neeteson, J. J. (1990). Development of nitrogen fertilizer recommendations for arable crops in the Netherlands in relation to nitrate leaching. Fertil. Res. 26, 291–298. doi: 10.1007/BF01048767
Nelson, L. A., and Sommers, L. E. (1982). “Total carbon, organic carbon, and organic matter,” in Methods of Soil Analysis. Part 2, ed A. L. Pare (Madison, WI: American Society of Agronomy; Agronomy M), 19–38.
Oksanen, J., Blanchet, F. G., Friendly, M., Kindt, R., Legendre, P., McGlinn, D., et al. (2015). “vegan”: Community Ecology Package. Available online at: https://cran.r-project.org/web/packages/vegan/index.html
Parent, S.-É., Parent, L. E., Egozcue, J. J., Rozane, D.-E., Hernandes, A., Lapointe, L., et al. (2013). The plant ionome revisited by the nutrient balance concept. Front. Plant Sci. 4:39. doi: 10.3389/fpls.2013.00039
Pawlowsky-Glahn, V., and Egozcue, J. J. (2006). “Compositional data and their analysis: an introduction,” in Compositional Data Analysis in the Geosciences: From Theory to Practice, eds A. Buccianti, G. Mateu-Figueras, and V. Pawlowsky-Glahn (London: The Geological Society of London), 1–10.
Peralta, J. M., and Stockle, C. O. (2002). Dynamics of nitrate leaching under irrigated potato rotation in Washington State: a long-term simulation study. Agric. Ecosyst. Environ. 88, 23–34. doi: 10.1016/S0167-8809(01)00157-8
Persson, J., and Kirchmann, H. (1994). Carbon and nitrogen in arable soils as affected by supply of N fertilizers and organic manures. Agric. Ecosyst. Environ. 51, 249–255. doi: 10.1016/0167-8809(94)90048-5
Piikki, K., Wetterlind, J., Söderström, M., and Stenberg, B. (2015). Three-dimensional digital soil mapping of agricultural fields by integration of multiple proximal sensor data obtained from different sensing methods. Precis. Agric. 16, 29–45. doi: 10.1007/s11119-014-9381-6
Pinheiro, J. C., and Bates, D. M. (2000). Mixed Effects Models in S and S-Plus. NewYork, NY: Springer Verlag.
Pinheiro, J., Bates, D., DebRoy, S., and Sarkar, D. (2015). nlme: Linear and Nonlinear Mixed Effects Models. Available online at: https://cran.r-project.org/web/packages/nlme/index.html
Prunty, L., and Greenland, R. (1997). Nitrate leaching using two potato-corn N-fertilizer plans on sandy soil. Agric. Ecosyst. Environ. 65, 1–13. doi: 10.1016/S0167-8809(97)00043-1
Rajsic, P., and Weersink, A. (2008). Do farmers waste fertilizer? A comparison of ex post optimal nitrogen rates and ex ante recommendations by model, site and year. Agric. Syst. 97, 56–67. doi: 10.1016/j.agsy.2007.12.001
Rees, H. W., Chow, T. L., Xing, Z., Li, S., Monteith, J. O., and Stevens, L. (2015). Depth to compact subsoil effects on soil properties and barley–potato yields on a loamy soil in New Brunswick. Can. J. Soil Sci. 95, 203–218. doi: 10.4141/cjss-2014-038
Saluzzo, J. A., Echeverria, H. E., Andrade, F. H., and Huarte, M. (1999). Nitrogen nutrition of potato cultivars differing in maturity. J. Agron. Crop Sci. 183, 157–165. doi: 10.1046/j.1439-037x.1999.00323.x
Sands, P. J., Hackett, C., and Nix, H. A. (1979). A model of the development and bulking of potatoes (Solanum tuberosum L.) I. Derivation from well-managed field crops. Field Crops Res. 2, 309–331. doi: 10.1016/0378-4290(79)90031-5
Satchithanantham, S. (2013). Water Management Effects on Potato Production and the Environment. University of Manitoba, Winnipeg, MB.
Shepherd, M. A. (2000). “Using nitrogen status in practice – the need for decision support systems,” in Management of Nitrogen and Water in Potato Production, eds A. J. Haverkort and D. K. L. MacKerron (Wageningen: Pers; Wage; Academic Pub), 165–173.
Soil Classification Working Group (1998). The Canadian System of Soil Classification, 3rd Edn. Publication 1646.
Stalham, M. A., Allen, E. J., and Henry, F. X. (2005). Research Review: Effects of Soil Compaction on Potato Growth and Its Removal by Cultivation. Available online at: https://potatoes.ahdb.org.uk/sites/default/files/publication_upload/R261%20CUF%20Compaction%20Review%20R261.pdf
Stevenson, F. (1986). Cycles of Soil, Carbon, Nitrogen, Phosphorus, Sulfur, Micronutrients. New York, NY: Wiley Interscience.
Stewart, C. E., Plante, A. F., Paustian, K., Conant, R. T., and Six, J. (2008). Soil carbon saturation: linking concept and measurable carbon pools. Soil Sci. Soc. Am. J. 72, 379–392. doi: 10.2136/sssaj2007.0104
Tabi, M., Tardif, L., Carrier, D., Laflamme, G., and Rompr,é, M. (1990). Inventaire des Problèmes de Dégradation des Sols Agricoles du Québec. Rapport synthèse. Québec, QC.
Templ, M., Hron, K., and Filzmoser, P. (2015). “robCompositions”: Robust Estimation for Compositional Data. Available online at: https://cran.r-project.org/web/packages/robCompositions/index.html
Thomsen, I. K., Schjønning, P., Jensen, B., Kristensen, K., and Christensen, B. T. (1999). Turnover of organic matter in differently textured soils. Geoderma 89, 199–218. doi: 10.1016/S0016-7061(98)00084-6
Tonitto, C., David, M. B., and Drinkwater, L. E. (2006). Replacing bare fallows with cover crops in fertilizer-intensive cropping systems: a meta-analysis of crop yield and N dynamics. Agric. Ecosyst. Environ. 112, 58–72. doi: 10.1016/j.agee.2005.07.003
Tran, T. S., and Giroux, M. (1991). Effects of N rates and harvest dates on the efficiency of 15 N-labelled fertilizer on early harvested potatoes (Solanum tuberosum L.). Can. J. Soil. Sci. 71, 519–532. doi: 10.4141/cjss91-050
Tremblay, N., Bouroubi, Y. M., Bélec, C., Mullen, R. W., Kitchen, N. R., Thomason, W. E., et al. (2012). Corn response to nitrogen is influenced by soil texture and weather. Agron. J. 104:1658. doi: 10.2134/agronj2012.0184
University of Toronto (2013). Maps and Data Library. Canada Daily Precipitation and Temperature Values, 1950-2013. Government of Canada. Available online at: http://maps.library.utoronto.ca/datapub/canada/canada_daily1950-2010/index.php (Accessed April 20, 2002).
Valkama, E., Salo, T., Esala, M., and Turtola, E. (2013). Nitrogen balances and yields of spring cereals as affected by nitrogen fertilization in northern conditions: a meta-analysis. Agric. Ecosyst. Environ. 164, 1–13. doi: 10.1016/j.agee.2012.09.010
van den Boogaart, K. G., Tolosana-Delgado, R., and Bren, M. (2014). “compositions”: Compositional Data Analysis in R package. Available online at: http://cran.r-project.org/package=compositions.
Viscarra Rossel, R. A., Behrens, T., Ben-Dor, E., Brown, D. J., Demattê, J. A. M., Shepherd, K. D., et al. (2016). A global spectral library to characterize the world's soil. Earth Sci. Rev. 155, 198–230. doi: 10.1016/j.earscirev.2016.01.012
White, P. J., Wheatley, R. E., Hammond, J. P., and Zhang, K. (2007). Potato Biology and Biotechnology: Advances and Perspectives, ed D. Vreugdenhil (Oxford, UK: Elsevier B.V), 739–752.
Wickham, H., and Chang, W. (2015). “ggplot2”: An Implementation of the Grammar of Graphics. Available online at: http://cran.r-project.org/web/packages/ggplot2/index.html.
Wickham, H., Francois, R., Henry, L., and Müller, K., (2015). “dplyr”: A Grammar of Data Manipulation. Available online at: https://cran.r-project.org/web/packages/dplyr/index.html
Keywords: crop modeling, potato, fertilization, nitrogen, precision agriculture
Citation: Parent S-É, Leblanc MA, Parent A-C, Coulibali Z and Parent LE (2017) Site-Specific Multilevel Modeling of Potato Response to Nitrogen Fertilization. Front. Environ. Sci. 5:81. doi: 10.3389/fenvs.2017.00081
Received: 06 February 2017; Accepted: 17 November 2017;
Published: 01 December 2017.
Edited by:
Xuan Zhu, Monash University, AustraliaReviewed by:
Paul Christiaan Struik, Wageningen University and Research, NetherlandsVenkata Ravibabu Mandla, National Institute of Rural Development and Panchayati Raj, India
Copyright © 2017 Parent, Leblanc, Parent, Coulibali and Parent. This is an open-access article distributed under the terms of the Creative Commons Attribution License (CC BY). The use, distribution or reproduction in other forums is permitted, provided the original author(s) or licensor are credited and that the original publication in this journal is cited, in accordance with accepted academic practice. No use, distribution or reproduction is permitted which does not comply with these terms.
*Correspondence: Serge-Étienne Parent, serge-etienne.parent.1@ulaval.ca