Controlling Bacterial Pathogens in Water for Reuse: Treatment Technologies for Water Recirculation in the Blue Diversion Autarky Toilet
 Mi T. Nguyen1,2
  Lukas Allemann1 Christopher Ziemba1,3 Odile Larivé1,4
  Eberhard Morgenroth1,3
  Timothy R. Julian1*
- 1Eawag, Swiss Federal Institute of Aquatic Science and Technology, Dübendorf, Switzerland
- 2Nguyen Tat Thanh Hi-Tech Institute, Nguyen Tat Thanh University, Ho Chi Minh City, Vietnam
- 3ETH Zürich, Institute of Environmental Engineering, Zurich, Switzerland
- 4EPFL, School of Architecture, Civil and Environmental Engineering, Lausanne, Switzerland
Highlight
• Bacterial growth in fecally-contaminated water is highly variable and dependent on several factors.
• Regrowth occurs after chlorination (low doses, no residual).
• Indigenous microbial communities variably impact bacterial growth.
• A combination of treatments can both inactivate and inhibit growth.
The Blue Diversion AUTARKY Toilet is a urine-diverting toilet with on-site treatment. The toilet is being developed to provide a safe and affordable sanitation technology for people who lack access to sewer-based sanitation. Water used for personal hygiene, hand washing, and flushing to rinse urine- and feces-collection bowls is treated, stored, and recycled for reuse to reduce reliance on external water supplies. The system provides an opportunity to investigate hygiene of water for reuse following treatment. Treatment in the toilet includes a Biologically Activated Membrane Bioreactor (BAMBi) followed by a secondary treatment technology. To identify effective secondary treatment, three options, including granular activated carbon (GAC) only, GAC+chlorine (sodium hypochlorite), and GAC+electrolysis are considered based on the bacterial inactivation and growth inhibition efficiency. Four different hygiene-relevant bacteria are tested: Escherichia coli, Enterococcus faecalis, Pseudomonas aeruginosa, and Salmonella typhimurium. Our evaluation demonstrates that—despite treatment of water with the BAMBi—E. coli, P. aeruginosa, and S. typhimurium have the potential to grow during storage in the absence of microbial competition. Including the indigenous microbial community influences bacterial growth in different ways: E. coli growth decreases but P. aeruginosa growth increases relative to no competition. The addition of the secondary treatment options considerably improves water quality. A column of GAC after the BAMBi reduces E. coli growth potential by 2 log10, likely due to the reduction of carbon sources. Additional treatments including chlorination and electrolysis provide further safety margins, with more than 5 log10 inactivation of E. coli. However, reactivation and/or regrowth of E. coli and P. aeruginosa occurs under in the absence of residual disinfectant. Treatment including the BAMBi, GAC, and electrolysis appear to be promising technologies to control bacterial growth during storage in water intended for reuse.
Introduction
Two-thirds of the world's population suffer from water scarcity (United Nations, 2012; Global Water Institute, 2013; Mekonnen and Hoekstra, 2016). Water recovery and reuse from diverse sources (i.e., graywater, wastewater, stormwater) can help to increase water efficiency and reduce impacts of scarcity. However, reuse may pose risks to environmental and human health, especially when source water is fecally-contaminated (Christova-Boal et al., 1996; Gross et al., 2005; Wiel-Shafran et al., 2006). Fecally-contaminated water (water containing feces, such as blackwater, brownwater, and wastewater) may contain high concentrations of microbial contamination, including fecal bacteria (e.g., E. coli, enterococci), enteric pathogens (e.g., Salmonella typimurium, Cryptosporidium spp., Giardia spp.), and/or opportunistic pathogens (e.g., Pseudomonas aeruginosa) (Christova-Boal et al., 1996; Albrechtsen, 2002; O'Toole et al., 2012; Katukiza et al., 2015). Exposures during reuse like inhaling aerosols generated from toilet flushing, indirect ingestion via hand-to-mouth contacts, unintentional ingestion (Christova-Boal et al., 1996), or consumption of plants irrigated using fecally-contaminated water (Shuval et al., 1997; Mara et al., 2007) may contribute to disease transmission (Morel and Diener, 2006).
Risks from fecally-contaminated water reuse can be mitigated through safe management, including chemical and physical disinfection. Disinfection reduces the concentration of pathogens in water and helps prevent pathogen growth during subsequent distribution and/or storage. Chlorine disinfection (1.4 mg L−1 with 30 min exposure, or 42 mg min L−1) was shown to be effective in inactivating fecal coliforms in treated graywater, with no regrowth (or growth following disinfection) (Friedler et al., 2006). Membrane filtration (e.g., MBR, ultrafiltration) used to treat graywater achieved up to 4 log10 removal of fecal coliforms (Friedler et al., 2006). UV irradiation (25–40 mJ cm−2, unreported water thickness) was also shown to be effective in lowering total coliforms (to 2–500 CFU/100 mL) and fecal coliforms (to 2–30 CFU/100 mL) to meet German quality guidelines for graywater reuse (Nolde, 2000). In another study, Gilboa and Friedler (2008) report observing no regrowth of fecal coliforms, P. aeruginosa, or Staphylococcus aureus after exposure to UV disinfection (0–439 mJ cm−2, unreported water thickness) up to 6 h (Gilboa and Friedler, 2008). Although treatment processes can significantly reduce the concentration of bacteria, regrowth can occur in treated fecally-contaminated water during storage and distribution due to the availability of assimilable organic carbon (AOC) and the loss of disinfectant residual (Jjemba et al., 2010; Thayanukul et al., 2013; Lin et al., 2016). Other factors can affect the growth of pathogens in disinfected water, including type and concentration of available nutrients, type and concentration of residual disinfectant, presence of indigenous community, water age, pipe materials, and environmental conditions (Wang et al., 2014; Prest et al., 2016).
In this study, risks from reuse of fecally-contaminated water in the Blue Diversion Autarky Toilet (BDAT, http://www.autarky.ch) were investigated. The BDAT was developed by Eawag (Dübendorf, Switzerland) and designed by EOOS (Vienna, Austria) to provide a sanitation option that is safe, affordable, and off-the-grid (Larsen et al., 2015). As a source-separating toilet, the BDAT has urine and feces separately collected and treated for resource recovery. The BDAT also provides and recycles running water, with a design flow rate of 75 L/day for 10 users (Larsen et al., 2015). Despite the source separation strategy, between 1 and 2% of the urine and feces produced by the users enter into the water recycling system. After the BDAT is primed with water from local sources, the water is filtered through a biologically activated membrane bioreactor (BAMBi) composed of aerated flatsheet polyethersulfone membranes with a nominal cutoff of 150 kDa. The BAMBi achieves low, but stable, gravity-driven flux, with the stability attributed to biological activation of the membrane surface (Künzle et al., 2015). After filtration through the BAMBi, permeate water is stored in a 30 L clean water tank to be used for toilet flushing, hand washing, and personal hygiene before being collected and recirculated back to the BAMBi. This permeate water still contains 40–50 mg L−1 of dissolved organic carbon (DOC). The addition of a granular activated carbon (GAC) filter into the top of the clean water tank has demonstrated the ability to reduce this DOC concentration significantly without impacting system operation. The compatibility between permeate water either with or without the GAC treatment and any pathogens that may enter the system is not well-understood, and therefore represents a potential obstacle to the safe utilization of the BDAT.
The specific goal of this study was to evaluate bacterial growth, inactivation, and reactivation/regrowth in treated water during storage within the BDAT. Growth is defined, here, as an increase in cell concentration by either total cell count (TCC), or colony forming units (CFU). Reactivation or regrowth is defined, here, as growth following an observed decrease in cell concentration due to treatment processes. Two fecal indicators (Escherichia coli and Enterococcus faecalis) and two pathogens (Pseudomonas aeruginosa and Salmonella typhimurium) were chosen to study behaviors of waterborne pathogens. Bacterial concentrations were measured using culture method (spreading on selective-media plates) and flow cytometry [TCC and intact cell counts (ICC)]. Results from this study improve the understanding of inactivation and growth/regrowth of fecal indicators and pathogens in water for reuse in the context of the BDAT and other water recycling systems.
Methods
Two sets of experiments were performed: (1) growth potential assays to assess bacterial growth within stored water, and (2) disinfection assays to assess bacterial inactivation and reactivation. Both sets of experiments were performed using aliquots of water collected from within the BDAT following treatment by either the BAMBi alone or the BAMBi and the GAC (BAMBi+GAC).
Blue Diversion AUTARKY Toilet
Water for the experimental assays was collected from full-scale BDATs using recreated influent to mimic expected flush water, hand wash water, and personal hygiene water. The BDAT design and operation was previously described by Larsen et al. (2015); and the BAMBi was previously described by Künzle et al. (2015). The recreated influent contained 12.5 g feces, 25 mL urine, and 2.5 g hand soap (Consumerline Products, Kenya) in 1 L of tap water. This influent mixture was prepared every 3–4 days, refrigerated at 4°C and stirred at ~50 RPM. The feces and urine were collected from a urine-diverting dry toilet at Eawag. Feces were collected weekly, homogenized with a blender, and stored at −20°C for up to 60 days. Urine was stored at room temperature for up to 48 h. In the BAMBi tank, the recreated influent is mixed with recirculated, treated water from the storage tank at a ratio of 1:20.
The full-scale BDAT treatment included a 50-L BAMBi tank with nine panels of polyethersulfone ultrafiltration membrane UP150 (Microdyn Nadir, Wiesbaden, Germany) with a nominal cut-off of 150 kDa, seeded with 0.5 L of municipal wastewater sludge. Aeration was achieved by pumping air (0.2-m3 h−1) through a perforated pipe underneath the membrane to maintain aerobic conditions on the exterior of the biofilm within the BAMBi tank. Water filtered through the BAMBI is then pumped into a 30-L clean water tank, which housed one or more of the post-treatment options: (1) GAC—to treat the remaining of organic matter and to reduce color (pore size of 0.6–1 mm, Norit Americas Inc., USA), (2) chlorination—to disinfect water using sodium hypochlorite (Fluka Chemie, Switzerland), and (3) electrolysis—to provide on-site chlorine for disinfection (Condias, Germany).
Collecting and Preparing Water Samples
Water samples (20 L) were collected from the clean water tanks of two BDATs: one operating with only the BAMBi (after BAMBi), and one with the addition of a 6 L-GAC column after the BAMBi (after BAMBi+GAC). The samples were prepared followed a method modified from Vital et al. (2008) to remove indigenous microorganisms. Indigenous microorganisms were removed to preserve water quality at the time of collection so that a consistent source water could be used for all studies. Otherwise, storage of water with indigenous community intact would have led to water quality changes due to continued microbial activity and may have interfered with growth of target bacteria. Specifically, samples were filtered through a 1-μm pressurized filter (Geberit, Germany), pasteurized at 80°C for 60 min, and filtered again through a 0.2-μm membrane filter (Whatman, UK).
Notably, pretreatment did not substantially affect the concentration or characterization of DOC, as shown from chromatograms measured using an LC-OCD instrument for water samples before and after the procedure of filtration and pasteurization [Figure S1, Supporting Information (SI)]. All samples were processed within 6 h after collection and stored at 4°C until used. In this study, prepared water is referred to water after mentioned pasteurization and filtration steps. Characteristics of prepared water samples, including concentration of anions (, , , , Cl−) and cations (Ca2+, Mg2+, Na+, K+, Fe3+/2+, Mn2+, Cu2+, Ba2+), were analyzed by the Engineering Analytical Laboratory at Eawag.
Bacterial Strains
Four bacteria used in this study include two isolated indicators from wastewater [Escherichia coli (GenBank KU737538) and Enterococcus faecalis (GenBank KU737539)] and two pathogens [Pseudomonas aeruginosa PAO1 (ATCC 15692) and Salmonella typhimurium SB300 (provided by Dr. M. Suar from Institute of Microbiology, ETH Hönggerberg, Switzerland)]. The wastewater isolates were confirmed as E. coli and Ent. faecalis using 16sRNA sequencing (Microsynth, Switzerland). All experiments involved the four bacteria of interest were conducted under proper procedures in a Biosafety Level 2 laboratory at Eawag. Further details of sequencing and bacterial preparation are provided in the SI.
Growth Potential Experiments
The experiments were set up following the pathogen growth potential assay of Vital et al. (2010). Target bacteria were grown overnight and seeded at an initial concentration of ~103 cells mL−1 with 20 ml prepared water samples (20 mL) into 40 mL carbon-free glass vials. Vials were then incubated at 30°C in 72 h in the dark to reach stationary phase. Samples (1 mL) were taken at the beginning, end and intermittently throughout to measure bacterial concentration using both flow cytometry and culture. Sterilized distilled water was included as negative controls. AOC concentration was defined by the growth of the indigenous community: 1 μg AOC L−1 = 107 cells L−1 (Hammes and Egli, 2005).
Bacterial Competition Assays
To measure growth of bacteria in competition with the indigenous community, vials with prepared water samples and bacteria of interest were inoculated with raw water samples such that the indigenous community was seeded to a concentration of 103 cells mL−1.
Nutrient Limitation Assays
Nutrient limitations to growth for the bacteria were determined by supplementing with additional sources of carbon (C) [300 mg L−1 sodium acetate (CH3COONa, Fluka Chemie, Switzerland)], nitrogen (N) [5 mg L−1 ammonium sulfate ((NH4)2SO4, Sigma-Aldrich, Germany)], phosphorus (P) [80 mg L−1 sodium phosphate dibasic (Na2HPO4, Sigma-Aldrich, USA)], and iron (Fe) [5 mg L−1 ferric chloride (FeCl3, Sigma-Aldrich, USA)]. The concentrations were chosen to be at least 10 times higher than in concentrations of C, N, P, and Fe measured in the water after BAMBi.
Nutrient limitations for Ent. faecalis were further evaluated by supplementation of minimal media Davis broth (7 g L−1 of K2HPO4, 2 g L−1 of KH2PO4, 0.5 g L−1 of sodium citrate, 0.1 g L−1 of MgSO4, 1 g L−1 of NH4SO4, supplemented with 100 mg L−1 of thiamine, 0.1% glucose), vitamins [biotin, calcium, pantothenic acid, and pyridoxine (each at 20 μg mL−1), nicotinic acid and riboflavin (each at 2 μg mL−1), folic acid (0.2 μg mL−1)], and 20 amino acids (each at 20 μg mL−1) (Murray et al., 1993). All experiments were conducted in triplicates.
Inactivation and Regrowth Experiments
Inactivation Experiments
Water after BAMBi+GAC was used for the inactivation and regrowth experiments. E. coli and P. aeruginosa were tested in the inactivation experiments due to their ability to grow in water after BAMBi+GAC without the need for additional nutrients (See Results section Growth of Bacteria in Waters from the BDAT). Overnight incubated cells were added to prepared water samples to reach final concentration of ~105 cells mL−1, and then exposed to a disinfectant (chlorine or electrolysis). When chlorine was used directly as disinfectant, sodium hypochlorite (10%, Fluka Chemie, Switzerland) was added to the mixture of 100 mL of water after BAMBi+GAC to establish initial concentrations of 0.07, 0.14, 0.2, 0.5, 1.7, and 3.4 mg Cl2 mL−1. The initial concentrations of chlorine were 1×, 2×, 3×, 7×, 24× and 49× higher than the total chlorine demand of the water after BAMBi+GAC. The polyvinylidene fluoride electrolysis unit (Condias, Germany) used to produce disinfectants has a dimension of 4.5 × 3.5 × 22.5 cm (l × w × h) and four niobium substrate electrodes, each with a boron-doped diamond coating. The electrolysis unit was run at 0.5, 5, and 20 W at a recirculating flow rate of 7 L h−1 in total of 30 min. Samples were collected at 0, 5, 15, and 30 min after disinfection exposure. Free and total chlorine concentrations were measured using the DBD method (Hach LCK 310, Germany) at the same time as bacterial concentrations (Table S1). After each time point, sodium thiosulfate solution (Na2S2O3, stock concentration of 46 g L−1) was added to samples to quench residual chlorine prior to bacterial quantification. All experiments were conducted in triplicates.
Reactivation/Regrowth Experiments
To determine whether bacteria can reactivate or regrow after inactivation, water samples after 30 min of each inactivation experiment were aliquoted in 40 mL carbon free glass vials and incubated at 30°C in the dark for 72 h. A subset of the samples exposed to direct chlorination and electrolysis were treated with sodium thiosulfate solution (46 g L−1) to quench residual chlorine before regrowth experiments to isolate the impact of treatment from residual chlorine on reactivation or regrowth. An increase in bacterial concentration of more than 10 cell mL−1 after 72 h of incubation was considered as reactivation or regrowth. Additionally, to determine the effect of each post-treatment on bacterial growth potential, overnight incubated bacterial cells were also added to water samples after each inactivation experiment (initial concentration of 103 cells mL−1). All experiments were conducted in triplicates.
Bacterial Concentration Measurements
Culture and flow cytometry (FCM) methods were used to measure concentrations of bacteria in water samples. Samples were analyzed immediately after collection. Further details are in SI.
Calculating Net Growth/Growth Potential and Growth Coefficient
Net Growth/Growth Potential
Net growth of bacteria or growth potential of a water sample is defined here as the difference between the final cell concentration in the stationary phase and the initial cell concentration at the beginning when the bacterial inoculum was introduced in the water sample (Vital et al., 2010). Bacteria were considered to grow in a water sample only when the minimum net growth was 103 cells mL−1 (Vital et al., 2010).
Growth Coefficient
A sigmoid function was used to fit an S-shaped growth curve to each growth potential data set shown in Figure 1 (Zwietering et al., 1990). Parameters of the sigmoid function for each data set are shown in Table S1.
where ymin and ymax are minimum and maximum values of log concentration, respectively. t is time (h), and logEC50 is t-value when y-value is halfway between ymin and ymax. is the slope of the exponential phase, or growth coefficient of bacterium i (i = E for E. coli, P for P. aeruginosa, S for S. typhimurium, Ent for Ent. faecalis) in water sample j (j = BAMBi for water after BAMBi, and GAC for water after BAMBi+GAC).
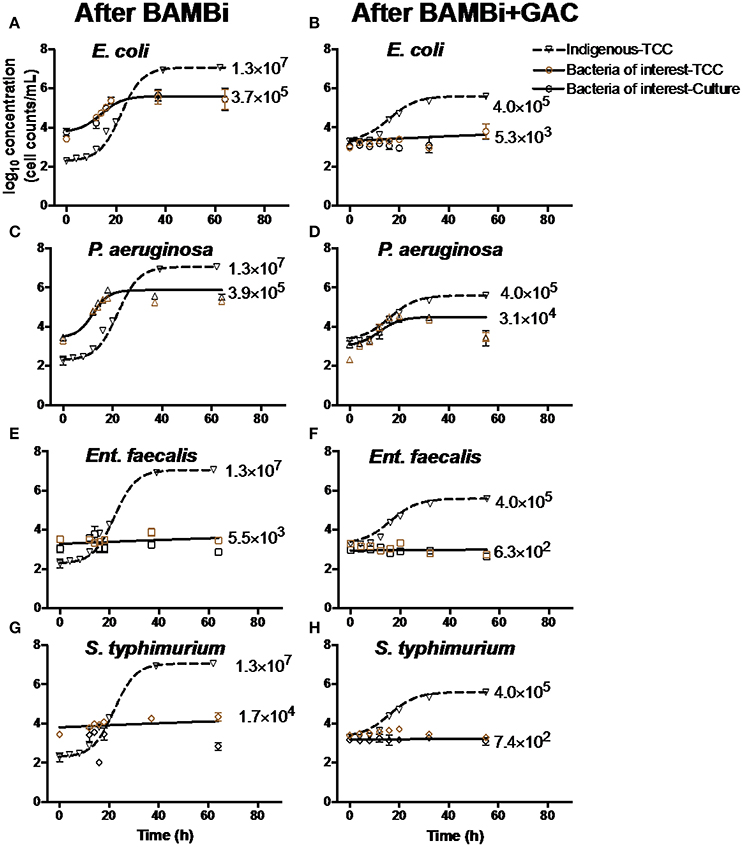
Figure 1. Growth curves of indigenous communities, (A,B) E. coli, (C,D) P. aeruginosa, (E,F) Ent. faecalis, and (G,H) S. typhimurium in water after BAMBi and after BAMBi+GAC. Concentrations of bacteria were measured using culture method and FCM for TCC. Growth curves of the indigenous bacteria (▽) were added in each figure to compare with the growth of the bacteria of interest ( for TCC, and ◦ for culture method). Negative controls and samples with Ent. faecalis and S. typhimurium did not show significant change in bacterial concentration during the course of the experiments. Net growth of each bacteria (CFU/mL) is shown next to each growth curve. More details of the growth curves can be found in Table S1.
Statistical Analysis
GraphPad Prism 6.0.1 (GraphPad Software, USA) was used to perform statistical tests. Non-linear regression was performed to fit the sigmoid function to each bacterial growth curve and calculate growth coefficients. Comparison of net growth, growth coefficients, and water characteristics was conducted using either paired t-tests or two-way ANOVA. All statistical tests assumed an alpha of 0.05.
Results
Water Characteristics
Water treated with the BAMBi had generally higher nutrient and metal ion concentrations than water treated with the BAMBi and GAC (Table 1). Specifically, DOC, , , and Cu2+ were statistically significantly lower in the BAMBi+GAC than the BAMBi (Student's t-test with Sidak correction, p < 0.05, Table 1). Although reductions were observed for pH, AOC, , Cl−, Na+, K+, Ca2+, and Mg2+, the reduction was not statistically significant (Student's t-test with Sidak correction, p > 0.05).
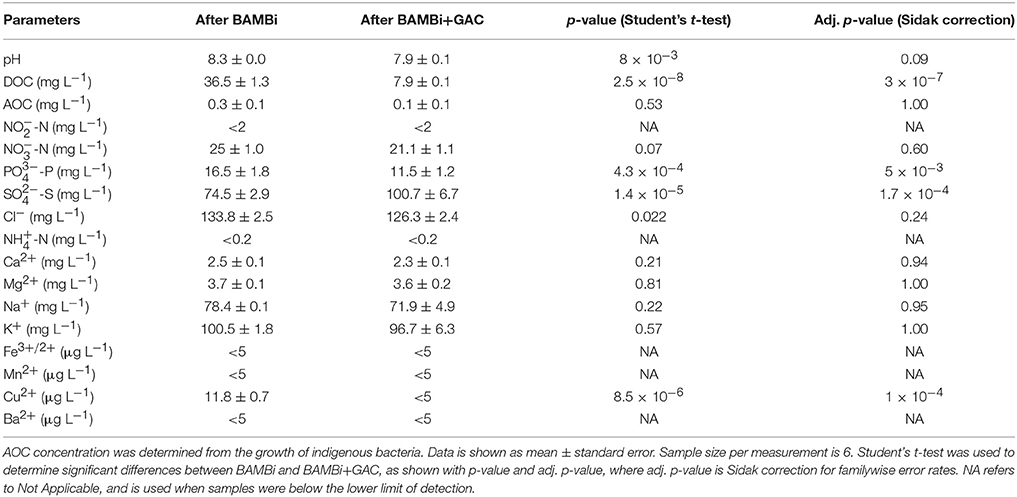
Table 1. Characteristics of water after BAMBi and after BAMBi+GAC.
Growth of Bacteria in Waters from the BDAT
The indigenous microbial community, E. coli, and P. aeruginosa, grew in both waters during storage, whereas Ent. faecalis and S. typhimurium only grew in water after treated with BAMBi (Figure 1). The indigenous microbial community grew to a higher concentration in water after treatment with the BAMBi alone (Net growthBAMBi = 1.3 × 10⁷ cells mL−1) as compared to the BAMBi+GAC (4.0 × 10⁵ cells mL−1, Figure 1). The indigenous community also grew faster in water after BAMBi () than BAMBI+GAC (, Table S1). Similarly, the growth of both P. aeruginosa and E. coli in water treatment with BAMBi was higher than in water treated with BAMBi+GAC (56% more for P. aeruginosa, and 38% more for E. coli, Table S1). While P. aeruginosa had similar growth coefficient in both waters (Table S1), E. coli grew faster in water after BAMBi compared to in water after BAMBi+GAC ().
There was a good agreement between TCC data and culture data for all four bacteria of interest in both water samples (two-way ANOVA, p > 0.05).
Factors Influencing Bacterial Growth
Nutrient Addition
The addition of all four nutrients (C, N, P, and Fe) individually or in combination increased the net growth of E. coli and S. typhimurium compared to the control samples (two-way ANOVA, p < 0.05, Figure 2). The growth of P. aeruginosa significantly increased when C, N, and P were added (two-way ANOVA, p < 0.05, Figure 2). The addition of C appeared to dramatically increase the growth of E. coli and P. aeruginosa (approximately two times higher compared to the addition of other nutrients). The growth of S. typhimurium approximately doubled with the addition of Fe compared to other nutrients.
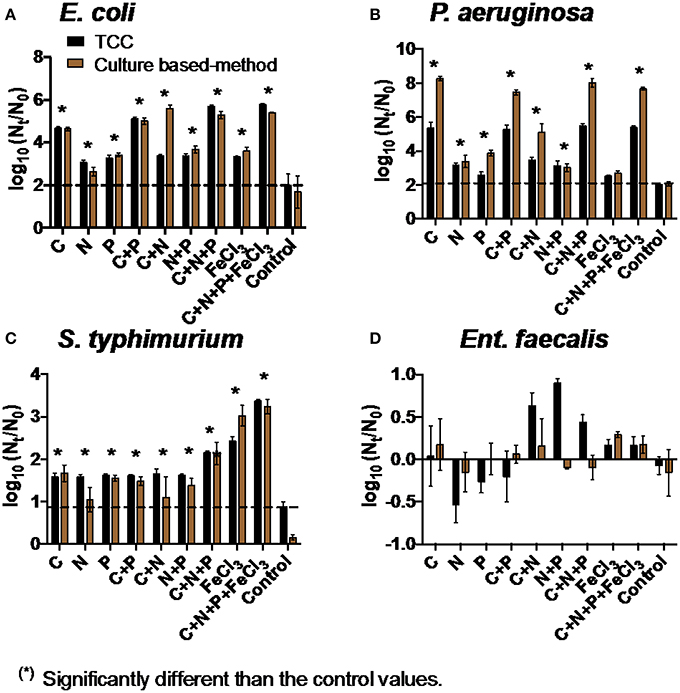
Figure 2. Net growth [log10(Nt/N0)] of (A) E. coli, (B) P. aeruginosa, (C) S. typhimurium, and (D) Ent. faecalis in the addition of C, N, P, and Fe in water after BAMBi after 72 h. Controls refer to water after BAMBi without any nutrient supplementation. Dashed lines were drawn for comparison with the highest value of the controls in each experiment. Star symbols indicated that the values were significantly higher than the corresponding control values according to two-way ANOVA test for both TCC and culture data (p < 0.05). No significant differences were observed for Ent. faecalis.
Although the addition of C, N, P, and Fe did not show any positive effect on the growth of Ent. faecalis in water after BAMBi (Figure 2D), at least some bacterial growth was observed in the presence of minimal media (Davis media), amino acids, or vitamins with the largest effect size observed in the presence of all three (Figure S3).
There was a good agreement between TCC data and culture data for E. coli, Ent. faecalis, and S. typhimurium (two-way ANOVA, p > 0.05).
Indigenous Communities
The presence of an indigenous microbial community typically, but not always, reduced the extent of growth of the target bacteria E. coli, Ent. faecalis, and S. typhimurium, but supported the growth of P. aeruginosa (Figure 3). Inhibition of E. coli appeared greatest: E. coli was not detected (Nt < 10 cell mL−1) after 72 h of incubation with the indigenous communities in both waters despite growth in the absence of the indigenous community. The indigenous community increased the growth of P. aeruginosa (two-way ANOVA, p < 0.05), with the BAMBi+GAC community having a bigger effect on the bacterial growth than the BAMBi community (Figure 3).
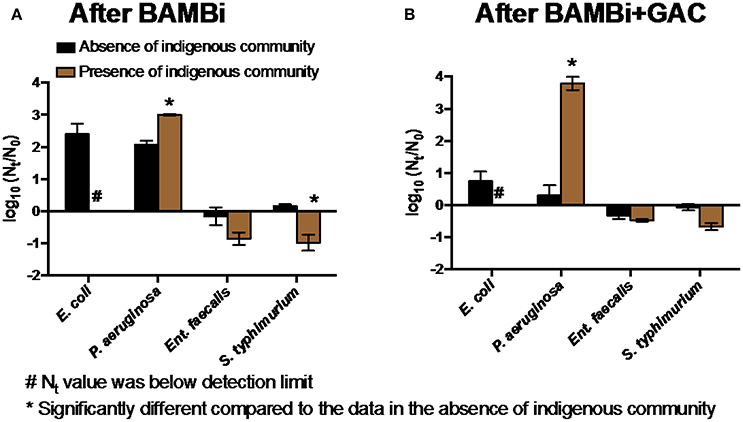
Figure 3. Net growth [log10(Nt/N0)] of four tested bacteria in the presence and absence of (A) the BAMBi indigenous community in water after BAMBi and (B) the GAC indigenous community in water after BAMBi+GAC. Concentration at t = 72 h of E. coli in the presence of the indigenous communities was below detection limit (Nt < 10 CFU mL−1). Star symbols indicated that the values in the presence and absence of the indigenous communities were significantly different (two-way ANOVA test, p < 0.05).
Disinfection Processes
Inactivation
Chlorination and electrolysis treatment options were tested for the efficiency of inactivation of E. coli and P. aeruginosa. Inactivation of E. coli was measured at various initial chlorine concentrations (0.07–3.4 mg Cl2 L−1, Figures 4A,B). As chlorine demand of water after BAMBi+GAC was 0.14 mg Cl2 L−1, there was no observed inactivation of E. coli when chlorine concentrations were lower or equal to 0.14 mg Cl2 mL−1. At higher initial chlorine concentrations (≥0.5 mg Cl2 L−1), more than 5 log10 inactivation of culturable E. coli was achieved after 5 min. Electrolysis at different intensities (0.5–20 W) was also shown to be effective in inactivating E. coli (>5 log10 inactivation after 5 min at all tested intensities of electrolysis, Figure 4C). Chlorination and electrolysis were shown to be effective in inactivating P. aeruginosa (>5 log10 inactivation after 5 min, Figures 5A,B). Concentration of free and total chlorine during each electrolysis and chlorination experiment is shown in Figure S2 and Table S1, respectively.
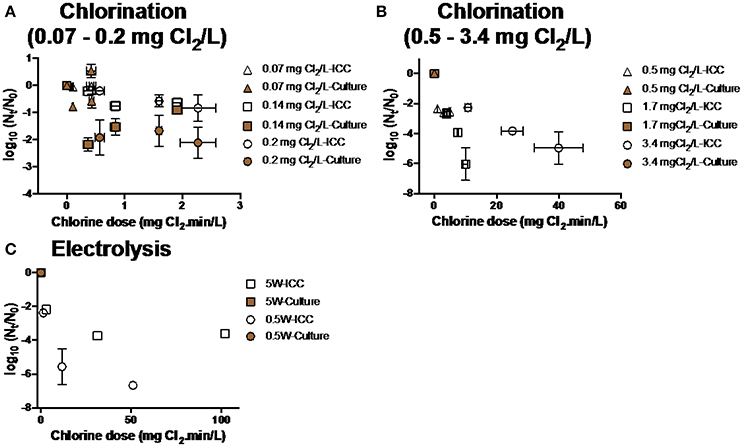
Figure 4. Inactivation of E. coli at various conditions during (A,B) chlorination and (C) electrolysis. Note that samples were measured using both FCM and culture based method data at every single time point. Culture data of some of the time points was not shown because their Nt-values were below detection limit (<10 CFU mL−1).
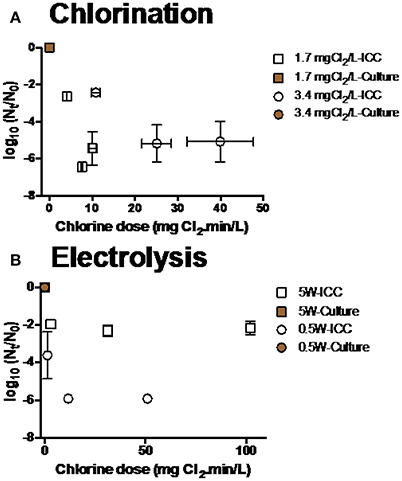
Figure 5. Inactivation of P. aeruginosa at various conditions during (A) chlorination and (B) electrolysis. Culture data of time points (n = 6) was not shown because their Nt-values were below detection limit (<10 CFU mL−1).
There was a significant discrepancy between results from culture and FCM methods for every disinfection treatment: Viable cells shown by culture data were significantly lower than ICC data (two-way ANOVA, p < 0.05).
Reactivation/Regrowth of bacteria after disinfection
Different disinfection methods variably influenced the likelihood of reactivation and/or regrowth of bacteria. For chlorination, E. coli inactivated when exposed to low concentrations of chlorine (from 0.14 to 0.5 mg Cl2 L−1) reactivated in the presence of Na2S2O3–a residual chlorine quencher (Figure 6A). No reactivation/regrowth of E. coli was observed after exposure to higher concentration of chlorine (3.4 mg Cl2 L−1) or electrolysis at various intensities, regardless of adding Na2S2O3 (Figure 6A). We observed increases in intact cell count—but not culturable cell count—in water exposed to 1.7 mg Cl2 L−1. This result—an outlier—is inconsistent with the rest of the data, and though we can speculate on the cause (i.e., flow cytometry error, incorrect gating by flow cytometer) we do not have evidence to support these speculations.
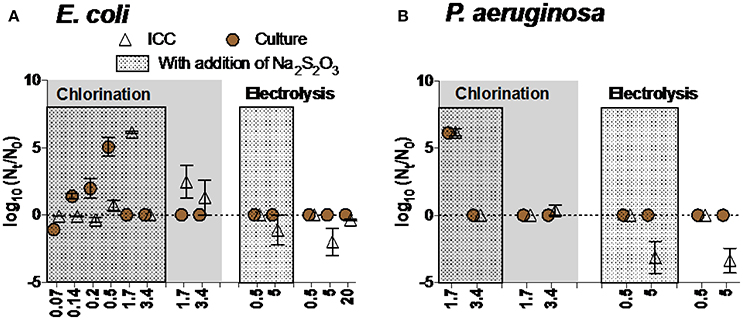
Figure 6. Reactivation and/or regrowth of (A) E. coli and (B) P. aeruginosa after inactivation experiments (chlorination and electrolysis). Data within boxes were from experiments in which Na2S2O3 was added to quench residual chlorine. Note that no bacteria were added after disinfection and before reactivation/regrowth experiments. Negative values reflect continued inactivation or loss of bacteria during incubation time.
A similar trend was observed for P. aeruginosa: reactivation occurred after exposure to low concentration of chlorine in the presence of Na2S2O3 (1.7 mg Cl2 L−1) (Figure 6B). Electrolysis seemed to be effective in inhibiting reactivation of P. aeruginosa even in the presence of Na2S2O3.
Growth of bacteria in disinfected water
Bacterial growth was occasionally observed in disinfected water, influenced by bacterial species as well as level and type of treatment. For example, P. aeruginosa grew in waters after exposure to electrolysis and chlorine, but Ent. faecalis was not able to grow in any conditions (Figures 7B,D). E. coli and S. typhimurium were unable to grow after chlorination and electrolysis treatments (Figures 7A,C).
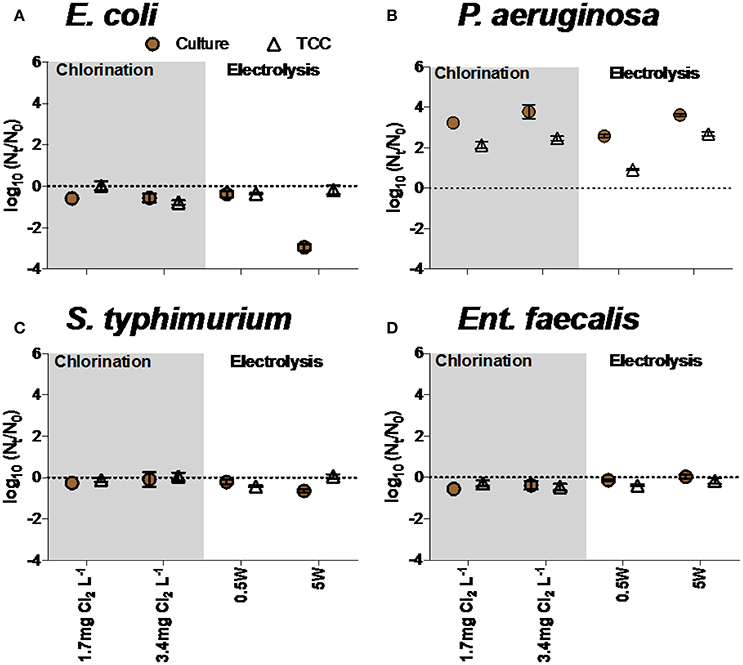
Figure 7. Growth of (A) E. coli, (B) P. aeruginosa, (C) S. typhimurium, and (D) Ent. faecalis in water after chlorination and electrolysis. Na2S2O3 was added in all experiments to quench residual chlorine. Note that negative values reflect continued inactivation or loss of bacteria during incubation time.
The TCC data and culture data in experiments with E. coli and P. aeruginosa were significantly different (two-way ANOVA, p < 0.05), but not in experiments with S. typhimurium and Ent. faecalis (two-way ANOVA, p > 0.05).
Discussion
Treatment of water for reuse is a promising strategy to increase water safety. However, hygienic risks increase during storage. Here, we demonstrate that bacterial species, water quality characteristics, and level and type of treatment all influence hygiene risks of water stored for reuse.
Effects of Water Characteristics on Bacterial Growth
Nutrients
Nutrient availability strongly influenced bacterial growth in water stored for reuse. C was an important nutrient in our study. Growth of the indigenous community (which was used to indicate AOC concentration) decreased following water treatment with GAC (Table 1). The growth of E. coli and P. aeruginosa increased dramatically with the addition of C, indicating that C was the main limiting factor for bacterial growth (Morita, 1993; Vital et al., 2008). The maximum concentrations of E. coli and P. aeruginosa were always lower than the indigenous communities (Figure 1). This result aligns with Vital et al. (2008) reporting that the source, type and composition of C has strong effects on bacterial growth. In relation to the water treatment system in the BDAT, this finding emphasizes the need for an efficient removal of DOC in the feed water. The combination of BAMBi and GAC reduces ~95% of total DOC concentration, which helps limit bacterial growth during storage.
For Ent. faecalis, C (in the form of acetate), N, P, or Fe did not improve growth. Addition of Davis media, vitamins, or amino acids were required for growth, implying growth was limited by lack of specific nutrients, not by inhibitory substances. For S. typhimurium, the limiting nutrient was Fe, confirming findings of a previous study showing increased growth of S. typhimurium and other enteric pathogens in Fe-supplemented water (Kortman et al., 2012). Within the BDAT, blood (i.e., menstrual blood) may introduce iron into the system. The impacts of the introduction of blood as a source of iron should be monitored, as our results suggest S. typhimurium (and potentially other pathogens) is limited by Fe.
Our study also highlighted that growth in water stored for reuse depends on the characteristics of the bacteria. Only E. coli and P. aeruginosa were able to grow in water samples following treatment with BAMBi and GAC. P. aeruginosa had a faster growth coefficient and higher final concentration than E. coli, indicating that P. aeruginosa was more ubiquitous and had a larger nutrient pool than E. coli. This result agrees with findings from previous studies showing that P. aeruginosa were able to grow relatively fast to reach high cell concentration in waters with limited nutrients (e.g., distilled water from hospitals, tap water; Favero et al., 1971; van der Kooij et al., 1982). Because P. aeruginosa is ubiquitous in the environment, it is likely that it will colonize the BDAT system during operation. Our results highlight that carbon control via the BAMBi and GAC treatments will not be sufficient: additional controls (i.e., electrolysis) are needed.
Indigenous Microbial Community
We demonstrated that the indigenous microbial community is generally—but not always—antagonistic to the growth of pathogens in the water (Figure 3). Previous studies showed the same antagonism (Chandran and Mohamed Hatha, 2005; Vital et al., 2012; Van Nevel et al., 2013). Antagonism may arise from nutrient (like C) competition, production of inhibitory compounds (e.g., antibiotics, bacteriocins), or predation and parasitism (e.g., bacteriophage, protozoa, invertebrates) (Hibbing et al., 2010; Vital et al., 2012; Wang et al., 2013). However, we also observed a protagonistic effect for P. aeruginosa, as also shown elsewhere for both E. coli and Klebsiella pneumonia (Moreira et al., 1994; Kerr et al., 1999). One potential explanation is that P. aeruginosa was able to use intermittent or end products that were synthesized by the indigenous community (Sherr and Sherr, 2002).
It should be noted that the water samples had been filtered and pasteurized to remove the original indigenous community to preserve the water quality during the course of the study (see section Collecting and Preparing Water Samples). In the BDAT system, the indigenous community is expected to be always present in the planktonic phase and/or in the biofilms. As a result, the interaction between the indigenous community and the pathogens (e.g., nutrient competition, production of inhibitory compounds, and predation) in the BDAT system likely differs from that observed. Additional research is needed to confirm dynamics observed in the laboratory align with dynamics observed in the BDAT under operating conditions (Ziemba et al., in preparation).
Effects of Inactivation Processes on Reactivation and Growth of Bacteria
The reactivation/regrowth of E. coli and P. aeruginosa depended on the water and disinfectant characteristics (Figure 6). Bacterial reactivation occurred after exposed to low concentrations of chlorine without residual, as observed in previous studies (Jjemba et al., 2010; Li et al., 2013). E. coli and P. aeruginosa might enter the viable but non-culturable (VBNC) state under certain conditions during chlorination (Oliver, 2010), and therefore be able to reactivate.
No reactivation was observed after electrolysis, even in the presence of chlorine quencher. This result may be due, in part, to production of disinfectants (e.g., hydroxyl, nitrate radical, or phosphate radical besides chlorine that prevent formation of a reactivating VBNC state (Kerwick et al., 2005; Guitaya et al., 2015). We also suspect that the presence of reactive oxidants may change carbon structure and thereby remove available carbon required for regrowth.
As P. aeruginosa was shown to grow after being spiked into disinfected water without residual chlorine, pathogen contamination is potentially a high risk that can affect the system hygienic performance besides regrowth/reactivation. During storage, pathogen contamination can happen via multiple events, including malfunction of one or more treatment processes, access to storage tank by hosts that contain pathogens (e.g., aquatic organisms, insects, birds, rodents, contaminated human hands). Therefore, to ensure the safety of reusing treated fecal-contaminated water, it is important to manage the access of the storage tank carefully, maintain a cleaning procedure for the tank regularly, and have a proper residual of disinfectant constantly.
In this study, we investigated inactivation and reactivation/regrowth of E. coli and P. aeruginosa in the absence of an indigenous community. The indigenous microbiota were removed to prevent microbial degradation of source water during storage and to allow quantification of bacteria using culture-based methods and flow cytometry simultaneously. The indigenous community may influence inactivation and/or reactivation/regrowth rates of bacteria. For example, in studies of chlorination of both reclaimed and drinking water, inactivation using chlorine has been shown to result in tailing of intact cell counts of the indigenous microbial community (Ramseier et al., 2011; Li et al., 2013). This phenomenon has been attributed to a resistant sub-population and/or shielding through bacterial aggregation or particle adsorption (Ramseier et al., 2011). However, Li et al. (2013) demonstrated inactivation of in situ total coliforms, enterococci, and Salmonella spp. in reclaimed water at rates similar to those observed here. We therefore expect similar pathogen inactivation and reactivation/regrowth kinetics in studies including the indigenous communities, but further research is warranted to conclusively demonstrate this.
Comparison between Culture and FCM Methods
In general, conclusions from culture and FCM methods aligned for experiments measuring bacterial growth, but differed for inactivation experiments. The discrepancy between culture and FCM methods observed for inactivation was likely because ICC measures intact cell membranes for bacteria that may not be culturable. The ICC measurement relies on cell staining with Propidium Iodide which only stains cells with damaged membranes (Berney et al., 2007). Some dead or unculturable cells may have intact membranes, so ICC data is considered more conservative (i.e., overestimate concentrations of surviving cells) than culture (Joux and Lebaron, 2000; Bosshard et al., 2010).
Implication for Water Reuse
Concerns related to pathogen growth in drinking water and reclaimed water have been raised in previous studies (van der Kooij, 2003; Oesterholt et al., 2007; Jjemba et al., 2010; Weinrich et al., 2010). In this study, we demonstrated that the growth of pathogens in water stored for reuse in an onsite sanitation technology (i.e., the BDAT) is a potential concern and, therefore, increases health risks. A bacterial indicator (E. coli) and an opportunistic pathogen (P. aeruginosa) were able to grow in water stored for reuse after multiple, different effective treatment processes. Water characteristics, including nutrient concentrations and indigenous bacterial communities, were shown to have strong effects on the bacterial growth. Additionally, we demonstrated the complex and non-uniform influence of indigenous communities on the growth of pathogens.
We also demonstrated that the choice of treatment processes was a key factor influencing bacterial growth. The presence of residual disinfectants (e.g., chlorine and/or other reactive active species) contributed to water biostability. Among three disinfection options, electrolysis appeared to be the most effective method to inhibit pathogen growth, followed by chlorination with high chlorine concentrations (e.g., >0.5 mg Cl2 L−1 for E. coli and >1.7 mg Cl2 L−1 for P. aeruginosa).
Limitation of the Study
There were notable limitations to this study. First, we only tested growth, inactivation, and reactivation of four bacteria of interest. There is heterogeneity in both growth and inactivation coefficients of the four tested bacterial species, so future research is likely needed to investigate other pathogens (i.e., Legionalla spp.) to ensure safety of water reuse.
Second, the study focused on the growth and inactivation of bacteria in the planktonic phase. Biofilms in storage tanks, like the clean water tank where water is stored for reuse in the BDAT, likely also influence growth and inactivation of bacteria. As aggregates of microbial cells attach to surfaces, biofilm members have advantages of being protected from disinfectants and predators compared to planktonic cells (LeChevallier et al., 1988; Flemming and Wingender, 2010). In addition, the matrix of hydrated extracellular polymeric substances (EPS) helps biofilm members consume complex substrates (e.g., humic acids) as food, which are not bioavailable for planktonic bacteria (Fischer, 2003; Flemming and Wingender, 2010). More research is needed to understand the growth and inactivation of bacteria in biofilms in water stored for reuse, especially in the context of the BDAT.
Third, there is a discrepancy between conditions in the laboratory and in the real BDAT system. In our laboratory setup, all experiments were conducted in batch reactors, in which the concentration of nutrients, residual disinfectant, and bacteria drastically changes in the course of the experiments in 72 h. These conditions are different to those in the BDAT, where water after BAMBi is frequently added into the clean water tank and treated water is frequently removed upon every usage. The continuous flow conditions in the BDAT create a certain level of consistency in the bulk-phase concentration of nutrients and bacteria for prolonged periods of time. The concentration of residual disinfectant in the clean water tank of the BDAT is also kept constant with a regular dosing interval. Another difference between laboratory setup and real-life conditions is that the indigenous community is constantly present in the BDAT system whereas it was removed from the water samples for the subset of laboratory experiments on inactivation and reactivation/regrowth. The indigenous community in the BDAT may impact the inactivation and reactivation/regrowth of pathogens, for example by shielding and/or providing. Results learnt from inactivation experiments, for example the disinfectant demand for a sufficient pathogen removal, likely need to be adapted in the presence of the indigenous community in the BDAT conditions.
Conclusions
Reuse of treated fecally-contaminated water is a promising strategy to safely increase water efficiency. However, water must be sufficiently treated to reduce hygiene risks associated with reuse. Storage and distribution of water for reuse, in particular, pose potential health risks. We demonstrated these risks through the following observations:
• Both E. coli and opportunistic pathogen P. aeruginosa grow in water following treatment unless there is sufficient disinfectant residual.
• Growth during storage is influenced by both water quality and bacterial species: although neither Ent. faecalis nor S. typhimurium grew in treated water, the addition of limiting nutrients was able to initiate growth.
• GAC combined with chlorination (sufficiently high concentrations, with residual) or electrolysis is effective additional treatment that both reduce microorganisms in the water and limits regrowth potential.
Author Contributions
MN: contributed to the conception, design, data acquisition, analysis, and interpretation of the work, and drafted and critically revised the manuscript. LA, CZ, and OL: contributed to the data acquisition, analysis, and interpretation of the work, and critically revised the manuscript. EM: contributed to the conception, design and interpretation of the work, and critically revised the manuscript. TJ: contributed to the conception, design, data analysis, and interpretation of the work, and critically revised the manuscript.
Conflict of Interest Statement
The authors declare that the research was conducted in the absence of any commercial or financial relationships that could be construed as a potential conflict of interest.
Acknowledgments
This work was carried out in the context of the Blue Diversion AUTARKY-Project, funded by the Bill and Melinda Gates Foundation (OPP1111293). We thank Konstanze Schiessl, Ana K. Pitol, Lea Caduff, Frederik Hammes, Stefan Koetzsch, Juerg Sigrist, Adriano Joss, Richard Fankhauser, Julian Fleiner, and Sara Beck for help with lab work, field work and useful discussions. We thank Kai Udert and Steffi Enssle for help with managing the project.
Supplementary Material
The Supplementary Material for this article can be found online at: https://www.frontiersin.org/articles/10.3389/fenvs.2017.00090/full#supplementary-material
Abbreviations
AOC, Assimilable Organic Carbon; ANOVA, Analysis of Variance; BAMBi, Biologically Activated Membrane Bioreactor; BDAT, Blue Diversion AUTARKY Toilet; CFU, Colony Forming Units; DOC, Dissolved Organic Carbon; FCM, Flow Cytometry; GAC, Granular Activated Carbon; GDM, Gravity Driven Membrane; ICC, Intact Cell Count; RPM, Revolutions Per Minute; TCC, Total Cell Count; VBNC, Viable But Non-culturable.
References
Albrechtsen, H. J. (2002). Microbiological investigations of rainwater and graywater collected for toilet flushing. Water Sci. Technol. 46, 311–316. Available online at: http://wst.iwaponline.com/content/46/6-7/311
Berney, M., Hammes, F., Bosshard, F., Weilenmann, H.-U., and Egli, T. (2007). Assessment and interpretation of bacterial viability by using the LIVE/DEAD BacLight kit in combination with flow cytometry. Appl. Environ. Microbiol. 73, 3283–3290. doi: 10.1128/AEM.02750-06
Bosshard, F., Bucheli, M., Meur, Y., and Egli, T. (2010). The respiratory chain is the cell's Achilles' heel during UVA inactivation in Escherichia coli. Microbiol. Read. Engl. 156, 2006–2015. doi: 10.1099/mic.0.038471-0
Chandran, A., and Mohamed Hatha, A. A. (2005). Relative survival of Escherichia coli and Salmonella typhimurium in a tropical estuary. Water Res. 39, 1397–1403. doi: 10.1016/j.watres.2005.01.010
Christova-Boal, D., Eden, R. E., and McFarlane, S. (1996). An investigation into greywater reuse for urban residential properties. Desalination 106, 391–397. doi: 10.1016/S0011-9164(96)00134-8
Favero, M. S., Carson, L. A., Bond, W. W., and Petersen, N. J. (1971). Pseudomonas aeruginosa: growth in distilled water from hospitals. Science 173, 836–838. doi: 10.1126/science.173.3999.836
Fischer, H. (2003). “The role of biofilms in the uptake and transformation of dissolved organic matter,” in Aquatic Ecosystems (Elsevier), 285–313. Available Online at: http://linkinghub.elsevier.com/retrieve/pii/B9780122563713500135 (Accessed May 22, 2016).
Flemming, H.-C., and Wingender, J. (2010). The biofilm matrix. Nat. Rev. Microbiol. 8, 623–633. doi: 10.1038/nrmicro2415
Friedler, E., Kovalio, R., and Ben-Zvi, A. (2006). Comparative study of the microbial quality of greywater treated by three on-site treatment systems. Environ. Technol. 27, 653–663. doi: 10.1080/09593332708618674
Gilboa, Y., and Friedler, E. (2008). UV disinfection of RBC-treated light greywater effluent: kinetics, survival and regrowth of selected microorganisms. Water Res. 42, 1043–1050. doi: 10.1016/j.watres.2007.09.027
Gross, A., Azulai, N., Oron, G., Ronen, Z., Arnold, M., and Nejidat, A. (2005). Environmental impact and health risks associated with greywater irrigation: a case study. Water Sci. Technol. 52, 161–169. Available online at: http://wst.iwaponline.com/content/52/8/161
Guitaya, L., Drogui, P., and Blais, J. F. (2015). In situ reactive oxygen species production for tertiary wastewater treatment. Environ. Sci. Pollut. Res. Int. 22, 7025–7036. doi: 10.1007/s11356-014-3907-3
Hammes, F. A., and Egli, T. (2005). New method for assimilable organic carbon determination using flow-cytometric enumeration and a natural microbial consortium as inoculum. Environ. Sci. Technol. 39, 3289–3294. doi: 10.1021/es048277c
Hibbing, M. E., Fuqua, C., Parsek, M. R., and Peterson, S. B. (2010). Bacterial competition: surviving and thriving in the microbial jungle. Nat. Rev. Microbiol. 8, 15–25. doi: 10.1038/nrmicro2259
Jjemba, P. K., Weinrich, L. A., Cheng, W., Giraldo, E., and Lechevallier, M. W. (2010). Regrowth of potential opportunistic pathogens and algae in reclaimed-water distribution systems. Appl. Environ. Microbiol. 76, 4169–4178. doi: 10.1128/AEM.03147-09
Joux, F., and Lebaron, P. (2000). Use of fluorescent probes to assess physiological functions of bacteria at single-cell level. Microbes Infect. 2, 1523–1535. doi: 10.1016/S1286-4579(00)01307-1
Katukiza, A. Y., Ronteltap, M., Niwagaba, C. B., Kansiime, F., and Lens, P. N. L. (2015). Grey water characterisation and pollutant loads in an urban slum. Int. J. Environ. Sci. Technol. 12, 423–436. doi: 10.1007/s13762-013-0451-5
Kerr, M., Fitzgerald, M., Sheridan, J. J., McDowell, D. A., and Blair, I. S. (1999). Survival of Escherichia coli O157:H7 in bottled natural mineral water. J. Appl. Microbiol. 87, 833–841. doi: 10.1046/j.1365-2672.1999.00928.x
Kerwick, M. I., Reddy, S. M., Chamberlain, A. H. L., and Holt, D. M. (2005). Electrochemical disinfection, an environmentally acceptable method of drinking water disinfection? Electrochim. Acta 50, 5270–5277. doi: 10.1016/j.electacta.2005.02.074
Kortman, G. A. M., Boleij, A., Swinkels, D. W., and Tjalsma, H. (2012). Iron availability increases the pathogenic potential of Salmonella typhimurium and other enteric pathogens at the intestinal epithelial interface. PLoS ONE 7:e29968. doi: 10.1371/journal.pone.0029968
Künzle, R., Pronk, W., Morgenroth, E., and Larsen, T. A. (2015). An energy-efficient membrane bioreactor for on-site treatment and recovery of wastewater. J. Water Sanit. Hyg. Dev. 5, 448–455. doi: 10.2166/washdev.2015.116
Larsen, T. A., Gebauer, H., Gründl, H., Künzle, R., Lüthi, C., Messmer, U., et al. (2015). Blue diversion: a new approach to sanitation in informal settlements. J. Water Sanit. Hyg. Dev. 5, 64–71. doi: 10.2166/washdev.2014.115
LeChevallier, M. W., Cawthon, C. D., and Lee, R. G. (1988). Factors promoting survival of bacteria in chlorinated water supplies. Appl. Environ. Microbiol. 54, 649–654.
Li, D., Zeng, S., Gu, A. Z., He, M., and Shi, H. (2013). Inactivation, reactivation and regrowth of indigenous bacteria in reclaimed water after chlorine disinfection of a municipal wastewater treatment plant. J. Environ. Sci. 25, 1319–1325. doi: 10.1016/S1001-0742(12)60176-4
Lin, Y., Li, D., Gu, A. Z., Zeng, S., and He, M. (2016). Bacterial regrowth in water reclamation and distribution systems revealed by viable bacterial detection assays. Chemosphere 144, 2165–2174. doi: 10.1016/j.chemosphere.2015.10.071
Mara, D. D., Sleigh, P. A., Blumenthal, U. J., and Carr, R. M. (2007). Health risks in wastewater irrigation: comparing estimates from quantitative microbial risk analyses and epidemiological studies. J. Water Health 5, 39–50. doi: 10.2166/wh.2006.055
Mekonnen, M. M., and Hoekstra, A. Y. (2016). Four billion people facing severe water scarcity. Sci. Adv. 2:e1500323. doi: 10.1126/sciadv.1500323
Moreira, L., Agostinho, P., Morais, P. V., and da Costa, M. S. (1994). Survival of allochthonous bacteria in still mineral water bottled in polyvinyl chloride (PVC) and glass. J. Appl. Bacteriol. 77, 334–339. doi: 10.1111/j.1365-2672.1994.tb03082.x
Morel, A., and Diener, S. (2006). Greywater Management in Low and Middle-Income Countries. Review of Different Treatment Systems for Households or Neighbourhoods. Duebendorf: Sandec, EAWAG. Available online at: http://www.susana.org/_resources/documents/default/2-947-en-greywater-management-2006.pdf
Morita, R. Y. (1993). “Bioavailability of energy and the starvation state,” in Starvation in Bacteria, ed S. Kjelleberg (Boston, MA: Springer), 1–23.
Murray, B. E., Singh, K. V., Ross, R. P., Heath, J. D., Dunny, G. M., and Weinstock, G. M. (1993). Generation of restriction map of Enterococcus faecalis OG1 and investigation of growth requirements and regions encoding biosynthetic function. J. Bacteriol. 175, 5216–5223. doi: 10.1128/jb.175.16.5216-5223.1993
Nolde, E. (2000). Greywater reuse systems for toilet flushing in multi-storey buildings – over ten years experience in Berlin. Urban Water 1, 275–284. doi: 10.1016/S1462-0758(00)00023-6
Oesterholt, F., Medema, G., van der Kooij, D., and Martijnse, G. (2007). Health risk assessment of non-potable domestic water supplies in the Netherlands. J. Water Supply Res. Technol. 56, 171–179. doi: 10.2166/aqua.2007.043
Oliver, J. D. (2010). Recent findings on the viable but nonculturable state in pathogenic bacteria. FEMS Microbiol. Rev. 34, 415–425. doi: 10.1111/j.1574-6976.2009.00200.x
O'Toole, J., Sinclair, M., Malawaraarachchi, M., Hamilton, A., Barker, S. F., and Leder, K. (2012). Microbial quality assessment of household greywater. Water Res. 46, 4301–4313. doi: 10.1016/j.watres.2012.05.001
Prest, E. I., Hammes, F., van Loosdrecht, M. C. M., and Vrouwenvelder, J. S. (2016). Biological stability of drinking water: controlling factors, methods, and challenges. Food Microbiol. 7:45. doi: 10.3389/fmicb.2016.00045
Ramseier, M. K., von Gunten, U., Freihofer, P., and Hammes, F. (2011). Kinetics of membrane damage to high (HNA) and low (LNA) nucleic acid bacterial clusters in drinking water by ozone, chlorine, chlorine dioxide, monochloramine, ferrate(VI), and permanganate. Water Res. 45, 1490–1500. doi: 10.1016/j.watres.2010.11.016
Sherr, E. B., and Sherr, B. F. (2002). Significance of predation by protists in aquatic microbial food webs. Anton. Van Leeuwen. 81, 293–308. doi: 10.1023/A:1020591307260
Shuval, H., Lampert, Y., and Fattal, B. (1997). Development of a risk assessment approach for evaluating wastewater reuse standards for agriculture. Water Sci. Technol. 35, 15–20.
Thayanukul, P., Kurisu, F., Kasuga, I., and Furumai, H. (2013). Evaluation of microbial regrowth potential by assimilable organic carbon in various reclaimed water and distribution systems. Water Res. 47, 225–232. doi: 10.1016/j.watres.2012.09.051
van der Kooij, D., Oranje, J. P., and Hijnen, W. A. (1982). Growth of Pseudomonas aeruginosa in tap water in relation to utilization of substrates at concentrations of a few micrograms per liter. Appl. Environ. Microbiol. 44, 1086–1095.
van der Kooij, D. (2003). “Managing regrowth in drinking- water distribution systems,” in WHO, Heterotrophic Plate Counts and Drinking-Water Safety the Significance of HPCs for Water Quality and the Human Health, eds J. Bartram, J. Cotruvo, M. Exner, C. Fricker, and A. Glasmacher (London, UK: IWA Publishing), 199–232.
Van Nevel, S., De Roy, K., and Boon, N. (2013). Bacterial invasion potential in water is determined by nutrient availability and the indigenous community. FEMS Microbiol. Ecol. 85, 593–603. doi: 10.1111/1574-6941.12145
Vital, M., Hammes, F., and Egli, T. (2008). Escherichia coli O157 can grow in natural freshwater at low carbon concentrations. Environ. Microbiol. 10, 2387–2396. doi: 10.1111/j.1462-2920.2008.01664.x
Vital, M., Hammes, F., and Egli, T. (2012). Competition of Escherichia coli O157 with a drinking water bacterial community at low nutrient concentrations. Water Res. 46, 6279–6290. doi: 10.1016/j.watres.2012.08.043
Vital, M., Stucki, D., Egli, T., and Hammes, F. (2010). Evaluating the growth potential of pathogenic bacteria in water. Appl. Environ. Microbiol. 76, 6477–6484. doi: 10.1128/AEM.00794-10
Wang, H., Masters, S., Edwards, M. A., Falkinham, J. O., and Pruden, A. (2014). Effect of disinfectant, water age, and pipe materials on bacterial and eukaryotic community structure in drinking water biofilm. Environ. Sci. Technol. 48, 1426–1435. doi: 10.1021/es402636u
Wang, H., Pryor, M. A., Edwards, M. A., Falkinham, J. O., and Pruden, A. (2013). Effect of GAC pre-treatment and disinfectant on microbial community structure and opportunistic pathogen occurrence. Water Res. 47, 5760–5772. doi: 10.1016/j.watres.2013.06.052
Weinrich, L. A., Jjemba, P. K., Giraldo, E., and LeChevallier, M. W. (2010). Implications of organic carbon in the deterioration of water quality in reclaimed water distribution systems. Water Res. 44, 5367–5375. doi: 10.1016/j.watres.2010.06.035
Wiel-Shafran, A., Ronen, Z., Weisbrod, N., Adar, E., and Gross, A. (2006). Potential changes in soil properties following irrigation with surfactant-rich greywater. Ecol. Eng. 26, 348–354. doi: 10.1016/j.ecoleng.2005.12.008
Keywords: water for reuse, pathogen, inactivation, regrowth, biologically active membrane bioreactor, biostability
Citation: Nguyen MT, Allemann L, Ziemba C, Larivé O, Morgenroth E and Julian TR (2017) Controlling Bacterial Pathogens in Water for Reuse: Treatment Technologies for Water Recirculation in the Blue Diversion Autarky Toilet. Front. Environ. Sci. 5:90. doi: 10.3389/fenvs.2017.00090
Received: 29 September 2017; Accepted: 04 December 2017;
Published: 19 December 2017.
Edited by:
Pascal E. Saikaly, King Abdullah University of Science and Technology, Saudi ArabiaReviewed by:
Pierre Le Clech, University of New South Wales, AustraliaMoustapha Harb, University of Southern California, United States
Copyright © 2017 Nguyen, Allemann, Ziemba, Larivé, Morgenroth and Julian. This is an open-access article distributed under the terms of the Creative Commons Attribution License (CC BY). The use, distribution or reproduction in other forums is permitted, provided the original author(s) or licensor are credited and that the original publication in this journal is cited, in accordance with accepted academic practice. No use, distribution or reproduction is permitted which does not comply with these terms.
*Correspondence: Timothy R. Julian, tim.julian@eawag.ch