Evaluation of the ECMWF Sub-seasonal to Seasonal Precipitation Forecasts during the Peak of West Africa Monsoon in Nigeria
 Eniola Olaniyan1,2*
  Elijah A. Adefisan2
  Feyi Oni3 Earnest Afiesimama4 Ahmed A. Balogun2
  Kamoru A. Lawal1
- 1Nigerian Meteorological Agency, Abuja, Nigeria
- 2Department of Meteorology and Climate Science, Federal University of Technology, Akure, Nigeria
- 3Department of Geography, University of Lagos, Lagos, Nigeria
- 4World Meteorological Organization, Geneva, Switzerland
Motivated by the increasing needs for reliable seasonal climate forecasts for enhanced living and protection of property, this study evaluates the predictive skill of the European Center for Medium-range Weather Forecast's Sub-seasonal to Seasonal (ECMWF-S2S) precipitation forecasts during the peak of West Africa Monsoon in Nigeria. It investigates the ability of the ECMWF-S2S model to reproduce the atmospheric dynamics that influence the monsoon variability in West-Africa. Rain gauge values of 46 meteorological stations and 10-member ensemble of ECMWF-S2S forecasts from the Ensemble Prediction System (EPS) version of the ECMWF were subjected to quantitative statistical analyses. Results show that the model has weak capability in predicting wind strength at 700 mb level to depict the African Easterly Jet (AEJ). However, irrespective of the ENSO phases, ECMWF-S2S model is capable of adequately and reliably predicting the latitudinal positions of the Inter-Tropical Discontinuity (ITD), mean sea level pressure component of the thermal lows and sea surface temperature (SST) anomalies over the Pacific and Atlantic Oceans. On inter-annual time-scales, results also show that ECMWF-S2S model performs best over the Savannah in forecasting of rainfall anomalies (synchronization = 75%) and over the Sahel in the prediction of rainfall accumulation. The model may however not be able to forecast extreme precipitation reliably because the disagreement between the model's ensemble members increases as higher rainfall accumulation values are attained. The implication here is that the reproducibility of the atmospheric dynamic by the model is a better measure of rainfall prediction than the actual quantitative rainfall forecasts especially in areas south of latitude 10°N. The study therefore suggests considering some climate driving mechanisms as predictability sources for the ECMWF-S2S model to enable the atmospheric dynamics to be better represented in the model.
Introduction
Forecasts, the future state of the atmosphere, exist across different time-scales. These time-scales range from short range (1–5 days), to medium range (7–15 days), and long range (3–12 months) (Robertson and Wang, 2012; Vitart et al., 2014; Lawal, 2015). For the past several decades, forecasts of weather, ocean and other environmental phenomena made on short and medium range time-scales have yielded invaluable information to improve decision making across many socio-economic sectors (Lazo et al., 2011). Yet, there are some fundamental problems that limit the use of these forecasts. Firstly, the medium range time-scales appear too short for any meaningful mitigating action to be taken. Secondly, there exists a gap, referred to as the “predictability desert” (Vitart et al., 2014, 2017), between the medium and long range time-scale forecasts. This is unfortunate, in view of the later, because many vital management decisions with regards to agriculture and food security, water management, and disaster risk reduction, health, etc. are made within this gap. In view of these, some National Weather and Hydrological Centers (NWHC) have taken up the responsibility to operationally bridge the gap. Complementarily, Numerical Weather Prediction Centers (NWPC) have improved on the existing medium-range models by developing a type of model capable of bridging this gap. This type of “gap-bridging model” is, globally, referred to as Sub-Seasonal to Seasonal (hereafter known as S2S) model. As demands for reliable weather and climate forecasts are increasing around the globe, forecasts from S2S models are regarded as a new frontier for atmospheric predictability research. However, there exist no commensuration between the operational use of S2S models and studies of their abilities to reproduce basic atmospheric variables. This present study will explore this knowledge gap over Nigeria—the most populous country in Africa whose food security depends entirely on rain-fed agriculture (Omotosho and Abiodun, 2007; Okwori et al., 2015).
Predictive skills of various S2S models have been investigated in different regions of the world for different purposes. However, in recent years, only few studies have considered the abilities of these S2S models to reproduce basic atmospheric variables. Among these few studies are Tompkins and Feudale (2010), Lynch et al. (2014), Tompkins and Giuseppe (2015), and White et al. (2015). For example, in Australia, a version of S2S model has been used in disaster risk reduction (DRR) activities as well as emergency management and response in Australia. White et al. (2015) illustrated this by utilizing forecasts from the Australian Bureau of Meteorology (BoM) S2S timescales to investigate how forecasting of flood events across a range of prediction timescales could be beneficial to a range of sectors and society in Australia. Similarly, Lynch et al. (2014) while using an ECMWF-S2S hindcast concluded that there is statistically significant skill in predicting weekly mean wind speeds over areas of Europe at lead times of at least 14–20 days. Over few African regions, Tompkins and Feudale (2010), for instance, evaluated the capability of one of the S2S models, an operational European Center for Medium-range Weather Forecast (ECMWF) Seasonal Forecast System (SYS3), at a lead time of 2–4 months in a 49-year hindcast dataset, to adequately simulate the West African monsoon precipitation. Using 2006 as a case study, they found that SYS3 is capable of reproducing the progression of the West Africa monsoon but with some deviations from the climatology. Nevertheless, they showed that the model skill at predicting and or simulating West African summer monsoon rainfall anomalies has increased in recent years, thereby indicating improvements since the 1990s. Another type of S2S model, an ECMWF-S2S, was utilized by Tompkins and Giuseppe (2015) to investigate the use of temperature and rainfall predictions for advanced warning on malaria in an idealized experiment. Tompkins and Giuseppe (2015) found that ECMWF-S2S is capable of predicting the years, during the last two decades, in which documented Ugandan and Kenyan highland malaria outbreaks occurred. Nigerian NWHC is on the verge of employing ECMWF-S2S model for its operational sub-seasonal forecast activities. In view of this, the predictive skills of the ECMWF-S2S model products, most especially precipitation forecasts during the boreal summer monsoon over Nigeria, which has hitherto not been evaluated, needs to be evaluated. This present paper, therefore, seeks to address this shortcoming.
Boreal summer monsoon is a very crucial annual phenomenon in Nigeria. A huge number of socio-economic activities in Nigeria depend on the boreal summer monsoon precipitation (Fink et al., 2006). It varies on both inter-annual and intra-seasonal time scales (Couvreux et al., 2010; Lawal, 2015; Olaniyan et al., 2015). These variations have strong societal impacts on agriculture, water resource management, transportation, and health (Sultan and Janicot, 2003). Monsoon peak coincides with the occurrence of an annual little dry season popularly known as “August-break” (Olaniran and Babatolu, 1987) in some southern parts of Nigeria. August-break is termed a growing period during which conditions are favorable for weeding (Olaniran, 1988) and or spraying of crops with insecticides and pesticides (Osunade, 1994). It's earlier than normal occurrence as well as its persistence beyond normal days could be disastrous for both early crops and the second half of the growing season. In both cases, the lengths of the growing seasons are reduced, thereby resulting in widespread crop failure (Adejuwon and Odekunle, 2006). Meanwhile, monsoon peak is the bee-hive of agricultural activities in the northern parts of the country (Fink et al., 2006). All northern cities experienced their annual maximum rainfall during the peak of the monsoon. Despite the crucial nature of the West Africa Monsoon during its peak, there still exist fundamental gaps regarding its reproducibility by the ECMWF-S2S model over Nigeria.
There are many rain-producing mechanisms over West Africa. Few of these, discussed in this study, are the El Nino Southern Oscillation (ENSO; Latif and Grotzner, 2000; Camberlin et al., 2001; Newman et al., 2003), the Inter-Tropical Discontinuity (ITD; Grist and Nicholson, 2001; Redelsperger et al., 2002; Omotosho and Abiodun, 2007), thermal lows (Parker et al., 2005; Lavaysse et al., 2006, 2009, 2010), African Easterly Jet (AEJ; Diedhiou et al., 1998; Grist and Nicholson, 2001; Afiesimama, 2007), and the sea surface temperature (SST) anomalies over the Gulf of Guinea (GOG; Omotosho and Abiodun, 2007; Odekunle and Eludoyin, 2008).
Studies have shown that ENSO is an effective forcing mechanism for the tropical atmospheric circulation (Newman et al., 2003). Its intensity varies inter-annually, inter-decadally and sub-seasonally. Rapid evolution of ENSO, over intervals as short as a few weeks, can amount to an important predictability source on S2S time-scale (Newman et al., 2003). Studies have shown that West Africa do experience abnormally wet climate, during the boreal summer, the SSTs located across the central and eastern Pacific Ocean is below-average (e.g., Latif and Grotzner, 2000; Camberlin et al., 2001). Whether on the inter-annual, inter-decadal, even at sub-seasonal time-scales, the role played by ENSO in rainfall variability over West Africa, vis-a-vis Nigeria, is considered strong and cannot be neglected especially during the peak of the boreal summer West-African monsoon (Fontaine et al., 1995; Diedhiou et al., 1998; Newman et al., 2003).
There are two climatic seasons over Nigeria. These are the dry season and the rainy season (also known as the monsoon season). They resulted from the interactions of two air masses—tropical maritime and tropical continental air masses. At the surface, these two air masses meet at a belt of variable width and stability called the Inter-Tropical Discontinuity (ITD; Grist and Nicholson, 2001). To the north of the ITD is the prevailing continental northeasterly wind which brings dry and dusty conditions across the country. To the south are the maritime southwesterly winds which are moisture laden. The maximum northern penetration of this wet air mass is in August, averagely between latitudes 19–22°N. Therefore, the ITD migrates northward and southward on annual basis and modulates the variability of the monsoon over the country (Redelsperger et al., 2002; Omotosho and Abiodun, 2007).
Throughout the year, over West-Africa, there exist areas where the lowest atmospheric pressure coincides with surface temperature maximum. This area is what is referred to as thermal low (Lavaysse et al., 2009, 2010). Thermal low is associated with cyclonic circulation. This circulation tends to boost the southwesterly monsoon flow along eastern border of the thermal low while it augments north-easterly dry flow along its western side (Parker et al., 2005). Likewise the ITD, the thermal low also perform annual oscillation and reaches its northernmost position (20–25°N) in August—during the rainy season in Sahel, i.e., the peak of the monsoon.
The AEJ is a crucial element in global synoptic and mesoscale dynamics. It can be found around 600–700 hPa in August with zonal (u) winds (up to 10 ms−1) at the core. It usually travels from East to West Africa (Afiesimama, 2007). The disturbances around this zonal circulation, the African Easterly Waves (AEWs), have been identified as a key driver of convection and rainfall patterns (Rowell and Milford, 1993; Diedhiou et al., 1998; Afiesimama, 2007).
Warm equatorial Atlantic Ocean provides Nigeria with large areas of boundary layer moisture build-up. This makes the moisture laden southwesterly wind more buoyant in terms of moisture and energy (Odekunle and Eludoyin, 2008). The energized wind is capable of dynamically pushing the ITD deeply into the northern end of the country, thereby resulting in above-normal rainfall (Omotosho and Abiodun, 2007), especially along the coast. These indicate that rainfall anomalies over the country can be reliably predicted using SST anomalies over tropical Atlantic, especially the GoG, as predictors.
Representation of these rain-producing mechanisms in models is important for climate modeling, seasonal predictions, and weather forecasting (Wu et al., 2009). Therefore, this paper will also examine the performance of the ECMWF-S2S model, during different phases of ENSO, at reproducing these rain-producing mechanisms. This will ascertain trustworthiness of the ECMWF-S2S model during different ENSO phases over Nigeria.
Three things are yet to be understood regarding the predictive skills of the ECMWF-S2S model over Nigeria. Firstly, the ability of the ECMWF-S2S model to reproduce monsoon related atmospheric dynamics that are predominant during different phases of ENSO. Secondly, the skill of the ECMWF-S2S model at forecasting rainfall anomalies distribution on an inter-annual time-scales during the peak of the monsoon. And thirdly, the ability of the ECMWF-S2S model to forecast extreme events during the monsoon periods. Here, we ask the question—“does the ECMWF-S2S model has the ability to reproduce the atmospheric dynamics, if yes, does this translate to reliable precipitation forecasts?” Knowledge of these is crucial to the understanding of intra-seasonal variability of monsoon, especially with regard to the interaction between the dynamics and the convection within intra-seasonal disturbances (Sultan and Janicot, 2003). This paper will therefore, evaluate precipitation forecasts from the ECMWF-S2S model during the peak of West Africa Monsoon in Nigeria, at different phases of ENSO phenomenon.
While this section introduces the concept of the paper, the next section of this paper describes the configuration of the ECMWF-S2S model, other datasets used, and the method of analysis employed in this study. Section Results and Discussion examines the results from the analyses while section Conclusion summarizes and concludes the findings of this work.
Model, Datasets, and Methods
Description of the S2S Model Used in this Study
This study utilizes the ECMWF-S2S ensemble hind-casts produced by the Variable Resolution Ensemble Prediction System (VarEPS). It is based on Integrated Forecasting System (IFS) version 41r1 and runs on octahedral grid with 51 member ensemble (Buizza et al., 2006; Vitart et al., 2012). Operationally, the system is composed typically of coupled land, ocean and atmosphere components (White et al., 2015). The system provides daily ensemble forecasts of a wide variety of atmospheric variables (precipitation, 2 m temperature, SST, horizontal wind flows at 700 hPa level, mean sea level pressure (MSLP), dew point temperatures, etc.) with daily and sub-daily temporal resolution of the order of 6 h, in a 46 days lead time.
Uncertainties in the system are simulated using two stochastic schemes described in Palmer et al. (2009). The system is coupled with H-Tessel (a land surface model) and NEMO3.4.1 (a 1° × 1° horizontal resolution ocean model that has up to 0.3° × 0.3° resolution at the equator with 42 vertical levels) while it uses 4-DVar variation data assimilation for the initial condition and 3-DVar for the ocean. The physical parameterization schemes used by the system are the Moist-EDMF (Tiedtke, 1989), Klein/Hartmann stratus/shallow convection criteria (Bechtold et al., 2004), and parameterization of convection and prognostic cloud fraction (Tiedtke, 1991). More details on the ECMWF-S2S are available at http://s2sprediction.net/.
Dataset and Methods
The precipitation datasets analyzed in this study are from the ECMWF-S2S ensemble hind-casts produced by the VarEPS. The datasets are retrieved from the ECMWF-S2S database, as supported by World Meteorological Organization (WMO) through the World Weather Research Program (WWRP) and World Climate Research Program (WCRP). The data retrieved covers five ENSO phases from 1998 to 2012. The five ENSO phases considered are the weak El-Nino phase of 2004, the moderate El-Nino phase of 2009, the moderate La-Nina phase of 2010, the weak La-Nina phase of 2011, and the neutral phase of 2012 (Null, 2013; Oluwole, 2015) during the months of August which is the peak of the boreal summer monsoon. Here, 10 ensemble members from the hind-cast dataset are utilized. The precipitation hind-cast datasets used in this study can be considered as re-forecast. This is because the hind-cast (i.e., re-forecast) datasets used were initialized on the last Thursdays of July of every year considered in this study (Table 1).
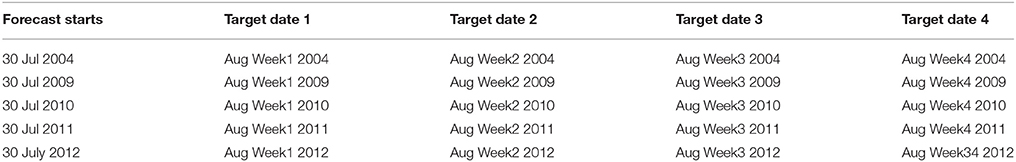
Table 1. Dates of initialization and range of forecasts examined in this study.
The re-forecast ensembles of some atmospheric dynamic mechanisms that may be responsible for monsoon variability over West Africa, vis-a-vis Nigeria, are also retrieved from the ECMWF-S2S database. These are the SST (Newman et al., 2003), the ITD (represented by 15°C dew point temperature line according to www.cpc.ncep.noaa.gov/products/international/itf/itcz.shtml; Ilesanmi, 1971; Olaniyan et al., 2015; Lawal et al., 2016), zonal (u) and meridional (v) winds at 700 hPa level to track the African Easterly Jet (AEJ; Grist and Nicholson, 2001; Afiesimama, 2007) and thermal-low (represented by the coincidence of the hottest 2 m temperature and lowest mean sea level pressure (MSLP): Lavaysse et al., 2006, 2009, 2010).
Furthermore, two sets of observational datasets were used to evaluate the reproducibility capacity of the ECMWF-S2S model re-forecasts. Firstly, we used the ECMWF's ERA-INTERIM Reanalysis datasets (e.g., SST, the ITD, zonal (u) and meridional (v) winds at 700 hPa level, 2 m temperature and MSLP) in accordance with Tompkins and Giuseppe (2015) and White et al. (2015). This is to evaluate the skill of ECMWF-S2S re-forecasts in reproducing atmospheric dynamic mechanisms that may be responsible for monsoon variability over West Africa, vis-a-vis Nigeria on a monthly time-scale. Secondly, observed rainfall data from the rain-gauges of 46 meteorological stations (Figure 1A) obtained from the data archive of the Nigerian Meteorological Agency (NiMet; www.nimet.gov.ng) is used to evaluate the reproducibility skill of the ECMWF-S2S model forecasts on weekly and monthly time-scales over Nigeria.
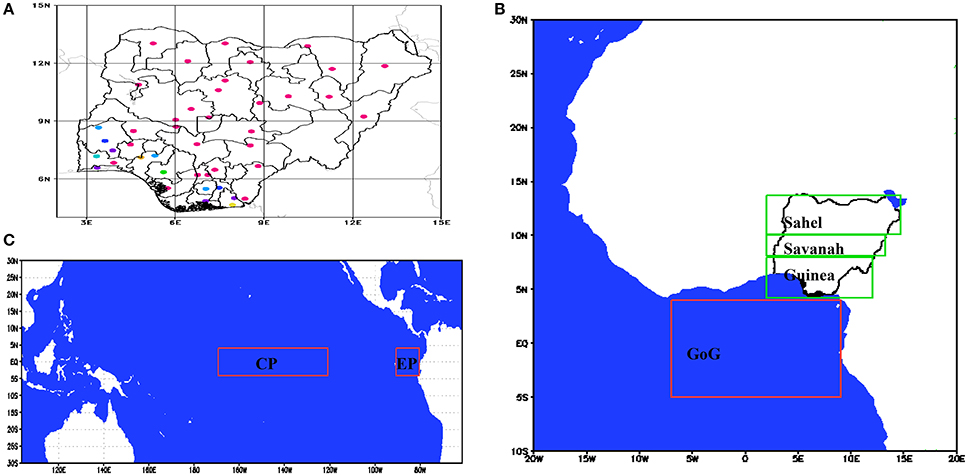
Figure 1. Maps showing (A) locations of synoptic stations used in this study (source: Olaniyan et al., 2015); (B) three climatological zones in Nigeria in (green boxes) and defined area of the Gulf of Guinea(GoG) over the Atlantic Ocean in (red box); and, (C) defined Areas of the Central and Eastern Pacific ocean in red boxes.
Qualitative assessments are carried out by utilizing statistical measures that summarize the deviations between observations and predictions, in relations to the inter-annual variability of standardized anomalies of all parameters. These are then plotted on Taylor diagrams (Taylor, 2001) to depict the normalized standard deviation (NSD) and the correlation coefficients (r) between the ECMWF-S2S model ensemble mean, ensemble members and the observations. The normalized standard deviations and correlations are with reference to observations and their plots quantify how closely that the model's predictions matches observations (IPCC, 2001). A measure of statistical significance, such as p-value (Mason, 2008), is also estimated for the correlations that were evaluated in this study. We estimated level of significance, where p = 0.05, for a two-tailed experiment to further lend credence to whatever linear association that may exist between the correlated parameters.
Synchronization (Misra, 1991) is evaluated to quantify how well the ECMWF-S2S model captures the timing and anomaly signs of the observed monthly climate parameters (rainfall, SST, 2 m temperature and MSLP). In this context, synchronization means the percentage of periods in which the signs of anomalies of climate parameters are correctly predicted. This is irrespective of the magnitude of the anomalies because seasonal climate prediction is probabilistic in nature and operationally presents its information as anomalies. Synchronization enables us to study the transition and persistence of climate parameters anomalies in both observation and forecasts (Lawal, 2015). Here, it denotes an agreement in the sign of the predicted and observed anomalies. A measure of statistical significance, such as p-value, confidence intervals, etc. cannot be evaluated for synchronization in this study because there are three possible reasons why the results may be misleading: (1) only a limited sample of forecast–observation pairs is available, (2) the forecasts may have been good (or bad) over this period, and (3) the experiment may have been naturally biased. As revealed by Mason (2008) p-values, when applied to probabilistic verification scores, cannot provide solutions to the above reasons. Nevertheless, we carried out a statistical assessment called sign-test (Sprent, 1989) to determine whether synchronization is achieved by chance or not. Sign-test, in addition to being used to test whether or not the forecast-observation pairs are equally sized, also determines the level of significance of these sign agreements. The outcomes of the test depend on the plus and minus signs of the difference between the forecast and observation pairs and not on their numerical strength. In this study, the sign-test has a p-value threshold set at 0.5.
Hit rates, in terms of percentage, are also evaluated for weekly cumulative rainfall. In this study, a hit occurs when a predicted weekly cumulative rainfall falls within ±30% of the observed event; it is not a definite yes/no prediction. For example, a rainfall prediction falling within 70–130 mm will be in agreement with a 100 mm observation. This is used to take care of unavoidable biases. Analyzing this will assist in determining the accumulation threshold of which the model's prediction of rainfall is reliable.
Furthermore, based on common climatology, Nigeria is divided into 3 climatological zones averaged along longitude 2–15°E (Figure 1B; Adejuwon and Odekunle, 2006). The first zone, known as Guinea Area, extends from the Gulf of Guinea (GoG; latitude 5–8°N) while the second zone extends from latitude 8 to 10°N and is known as Savannah Areas. The third zone is known as Sahel Areas (latitude 10–14°N). Likewise, sea surfaces over the Atlantic and Pacific Oceans were partitioned to depict Atlantic and Nino indices (Figures 1B,C). That is, the area average of SST between longitude 7°W−5°E and latitude 5°S−5°N over GoG is used in the analysis to depict Tropical Atlantic Index (Figure 1B; Enfield et al., 1999). Similarly, Pacific is partitioned into central (longitude 120–170°W and latitude 5°S−5°N) and eastern (longitude 80–90°W and latitude 5°S−5°N) regions to depict Nino 3.4 and Nino1+2 respectively (Figure 1C; Kug et al., 2009). All datasets used in this study were re-gridded to 1.5° × 1.5° for uniformity and ease of analyses. Table 2 presents the summary of various data used in this study.
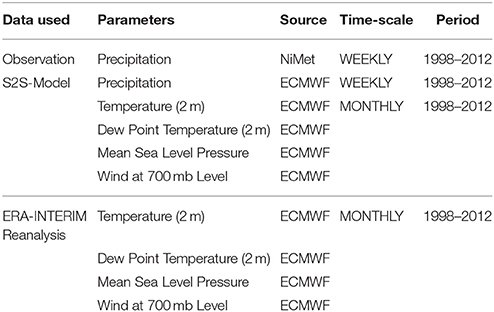
Table 2. Summary of data used in this study.
Results and Discussion
Atmospheric Dynamics
Sea Surface Temperature (SST)
The ECMWF-S2S model adequately captured the observed inter-annual variability of standardized SST anomalies over the central and eastern Pacific Ocean. On inter-annual basis, there are agreements in the signs of the standardized SST anomalies between the observation, the ensemble mean and the ensemble members (Figures 2A,C). This implies that the model captures the timing, including the transition and persistence, of the observed standardized SST anomalies; i.e., synchronization of the ensemble mean and ensemble members with observation is almost 100% over central and eastern Pacific Ocean. Sign-test shows that the synchronization is not statistically significant over the central Pacific (p = 0.8, > 0.5 threshold) while it is significant over the eastern Pacific (p = 0.43, < 0.5 threshold). These imply that correct SST forecasts made by the model over the eastern Pacific are reliable and do not happen by chance.
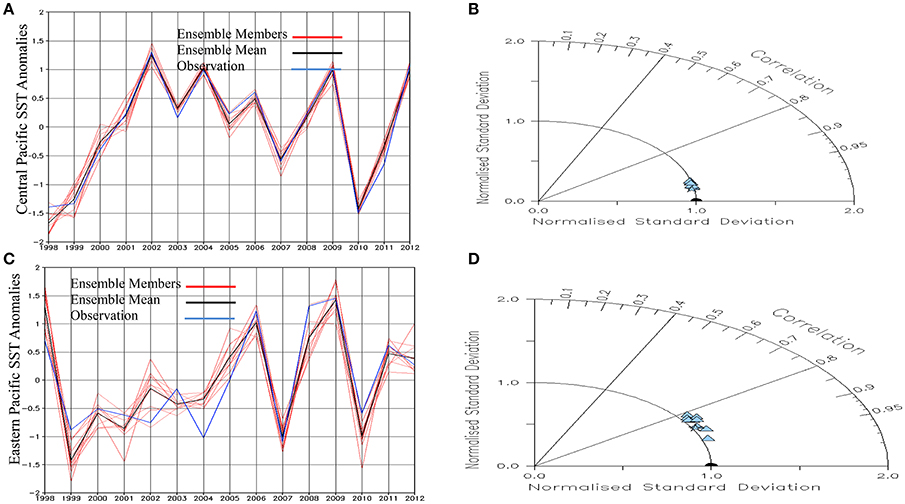
Figure 2. Inter-annual variability of standardized SST anomaly over (A) the Central and (C) Eastern Pacific by the ensemble members (red-lines), the ensemble mean(black-line) and observed Era-Interim (blue-line); (B,D) Taylor diagrams showing the normalized standard deviations and the correlation coefficients of S2S ensemble simulations with observation for panels a and c respectively (ensemble members—blue triangle; blue circle for negative correlations), ensemble mean—blue star and Era-Interim (observation)—black semi-circle. The normalized standard deviations and correlations are with reference to Era-Interim over same area.
In spite of occasional higher and lower SST variability compared to observation, the ensemble mean and ensemble members generally do not deviate greatly from the observation. This is depicted by NSDs which are approximately 1.0 (Figures 2B,D). There are strong direct relationships between the observation, ensemble mean and the ensemble members. For example, the average spatial correlations of the standardized SST anomalies between the observation, the ensemble mean and ensemble members of the ECMWF-S2S model are generally greater than 0.8 over both the central (Figure 2B) and eastern (Figure 2D) Pacific Ocean. These correlations are statistically significant as their p-values range between 0.001 and 0.0015, i.e., << 0.05. By inference, all ENSO events (e.g., Nino 3.4 and Nino1+2), for the periods considered in this study, are captured by the model.
The model also captured the observed inter-annual variability of standardized SST anomalies over the GoG (Figure 3A). ECMWF-S2S model also captures the transition and persistence of the observed standardized SST anomalies, though with lesser synchronization (between 80 and 90%) when compared to that of Pacific Ocean (Figure 3A). The relationships between the observation, ensemble mean and the ensemble members over the GoG are moderately direct (0.5 < r < 0.8) but with slightly lower variation than the observation (NSD < 1.0; Figure 3B). Measures of statistical significance show that the forecast-observation pairs are statistically related through correlation while they are not through synchronization. For example, the correlations between the observations, the ensemble mean and the ensemble members are statistically significant (evaluated p << 0.05). On the contrary, the sign-test for synchronization returns a p > 0.5, i.e., statistically not significant; implying that correct SST forecasts over GoG may be due to chances. Since SST conditions over GoG directly modulates rainfall patterns over Nigeria (Lawal, 2015), Odekunle and Eludoyin (2008) are of the opinion that underestimation of SST anomalies by models, over GoG, may be one of the reasons why models underestimate rainfall accumulation over Guinea Area (latitude 5–8°N).
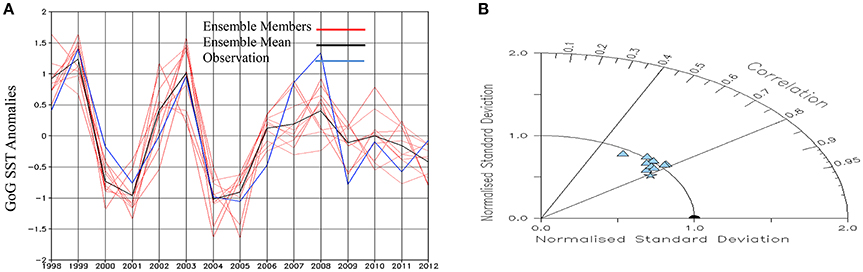
Figure 3. Inter-annual variability of standardized SST anomaly over (A) the Gulf of Guinea by the ensemble members (red-lines), the ensemble mean(black-line) and observed Era-Interim (blue-line); (B) Taylor diagram showing the normalized standard deviations and the correlation coefficients of S2S ensemble simulations with observation for panel a (ensemble members—blue triangle; blue circle for negative correlations), ensemble mean—blue star and Era-Interim (observation)—black semi-circle. The normalized standard deviations and correlations are with reference to Era-Interim over same area.
Inter-Tropical Discontinuity (ITD)
In most years, inter-annual variability of the predicted latitudinal position of the ITD, averaged over Nigeria and produced by the ensemble members of the ECMWF-S2S model, envelope the observed latitudinal position of the ITD. Exceptions are in 1999 and 2006 when observation is outside the spread of the ensemble members (Figure 4A). However, ensemble mean values are very close to, or sometimes the same with, the observed values. These imply that the model give a realistic prediction of the inter-annual variation of the observed latitudinal position of the ITD. Furthermore, the linear relationships between the observed latitudinal positions of the ITD and predictions by the ensemble mean and members over the country are moderately direct (0.5 < r < 0.7; Figure 4B). Here, p = 0.0055, << 0.05; implying that the correlations between the ensemble mean, members and observation is statistically significant. While the variability of some of the ensemble members are almost equal to that of observation, others have either lower or higher variability than the observation in terms of the ITD latitudinal positions (0.8 < NSD < 1.2; Figure 4B). Ensemble mean has the lowest variability when compared to observation (NSD ≈ 0.7). Some latitudinal deviations from the observation were also noted (Figure 4C). Latitudinal deviations of the predicted ITD spread around the northern and southern positions of the observation. These deviations range from 1° and 1.5° toward south and north respectively according to the spread of the ensemble members; while that of ensemble mean range from 0.7° southward and 0.8° northward. It is only in 1999 and 2006 that the ensemble means and all ensemble members agreeably displaced to the south and north of the observation respectively. These show that the ECMWF-S2S model is able to reproduce the latitudinal positions of the ITD during the peak of the monsoon over Nigeria; though, with some latitudinal deviations.
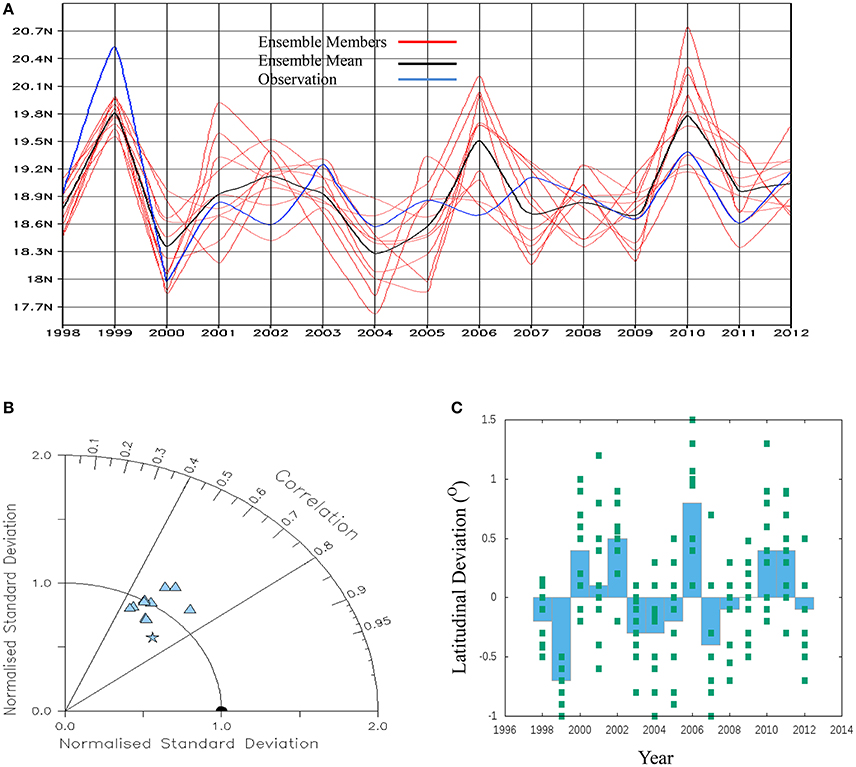
Figure 4. (A) Inter-annual variability of the latitudinal position of ITD (°N) over Nigeria during the peak of the monsoon (August) by the ensemble members (red-lines), the ensemble mean (black-line) and observed Era-Interim (blue-line); (B) Taylor diagram showing the normalized standard deviations and the correlation coefficients of S2S ensemble simulations with observation for panel a (ensemble members—blue triangle; blue circle for negative correlations), ensemble mean—blue star and Era-Interim (observation)—black semi-circle. The normalized standard deviations and correlations are with reference to Era-Interim over same area; and (C) Latitudinal deviation of the predicted ITD from the observed (Era-Interim) ITD as displayed by the ensemble mean (blue-bar) and the ensemble members (green squares).
There is no general pattern of ITD deviations from observation for the ENSO years considered in this study (Figure 4C). For instance, apart from 2009 (a moderate El-Nino year) which on the average displays no latitudinal deviation in ITD, the model's predicted ITD, relative to observations, is displaced southward in 2004 (a weak El-Nino year) and in 2012 (a neutral year). However, in both the La-Nina years (2010 and 2011), the model's average predicted ITD positions are about 0.4° northward of observations (Figure 4C). Ensemble members deviated and spread across the north and south of the observation during these ENSO years; thereby implying uncertainty in the general pattern of ITD displacement during these years.
Thermal-Lows
The atmospheric components that constitute thermal lows are captured by ECMWF-S2S model in different ways. While the model adequately captured the MSLP with little or no deviations in variability from the observation, it is unable to reproduce the maximum 2 m temperature that coincides with the lowest MSLP (Figure 5). The model captures the timing of the transition and persistence of the observed standardized MSLP anomalies (Figure 5A). Synchronization of the MSLP ensemble mean with observation is greater than 70%. Variability of MSLP ensemble members do not deviate greatly from the observation (NSD is almost 1.0); while the ensemble mean has lower variability than the observation (NSD < 1.0; Figure 5B). The linear relationship between the observation and the ensemble mean is moderately direct (0.5 < r < 0.6; p = 0.0032, << 0.05, hence statistically significant), and only two ensemble members have correlations that are greater than that of ensemble mean (r > 0.6). As depicted by Figures 5C,D, the model does not adequately capture the timing of the transition and persistence of the observed standardized 2 m temperature anomalies (Figure 5C). Synchronization of the 2 m temperature ensemble mean with observation is less than 55%. However, sign-tests show that correct forecasts achieved by the model, in both the MSLP and 2 m temperature, are due to chances as it returns p > 0.5, i.e., statistically not significant.
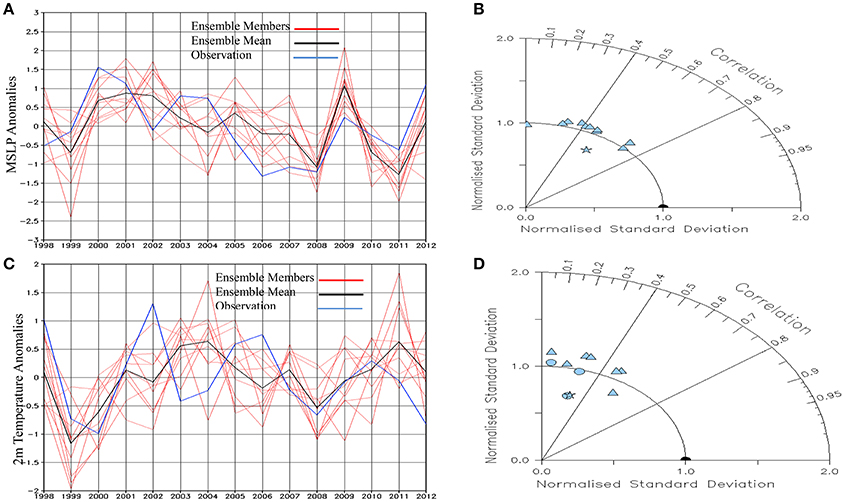
Figure 5. Inter-annual variability of standardized anomalies of (A) MSLP and (B) 2 m temperature anomaly averaged over Longitude 10°W−15°E and Latitude 18–25°N area depicted as Heat-Low position by the ensemble members (red-lines), the ensemble mean (black-line) and observed Era-Interim (blue-line); (B,D). Taylor diagrams showing the normalized standard deviations and the correlation coefficients of S2S ensemble simulations with observation for (A,C) respectively (ensemble members—blue triangle; blue circle for negative correlations), ensemble mean—blue star and Era-Interim (observation)—black semi-circle. The normalized standard deviations and correlations are with reference to Era-Interim over same area.
The linear association between the observed and the predicted 2 m temperature is weak (Figure 5D). Three ensemble members are negatively correlated with observation; positive correlation coefficients among the ensemble members range from 0.1 to 0.6 while their variability compared to observation is mild (0.7 < NSD < 1.2). Ensemble mean also has a low variability compared to observation (NSD < 0.7) with a very poor linear association (r ≈ 0.3; Figure 5D). These are further corroborated by p >> 0.05; implying lack of statistical significance. Nevertheless, the heat-lows predicted by the ECMWF-S2S model have close structural similarities to the observed heat-lows in all the ENSO phases considered (figure not shown). In agreement with the findings of Lavaysse et al. (2009), predictions from the model show that the heat-lows tilt south-ward by orientating from north-west around Southern Algeria to Northern Chad. However, the model underestimates the surface temperatures at the core of the low pressure systems.
African Easterly Jet (AEJ)
ECMWF-S2S model captures the wind strength and direction of the AEJ, at 700 hPa level, differently. On inter-annual basis the model slightly under-estimates the zonal wind strength, which depicts the core of the AEJ, by about 2–5 ms−1 (Figures 6a,b). Irrespective of the ENSO phase, the model generally put the core of the AEJ about 2–3° northward of the observation (Figure 6). Ensemble members of the model spread between latitude 12.5°N to about 19.5°N to envelope the observed core of the AEJ (Figure 6b). Spatially, the model captures the structural patterns of the wind directions (figure not shown). Climatologically, the model reproduces the spatial and behavioral patterns of the three cores of the AEJ (the eastern, central and western cores Figure 6c); though, with slight deviation in the positions and strength. These findings are similar to those of Grist and Nicholson (2001), Afiesimama (2007), and Spinks et al. (2015). These imply that, irrespective of the ENSO phase considered and apart from wind directions, the ECMWF-S2S model poorly reproduce the wind strength that could depict AEJ at the 700 hPa level.
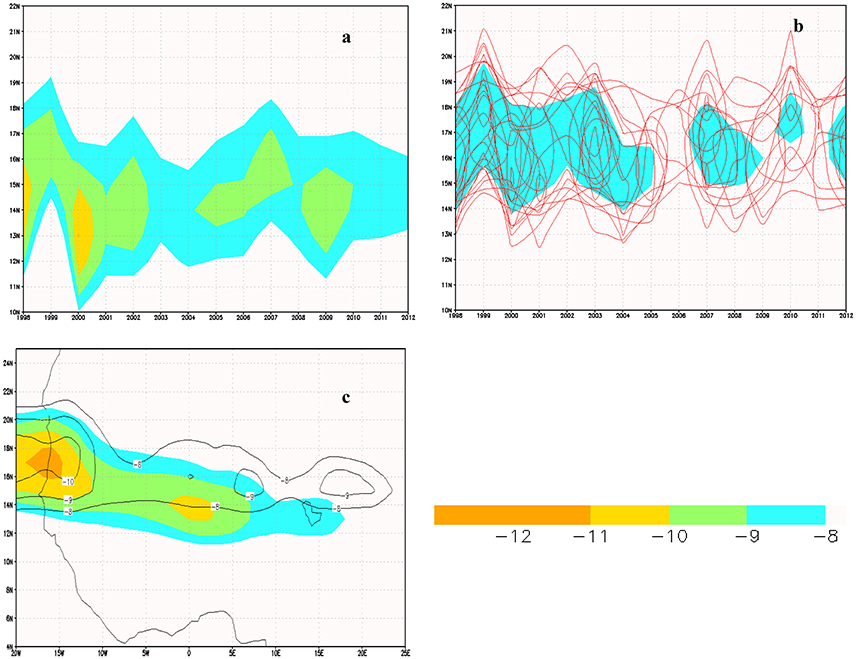
Figure 6. Inter-annual variability of AEJ over West Africa as depicted by zonal wind speed (ms−1) from (a) the Era-Interim and (b) the ECMWF-S2S model. Shaded in (b) is the Ensemble Mean while the red contours are the Ensemble Members. (c) Spatial distribution of climatology of the AEJ over West Africa from era-interim (shaded) and the ensemble mean (contour) of the ECMWF-S2S forecast.
Does the ECMWF-S2S Model's Reproduction of the Atmospheric Dynamics Translate to Reliable Precipitation Forecasts?
Provisional response to the above question depends on the climatological zone and the rainfall attribute that is under scrutiny. The zones under scrutiny are the Gulf of Guinea (GoG: latitude 5–8°N), Savannah Areas (latitude 8–0°N) and Sahel Areas (latitude 10–14°N). Rainfall attributes considered are the inter-annual distribution of rainfall anomalies and cumulative rainfall amounts.
Distribution of Rainfall Anomalies on Inter-Annual Time-Scales in August
There are differences on how the ECMWF-S2S model ensemble mean and ensemble members capture the inter-annual variability of the standardized rainfall anomalies, on inter-annual time-scales, over the GoG, the Savannah and the Sahel.
The model performs least over the GoG. On inter-annual basis, there are few agreements, between the observation, the ensemble mean and the ensemble members, in the signs of the standardized rainfall anomalies over GoG. For instance, apart from 2004, 2007, 2009, and 2010, the ensemble mean of the model does not capture the transitions that were observed between 1998 and 2008 (Figure 7A). Though, it captures the observed persistence in 2009 and 2010; it however grossly has lower variability (NSD < 1.0) when compared to the observed standardized rainfall anomalies while all ensemble members have higher variability (NSD > 1.0; Figure 7B) in comparison to the observation. The direct relationship between the observation and the ensemble mean is weak (r < 0.2; p = 0.8263, >> 0.05, hence statistically not significant). In addition, three of the ensemble members had negative correlations with the observation. In this climatological zone, ensemble-member-1 performs best (synchronization > 65%) while the worst ensemble members are 4 and 6 (synchronization < 35%: Figure 8). The ensemble mean has slightly greater than 50% synchronization with observation (sign-test p = 0.44, < 0.5; statistically significant). This implies that the model will reliably make one correct forecast out of two forecasts over GoG.
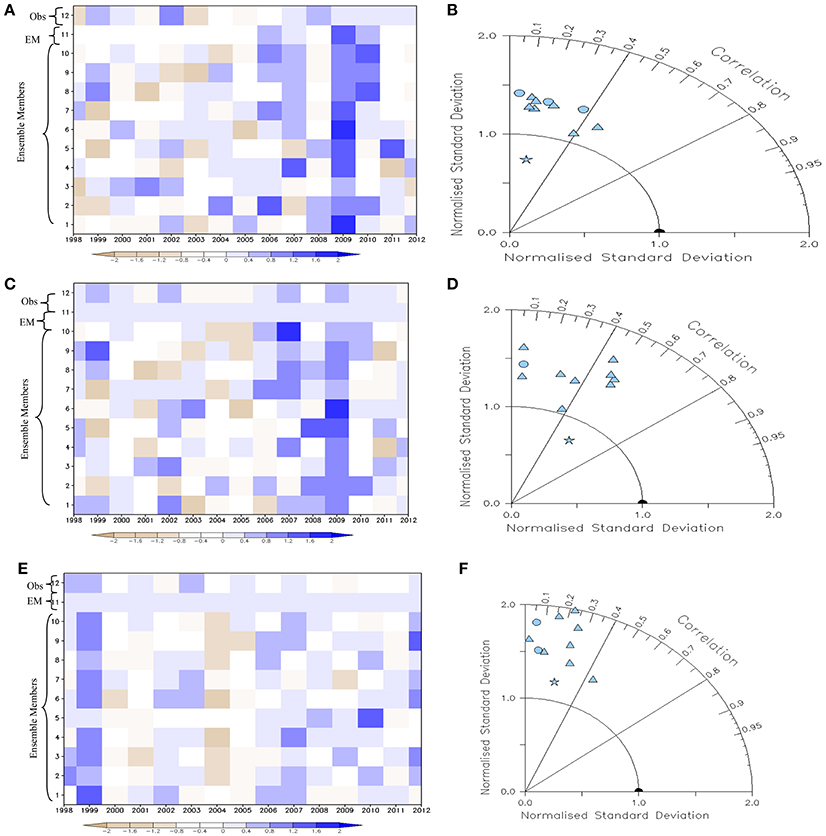
Figure 7. Inter-annual variability of standardized rainfall anomalies over climatological zones of Nigeria (A) GoG, (C) Savannah, and (E) the Sahel [EM—the Ensemble Mean and Obs—the Observation]; (B,D,F) Taylor diagrams showing the normalized standard deviations and the correlation coefficients of S2S ensemble simulations with observation for panels a and c respectively (ensemble members—blue triangle; blue circle for negative correlations), ensemble mean—blue star and Era-Interim (observation)—black semi-circle. The normalized standard deviations and correlations are with reference to Era-Interim over same area.
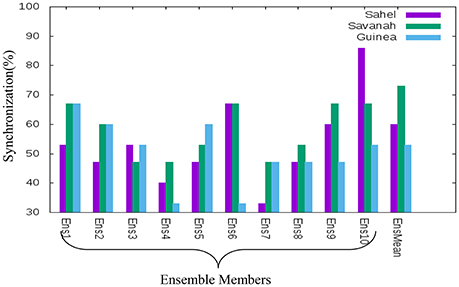
Figure 8. Synchronization (%) of the simulated inter-annual rainfall anomalies between the Ensemble members and the Ensemble mean with reference to observation over the climatological zones of Nigeria (GoG, Savannah and Sahel).
The most impressive performance of the ECMWF-S2S model is over the Savannah. In comparison to what obtains over GoG, there are more agreements between the observation, the ensemble mean and the ensemble members in the signs of the standardized rainfall anomalies in this zone. The ensemble mean of the model captures the transitions that were observed between 2000 and 2002 (Figure 7C). It also captures the observed persistence in 2003–2005 and 2009–2010. Though, the ensemble means slightly under-estimates the variability (NSD < 1.0) of the observed standardized rainfall anomalies; the linear relationship between the observation and the ensemble mean is however moderate (r > 0.5; Figure 7D). Here, p = 0.0377, << 0.05; implying that the correlations between the ensemble mean and observation is statistically significant. All ensemble members over-estimate the observed variability (NSD > 1.0), while only one of the ensemble members had negative correlations with the observation. Ensemble members 1, 6, and 10 perform brilliantly (synchronization > 65%) while the worst ensemble member is ensemble-member-7 (synchronization < 50%: Figure 8). The ensemble mean has almost 75% synchronization with observation. This synchronization is statistically significant as the sign-test returns a p = 0.1967, < 0.5. This implies that the model will reliably make three correct forecasts out of four forecasts over Savannah.
The model performs moderately over the Sahel. There are fewer agreements between the observation, the ensemble mean and the ensemble members in the signs of the standardized rainfall anomalies when compared to the situations over the Savannah. Though, the ensemble mean captures some transition and persistence (Figure 7E), it however over-estimates the observed variability (NSD > 1.0; Figure 7F). Also, all ensemble members over-estimate the observed variability (NSD > 1.0). Two of the ensemble members had negative correlations with the observation while the direct relationship between the observation and the ensemble mean is also weak (r < 0.3; p = 1.0712, >> 0.05, hence statistically not significant). Ensemble-member-10 performs best in this zone (synchronization > 85%) while the worst ensemble member is ensemble-member-7 (synchronization < 35%: Figure 8). The ensemble mean has about 60% synchronization, which is not statistically significant, with observation (sign-test p > 0.5). This implies that the model will by chance make three correct forecasts out of five forecasts over the Sahel.
Over Nigeria, associations between the observed rainfall anomalies, the predicted rainfall anomalies and theoretical expectations during ENSO events are inconsistent. According to http://www.cpc.ncep.noaa.gov, Latif and Grotzner (2000), Camberlin et al. (2001), Conway (2009), Zebiak et al. (2014), and Lawal (2015), theoretical expectations are that drier than normal conditions are usually observed over West Africa, vis-à-vis Nigeria, during El Nino events, and vice versa during La Nina events. However, corresponding inter-annual rainfall (Figures 7A,C,E) and the SST anomalies over the central Pacific Ocean (Figure 2A) show that most of the anomaly signs of the observed rainfall anomalies do not match both the predicted and the theoretically expected rainfall anomalies (Table 3). For instance, in 2004 (a weak El Nino year), while the observed anomalies do not match the theoretical expectation over GoG and Sahel; the predicted anomalies do not match theoretical expectation over GoG and Savannah (Table 3). In 2009 (a moderate El Nino year), prediction does not capture theoretical reasoning throughout the country; except over Sahel where observation match the theoretical reasoning. While the entire country experienced normal rainfall in 2010 and 2011 which are La Nina years, instead of surplus rainfall (Table 3), the model only capture the theoretical reasoning over GoG in 2010. Though, all ENSO events (e.g., Nino 3.4 and Nino1+2), are captured by the ECMWF-S2S model (Figure 2); but not all the corresponding rainfall anomalies (observed or theoretical) are captured by the model. The observed inconsistencies show that ENSO alone may not be the only climate index (i.e., atmospheric tele-connection) that modulates rainfall anomalies over West Africa, vis-à-vis Nigeria. Other climate indices may have also played crucial roles in the structures of the observed rainfall (Lyon and Mason, 2007; Ujeneza et al., 2015).
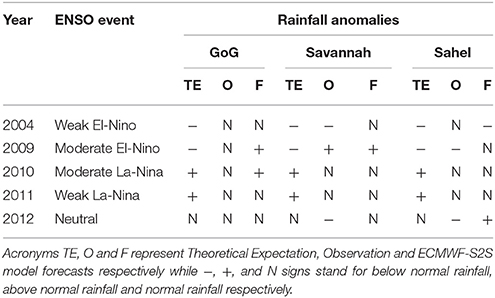
Table 3. ENSO events and the observed rainfall anomalies as extracted from the 1st and 2nd top rows of Figures 2A, 7A,C,E.
Evaluation of Quantitative Precipitation Forecasts
The ECMWF-S2S model may not be able to forecast extreme precipitation reliably. Figures 9A–F shows that the model's ability to reliably capture weekly accumulation of rainfall reduces as higher rainfall accumulation values are attained. All the climatological zones (i.e., Guinea, Savannah and Sahel) exhibited this behavior. As earlier stated, the model's weekly cumulative rainfall is correct if it falls within +/−30% of the observation amount. Climatologically and for the ENSO phases considered, the model predicts rainfall accumulation best over the Sahel; and least over the Guinea areas (Figure 9). At 50% hit rate for example, the model may reliably capture weekly accumulation of rainfall of about 40, 60, and 80 mm over Guinea, Savannah and Sahel respectively. This implies that the ability of the model to reliably forecast quantitative precipitation increases toward the Sahel. In addition, the disagreement between the model's ensemble members increases as higher rainfall accumulation values are attained; i.e., the ensembles converge at lower rainfall accumulation values while they diverge at higher values. The general implication here is that the reproducibility of the atmospheric dynamics by ECMWF-S2S model is a better measure of rainfall than the actual quantitative rainfall forecasts.
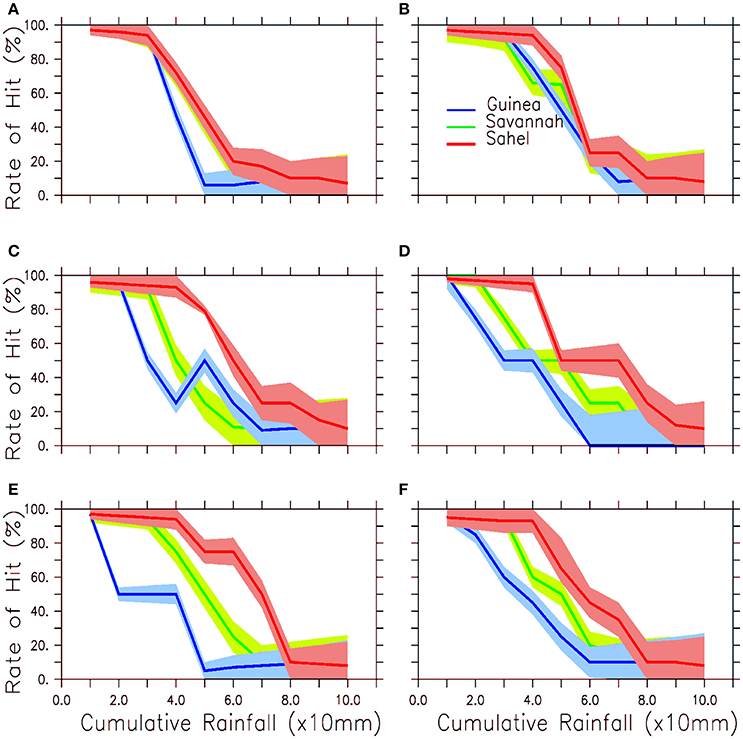
Figure 9. Percentage of hit of weekly cumulative rainfall amount (mm) by the ECMWF-S2S model over Nigeria; Sahel (red line and shade), Savannah (green line and shade) and Guinea (blue line and shade) in August (A) 2004, (B) 2009, (C) 2010, (D) 2011, (E) 2012, and (F) climatology.
Conclusion
This paper investigates three things that are yet to be known regarding the predictive skills of the ECMWF-S2S model over Nigeria. These three unknown things are: (1) the ability of the ECMWF-S2S model to reproduce monsoon related atmospheric dynamics that are predominant during different phases of ENSO; (2) the skill of the ECMWF-S2S model at forecasting rainfall anomalies distribution on an inter-annual time-scales during the peak of the monsoon; and, (3) the ability of the ECMWF-S2S model to forecast extreme events during the monsoon periods. The paper then goes ahead to investigate whether the ability of the model to forecast atmospheric dynamics translate to reliable precipitation forecasts over Nigeria?
Results show that ECMWF-S2S model has the capability to adequately and reliably forecast atmospheric dynamics that are predominant during the peak of the monsoon. For instance, on inter-annual basis, the model adequately captured the observed variability of standardized SST anomalies over the central and eastern Pacific Ocean; with very great synchronization (almost 100%). This inferred that all ENSO events were captured by the model. In spite of the fact that SST conditions over GoG directly modulates rainfall patterns over Nigeria, the model captured the observed inter-annual variability of standardized SST anomalies over the GoG but with lesser synchronization (between 80 and 90%) when compared to that of Pacific Ocean. ECMWF-S2S model is also able to reproduce the latitudinal positions of the ITD during the peak of the monsoon over Nigeria, but with slight latitudinal deviations. Worthy of note is that there is no general pattern of ITD deviations from observation for the ENSO years considered in the study. While the model adequately captured the MSLP with little or no deviations from the observation, it is unable to reproduce the maximum 2 m temperature that coincides with the lowest MSLP. Irrespective of the ENSO phase and apart from wind directions that were adequately captured, the ECMWF-S2S model slightly under-estimates the zonal wind strength, which depicts the core of the AEJ, by about 2–5 ms−1. It placed core of the AEJ about 2–3° northward of the observation.
The model's ability to predict atmospheric dynamics does not automatically translate to reliable precipitation forecasts. On inter-annual time-scales, ECMWF-S2S model performs best over the Savannah. Here, the best and the worst ensemble members have greater than 65% and less than 50% synchronization with observation respectively. However, the ensemble mean has almost 75% synchronization with observation, implying that the model will thrice make correct forecast out of four forecasts. On the contrary, the model's performance is worst over Guinea where the direct relationship between the observation and the ensemble mean is weak (r < 0.2). In addition, three of the ensemble members had negative correlations with the observation. Furthermore, the ensemble mean has slightly greater than 50% synchronization with observation. This implies that the model will once make correct forecast out of two forecasts. Interestingly, ECMWF-S2S model did not adequately capture the observed rainfall anomalies over Nigeria during ENSO events. Associations between the observed rainfall anomalies, the predicted rainfall anomalies and theoretical expectations during ENSO events are inconsistent. Corresponding inter-annual rainfall and the SST anomalies over the central Pacific Ocean reveal that most of the anomaly signs of the observed rainfall anomalies do not match both the predicted and the theoretically expected rainfall anomalies.
Quantitatively, the model predicts rainfall accumulation best over the Sahel; and least over the Guinea areas. It may however not be able to forecast extreme precipitation reliably. This is because the disagreement between the model's ensemble members increases as higher rainfall accumulation values are attained. That is, the ensembles converge at lower rainfall accumulation values while they diverge at higher values. This part of the results may be reflecting the complexity of the quantitative precipitation forecast (QPF). Even with ever improving computer resources, as noted by QPF is still known to be the most difficult aspect of operational meteorology. The general implication here is that the reproducibility of the atmospheric dynamics by ECMWF-S2S model is a better measure of rainfall prediction than the actual quantitative rainfall forecasts.
We have shown that the ECMWF-S2S model could be a good tool for precipitation forecasts in Nigeria, especially in areas from latitude 10° north-ward. However, the ability of the model to forecast rainfall anomaly, a crucial element of S2S forecast, appears very weak during ENSO events. There might be several reasons for this weak skill in predicting rainfall anomaly during ENSO events. For instance, the model failed to reproduce equivalently strong winds at 700 hPa level to depict AEJ and also under-estimates SST over GoG. As the rain-bearing disturbances are generally linked to well-organized mesoscale features in August, AEJ may be the most important driving mechanism; it may even be more important than the ITD (Grist and Nicholson, 2001). It will therefore mean that the reproducibility of the atmospheric dynamic by the model is a better measure of rainfall prediction than the actual quantitative rainfall forecasts especially in areas south of latitude 10°N. We therefore suggest considering some climate driving mechanisms as predictability sources for the ECMWF-S2S model to enable the atmospheric dynamics to be better represented in the model.
Author Contributions
All authors listed have made a substantial, direct and intellectual contribution to the work, and approved it for publication.
Conflict of Interest Statement
The authors declare that the research was conducted in the absence of any commercial or financial relationships that could be construed as a potential conflict of interest.
Acknowledgments
We thank the Nigerian Meteorological Agency (NiMet: www.nimet.gov.ng) for providing the data used in this study. We also appreciate Daithi A. Stone (Lawrence Berkeley National Laboratory, California, USA), Babatunde J. Abiodun (Dept of Environmental and Geographical Sciences, University of Cape Town, Cape Town, South Africa) and Tomkins Adrian (International Center for Theoretical Physics (ICTP), Trieste, Italy) for their immense contribution toward the successful completion of this work. The first Author wishes to thank the ICTP for their support while all the authors sincerely appreciate the efforts of the two reviewers for their contributory comments.
References
Adejuwon, J. O., and Odekunle, T. O. (2006). Variability and the severity of the little dry season in Southwestern Nigeria. J. Clim. 9, 483–493. doi: 10.1175/JCLI3642.1
Afiesimama, E. A. (2007). Annual cycle of the mid-tropospheric easterly jet over West Africa. Theor. Appl. Climatol. 90, 103–111. doi: 10.1007/s00704-006-0284-y
Bechtold, P., Chaboureau, J. P., Beljaars, A. M., Betts, A. K., Kohler, M., Miller, M., et al. (2004). The simulation of the diurnal cycle of convective precipitation over land in global models. Q. J. R. Meteorol. Soc. 130, 3119–3137. doi: 10.1256/qj.03.103
Buizza, R., Bidlot, J. R., Wedi, N., Fuentes, M., Hamrud, M., Holt, G., et al. (2006). The ECMWF variable resolution ensemble doiiction system (VAREPS). ECMWF Newslett. 108, 14–20.
Camberlin, P., Janicot, S., and Poccard, I. (2001). Investigating ElNO-Southern Seasonality and atmospheric dynamics of the teleconnection between African rainfall and tropical sea-surface temperature: Atlantic vs. ENSO. Int. J. Climatol. 21, 973–1005. doi: 10.1002/joc.673
Conway, G. (2009). The Science of Climate Change in Africa: Impacts and Adaptation. Available online at: www.imperial.ac.uk/climatechange/publications.
Couvreux, F., Guichard, F., Bock, O., Campistron, B., and Lafore, J. P. (2010). Synoptic variability of the monsoon flux over West Africa prior to the onset. Q. J. R. Meteorol. Soc. 136, 159–173. doi: 10.1002/qj.473
Diedhiou, A., Janicot, S., Viltard, A., de-Felice, P., and Laurent, H. (1998). A fast moving easterly wave of the West Africa troposphere. Meteor. Atmos. Phys. 69, 39–47. doi: 10.1007/BF01025182
Enfield, D. B., Mestas-Nunez, A. M., Mayer, D. A., and Cid-Serrano, L. (1999). How ubiquitous is the dipole relationship in tropical Atlantic sea surface temperatures? J. Geophys. Res. 104, 7841–7848. doi: 10.1029/1998JC900109
Fink, A. H., Vincent, D. G., and Ermert, V. (2006). Rainfall types in the West African sudanian zone during the summer monsoon 2002. Mon. Wea. Rev. 134, 2143–2164. doi: 10.1175/MWR3182.1
Fontaine, B., Janicot, S., and Moron, V. (1995). Rainfall anomaly patterns and wind field signals over West Africa in August (1958-1989). J. Clim. 8, 1503–1510. doi: 10.1175/1520-0442(1995)008<1503:RAPAWF>2.0.CO;2
Grist, J. P., and Nicholson, S. E. (2001). Easterly waves over Africa. Part II: observed and modeled contrasts between wet and dry years. Mon. Wea. Rev. 130, 212–225. doi: 10.1175/1520-0493(2002)130<0212:EWOAPI>2.0.CO;2
Ilesanmi, O. O. (1971). An emperical formulation of an ITD rainfall model for the tropics: a case study of Nigeria. J. Appl. Clim. 10, 882–891. doi: 10.1175/1520-0450(1971)010<0882:AEFOAI>2.0.CO;2
IPCC (2001). Climate Change 2001: The Scientific Basis Contribution of Working Group I to the Third Assessment Report of the Intergovernmental Panel on Climate Change, eds J. T. Houghton, Y. Ding, D. J., Griggs, M. Noguer, P. J., and van der Linden (Cambridge, UK: The Press Syndicate of the University of Cambridge).
Kug, J.-S., Jin, F.-F., and An, S.-II. (2009). Two types of El Niño events: cold tongue El Niño and warm pool El Niño. J. Clim. 22, 1499–1515. doi: 10.1175/2008JCLI2624.1
Latif, M., and Grotzner, A. (2000). On the equatorial Atlantic oscillation and its response to ENSO. Clim. Dyn. 16, 213–218. doi: 10.1007/s003820050014
Lavaysse, C., Diedhiou, A., Laurent, H., and Lebel, T. (2006). African easterly waves andconvective activity in wet and dry sequences of the West African monsoon. Clim. Dyn. 27, 319–332. doi: 10.1007/s00382-006-0137-5
Lavaysse, C., Flamant, C., Janicot, S., and Knippertz, P. (2010). Links between African easterly waves, midlatitude circulation and intraseasonal pulsations of the West African heat low. Q. J. R. Meteorol. Soc. 136, 141–158. doi: 10.1002/qj.555
Lavaysse, C., Flamant, C., Janicot, S., Parker, D. J., Lafore, J.-P., Sultan, B., et al. (2009). Seasonal evolution of the West African heat low: a climatological perspective. Clim. Dyn. 33, 313–330. doi: 10.1007/s00382-009-0553-4
Lawal, K. A. (2015). Understanding the Variability and Predictability of Seasonal Climates over West and Southern Africa using Climate Models. Ph.D., thesis, Faculty of Sciences University of Cape Town SA. Available online at: https://open.uct.ac.za/handle/11427/16556?show=full.
Lawal, K. A., Abatan, A. A., Anglil, O., Olaniyan, E., Olusoji Victoria, H., Oguntunde, P. G., et al. (2016). The late onset of the 2015 wet season in Nigeria. BAMS 97, 63–69 doi: 10.1175/BAMS-D-16-0131.1
Lazo, J. K., Lawson, M., Larsen, P. H., and Waldman, D. M. (2011). sensitivity to weather varia. Bull. A. Meteor. Soc. 92, 709–720. doi: 10.1175/2011BAMS2928.1
Lynch, K. J., Brayshaw, D. J., and Charlton-Perez, A. (2014). Verification of European subseasonal wind speed forecasts. Mon. Wea. Rev. 142, 2978–2990. doi: 10.1175/MWR-D-13-00341.1
Lyon, B., and Mason, S. J. (2007). The 1997–98 summer rainfall season in southern Africa. Part I: observations. J. Clim. 20, 5134–5148. doi: 10.1175/JCLI4225.1
Mason, S. J. (2008). Understanding forecast verification statistics. Meteorol. Appl. 15, 31–40. doi: 10.1002/met.51
Misra, J. (1991). Phase synchronization. Inf. Process. Lett. 38, 101–105. doi: 10.1016/0020-0190(91)90229-B
Newman, M., Sardeshmukh, P. D., Winkler, C. R., and Whitaker, J. S. (2003). A study of sub-seasonal predictability. Mon. Wea. Rev. 131, 1715–1732. doi: 10.1175/2558.1
Null, J. (2013). El Nino and La Nina Years and Intensities Based on Oceanic Nino Index(ONI). Available online at: http://ggweather.com/enso/oni.htm
Odekunle, T. O., and Eludoyin, A. O. (2008). Sea surface temperature patterns in the Gulf of Guinea: their implications for the spatio-temporal variability of precipitation in West Africa. Int. J. Climatol. 28:15071517. doi: 10.1002/joc.1656
Okwori, J., Ajegi, S. O., Ochinyabo, S., and Abu, J. (2015). An empirical investigation of malthusian population theory in Nigeria. JETEMS 6, 367–375.
Olaniran, O. J., and Babatolu, J. S. (1987). Climate and the growth of Sorghum at Kabba, Nigeria. J. Agric. Meteor. 42, 301–308. doi: 10.2480/agrmet.42.301
Olaniyan, E., Afiesimama, E., Oni, F., and Lawal, K. A. (2015). Simulating the daily evolution of West African monsoon using high resolution regional cosmo-model: a case study of the first half of 2015 over Nigeria. J. Climatol. Weather Forecast. 3, 1–8. doi: 10.4172/2332-2594.1000142
Omotosho, J. B., and Abiodun, B. J. (2007). A numerical study of moisture build-up and rainfall over West Africa. Meteorol. Appl. 14, 209–225. doi: 10.1002/met.11
Osunade, M. A. A. (1994). Indigenous climate knowledge and agricultural practice in Southwestern Nigeria. Malaysian, J. Trop. Geogr. 25, 21–28.
Palmer, T. N., Buizza, R., DoblasReyes, F., Jung, T., Leutbecher, M., Shutts, G. J., et al. (2009). Stochastic Parametrization and Model Uncertainty. ECMWF Research Department Technical Memorandum n., 598, 42.
Parker, D. J., Thorncroft, C. D., Burton, R., and Diongue-Niang, A. (2005). Analysis of the African easterly jet, using aircraft observations from the JET 2000 experiment. Q. J. R. Meteorol. Soc. 131, 1461–1482 doi: 10.1256/qj.03.189
Redelsperger, J. L., Diongue, A., Diedhiou, A., Ceron, J. P., and Diop, M. (2002). Multi-scale description of a Sahelian synoptic weather system representative of the West African monsoon. Q. J. R. Meteorol. Soc. 128, 1229–1257. doi: 10.1256/003590002320373274
Robertson, D. E., and Wang, Q. J. (2012). A Bayesian approach to predictor selection for seasonal streamflow forecasting. J. Hydrometeorol. 13, 155–171. doi: 10.1175/JHM-D-10-05009.1
Rowell, D. P., and Milford, J. R. (1993). On the generation of African squall lines. J. Clim. 6, 1181–1193 doi: 10.1175/1520-0442(1993)006<1181:OTGOAS>2.0.CO;2
Spinks, J., Yuh-Lang, L., and Ademe, M. (2015). Effects of the subtropical anticyclones over North Africa and Arabian Peninsula on the African easterly jet. Int. J. Climatol. 35, 733–745. doi: 10.1002/joc.4017
Sprent, P. (1989). Applied Nonparametric Statistical Methods, 2nd Edn. Boca Raton, FL: CRC Press; Taylor & Francis Group.
Sultan, B., and Janicot, S. (2003). The West African monsoon dynamics. Part II: the pre-onset and onset of the summer monsoon. J. Clim. 16, 3407–3427. doi: 10.1175/1520-0442(2003)016<3407:TWAMDP>2.0.CO;2
Taylor, K. E. (2001). Summarizing multiple aspects of model performance in a single diagram. J. Geophys. Res. 106, 7183–7192. doi: 10.1029/2000JD900719
Tiedtke, M. (1989). A comprehensive mass flux scheme for cumulus parameterization in large-scale models. Monthly Weather Rev. 117, 1779–1800. doi: 10.1175/1520-0493(1989)117<1779:ACMFSF>2.0.CO;2
Tiedtke, M. (1991). “Aspects of cumulus parameterization,” in Proceeding of the ECMWF Seminar on Trppical Extra-Tropical Interactions, Bull. ECMWF (Reading: ECMWF), 441–466.
Tompkins, A. M., and Feudale, L. (2010). West Africa monsoon seasonal precipitation forecasts in ECMWF System 3 with a focus on the AMMA SOP. J. Apll. Meteor. Climatol. 25, 768–788. doi: 10.1175/2009WAF2222236.1
Tompkins, A. M., and Giuseppe, F. D. (2015). Potential predictability of malaria in Africa using ECMWF monthly and seasonal climate forecasts. J. Apll. Meteor. Climatol. 51, 521–540. doi: 10.1175/JAMC-D-14-0156.1
Ujeneza, E. L., and Abiodun, B. J. (2015). Drought regimes in Southern Africa and how well GCMs simulate them. Clim. Dyn. 44, 1595–1609. doi: 10.1007/s00382-014-2325-z
Vitart, F., Ardilouze, C., Bonet, A., Brookshaw, A., Chen, M., Codorean, C., et al. (2017). The sub-seasonal to seasonal (S2S) predictionproject database. BAMS 98, 163–173. doi: 10.1175/BAMS-D-16-0017.1
Vitart, F., Balsamo, G., Buizza, R., Ferranti, L., Keeley, S., Molteni, F., et al. (2014). Sub-seasonal Predictions. European Centre for Medium Range Weather Forecasts. Technical Memorandum No., 738,
Vitart, F., Robertson, A. W., and Anderson, D. T. (2012). Sub-seasonal to Seasonal Prediction Project: bridging the gap between weather and climate. WMO Bull. 61, 23–28.
White, C. J., Franks, S. W., and McEvoy, D. (2015). Using sub-seasonal-to-seasonal (S2S) extreme rainfall forecasts for extended-range flood prediction in Australia. IAHS 370, 229–234. doi: 10.5194/piahs-370-229-2015
Wu, M.-L. C., Reale, O., Schubert, S. D., Suarez, M. J., Koster, R. D., and Pegion, P. J. (2009). African easterly jet: structure and maintenance. J. Clim. 22. 4459–4480. doi: 10.1175/2009JCLI2584.1
Keywords: ECMWF, monsoon, Nigeria, precipitation, S2S model, seasonal forecast
Citation: Olaniyan E, Adefisan EA, Oni F, Afiesimama E, Balogun AA and Lawal KA (2018) Evaluation of the ECMWF Sub-seasonal to Seasonal Precipitation Forecasts during the Peak of West Africa Monsoon in Nigeria. Front. Environ. Sci. 6:4. doi: 10.3389/fenvs.2018.00004
Received: 23 June 2017; Accepted: 11 January 2018;
Published: 02 February 2018.
Edited by:
Frederic Vitart, European Centre for Medium-Range Weather Forecasts, United KingdomReviewed by:
Eduardo Zorita, Helmholtz-Zentrum Geesthacht Centre for Materials and Coastal Research (HZG), GermanyAna María Durán-Quesada, University of Costa Rica, Costa Rica
Copyright © 2018 Olaniyan, Adefisan, Oni, Afiesimama, Balogun and Lawal. This is an open-access article distributed under the terms of the Creative Commons Attribution License (CC BY). The use, distribution or reproduction in other forums is permitted, provided the original author(s) and the copyright owner are credited and that the original publication in this journal is cited, in accordance with accepted academic practice. No use, distribution or reproduction is permitted which does not comply with these terms.
*Correspondence: Eniola Olaniyan, olaniyan.eniola67@gmail.com