Expert Based Ecosystem Service Assessment in Coastal and Marine Planning and Management: A Baltic Lagoon Case Study
 Gerald Schernewski
 Miguel Inácio
 Yaroslava Nazemtseva1
- 1Coastal Research and Management Group, Leibniz Institute for Baltic Sea Research (LG), Warnemünde, Germany
- 2Marine Research Institute, Klaipeda University, Klaipeda, Lithuania
The assessment of ecosystem services, the benefits humans obtain from ecosystems, is a worldwide topic of growing interest, but examples addressing coastal and marine waters are still a small minority. In this study, we carry out an expert based ecosystem service assessment for a concrete case study, the Szczecin (Oder) Lagoon located at the German/Polish border in the Baltic Sea region. We analyze to what extent, in which step and how it can be applied for supporting Integrated Coastal Zone Management (ICZM), the ecological-social-economic assessment within System Approach Frameworks (SAF), and Marine Spatial Planning (MSP). The large, shallow Szczecin Lagoon is heavily eutrophied. Therefore, several alternative measures (scenarios) are under discussion to improve its water quality and its ecological status. Scenarios include a large-scale mussel farm; the establishment of a local mussel farm that removes nutrients via harvest and increases water transparency; artificial mussel beds; groins to reduce coastal current velocities, favor sediment accumulation, and promote the enlargement of macrophyte beds and other measures to enlarge macrophyte belts and coverage. We adapt and apply a computer aided ecosystem service assessment and visualization tool (ESAT). Eight experts and two student groups apply this tool and carry out an assessment of each scenario compared to the present state of the lagoon. The results show that the scenario assuming measures to enlarge macrophyte belts is perceived as the one that generates the highest additional ecosystem service output. However, more importantly our approach can serve as tool to catch the views of experts, can extract disagreements between experts and misunderstandings in the setup of scenarios as well as services that have highest priority for further consideration. Further, the results are useful for preparing stakeholder discussions and workshops. However, the expert assessments are influenced by the spatial scale of the assessed scenarios. As consequence, the assessment results itself cannot be regarded as a reliable basis for decision making. Today, Integrated Coastal Zone Management ideas and approaches are well reflected and integrated into Marine Spatial Planning and we show that a comparative ecosystem service assessment can be applied in different steps of each concept.
Introduction
Ecosystem services (ES) are defined as the benefits human obtain from ecosystems (Millennium Ecosystem Assessment, 2005). Publications on ES have increased exponentially during the last 15 years. However, Liquete et al. (2013) summarize in their review that most studies focus on terrestrial ecosystems and that a knowledge gap on marine and coastal ecosystem services still exists. On the other hand, the (European Commission 2014) considers seas as major drivers for the European economy with great potential for innovation and growth. The European Blue Growth strategy shall support sustainable growth in the marine and maritime sectors as a whole. As consequence, we assume that the number and spatial extent of uses in coastal and marine waters will increase and Maritime Spatial Planning (MSP) will require a good knowledge of ES, especially in coastal waters.
In Europe, the Baltic Sea Region is leading with respect to strategies and actions for coastal and marine protection and sustainable development. The European Union Strategy for the Baltic Sea Region (EUSBSR) specifies three overall objectives: to save the sea, to connect the region, and to increase prosperity (European Comission, 2012). The associated action plan is “an integrated framework (….) to identify needs and match them to the available resources by coordinating of appropriate policies, thus enabling the Baltic Sea region to achieve a sustainable environment and optimal economic and social development” (European Commission, 2015a). It explicitly names MSP and Integrated Coastal Zone Management (ICZM) as “important tool and process for improved decision making. It helps various users to balance sectoral interests that compete for marine space, and contributes to achieving sustainable use of marine areas to the benefit of economic and social development as well as the marine environment” (European Commission, 2015b). Today the ecosystem-based approach to management plays a core role in MSP and ICZM (Forst, 2009), because it is supposed to set the boundaries for a management approach. It is defined as the “comprehensive integrated management of human activities based on the best available scientific knowledge about the ecosystem and its dynamics, in order to identify and take action on influences which are critical to the health of marine ecosystems, thereby achieving sustainable use of ecosystem goods and services and maintenance of ecosystem integrity” (HELCOM-VASAB, 2016). We can conclude that coastal and marine ecosystem goods and services play an important role in present policy documents.
The EU Maritime Spatial Planning Framework Directive (2014/89/EU) sets the legal framework for marine spatial planning in Europe. MSP identifies which areas of the ocean are appropriate for different uses or activities in order to reduce conflicts and achieve ecological, economic and social objectives (Douvere and Ehler, 2008). For the Baltic Sea Region, (HELCOM-VASAB 2016) defines concrete guidelines for the implementation of the ecosystem-based approach in a stepwise maritime spatial planning process. Already in the beginning, “the functions of the marine ecosystems and ecosystem goods and services in the planning area and surroundings” shall be identified and in a later step, a valuation of ES is suggested. Concrete ideas and approaches how this could look like already exist (e.g., Guerry et al., 2012; Böhnke-Henrichs et al., 2013; Lester et al., 2013).
Similar to the steps of a MSP process, as suggest by (HELCOM-VASAB 2016), various stepwise procedures for ICZM exist (e.g., Clark, 1994; UNEP, 2012). Olsen et al. (1997) defines ICZM as a cycle consisting of an issue identification, program preparation, formal adoption and funding, implementation and evaluation phase. The Systems Approach Framework (SAF) for an integrated assessment of coastal systems (Hopkins et al., 2012) further develops and refines the ICZM cycle. Core is the ecological-social-economic-assessment that guides a user from the identification of an issue or problem, toward the implementation of a sustainable solution and the following monitoring and evaluation. Similar to MSP, the assessment of ecosystem services may play an important role in the ecological-social-economic-assessment, and in ICZM in general (e.g., Granek et al., 2010; Luisetti et al., 2011).
Coastal waters provide a wide range of services, but are under intensive human use, face degradation and are highly dynamic systems, where many changes will take place in the near future. This is especially true for large Baltic lagoons, like the Oder (Szczecin) Lagoon. In the Oder Lagoon, heavy eutrophication causes a degradation of some ES and hampers the socio-economic development. It is not possible to fight eutrophication via measures in the river-basin alone (Schernewski et al., 2011). Therefore, a range of supporting technical measures to improve water quality in the lagoon are under discussion. Examples are mussel farming, mussel beds, artificial constructions or extended macrophyte belts (Schernewski et al., 2012).
The objectives of this article are to (a) define sets of five alternative environmental measures to improve the ecological status of the Oder Lagoon (scenarios); (b) assess changes in ecosystem service provision between the present state and hypothetical situations assuming the implementation of these scenarios based on experts; (c) analyse the potential role of ES assessments in stakeholder and expert involvement as well as; (d) discuss it in the context of the SAF, ICZM, and MSP.
For this purpose, we adapt and use an ecosystem services assessment tool and carry out comparative assessments involving experts. During the last decade, expert based ES assessments turned out to be a promising approach in environmental management (e.g., Beichler, 2015; Jacobs et al., 2015a,b; Campagne and Roche, 2017).
Study Site and Methods
The Oder Lagoon
With a surface area of 687 km2, the Oder (Szczecin) Lagoon is one of the largest lagoons in Europe, shared between Germany (Kleines Haff, 277 km2) and Poland (Wielki Zalew, 410 km2) and intensively used by humans since the middle Ages (Figure 1). The Oder/Odra River dominates the lagoon's water (average discharge of 530 m3/s) and nutrient budgets (loads of about 70,000 t N/a and 5,000 t P/a) and is responsible for the heavy eutrophication, very low water transparency, and frequent algae blooms in summer. Three outlets connect the lagoon to the Baltic Sea. The average salinity of around 1.5 psu indicates the minor influence of the Baltic Sea (6 psu). Because of its shallowness (average depth of 3.7 m, maximum natural depth 8.5 m), the lagoon's average water exchange time is only about 55 days (Radziejewska and Schernewski, 2008). Because of its low salinity, Zebra mussels (Dreissena polimorpha) are the dominant filter-feeding epifaunal bivalve in the Oder Lagoon. It forms mussel beds in all parts, with an estimated total biomass of about 68,000 t (Radziejewska et al., 2009). Most of the coastal area and the water surface of the Oder Lagoon are under nature protection. Along the coastline, tourism is the most important economic factor. Fishing (above 160 professional fishermen with a total catch of 3,000 t/a in the entire lagoon) and shipping are other important activities that occupy larger areas of the lagoon.
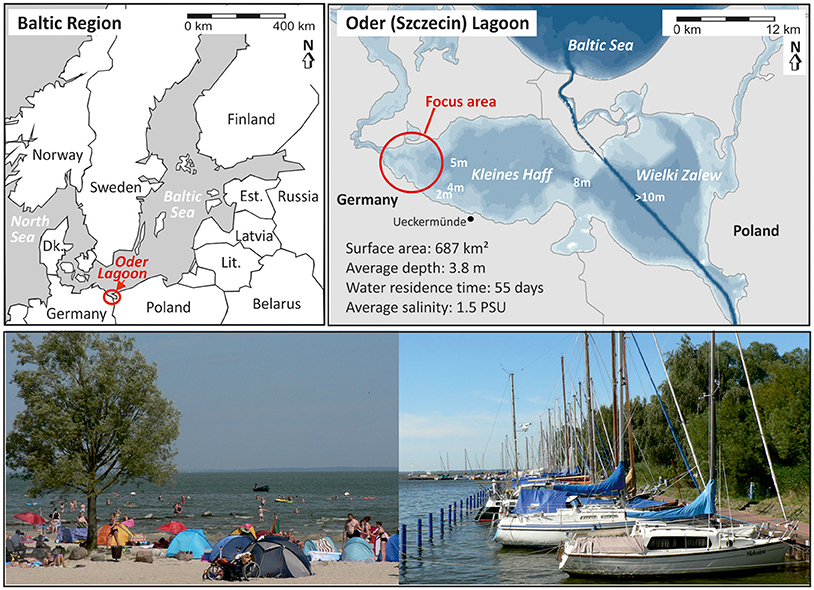
Figure 1. Location of the Oder (Szczecin) Lagoon and the focus area and pictures showing the south-western lagoon coast near the small resort Mönkebude.
Measures to reduce nutrient loads from the river basins into the lagoon are ongoing and show some success. Total nitrogen loads into the lagoon declined from about 80,000 t/a in the 1980s to <60,000 t/a between 2010 and 2014. In the same period, total phosphorus loads declined from 8,000 to <3,000 t/a (Friedland, pers. com.). According to the official German/Polish monitoring data, the total nitrogen (phosphorus) concentrations in the central Kleines Haff (western small lagoon) declined from about 220 μmol/l N (9 μmol/l P) in the 1980s to about 130 μmol/l N (5 μmol/l P) between 2010 and 2014. In the central Wielki Zalew (eastern large lagoon) the total nitrogen (phosphorus) concentrations declined from about 140 μmol/l N (7 μmol/l P) in the 1980's to about 130 μmol/l N (4 μmol/l P) between 2010 and 2014. Between the 1980's and today, in average, a 25% reduction of total nitrogen riverine loads to the lagoon caused a similar reduction of the total nitrogen concentration in the lagoon. With respect to riverine phosphorus loads, a more than 60% P load reduction between the 1980's and today caused a reduction of the total phosphorus concentration in the lagoon of nearly 45%. The chlorophyll-a concentrations in the Kleines Haff nearly remained on a level of 70 μg/l, but in the Wielki Zalew showed a decline from 70 μg/l in the 1980s to about 45 μg/l between 2010 and 2014. Averaging over the lagoon, we can assume a reduction of nearly 25%. During this period, water transparency showed a slight decline from 0.8 to 0.65 m in the Kleines Haff and an increase from 0.9 to 1.05 m in the Wielki Zalew. We can conclude that nutrient load reductions in the river basin had only a limited effect on algae concentrations and blooms and no effect on water transparency. The lagoon remained in a highly eutrophied status and a recovery of submerged macrophytes is still not observed.
The European Water Framework Directive (WFD, 2000/60/EC) classifies the ecological status of coastal waters based on biological quality elements, namely phytoplankton, macroalgae, and angiosperms as well as benthic invertebrate fauna. The assessment considers the biological deviation from reference conditions (high quality). The present status of the Oder Lagoon, which according to the German classification is regarded as a coastal water, still shows a major deviation from the reference state and its ecological status has to considered as poor. Therefore, an urgent pressure to implement suitable management measures in the river basin and the lagoon itself exists.
Scenarios and Stakeholder Involvement
On 21st October 2015 a first workshop with 31 local stakeholders from diverse fields of interest such as local and regional authorities, fisheries, tourism and NGOs was organized in Ueckermünde (Figure 1) at the south-western lagoon coast. The meeting focused on the poor state of water quality in the lagoon. Potential measures how to locally improve it were presented. A short survey about the perception of the present state of water quality showed that most participants saw a need to improve water quality. As consequence different measures were compiled, that have the potential to reduce eutrophication and improve the poor ecological status by increasing water transparency and supporting the spreading of macrophytes in the lagoon. These measures were compiled into concrete and realistic scenarios (Figure 2).
Scenario 0—Large scale mussel cultivation: Assumption of a hypothetical environmental sustainable, non-extensive floating mussel cultivation, which, according to Schernewski et al. (2012), fully utilizes the carrying capacity of the lagoon and removes the maximum amount of nutrients. It covers an area of 335 km2, 50% of the lagoon surface.
Scenario 1—Mussel farm: Establishment of a local mussel farm that removes nutrients via harvest, increases water transparency, provides food and feed in the most efficient way and can be maintained as a profitable business. Additional pre-conditions are high phytoplankton concentrations, but low risks of potential toxic algal blooms and damages due to drifting ice. The mussel farms shall cover a total of 1 km2 in water depths of 3–5 m, with a density of 1.1 kg mussels/m3 and produce an annual biomass of 2,250 t.
Scenario 2—Mussel beds: Introduction of hard substrate (stones) on the bottom of the lagoon to stabilize and increase the natural biomass of mussels and therefore increase water transparency. The area shall cover 10 km2 with a density 1 kg/m2 mussels in water depths below 2.5 m to avoid temporary hypoxic conditions. The altogether 10,000 tons of mussels would approximately increase the existing natural biomass by 3 times.
Scenario 3—Groynes (pile rows): Establishment of 50 groins to reduce coastal current velocities, reduce erosion, favor sediment accumulation, increase water transparency, and promote the natural enlargement of macrophyte beds. The groins rows are oriented rectangular to the coast, have a length of several 100 m from the coastline down to a maximum water depth of 1.5 m. The distance between the groin rows is about 100 m.
Scenario 4—Macrophyte belts: Supporting technical measures (e.g., mussel cultivation, textile mats, stones), to settle macrophytes up to a water depth of 2 m. A century ago, submerged and emerse macrophytes covered large areas of the lagoon, but were lost due to reduced water quality/transparency and destruction. Macrophytes favor the accumulation and fixation of sediments, reduce resuspension and may improve water transparency. Further, they are a biological quality element in the European Water Framework Directive. This means they are a core indicator for defining coastal water status and quality.
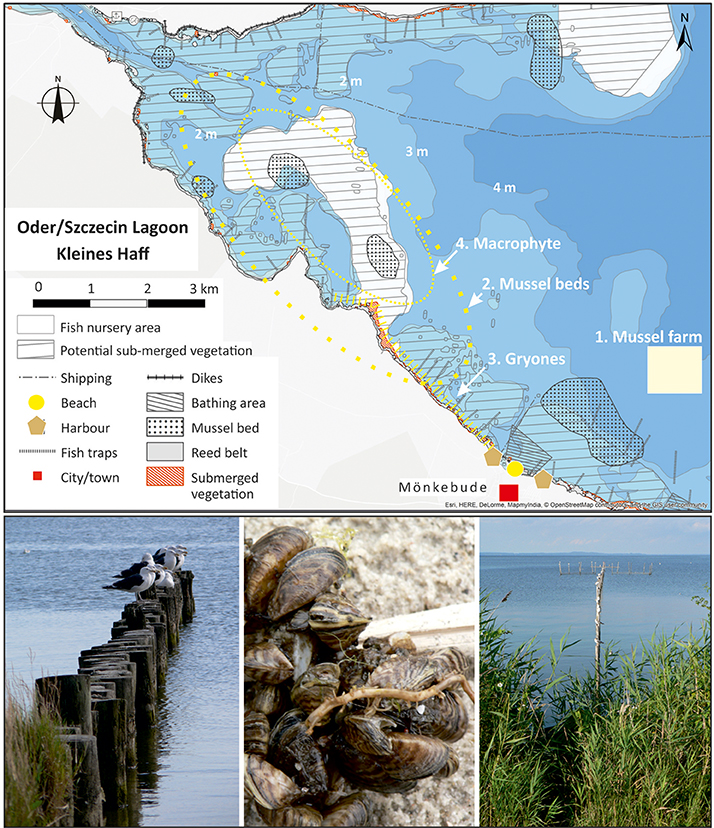
Figure 2. Map of the south-western lagoon (Kleines Haff) indicating the location of major human activities and the 4 scenarios. Pictures of the south-western lagoon: Goynes (pile rows), Zebra mussels (Dreissena polymorpha) attached to reed and the reed belt with a fish trap.
On 6th September 2017, a second workshop with 26 participants took place in Ueckermünde, where the scenarios and possible environmental and socio-economic consequences were presented and discussed in more detail. The ES following expert assessments were used for the preparation of this workshop.
Ecosystem Service (ES) Assessment
We adapted the Common International Classification on Ecosystem Services (CICES, version 4.3) (Haines-Young and Potschin, 2013), which divides ES into three sections, provisioning, regulating and maintenance as well as cultural services. Each section is further hierarchically sub-divided into divisions, groups, and classes (Maes et al., 2016). For the comparative assessments, we identified 31 ES classes as relevant in coastal waters, including 10 provisioning services with 14 indicators, 11 regulating & maintenance with 27 indicators, and 10 cultural services with 13 indicators (Figure 3). Our Ecosystem Services Assessment Tool (ESAT) contains these ES classes and associated indicators and represents the hierarchical CICES system. It is implemented in Microsoft EXCEL to enable automated calculations, score averaging, data aggregation, and visualizations. It further includes application guidelines and an assessment of data quality. The aggregation (averaging) of ES class scores into scores on group and division level was carried out, to be able to provide simplified graphical visualizations for the stakeholder meeting.
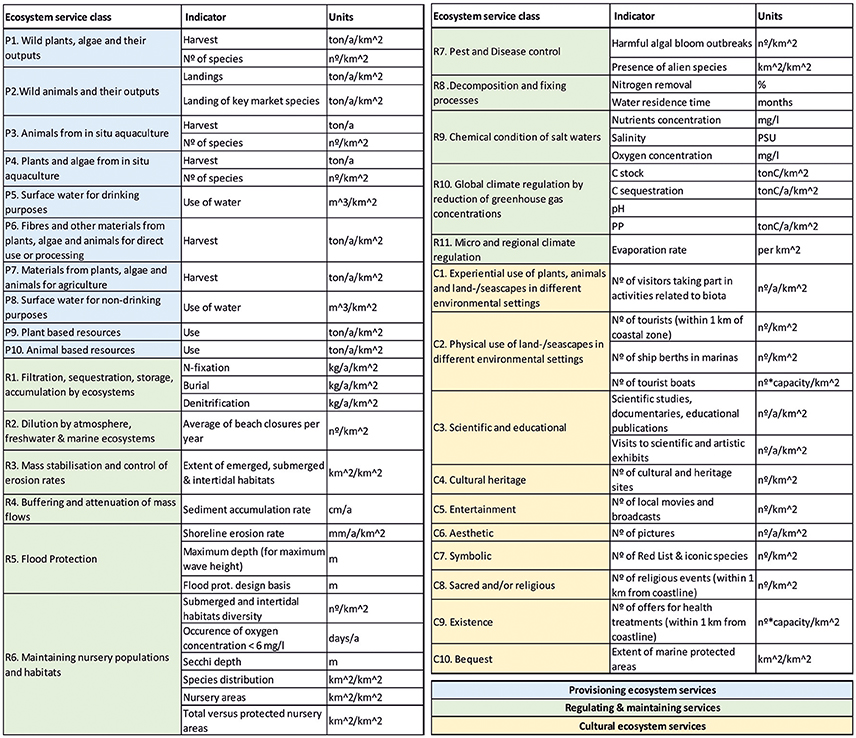
Figure 3. Sub-division of ecosystem services into sections and classes as well as the associated indicators including units. The table is modified and extended based on CICES (Haines-Young and Potschin, 2013) and MAES (Maes et al., 2016).
The application process required a clear spatial definition of the study area, as shown in Figure 2. The assessment takes place for each ES indicator (Figure 3) and the scores are averaged to get one score for each ES class. For the assessment, the experts compared the present state to those of the alternative hypothetical scenarios. They did it based on ES classes but were aware of the underlying indicators. In all applications, the experts and student groups could choose between 11 scoring classes, defined as very high (−5), high, medium, considerable, slight negative change, no change (0) and slight, considerable, medium, high and very high positive change of an ES (+5) (Figure 4). To give the experts a quantitative indication, what e.g., slightly higher provision (+1) meant, a scale was provided. In this case, up to 1.3 times the present value was the upper class boundary for +1. As consequence, we did not get absolute values for each ES class, but only a score indicating the relative difference, or the change in ES provision, between present state and the scenario.
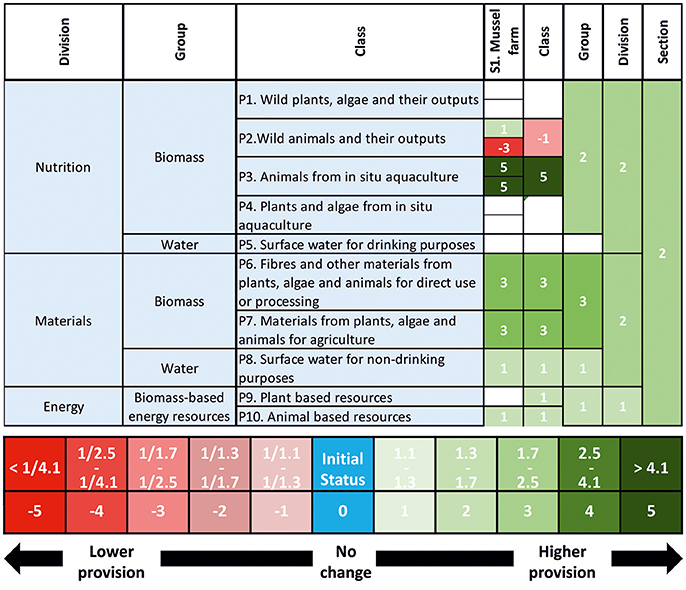
Figure 4. Excerpt of the Ecosystem Service Assessment Tool (ESAT) showing the assessment of few provisioning ecosystem services. The numbers indicate the scores on indicator level and the automatic averaging process to obtain ES classes, groups, divisions, and sections. Below the relative scoring system used in the expert assessments. Scored are the changes resulting from the implementation of measures (scenarios), compared to the present situation.
In a first application, we carried out a comparison of the present state of the lagoon with the hypothetical assumption of an implementation of scenario 0. The assessment covered the entire lagoon and the coastal strip and involved two young scientists with broad and good knowledge relevant for the scenario. The experts worked independently, full time, without exchange and had about 2 weeks to finish the assessment. They had access to all available data and information about the lagoon.
In a second application, we provided four concrete, realistic, alternative scenarios covering different measures. Eight experts (including the authors) with different scientific background (biologists, ecologists, environmental scientists, geographer) and from different NGOs, universities, and scientific institutes (most hold a Ph.D. degree) were asked to carry out an assessment for all five scenarios and all 54 indicators describing the ES classes. The experts received the guidelines and ESAT and carried out the assessment independently at home within a period of 4 weeks. The experts based their assessment mainly on their existing knowledge and perception of the area. Additionally, two master-student groups with 4–5 persons each carried out an assessment during a 2 days course. The size and allocation of the scenarios was visualized on maps and explanations were provided to ensure a joint understanding. After the assessments, discussions with the experts took place to get a better understanding of their view and insight into their scoring. The experts were not allowed to change or adjust their scoring afterwards.
Results and Discussion
Ecosystem Service Assessment on Oder Lagoon Level
Our first application was carried out by two young scientists and related to scenario 0, the large scale mussel cultivation covering 50% of the lagoon surface. It formed the basis for the following guiding questions: To what extent does the spatial scale of a measure affects the result of an ES assessment? Is this extreme and controversial (scenario 0) perceived similar by both experts and are possible differences clearly reflected in the assessment? Is it possible to use the assessment to extract major points of disagreement and aspects that need deeper consideration or clarification? Do ES assessments provide a deeper insight, whether scenarios (set of measures) affect the potential state of and process toward sustainability on a regional (lagoon) level?
The experts found 26 out of 31 ES as relevant for this scenario. Expert 2 considered surface water for non-drinking purposes (P8) and animal based resources (P10) relevant and assumed a higher provision after the implementation of mussel cultivation, while expert 1 did not consider it as relevant. Background for the view are positive effects of mussels on water quality and transparency that may allow a water utilization in future. The potential use of shells as fertilizer and mussels for bio-energy production explains the choice and score of P10. For provisioning and regulating services in general, the average disagreement between both experts was about 1 unit and can be regarded as good (Figure 5). Strong disagreements became obvious with respect to altogether 5 ES, namely the regulating services R1 (N-fixation, burial, denitrification) and R3 (mass stabilization) and 3 cultural ES. The processes underlying R1 and R3 are complex with many interactions and different opinions can easily occur, since the existing scientific literature supports different views. Mass stabilization and control of erosion rates (R3) are indicated by the extent of selected emerged, submerged and intertidal habitats. One expert assumed a positive effect of mussels on water transparency, which allows macrophytes to spatially spread and the other considered the destructive effect of mussel cultivation on macrophytes, especially in a depth between 2 and 3 m, as more important.
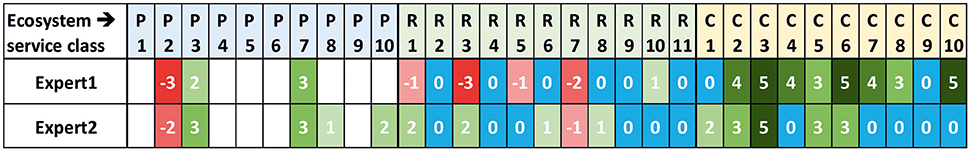
Figure 5. Comparison of the present state of the lagoon with the hypothetical assumption of an implementation of scenario 0, large scale mussel cultivation covering 50% of the lagoon surface. Provisioning (P), regulating and maintenance (R) as well as cultural ES (C). Positive scores indicate an increase in ES provision after the scenario implementation.
With respect to cultural ES, the disagreement (2 units in average) was much stronger. Expert 1 had a strongly positive opinion about the effects of a large mussel farm on cultural ES, while expert 2 assumed only minor positive changes. The experiential use of plants, animals and land-/seascapes in different environmental settings, indicated by the number of visitors taking part in activities related to biota, was perceived differently. While one experts considered mussel cultivation as a potential attraction, the other saw a negative impact on visitors. The cultural heritage (C4) indicated by the number of cultural and heritage sites was perceived differently, as well. One expert assumed mussels as a new local product with the potential to link new events to it, the other expert did not. With respect to aesthetics (C6), indicated by the number of pictures taken, both experts assumed an increase because higher water transparency increase attractiveness as well as farming and processing as attractions in itself that increase the number of pictures taken. However, the score strongly differs between both experts and it is questionable if an increase in the number of pictures related to farming and processing is still reflecting the aesthetics of the landscape as an ecosystem service. The effects of large scale mussel cultivation on symbolic (C7), namely the number of Red List and iconic species, were perceived differently. While one expert assumed that the zebra mussel may become an iconic species and that mussel farming might provide new habitats for red list species, the other expert had an opposite view. One expert assumed an increase in the number of religious events (C8), because the area might increase in tourist attractiveness, resulting in a higher number of weddings by visitors. Different opinions with respect to the extent of marine protected areas (C10) seemed to be a misunderstanding, because most of the lagoon is already under Natura 2000 protection.
The large agreement with respect to provisioning and regulating services makes it possible to use the assessment to extract major points of disagreement and aspects that need deeper consideration or clarification. With respect to cultural services, a clear joint vision between both experts was lacking. Comparable concrete experiences with mussel cultivation of this size and spatial extent do not exist and a supporting visualization was hardly possible. The scores depended on the virtual pictures the experts had in mind when carrying out the assessment. In general, the experts do not assume a relevant overall change in provisioning and regulating ES, but a clear overall increase in cultural ES. The large-scale utilization of the lagoon for mussel cultivation was perceived surprisingly positive and there is no indication that the scale of the mussel farm had a negative effect on the ES assessment. Major concern of both experts was that a large scale mussel cultivation has negative on key market fish species. This concern clearly indicates the need for further discussions and deeper considerations because a possible negative effect is scientifically highly uncertain.
ES Assessment of Alternative Local Measures
In the second application, the four concrete, realistic, alternative local scenarios were assessed by eight experts with different background and two master-student groups. Beside the questions raised before, we wanted to know, according to their personal opinion and experience, what would be the consequence of the implementation of each of the four local scenarios on the ES provision of the lagoon would be. Additional guiding questions for us were: do we get more stable and similar results if the measures are more concrete and realistic? Do comparable, alternative scenarios force evaluators to think more deeply about the scores and will the results become more reliable and stable? How does the number of involved experts affects the variability of scores? What is the optimal number of experts and how does their background affect the results?
Figure 6 gives a full overview of all assessments and all involved ES. With respect to provisioning and regulating ES, the experts (average score over ES divisions) perceive the small mussel-farm (scenario 1) compared to the large farm (scenario 0) much more positive and assume a significant increase in ES provision. With respect to cultural ES, the views are largely similar with respect to both scenarios. However, the experts between both assessments differ and this limits the interpretation. While the assessment for scenario 0 involved experts that were well familiar with the concept of ES and the definitions of each indicator, the eight experts and the two student groups only received the ESAT with a task and scenario description and a visualization map (similar to Figure 2). However, there seems to be a tendency that smaller scale measures are regarded to provide a stronger ES increase. Experts have the tendency to intuitively relate changes to the immediate surrounding of a measure and not to the pre-defined assessment area. Different to the large mussel cultivation, scenarios 1–4 will hardly have a measurable effect on the south-western lagoon ecosystem, but the ES assessment by experts suggests the opposite. Therefore, the spatial scale of a measure has effects on the ES assessment results.
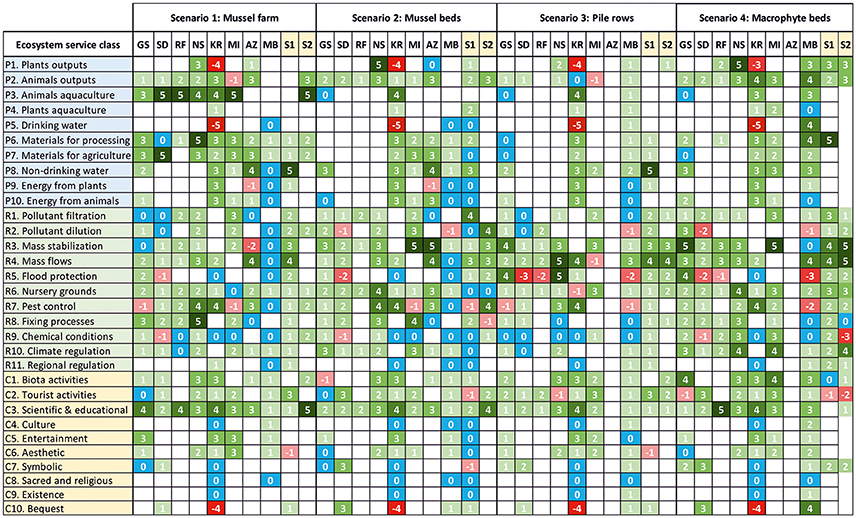
Figure 6. Comparison of the present state of the lagoon with the hypothetical assumption of an implementation of 4 concrete, realistic, alternative scenarios. The assessment was carried out by 8 experts (GS, SD, RF, NS, KR, MI, AZ, MB) and 2 master-student groups (S1, S2). Abbreviations indicate provisioning (P), regulating and maintenance (R) as well as cultural ES (C).
Comparing the scenarios 1–4, the experts in average assumed that the small mussel farm would cause the highest increase in provisioning ES, followed by macrophyte beds. Macrophyte beds were considered to increase the regulating ES most, followed by mussel beds (scenario 2) and with respect to cultural ES, the scenarios are perceived largely similar. The highest increase in the overall ES provision was assumed for macrophyte beds followed by the small mussel farm. However, the number of ES considered by the experts as relevant differed between the scenarios and one expert did not assess scenarios 3 and 4. Therefore, an alternative measure is the average increase for all considered ES. Here as well, the macrophyte beds followed by the mussel farm show the highest value of 1.9 compared to 1.65. However, all scenarios are considered to increase the overall ES provision and are therefore beneficial. These assumed high overall increases in ES provision clearly show that experts relate their assessment to the area covered by the measure and its immediate surrounding and not to the area provided as assessment background.
Figure 6 shows that a higher number of experts caused a higher difference with respect to the ES that were considered as relevant for assessing a scenario. Further, the higher number of experts caused a higher spectrum of different scores. The view of expert KR, representing an environmental organization, shows the least agreement with the other experts. The strong opinions on single ES have significant impact on the results. The scores of KR and MB, a conservation and biodiversity biologist, were the lowest. It seems that the background of experts forms their worldview and general attitude toward measures in lagoons. This affects the assessment results. However, hardly any evaluator is well in agreement with another one. This indicates that the assessment results are very subjective. The tool contains full service and indicator definitions, but it seems that a heterogeneous understanding of the indicators may have caused or at least influenced the differences between the evaluators. Against this background, we are hardly able to define an optimal number of experts for an assessment, but contrasting backgrounds and views are helpful to extract services where opposite view exist. Opinions differed most with respect to ES plants output (P1), drinking water (P5), flood protection (R5), and bequest (C10). The results show that this analysis is useful to extract most controversial ES and opens the possibility for a systematic addressing of differences. Options to deal with controversial views on single ES are to provide more or better background information, to settle possible misunderstandings in bilateral discussions or to facilitate a joint discussion between the experts. A discussion between the experts could have led to compromises, modified scores, and more consolidated assessments, but in our case did not take place. The student groups usually distributed the ES between them and carried out the assessment individually. Because of time restrictions, the joint discussion took place only after the submission of the compiled assessments. The outcome of the discussion did not result in a modification of the assessment. The discussion process has not been sufficiently reported, to allow an analysis whether it lead to a consolidated joint view.
While with respect to scenario 2 (mussel beds) only two ES showed a strong disagreement between experts (difference in scores of 6 and more). With respect to scenario 1 (mussel farm), this is the case for 10 ES. Scenario 1 obviously is much more controversial. Therefore, the assessment results can serve as basis for addressing controversial scenarios in more detail, similar to addressing controversial ES.
The high variability of scores, the obvious differences in the perception of scenarios and scale problems are some reasons why even the averaged assessment of all eight experts for each scenario does not reflect more than a tendency and can hardly be used for assessing whether one scenario is more sustainable than another one. Systematic differences between the scenarios are hidden by the variability of scores between experts within a scenario. Lesson learnt is that the ES assessment is more suitable for supporting and guiding a participation and discussion process, rather than delivering crisp results.
Utilization of Assessments for Stakeholder Discussions
During our second workshop with 26 stakeholder on 6th September 2017, several scenarios and possible environmental and socio-economic consequences were presented and discussed in more detail. The ES assessments helped to focus on most important aspects when presenting and discussing the scenarios. Between the expert assessments and the meeting, the spatial location and definition of scenarios were modified and a presentation of the expert assessment itself did not make sense. Therefore, the ES assessment tables and figures were not explicitly used in this workshop. However, based on the experience gained during the workshop discussions, we learnt that time restriction and participants being not familiar with ES concepts, require simplified presentations and visualizations of ES results. To meet this demand ESAT allows an aggregation (averaging) of ES class results to higher hierarchical levels like ES groups and divisions (Figure 4).
More important, in this context was the question, how ES assessments in general could be used in an ICZM and MSP planning context, especially in stakeholder participation. How to extract suitable and simplified information from complex assessments, as presented in Figures 5, 6. For this purpose, we further aggregated data to provide suitable information. Figure 7 shows median expert scores for each ES, their relevance in % and the importance of an ES. Relevance reflects the percent of experts that considered the service as potentially affected by this scenario. They did choose the relevant ES classes before the assessment. Therefore, it happened that they later, during the scoring process, came to the conclusion that the changes are negligible and score a zero. The importance is calculated by multiplying the median score with the relevance (and dividing the result by 10, to obtain lower numbers). We used the median to avoid that extreme scores, possibly resulting from misunderstandings, have a strong impact on scores. We assumed that importance values above 15 indicate services with high relevance and/or scores that are perceived by experts as most important for a certain scenario.
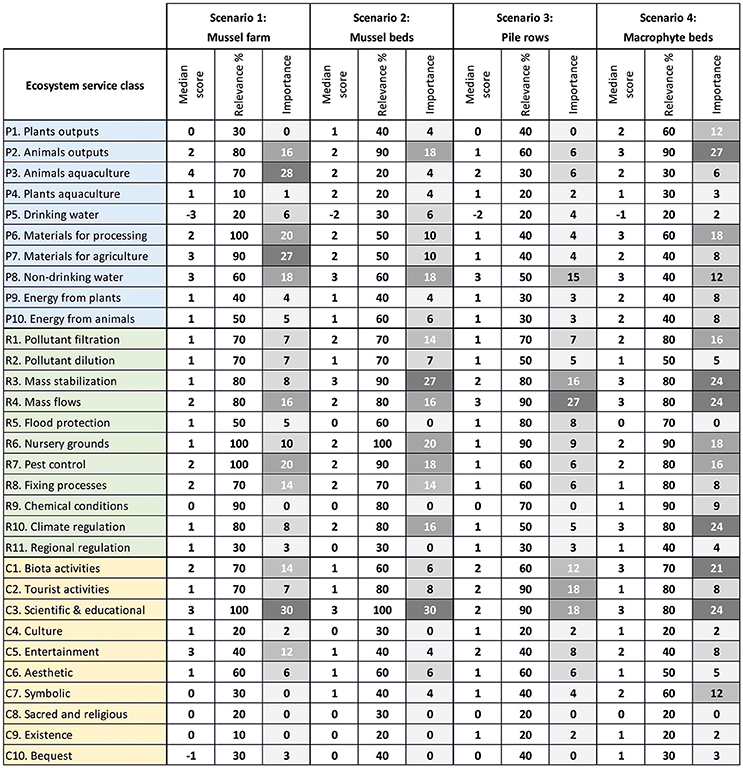
Figure 7. Median scores for each ecosystem service, their relevance (% of evaluators that considered the service as relevant for this scenario) and the resulting importance (score*importance/10).
In our case, most important ES to be addressed in scenario 1 (mussel farm) are animal outputs (P1), animal aquaculture (P3), material for processing (P6), materials for agriculture (P7), non-drinking water (P8), mass flow (R4), pest control (R7), and scientific and educational aspects (C3). The most important ES differ between the scenarios and the number of important ES can be regarded as indication of the complexity of a scenario. While scenario three (pile rows) has only three important ES, scenario 4 (macrophyte beds) has 10. This approach allows selecting a limited number of ES classes to be address during a workshop. During the preparation of a meeting, the results allow to compile background information specifically for the selected important ES. Further, it allows preparing explanations and information for ES classes, where obvious misunderstandings or misperceptions between the experts occurred and where similar problems could be expected during the stakeholder meeting, as well. During the stakeholder workshop, we think that an improved preparation and the focus on important ES would enable a more target-oriented, effective discussion in the restricted timeframe.
Usage of Expert Systems in Local Environmental Management
Most existing systems for ES assessment have the aim to quantify ES provision. Common to most is, that they require lots of resources, expertise, are time consuming and contain subjective elements. Simplified approaches like the one by Burkhard et al. (2012) map ES supply and demand based on land cover information, experts and local data. The “Toolkit for Ecosystem Service Site-based Assessment” (Peh et al., 2013) focusses on biodiversity conservation and compares alternative states under involvement of experts and stakeholders to enable faster and cheaper assessment. In this study, we are following the same track, but consider ES assessment more as a supporting method in stakeholder participation processes rather than a methodology that delivers crisp and reliable data on service provision. To involve experts in ES assessment is a common approach (e.g., Beichler, 2015; Jacobs et al., 2015a,b; Campagne and Roche, 2017). Jacobs et al. (2015a) point out major advantages: it is efficient, fast, accessible and adaptable. The authors point out the disadvantages, as well, namely that results are subjective and may reduce the credibility and legitimacy of ES assessments.
To avoid this problem, the application of ESAT by experts and student groups was merely meant to support planning and management processes by increasing awareness about potential measures, supporting the development of joint future development scenarios, visualizing positive and negative consequences of measures as well as possible interactions between ongoing activities. The view that ES assessment could serve “as a tool to improve cooperation between natural and social sciences, experts, stakeholders, and decision makers” and may support “effective implementation and action” is supported by studies of Jacobs et al. (2015a), as well. Comparable to our approach, Jacobs et al. (2015b) used it to inform policy on strategies for the sustainable use of ecosystem services in estuaries. Our impression is that the assessment process favored a deeper thinking about the scenarios and their impact and raised awareness about sustainability aspects. The same should be true when presenting and discussing results on stakeholder meetings.
In general, the ES assessment provided insights into the sustainability of measures compiled into the scenarios. One could assume that a higher overall provision of services can be considered as a more sustainable situation. However, in detail and for each ES this is questionable. Are higher landings of fish, which are favored by eutrophication, desired and sustainable? Is an increased N-fixation, which counteracts riverine nutrient load reductions and favors eutrophication, positive and sustainable? Further, we have to be aware of the limitation of an ES assessment. Examples are weaknesses in the indicators and their representation of ES classes or that services often are not independent of one another, exhibit complex interactions and generate tradeoffs in the delivery of different services (Lester et al., 2013). Therefore, a simple maximization of ES may not make sense and an increase of the overall provision of ES does not automatically increase the level of sustainability.
Campagne and Roche (2017) address problems like expert panel size, expert confidence, and scoring variability. They used three different methods for the analysis of expert scores, mean values, the bootstrap model, and Bayesian methods. However, the results do not differ strongly between the methods and our simple use of median values seems reasonable. Advantage of using median scores is that it is most transparent and easy to understand. From our results, we can hardly derive information about the optimal number of experts for assessments. The data in Campagne and Roche (2017) indicates that the standard deviation of score means declines with increasing numbers of experts, but that the difference in results between 6 and 20 experts is minor. Therefore, we can assume that our number of eight involved experts can be regarded as sufficient. In general, ESAT allows to an assessment of information quality. We could have given experts the possibility to express their confidence with respect to a score, but we did not use this option to keep the process fast and simple. Campagne and Roche (2017) recommend adding confidence score in participatory processes, but on the other hand conclude that considering confidence scores has only marginal effects on the results. What we did not do, was to start a discussion process between the experts after the assessment. Looking back this was a mistake and some experts later indicated that they would have liked it, with the aim to reconsider scores. We possibly would have received a more unified assessment and much lower standard deviations of scores. This would have been a benefit for the stakeholder workshop.
A major benefit of the assessment with multiple experts is to systematically catch their opinions and perceptions, analyze what is important, and where disagreements exist. It shows where deeper considerations and discussions or clarifications are required. This knowledge can support a guided stakeholder process. However, ESAT would need a simplification to be suitable as a tool during a stakeholder workshop. As it is, it requires scientific and good local knowledge and is too complex and time-consuming.
If local measures are assessed against the framework of the entire lagoon, its effect on ES provision should hardly be measurable. It means a local measure (scenario) should better be assessed against the affected local area. Further, more concrete local measures allow providing a more realistic picture as basis for the assessment. However, we observed that experts, when carrying out an ES assessment, implicitly consider only the potential area covered by a measure and its immediate surrounding and not the area that was provided in the background information as focus area. The ES assessment by expert does not reflect the spatial scale of a measure in relation to the spatial scale of the focus area. Therefore, small scale measures are with respect to their effect on ES changes overestimated.
Based on our data, we are not able to answer the question whether assessments are more stable and show lower standard deviations when scenarios are more concrete, realistic, and local. However, our impression is that our concrete local scenarios helped the experts to develop a clear and joint idea of how a system would look like after a scenario implementation. Further, we think that comparable, alternative scenarios make an assessment easier and more reliable, because it allows experts an easy reiteration of scores after going through all scenarios.
Usability in Coastal Management and Marine Planning
Figure 8 indicates where in the ICZM cycle and in the more refined SAF process, ES assessment may play an important and supporting role in our view. The ICZM planning and the SAF issue identification as well as the system assessment phase includes strong and intensive interaction and involvement of stakeholders. Tasks in the beginning are, for example, to develop potential management options and scenarios. Later the focus is on comparing and discussing alternative options and choosing the most suitable one. In these phases, an ES assessment like the one used in this study makes sense as tool to support and guide the participation process.
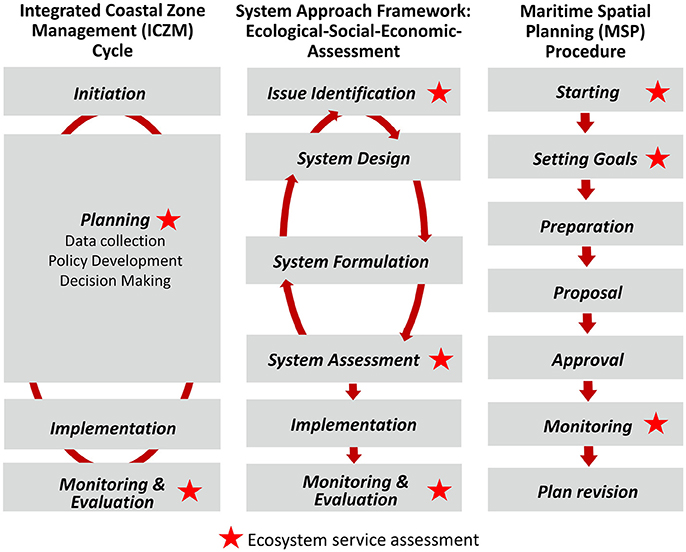
Figure 8. The potential role of ecosystem service assessment in Integrated Coastal Zone Management (ICZM) and Systems Approach Frameworks (SAF) as well as in Marine Spatial Planning (MSP) (according to HELCOM-VASAB, 2016).
In the early ICZM and SAF phases, an ES assessment can provide a basis for a better joint understanding of the ecological-social-economic interactions and dependencies. After the implementation of measures, a repeated ES assessment allows a comparison with the initial assessment and an evaluation, to what degree the measures were successful and reached the objectives. A strong increase in the overall ES provision afterwards could, with the discussed limitations, indicate how sustainable a measure is. In this respect too ESAT is a suitable tool, because it provides a classified semi-quantitative assessment, reflecting changes that took place between two points in time or between alternative scenarios. Advantages of an application are that a more objective, unified view can be obtained and that ecosystem services with different units can be directly compared. The allocation into classes in ESAT means that a concrete value often is not required, but just the knowledge into which class observed changes fall. This allows a relatively fast assessment, compared to other approaches. For the assessment, a broad spectrum of information can be utilized, ranging from concrete data to expert knowledge. Further, the system is spatially expandable and transferable.
Usually MSP focusses on an international, national, or regional spatial scale and provides a framework, while ICZM focusses on a more local to regional spatial scale and deals with more concrete management issues. However, in coastal waters, MSP and ICZM show a strong overlap in objectives and approaches. Scotlands National Marine Plan is a nice recent example for it. It sub-divides the Scottish coastal waters into 12 marine regions that cover major bays, like Clyde, Moray Firth or Forth, and Tay (Scottish Government, 2015). Each marine region is managed by a Planning Partnership and has to provide own Regional Marine Plan that can be regarded as a re-placement of previous ICZM planning attempts. Here, ES assessment can be applied similar to ICZM and SAF processes. Several other recent examples, e.g., from Belize, Germany, and Chile (Karrasch et al., 2014; Arkema et al., 2015; Outeiro et al., 2015), support the idea of including ES assessment in spatial planning and provide successful case studies.
In MSP in the Baltic, it becomes obvious that aspects of ICZM are included in MSP, as well. (HELCOM-VASAB 2016) provide a guideline for the implementation of MSP in the Baltic Sea area and states that “The identification of ecosystem services can provide a new approach to the management of the sea and should contribute to the planning of sea areas as well.” Figure 8 indicates in which steps (HELCOM-VASAB 2016) mention an ES assessment: one of the first steps is to “Identify the functions of the marine ecosystems and ecosystem goods and services in the planning area and surroundings and their links to ongoing and future maritime activities.” Later the task is to “Identify and define existing problems in the marine ecosystems, threats to the ecosystems and potential uses of ecosystems and their services” and to “Ensure the (…) valuation of ecosystem services” and later to “Consider the potential impacts of all proposals on ecosystem goods and services.”
(HELCOM-VASAB 2016) names MSP and ICZM as important tools and processes for improved decision-making and integrates basic ICZM ideas into the MSP guideline. As consequence, the role of ES assessment in MSP in the Baltic is similar to the role in ICZM and SAF, but the assessment takes place on a more abstract level and possibly larger scale.
Conclusion
Our comparative ES assessment by local experts shows that it can serve as a tool to catch the views of an expert on a certain measure or development scenario that it can extract disagreements between expert opinions and misunderstandings related to scenarios or measures, as well as define services of highest priority. The results can be used for guiding expert discussions and for harmonizing views. Further, they are valuable for preparing stakeholder discussions and workshops. However, it requires the involvement of experts with good local knowledge and it seems too complex, knowledge demanding and time-consuming to carry it out with a larger number of stakeholders during one event, like a workshop. It needs to be tested, if simplified ES assessments may make sense and could be used in this respect. Comparative assessments, measuring relative change between different scenarios or measures, are less sensitive to common ES problems e.g., that indicators insufficiently reflect certain services or the high degree of uncertainty associated to ES assessment. However, it requires a thorough preparation, description, and visualization of the alternative scenarios and their spatial extent. We observed that experts, when carrying out an ES assessment for a local measure implicitly consider the immediate surrounding as reference area and not the provided spatial definition. As consequence, expert ES assessment seem scale dependent. Recent developments and examples show that formerly independent concepts, like ICZM and MSP, are largely merged. Today, ICZM ideas and approaches are well reflected and integrated in MSP. This is especially true for public participation and stakeholder involvement. As consequence, a comparative ES assessment can be used in different steps of each concept.
Ethics Statement
The study does not require an ethics approval according to German regulations or according to the European Commission guideline Ethics for researchers 2017. The experts involved in the ecosystem service assessment got the Ecosystem Service tool via email. In this email they were informed about its purpose and that the results shall become part of a publication. Later, the experts received the final paper via email and were explicitly asked, if they have any objections or comments on the results that reflect their expert assessment (Figure 6). After discussions with some experts via email none of the experts had objectives against a publication. The consent of research participants was obtained by virtue of survey completion.
Author Contributions
GS the project leader, developed the article concept, took care of the analyses and did the article writing. MI provided the assessment tool, graphical visualizations and coordinated the expert evaluation. YN carried out the ES assessment in the Oder Lagoon.
Funding
The work was financially supported by the projects SECOS (03F0666A), funded by the German Federal Ministry for Education and Research, BONUS BaltCoast (03F0717A) and BONUS Optimus (03A0020A). BONUS BaltCoast and BONUS Optimus have received funding from BONUS (Art 185), funded jointly from the European Union's Seventh Programme for research, technological development and demonstration, and from Baltic Sea national funding institutions.
Conflict of Interest Statement
The authors declare that the research was conducted in the absence of any commercial or financial relationships that could be construed as a potential conflict of interest.
Acknowledgments
We like to thank Martynas Bučas, Sven Dahlke, Rene Friedland, Kasimierz Rabski, Nardine Stybel, Anastasija Zaiko for supporting the evaluation and for providing data and information, Simon Paysen for contributing to the graphical visualization and Johanna Schumacher for corrections and comments on the manuscript.
References
Arkema, K. K., Verutes, G. M., Wood, S. A., Clarke-Samuels, C., Rosado, S., Canto, M., et al. (2015). Embedding ecosystem services in coastal planning leads to better outcomes for people and nature. Proc. Natl. Acad. Sci. U.S.A. 112, 7390–7395. doi: 10.1073/pnas.1406483112
Beichler, S. A. (2015). Exploring the link between supply and demand of cultural ecosystem services – towards an integrated vulnerability assessment. Int. J. Biodivers. Sci. Ecosyst. Serv. Manage. 11, 250–263. doi: 10.1080/21513732.2015.1059891
Böhnke-Henrichs, A., Baulcomb, C., Koss, R., Hussain, S. S., and de Groot, R. S. (2013). Typology and indicators of ecosystem services for marine spatial planning and management. J. Environ. Manage. 130, 35–145. doi: 10.1016/j.jenvman.2013.08.027
Burkhard, B., Kroll, F., Nedkov, S., and Müller, F. (2012). Mapping ecosystem service supply, demand and budgets. Ecol. Indic. 21, 17–29. doi: 10.1016/j.ecolind.2011.06.019
Campagne, C. S., and Roche, P. K. (2017). Expert-based ecosystem services capacity matrices: dealing with scoring variability. Ecol. Indic. 79, 63–72. doi: 10.1016/j.ecolind.2017.03.043
Clark, J. R. (1994). Integrated Management of Coastal Zones. FAO Fisheries Technical Paper 327. Available online at: http://www.fao.org/docrep/003/t0708e/T0708E00.htm#TOC
Douvere, F., and Ehler, C. (2008). The role of marine spatial planning in implementing ecosystem-based, sea use management. Spec. Issue Mar. Policy 32, 759–843. doi: 10.1016/j.marpol.2008.03.019
European Comission (2012). Communication from the Commission to the European Parliament, The Council, The European Economic and Social Committee and the Committee of the Regions Concerning the European Union Strategy for the Baltic Sea Region. Available online at: http://ec.europa.eu/regional_policy/sources/docoffic/official/communic/baltic/com_baltic_2012_en.pdf
European Commission (2014). Innovation in the Blue Economy: Realising the Potential of Our Seas and Oceans for Jobs and Growth. Available online at: http://eur-lex.europa.eu/legal-content/EN/TXT/PDF/?uri=COM:2014:254:REV1&from=EN
European Commission (2015a). European Union Strategy for the Baltic Sea Region, Action Plan. SWD(2015) 177 final. Available online at: http://www.balticsea-region-strategy.eu/action-plan
European Commission (2015b). DIRECTIVE 2014/89/EU OF THE EUROPEAN PARLIAMENT AND OF THE COUNCIL of 23 July 2014 Establishing a Framework for Maritime Spatial Planning.
Forst, M. F. (2009). The convergence of Integrated Coastal Zone Management and the ecosystems approach. Ocean Coast. Manage. 52, 294–306. doi: 10.1016/j.ocecoaman.2009.03.007
Granek, E. F., Polansky, S., Kappel, C. V., Reed, D. J., Stoms, D. M., Koch, E. W., et al. (2010). Ecosystem services as a common language for coastal ecosystem-based management. Conserv. Biol. 24, 207–216. doi: 10.1111/j.1523-1739.2009.01355.x
Guerry, A. D., Ruckelshaus, M. H., Arkema, K. K., Bernhardt, J. R., Guannel, G., Kim, C.-K., et al. (2012). Modeling benefits from nature: using ecosystem services to inform coastal and marine spatial planning. Int. J. Biodivers. Sci. Ecosyst. Serv. Manage. 8, 107–121. doi: 10.1080/21513732.2011.647835
Haines-Young, R., and Potschin, M. (2013). Common International Classification of Ecosystem Services (CICES): Consultation on version 4. EEA Framework Contract No EEA/IEA/09/003.
HELCOM-VASAB (2016). Guideline for the Implementation of Ecosystem-Based Approach in Maritime Spatial Planning (MSP) in the Baltic Sea Area. Available online at: https://www.cbd.int/doc/meetings/mar/soiom-2016-01/other/soiom-2016-01-helcom-04-en.pdf
Hopkins, T., Bailly, D., Elmgren, R., Glegg, G., Sandberg, A., and Støttrup, J. (2012). A systems approach framework for the transition to sustainable development: potential value based on coastal experiments. Ecol. Soc. 17:39. doi: 10.5751/ES-05266-170339
Jacobs, S., Burkhard, B., Van Daele, T., Staes, J., and Schneiders, A. (2015a). ‘The Matrix Reloaded': a review of expert knowledge use for mapping ecosystem services. Ecol. Modell. 295, 21–30. doi: 10.1016/j.ecolmodel.2014.08.024
Jacobs, S., Wolfstein, K., Vandenbruwaene, W., Vrebos, D., Beauchard, O., Maris, T., et al. (2015b). Detecting ecosystem service trade-offs and synergies: a practice-oriented application in four industrialized estuaries. Ecosyst. Serv. 16, 378–389. doi: 10.1016/j.ecoser.2014.10.006
Karrasch, L., Klenke, T., and Woltjer, J. (2014). Linking the ecosystem services approach to social preferences and needs in integrated coastal land use management – A planning approach. Land Use Policy 38, 522–532. doi: 10.1016/j.landusepol.2013.12.010
Lester, S. E., Costello, C., Halpern, B. S., Gaines, S. D., White, C., and Barth, J. A. (2013). Evaluating tradeoffs among ecosystem services to inform marine spatial planning. Mar. Policy 38, 80–89. doi: 10.1016/j.marpol.2012.05.022
Liquete, C., Piroddi, C., Drakou, E. G., Gurney, L., Katsanevakis, S., Charef, A., et al. (2013). Current status and future prospects for the assessment of marine and coastal ecosystem services: a systematic review. PLoS ONE 8:e67737. doi: 10.1371/journal.pone.0067737
Luisetti, T., Turner, R. K., Bateman, I. J., Adams, C., and Fonseca, L. (2011). Coastal and marine ecosystem services valuation for policy and management: managed realignment case studies in England. Ocean Coast. Manage. 54, 212–224. doi: 10.1016/j.ocecoaman.2010.11.003
Maes, J., Liquete, C., Teller, A., Erhard, M., Paracchini, M. L., Barredo, J. I., et al. (2016). An indicator framework for assessing ecosystem services in support of the EU Biodiversity Strategy to 2020. Ecosyst. Serv. 17, 14–23. doi: 10.1016/j.ecoser.2015.10.023
Millennium Ecosystem Assessment (2005). Ecosystems and Human Well-being: Synthesis. Washington, DC: Island Press. Available online at: http://www.millenniumassessment.org/en/index.html
Olsen, S., Tobey, J., and Kerr, M. (1997). A common framework for learning from ICM experience. Ocean Coast. Manage. 37, 155–174. doi: 10.1016/S0964-5691(97)90105-8
Outeiro, L., Häussermann, L., Viddi, F., Hucke-Gaete, F., Försterra, G., Oyarzo, H., et al. (2015). Using ecosystem services mapping for marine spatial planning in southern Chile under scenario assessment. Ecosyst. Serv. 16, 341–353. doi: 10.1016/j.ecoser.2015.03.004
Peh, K. S.-H., Balmford, A., Bradbury, R. B., Brown, C., Butchart, S. H. M., Hughes, F. M. R., et al. (2013). TESSA: a toolkit for rapid assessment of ecosystem services at sites of biodiversity conservation importance. Ecosyst. Serv. 5, 51–57. doi: 10.1016/j.ecoser.2013.06.003
Radziejewska, T., and Schernewski, G. (2008). “The Szczecin (Oder-) Lagoon,” in Ecology of Baltic Coastal Waters, ed U. Schiewer (Berlin: Springer), 115–129.
Radziejewska, T., Fenske, C., Wawrzyniak-Wydrowska, B., Riel, P., Wozniczka, A., and Gruszka, P. (2009). The zebra mussel (Dreissena polymorpha) and the benthic community in a coastal Baltic lagoon: another example of enhancement? Mar. Ecol. 30, 138–150. doi: 10.1111/j.1439-0485.2009.00313.x
Schernewski, G., Neumann, T., Opitz, D., and Venohr, M. (2011). Long-term eutrophication history and ecosystem changes in a large Baltic river basin – estuarine system. Transit. Waters Bull. 5, 21–49. doi: 10.1285/i1825229Xv5n1p95
Schernewski, G., Stybel, N., and Neumann, T. (2012). Zebra mussel farming in the szczecin (oder) lagoon: water-quality objectives and cost-effectiveness. Ecol. Soc. 17:4. doi: 10.5751/ES-04644-170204
Scottish Government (2015). Scotland's National Marine Plan. Edinburgh: The Scottish Government. Available online at: http://www.gov.scot/Resource/0047/00475466.pdf
UNEP (2012). The ICZM Process - A Roadmap Towards Coastal Sustainability. Available online at: http://www.pap-thecoastcentre.org/pdfs/ICZM%20Process.pdf
Keywords: Szczecin Lagoon, systems approach framework, integrated coastal zone management, public participation, stakeholder, marine spatial planning directive, mussel farming, macrophyte
Citation: Schernewski G, Inácio M and Nazemtseva Y (2018) Expert Based Ecosystem Service Assessment in Coastal and Marine Planning and Management: A Baltic Lagoon Case Study. Front. Environ. Sci. 6:19. doi: 10.3389/fenvs.2018.00019
Received: 23 January 2018; Accepted: 03 April 2018;
Published: 24 April 2018.
Edited by:
Felix Müller, Christian-Albrechts-Universität zu Kiel, GermanyReviewed by:
Simone A. Beichler, Leibniz-Institut für Gewässerökologie und Binnenfischerei, GermanyParaskevi Drakopoulou, Hellenic Centre for Marine Research, Greece
Copyright © 2018 Schernewski, Inácio and Nazemtseva. This is an open-access article distributed under the terms of the Creative Commons Attribution License (CC BY). The use, distribution or reproduction in other forums is permitted, provided the original author(s) and the copyright owner are credited and that the original publication in this journal is cited, in accordance with accepted academic practice. No use, distribution or reproduction is permitted which does not comply with these terms.
*Correspondence: Gerald Schernewski, gerald.schernewski@io-warnemuende.de