Disentangling the trajectories of alpha, beta and gamma plant diversity of North American boreal ecoregions since 15,500 years
 Olivier Blarquez
 Christopher Carcaillet
 Thibaut Frejaville
 Yves Bergeron
- 1Centre for Forest Research, Université du Québec à Montréal, Montréal, QC, Canada
- 2NSERC-UQAT-UQAM, Industrial Chair in Sustainable Forestry Management, Forest Research Institute, Université du Québec en Abitibi-Témiscamingue, Rouyn-Noranda, QC, Canada
- 3Paleoenvironnements and Chronoecology (PALECO EPHE, UMR5059), Institut de Botanique, École Pratique des Hautes Études, Montpellier, France
Assessment of biodiversity in a changing world is a key issue and studies on the processes and factors influencing its history at relevant time scales are needed. In this study, we analyzed temporal trends of plant diversity using fossil pollen records from the North American boreal forest-taiga biome (NABT). We selected 205 pollen records spanning the last 15,500 years. Diversity was decomposed into α and γ richness, and β diversity, using Shannon entropy indices. We investigated temporal and spatial patterns of β diversity by decomposing it into independent turnover (variation in taxonomic composition due to species replacements) and nestedness (variation due to species loss) components. The palynological diversity of the NABT biome experienced major rearrangements during the Lateglacial and early Holocene in response to major climatic shifts. The β nestedness likely reflected plant immigration processes and generally peaked before the β turnover value, which mirrors spatial and temporal community sorting related to environmental conditions and specific habitat constraints. Palynological diversity was generally maximal during the Lateglacial and the early Holocene and decreased progressively during the Holocene. These results are discussed according to macro-ecological processes, such as immigration, disturbances, and environmental fluctuations, with climate most notably as the main ecological driver at millennial scales.
Introduction
The biodiversity of communities is generally studied over limited temporal and spatial scales (Grime, 1998; Duffy, 2008). Long-term and global-scale studies should serve as the foundations for our understanding of ecosystem functioning by allowing the development of ecological rules that are based on long-term historical investigations (Balvanera et al., 2006; Cardinale et al., 2006). Paleodiversity investigations at a millennium scale, which may cover the current interglacial period, i.e., the Holocene, should inform on macroecological processes that act over periods longer than what observations and monitoring are capable of providing. Widespread fossil records such as pollen could be analyzed from the perspective of biodiversity assessment (Mitchell, 2010). Additionally, pollen records are increasingly available in the form of continental databases containing fossil pollen data at large spatial and temporal scales (Grimm et al., 2007; Fyfe et al., 2009). However, studies that are dedicated to the reconstruction of past vegetation diversity based on fossil pollen covering an area greater than that represented by a single site are rare despite increased awareness of the benefits of diversity assessment at the global scale (e.g., Kier et al., 2005).
This paper aims to analyze palynological diversity patterns in boreal North America using pollen data that has been archived in the freely available database Neotoma (www.neotomadb.org). We tested the effect of ecological maturation of forest biomes on diversity structure facing climate changes. Because the early Holocene was marked by major climatic rearrangements, together with associated increased species immigration, dispersal, and reorganization processes, we would expect a higher palynological diversity at the origin immediately after deglaciation. When ecosystems become older, biogeochemical cycles tend to be complex and species interactions are more consolidated, thereby resulting in lower palynological diversity, especially in terms of turnover.
We selected pollen series from sites covering the present-day North American boreal and taiga (NABT) biome. Fossil pollen diversity is analyzed in terms of alpha (α) diversity, spatial, and temporal beta (β) diversity and, total gamma (γ) diversity. We used diversity partitioning, which enabled us to calculate independent α and β components using Shannon entropy measurements (Jost, 2007). Temporal and spatial β diversity was further investigated and decomposed into two components: nestedness and turnover (Baselga, 2010). Nestedness represents non-random taxa loss, i.e., when within a given region, sites with fewer species are the subset of more diversified sites. In contrast, the turnover component implies the replacement of taxa by others as a consequence of spatial or temporal sorting. We present the temporal patterns of NABT biome diversity over the last 15,500 years and discuss their trajectories with respect to the known biogeographic and climatic history of the continent.
Materials and Methods
Fossil Pollen Sites and Chronologies
The pollen sites were selected taking into account their geographic location within ecoregions of the modern NABT biome, which is here based upon the definition utilized by the World Wildlife Fund for North America as geographic subunits for diversity indices calculation (Olson et al., 2001). The NABT ecoregions of the WWF represent homogeneous environmental conditions, species communities, and ecological processes (Olson et al., 2001). These ecoregions provide a comprehensive geographic framework for targeting conservation strategies and biodiversity assessment (Kier et al., 2005). For this analysis, 12 distinct ecoregions were selected from the NABT biome (Figure 1, Girardin et al., 2009). Although NABT ecoregions were delineated using present-day data (Olson et al., 2001), we have suggested that they can provide a geographic framework for past palynological diversity, until a framework for long-term ecological conditions, with a regional coverage, is available.
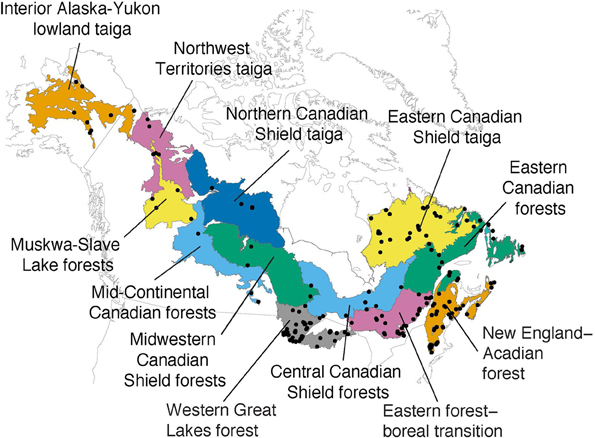
Figure 1. Location map of the selected fossil pollen sites (black dots) and the ecoregion units (colored areas) from the boreal forest taiga biome (adapted from Girardin et al., 2009).
Fossil pollen series held in the Neotoma database refer to sites where sediments have been extracted for pollen analyses. These pollen series were extracted from different sedimentary archives (peat, mire, lakes) and were subjected to different field or laboratory protocols, which potentially result in methodological bias. To reduce potential bias, several criteria were used to select the sites that we used for the palynological diversity reconstructions. Pollen series presenting only isolated specimens and surface samples were systematically excluded. Because chronological control is one of the keystones of paleoecological reconstructions, we selected only well-dated cores including at least one geochronological control point (i.e., 14C or 210Pb dating, tephra layer, etc.) for every 2500 year interval at least; a minimum of five dating points were required through the Holocene, starting 11,650 calendar years before the present, “present” being AD 1950 by convention (Walker et al., 2009). When chronologies were expressed in radiocarbon years before present (14C BP), we used a version of the Intcal04 calibration curve (Reimer et al., 2004), which was smoothed using a 250-year fast Fourier transform filter, to convert uncalibrated chronologies to calendar years before present (hereafter, cal BP). This procedure limits deviations from conventional age-depth modeling methods (Grimm, 2008). We investigated the pollen series that spanned the last 15,500 years due to the low number of pollen series showing data before this date. Most sedimentary series do not entirely recover the last 15,500 years, but generally start to accumulate pollen and sediments after deglaciation, which was not synchronous across North America (Dyke, 2004). Finally, we only analyzed pollen data for terrestrial vegetation including trees, shrubs, upland herbs, and vascular cryptogams. For simplification, the term “pollen” is extended to include spores of vascular cryptogams. The taxonomic resolution that was taken into account varied for different taxa; species level information was used when available. Numerous pollen taxa were included at the genus or family level, but this depended on specific determinations. However, taxonomy was homogeneous among all pollen series. Before calculating diversity and to ensure equal time resolution between sites, pollen counts were averaged over 1000-year consecutive time windows that were centred on millennia, For example, 1000 cal BP represented the time window 500–1500 cal BP (noted as 1 ka afterwards for simplification).
Diversity Partitioning
We partitioned diversity into independent α, β, and γ components using the framework proposed by Jost (2007, 2010). We used the α Shannon entropy index (Hα, Shannon, 1948) and, for each ecoregion, calculated the averages of the Shannon entropies per site in each 1 ka (= 1000 years) time window. The α Shannon entropy was converted to its number equivalent (true α diversity: α) by taking its exponent (α = exp(Hα); Jost, 2007). Shannon entropy was selected because it was the only measurement that satisfied Lande's condition (α ≤ γ; Lande, 1996) when community weights are unequal. Hγ was calculated by pooling the Hα of all sites in each time window and was converted to its number equivalent by taking the exponent (γ). Within this framework, diversity indices that are converted to number equivalents must satisfy Whittaker's (1972) multiplicative rule, and β was calculated such that β = γ/α.
β Partitioning
The β diversity index can be decomposed into two different components: nestedness and turnover (Baselga, 2010). We partitioned β diversity into its nestedness and turnover components by using the framework proposed by Baselga (2010) and Baselga and Orme (2012), which includes a transformation of pollen counts to presence-absence of taxa prior to the calculations. Overall spatial and temporal β was calculated using the multisite Sørensen dissimilarity index (βSOR) because of its linear relationship with the Whittaker's β index (1972). We calculated the spatial and temporal turnover without the influence of richness gradients by using the Simpson dissimilarity index (βSIM). The β nestedness component (βNES) was then defined such that: βNES = βSOR−βSIM (for complete formulation of the dissimilarity measurements refer to Baselga, 2010). The temporal indices involved a comparison of sites between adjacent temporal windows; they were denoted as: βNESt, βSORt, and βSIMt.
Sites Based Rarefaction
The diversity index values were dependent upon sampling effort. Total site numbers within each ecoregion and the number of available sites in each time window for a given ecoregion were likely to influence the diversity indices that were obtained through the species-area relationship effect (Arrhenius, 1921). We used a Monte-Carlo site-based rarefaction procedure to calculate the diversity indices for three site-equivalents, i.e., the required minimal site numbers for a given ecoregion and time window for calculation of the indices. This procedure was inspired by Gotelli and Colwell (2001), and did not use the analytic formulation of sample-based rarefaction for the sake of simplicity (Chiarucci et al., 2008).
Diversity Temporal Trajectories
The NABT biome palynological diversity trajectories were calculated by averaging transformed ecoregion palynological diversity indices. Palynological diversity index standardization involved two steps: (i) rescaling initial index values using a min–max transformation, and (ii) rescaling the values to Z-scores. Kruskal–Wallis ANOVA, followed by Least Significant Difference (LSD) post-hoc comparisons, was used to determine significant differences among the transformed diversity index values within the 1-ka time windows. The LSD test p-values were corrected for the false discovery error rate according to Benjamini and Yekutieli's (2001) correction. Linear regressions and Spearman rank correlations (rs) were used to highlight the main trends in the transformed data for the last 15,500 years. All calculations were done within the Matlab and R programming environments and relied on the betapart and vegan packages (R Development Core Team, 2011).
Results
In total, 205 sites were included in the present study. These 205 sedimentary records corresponded to 5732 fossil pollen samples, with data relating to 4.4 million pollen grains that belonged to 642 different pollen taxa (the complete list of publications providing the source of the original data is included in Table S1).
Ecoregion Diversity History
Ecoregions with the highest α were the western Great Lakes forests, and the Eastern boreal-forest transition, New England-Acadian forests and Central Canadian Shield forests in the east (Figure 2A). A homogeneous decrease in α during the Holocene is apparent for the eastern ecoregions, while the α response is heterogeneous for the western ecoregions, where it was stable, increasing, or decreasing (Figure 2A). At the ecoregion level, we observed a slightly increasing pattern of spatial β diversity for the western ecoregions during the Lateglacial and the first part of the Holocene (Figure 2B; ca. 15,500–8,000 BP period), and a relatively stable pattern over the last 15,500 years for the eastern ecoregions, except for the Eastern Canadian Forests for which a long-term increase was apparent (Figure 2B). Contrary to spatial β response, the temporal pattern of the β (βSORt), displayed a general decreasing trend over the last 15,500 years. βSORt was maximal for most ecoregions at the onset of pollen recording when it happened before ~8 ka and decreased thereafter (Figure 2C). Exceptions were the western Great Lakes forests, which displayed a stable trend. For a detailed inspection of ecoregion-based decomposition of the spatial and temporal β (βSOR and βSORt) into their nestedness (βNES and βNESt) and turnover (βSIM and βSIMt) components, the reader is referred to Figure S1. The γ diversity closely related to α, with average and total ecoregion richness being mathematically related (Figure 2D).
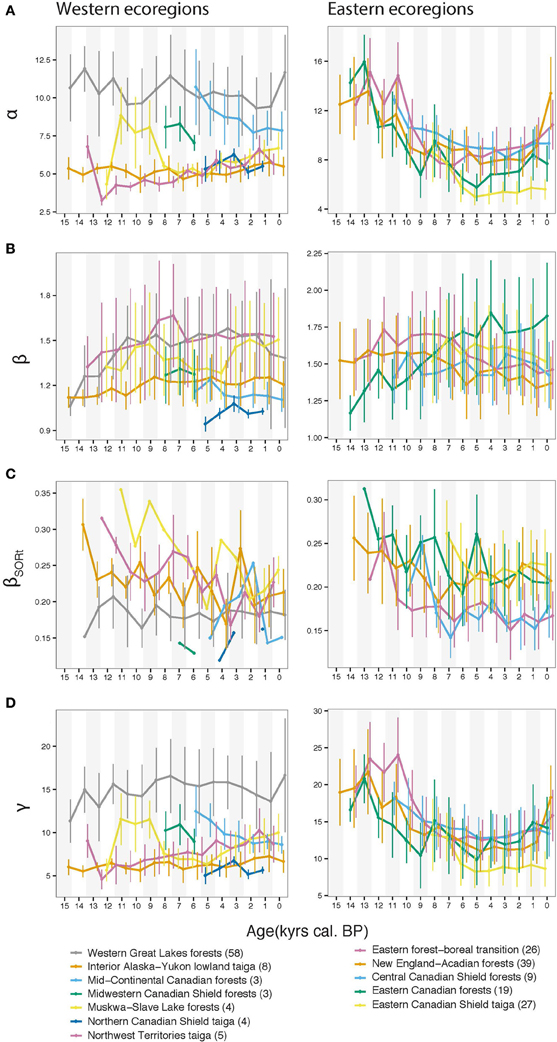
Figure 2. Diversity indices averaged for each ecoregion using 1-ka temporal windows; the site number is indicated in parentheses following ecoregion name labels. (A) α diversity from Shannon entropy number equivalent measurement, (B) β diversity, (C) the temporal (βSORt) diversity based on multisite Sørensen dissimilarity, (D) γ ecoregional total diversity; vertical bars represent the one standard deviation range for calculated indices.
NABT Biome Diversity Patterns
A significant decreasing pattern in α scores was apparent over the study period (p < 0.001, Figure 3A). Elevated α scores were recorded at 13 ka, which were significantly higher than those for subsequent periods (e.g., 7–2 ka period), with the minimum being recorded at 5 and 2 ka (Figure 3A). The β values were minimal at the beginning of the Holocene (14–13 ka) and increased up to the 7 ka period. The β values then remained stable to present day, and although a decrease is observed at 0 ka, this was not significant (Figure 3B). NABT biome γ diversity showed the same pattern as α scores, with minimum scores recorded at 5 ka; the post-hoc test failed to find any significant differences among study periods (Figure 3C).
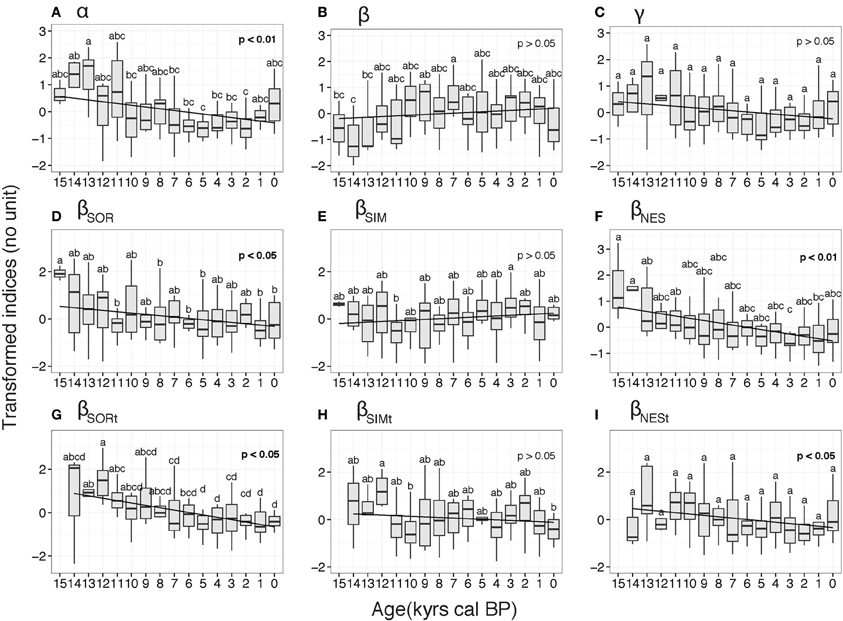
Figure 3. Box plots of diversity indices for the North American boreal forest taiga biome derived from transformed indices. The indices are: (A) α diversity, (B) β diversity (C) γ diversity, (D) βSOR spatial diversity, (E) βSIM spatial turnover component, (F) βNES spatial nestedness component, (G) βSORt temporal diversity, (H) βSIMt temporal turnover component, (I) βNESt temporal nestedness component. Letters indicates significant differences between 1-ka time periods at the 5% confidence level obtained from the Least Significant Difference post-hoc tests. Linear regressions (black line) and associated Spearman correlation p-values are also indicated.
The decomposition of βSOR into its turnover and nestedness components (βSIM and βNES, respectively), highlighted two different trajectories (Figure 3D). The turnover component, βSIM, was relatively stable, with few significant differences between periods. The only significant difference was recorded between 11 and 3 ka, experiencing a minimum and a maximum in βSIM scores, respectively, (Figure 3E). The overall pattern during the study period is not significant (p > 0.05, Figure 3E). In contrast, the βNES component displayed a significant decreasing pattern over the study period (p < 0.01, Figure 3F). Minimum scores were recorded at 3 ka and were significantly different from the higher scores recorded during the 15–13 ka periods (Figure 3F).
The β temporal trajectories slightly differed from their spatial counterparts (Figures 3G–I). Overall, temporal β diversity (βSORt) displayed a decreasing trend throughout the period, with negative scores since 8 ka (Figure 3G). The pattern in the turnover component, βSIMt, was not significant and few significant differences between time periods were recorded. For instance, the 12 ka period displayed significantly higher βSIMt scores compared to the 10 and 0 ka periods (Figure 3H). Although a significant decreasing pattern was observed for the temporal nestedness β component (βNESt), we did not observe any significant differences between time period scores (Figure 3I).
Discussion
The present reconstruction of palynological diversity for the North America boreal forest-taiga (NABT) biome demonstrated the opportunity of using fossil pollen series for plant diversity history assessment related to macroecological processes at large scales, and not only for processes at local scales, such as fire (Carcaillet et al., 2010) or land-use (Colombaroli et al., 2013). Historical macroecological investigations of plant diversity should provide insights into our knowledge of plant community biogeography, the links that relate vegetation to climate, or they may provide important data to test ecological theories. We decomposed palynological diversity into independent α and β components. We further investigated β diversity by studying its turnover and nestedness components and their contributions to the overall β diversity. These assessments were conduct considering both time (temporal indices) and geographic constraints (spatial indices).
Pollen Bias
We made use of methods that ensured our reconstructions are in agreement with diversity calculation requirements (Jost, 2007; Baselga, 2010), but a certain number of assumptions were made when estimating palynological diversity. Among these, we can address the following factors: (i) count sizes (Rull, 1987); (ii) the pollen sum on which the 100%-reference is computed (Birks and Birks, 1980); (iii) the differential productivity and dispersal of taxa and spatial representation (Bradshaw and Webb, 1985; Odgaard, 1999); (iv) the lack of taxonomic precision (Birks and Line, 1992); or (v) the fact that calculated indices only relate to the diversity of breeding plants. Consequently, palynological diversity estimates do not precisely represent past floristic richness and should be supplemented by diversity estimates that have been obtained from additional proxies such as plant macro-remains. These aid in deciphering the diversity history of local vegetation (Blarquez et al., 2013). Differential taxonomic precision between pollen series that originate from different pollen analysts may artificially inflate β diversity. However, this bias must be constant in time and, therefore, cannot explain alone the observed changes.
Palynological Diversity History
Between 15 and 8 ka, palynological diversity was highest both in terms of average local and total regional diversity (α and γ), and spatial and temporal diversity (βSOR and βSORt). This period corresponded to major climatic rearrangements that were occurring in the NABT biome. At the end of the last glacial period and at the beginning of the Holocene, the NABT biome experienced climatic modifications that were related to global changes in atmospheric circulation patterns, ice-sheet volume collapse (Dyke, 2004) and, changes in CO2 and modulated by dust concentrations in the atmosphere that were ultimately controlled by orbital forcing (Williams et al., 2001). These changes triggered increased species immigration, dispersal, and reorganization, processes that could be invoked to explain the higher palynological diversity observed during that period. This higher diversity at the origin of the Holocene immediately after deglaciation tended to decrease during the Holocene when biogeochemical cycles tended to be more complex (Wardle et al., 2004) and species interactions more consolidated (e.g., increased competition). These trends and, in particular, the decreasing pattern of overall βSORt highlight the advent of ecological maturation processes since 11 ka in the NABT biome.
Several strategies have been proposed to measure community turnover; for instance, Ter Braak (1986) proposed to use the first axis from detrended canonical correspondence analysis (DCCA) with the ordination constrained to time as the sole predictor (Birks, 2007). This method has been applied few times (e.g., Feurdean et al., 2012; Colombaroli et al., 2013; Leys et al., 2014). On the other hand, several studies have used the between-sample squared chord distance divided by time elapsed between the samples as a metric to assess temporal changes in pollen assemblages, in eastern North America (Grimm and Jacobson, 1992; Williams et al., 2001; Shuman et al., 2005) or Europe (Giesecke et al., 2011). This dissimilarity measurement is conceptually equivalent to the Sørensen dissimilarity that we used (Grimm and Jacobson, 1992) and provide very similar results. Interestingly, our β nestedness reconstructions mirror the reconstructions by Grimm and Jacobson (1992), Shuman et al. (2005), and Williams et al. (2001), based on squared chord distance. This seems to indicate that the temporal variability captured by the between-sample squared chord distance divided by time elapsed between the samples is primarily influenced by nestedness and does not necessarily capture the β turnover component. Failing to capture this component is particularly worrying since it significantly explains a greater proportion of overall β diversity compared to β nestedness (Figure S2). The nestedness component is related to the immigration and dispersion of species from richer communities to newly available habitats (e.g., Dennis et al., 2012). Both βNESt and βNES showed maximum values around 14–13 ka, confirming that ecosystems responded without significant lags relative to climatic changes at the end of the last glaciation (Richard, 1980; Williams et al., 2002; Carcaillet et al., 2012). These responses were probably due to glacial refugia that were situated near the ice-sheet limits (Brubaker et al., 2005; Bélanger et al., 2014). In contrast, turnover peaked later at 12 ka for both βSIMt and βSIM, indicating that 1000–2000 years were required for communities to became locally differentiated as a consequence of differential environmental conditions and specific habitat constraints, e.g., the built-up of organo-mineral soil or the chemical weathering of bedrock. These constraints may have been directly related, not only to changes in climate but also to ecosystem features such as soil genesis (Willis et al., 1997; Mourier et al., 2010) or changes in the disturbance regime. Interestingly, the increase in βSIM at 3–2 ka matched one change in fire regime that was recorded in the Central Canadian Shield forest toward significant increased fire sizes (Ali et al., 2012). Although the increase in fire sizes was ultimately controlled by climate (Flannigan et al., 2009), we have suspected that βSIM resulted, at least in part, from heterogeneity of the disturbance regime and type (i.e., mostly fire and insect outbreaks in the NABT). This scenario is consistent with empirical evidence demonstrating that increased landscape heterogeneity resulting from fire is associated with higher species turnover at the landscape scale (Romme, 1982; Suffling et al., 1988).
Grimm and Jacobson (1992) highlighted a period of pollen assemblage dissimilarity increase over the last 1000 years. They assumed that this change was the result of either human population expansion that occurred before European settlement or Little Ice Age climatic cooling and subsequent warming. Climatic change and human demography would have had continental-scale ecosystem impacts in the Americas within the last 500 years (Power et al., 2013). Although we observed a slight increase in β nestedness components during the period 0 ka, these changes were not significant. In contrast, we observed low scores in overall β during the last 500 years (0 ka, Figure 3B), which could indicate that the plant communities tend to be more temporally and spatially homogeneous as was also exhibited by the decrease in βSIMt and βSIM, respectively, a process that was potentially caused by human activities (introduction of invasive species, logging, agroforestry, urbanization; McKinney and Lockwood, 1999).
Conclusion
NABT biome palynological diversity was likely to be related to macroecological and climatic processes with a higher diversity during the early Holocene immediately after deglaciation in relation to the major climatic rearrangements, species immigrations, and their dispersal. During this period, the nestedness component of β increased, likely in response to the immigration of species from richer communities in the south to newly available habitats in the NABT. The turnover of β, which culminated later, indicates that more time was needed to enable those communities to differentiate locally. After this initial period and during the Holocene, the ecosystems matured, the biogeochemical cycles became more complex, and the interactions between species were more strongly consolidated. These factors contributed to the lower palynological diversity observed thereafter. Clark and McLachlan (2003) used pollens for testing neutral drift theory and found strong evidence of ecosystem stabilization, in contrast to neutral drift that predicted ecosystem divergence as a function of time (Hubbell, 2001). Questions remain regarding the appropriateness of pollen for testing ecological theories (Volkov et al., 2004), partly due to the fact that the relationship between pollen and diversity of plant communities is not linear and needs to be calibrated. Although research on pollen has successfully focused on reconstructing numerous vegetation parameters, past biomes and climate (e.g., Prentice et al., 1996), few attempts have been made to study palynological diversity at large spatial scales or test ecological theories (Clark and McLachlan, 2003; Birks, 2007). We believe that experimental studies based on simulation (model)-data comparisons in this direction will increase our understanding of the drivers of the vegetation dynamics on relevant time and spatial scales and will provide important data to test ecological theories.
Conflict of Interest Statement
The authors declare that the research was conducted in the absence of any commercial or financial relationships that could be construed as a potential conflict of interest.
Acknowledgments
We gratefully acknowledge the working group of the Neotoma Paleoecology Database (http://www.neotomadb.org), and Neotoma data contributors. Financial support was provided to OB by the Forest Complexity Modeling program (FCM, NSERC). The research was conducted within the framework of the International Associated Laboratory (LIA France-Canada CNRS-UM2-EPHE-UQAT-UQAM-UQAC) entitled MONTABOR (Forêts montagnardes et boréales: chrono-écologie et aménagement écosystémique durable). CC also benefited from a Centre national de la recherche scientifique (CNRS) mobility status at the Centre d'étude de la forêt (CEF, Montreal, Canada) and a visiting grant from CEF, where OB and YB are affiliated. We warmly thank Julie Aleman for early discussion and comments, and we are indebted to Professors Richard Field and the Frontiers referees for useful comments on an earlier version of this manuscript. We thank William Parsons for editing the manuscript.
Supplementary Material
The Supplementary Material for this article can be found online at: http://www.frontiersin.org/journal/10.3389/fevo.2014.00006/abstract
References
Ali, A. A., Blarquez, O., Girardin, M. P., Hély, C., Tinquaut, F., El Guellab, A., et al. (2012). Control of the multi-millennial wildfire size in boreal North America by spring climatic conditions. Proc. Natl. Acad. Sci. U.S.A. 109, 20966–20970. doi: 10.1073/pnas.1203467109
Balvanera, P., Pfisterer, A. B., Buchmann, N., He, J. S., Nakashizuka, T., Raffaelli, D., et al. (2006). Quantifying the evidence for biodiversity effects on ecosystem functioning and services. Ecol. Lett. 9, 1146–1156. doi: 10.1111/j.1461-0248.2006.00963.x
Baselga, A. (2010). Partitioning the turnover and nestedness components of beta diversity. Glob. Ecol. Biogeogr. 19, 134–143. doi: 10.1111/j.1466-8238.2009.00490.x
Baselga, A., and Orme, C. D. L. (2012). betapart: an R package for the study of beta diversity. Methods Ecol. Evol. 3, 808–812. doi: 10.1111/j.2041-210X.2012.00224.x
Bélanger, N., Carcaillet, C., Padbury, G., Harvey-Schafer, A., and Van Rees, K. (2014). Periglacial fires and trees in a continental setting of Central Canada, Upper Pleistocene. Geobiology 12, 109–118. doi: 10.1111/gbi.12076
Benjamini, Y., and Yekutieli, D. (2001). The control of the false discovery rate in multiple testing under dependency. Ann. Stat. 29, 1165–1188. doi: 10.1214/aos/1013699998
Birks, H. J. B. (2007). Estimating the amount of compositional change in late-quaternary pollen-stratigraphical data. Veg. Hist. Archaeobot. 16, 197–202. doi: 10.1007/s00334-006-0079-1
Birks, H. J. B., and Birks, H. H. (1980). Quaternary Palaeoecology. Baltimore, MD: University Park Press.
Birks, H. J. B., and Line, J. M. (1992). The use of rarefaction analysis for estimating palynological richness from quaternary pollen-analytical data. Holocene 2, 1–10. doi: 10.1177/095968369200200101
Blarquez, O., Finsinger, W., and Carcaillet, C. (2013). Assessing paleo-biodiversity using low proxy influx. PLoS ONE 8:e65852. doi: 10.1371/journal.pone.0065852
Bradshaw, R., and Webb III, T. (1985). Relationships between contemporary pollen and vegetation data from Wisconsin and Michigan, USA. Ecology 66, 721–737. doi: 10.2307/1940533
Brubaker, L. B., Anderson, P. M., Edwards, M. E., and Lozhkin, A. V. (2005). Beringia as a glacial refugium for boreal trees and shrubs: new perspectives from mapped pollen data. J. Biogeogr. 32, 833–848. doi: 10.1111/j.1365-2699.2004.01203.x
Carcaillet, C., Hörnberg, G., and Zackrisson, O. (2012). Woody vegetation, fuel and fire track the melting of the Scandinavian ice-sheet before 9500 cal yr BP. Quat. Res. 78, 540–548. doi: 10.1016/j.yqres.2012.08.001
Carcaillet, C., Richard, P. J. H., Bergeron, Y., Fréchette, B., and Ali, A. A. (2010). Resilience of the boreal forest in response to holocene fire-frequency changes assessed by pollen diversity and population dynamics. Int. J. Wildland Fire 19, 1026–1039. doi: 10.1071/WF09097
Cardinale, B. J., Srivastava, D. S., Duffy, J. E., Wright, J. P., Downing, A. L., Sankaran, M., et al. (2006). Effects of biodiversity on the functioning of trophic groups and ecosystems. Nature 443, 989–992. doi: 10.1038/nature05202
Chiarucci, A., Bacaro, G., Rocchini, D., and Fattorini, L. (2008). Discovering and rediscovering the sample-based rarefaction formula in the ecological literature. Community Ecol. 9, 121–123. doi: 10.1556/ComEc.9.2008.1.14
Clark, J. S., and McLachlan, J. S. (2003). Stability of forest biodiversity. Nature 423, 635–638. doi: 10.1038/nature01632
Colombaroli, D., Beckmann, M., Knaap, W. O., Curdy, P., and Tinner, W. (2013). Changes in biodiversity and vegetation composition in the central Swiss Alps during the transition from pristine forest to first farming. Divers. Distrib. 19, 157–170. doi: 10.1111/j.1472-4642.2012.00930.x
Dennis, R. L. H., Hardy, P. B., and Dapporto, L. (2012). Nestedness in island faunas: novel insights into island biogeography through butterfly community profiles of colonization ability and migration capacity. J. Biogeogr. 39, 1412–1426. doi: 10.1111/j.1365-2699.2012.02698.x
Duffy, J. E. (2008). Why biodiversity is important to the functioning of real-world ecosystems. Front. Ecol. Environ. 7, 437–444. doi: 10.1890/070195
Dyke, A. S. (2004). “An outline of North American deglaciation with emphasis on central and Northern Canada,” in Quaternary Glaciations: Extent and Chronology, eds J. Ehlers and P. L. Gibbard (Amsterdam: Elsevier), 373–424.
Feurdean, A., Tamas, T., Tantau, I., and Farcas, S. (2012). Elevational variation in regional vegetation responses to late-glacial climate changes in the Carpathians. J. Biogeogr. 39, 258–271. doi: 10.1111/j.1365-2699.2011.02605.x
Flannigan, M. D., Krawchuk, M. A., de Groot, W. J., Wotton, B. M., and Gowman, L. M. (2009). Implications of changing climate for global wildland fire. Int. J. Wildland Fire 18, 483–507. doi: 10.1071/WF08187
Fyfe, R., de Beaulieu, J.-L., Binney, H., Bradshaw, R., Brewer, S., Le Flao, A., et al. (2009). The European pollen database: past efforts and current activities. Veg. Hist. Archaeobot. 18, 417–424. doi: 10.1007/s00334-009-0215-9
Giesecke, T., Bennett, K. D., Birks, H. J. B., Bjune, A. E., Bozilova, E., Feurdean, A., et al. (2011). The pace of holocene vegetation change - testing for synchronous developments. Quat. Sci. Rev. 30, 2805–2814. doi: 10.1016/j.quascirev.2011.06.014
Girardin, M. P., Ali, A. A., Carcaillet, C., Mudelsee, M., Drobyshev, I., Hély, C., et al. (2009). Heterogeneous response of circumboreal wildfire risk to climate change since the early 1900s. Glob. Change Biol. 15, 2751–2769. doi: 10.1111/j.1365-2486.2009.01869.x
Gotelli, N. J., and Colwell, R. K. (2001). Quantifying biodiversity: procedures and pitfalls in the measurement and comparison of species richness. Ecol. Lett. 4, 379–391. doi: 10.1046/j.1461-0248.2001.00230.x
Grime, J. (1998). Benefits of plant diversity to ecosystems: immediate, filter and founder effects. J. Ecol. 86, 902–910. doi: 10.1046/j.1365-2745.1998.00306.x
Grimm, E. C. (2008). Neotoma, an Ecosystem Database for the Pliocene, Pleistocene, and Holocene. Springfield, MA: Illinois State Museum Scientific Papers E Series 1.
Grimm, E. C., and Jacobson, G. L. (1992). Fossil-pollen evidence for abrupt climate changes during the past 18 000 years in eastern North America. Clim. Dyn. 6, 179–184. doi: 10.1007/BF00193530
Grimm, E. C., Keltner, J., Cheddadi, R., Hicks, S., Lézine, A. M., Berrio, J. C., et al. (2007). “Pollen methods and studies/databases and their application,” in Encyclopedia of Quaternary Science, ed S. A. Elias (Oxford: Elsevier), 2521–2528.
Hubbell, S. P. (2001). The Unified Neutral Theory of Biodiversity and Biogeography. Princeton, NJ: Princeton University Press.
Jost, L. (2007). Partitioning diversity into independent alpha and beta components. Ecology 88, 2427–2439. doi: 10.1890/06-1736.1
Jost, L. (2010). Independence of alpha and beta diversities. Ecology 91, 1969–1974. doi: 10.1890/09-0368.1
Kier, G., Mutke, J., Dinerstein, E., Ricketts, T. H., Küper, W., Kreft, H., et al. (2005). Global patterns of plant diversity and floristic knowledge. J. Biogeogr. 32, 1107–1116. doi: 10.1111/j.1365-2699.2005.01272.x
Lande, R. (1996). Statistics and partitioning of species diversity, and similarity among multiple communities. Oikos 76, 5–13. doi: 10.2307/3545743
Leys, B., Finsinger, W., and Carcaillet, C. (2014) Historical range of fire frequency is not the Achilles' heel of the Corsican black pine ecosystem. J. Ecol. 102, 381–395. doi: 10.1111/1365-2745.12207
McKinney, M. L., and Lockwood, J. L. (1999). Biotic homogenization: a few winners replacing many losers in the next mass extinction. Trends Ecol. Evol. 14, 450–453. doi: 10.1016/S0169-5347(99)01679-1
Mitchell, F. J. G. (2010). Exploring vegetation in the fourth dimension. Trends Ecol. Evol. 26, 45–52. doi: 10.1016/j.tree.2010.10.007
Mourier, B., Poulenard, J., Carcaillet, C., and Williamson, D. (2010). Soil evolution and subalpine ecosystem changes in the French Alps inferred from geochemical analysis of lacustrine sediments. J. Paleolimnol. 44, 571–587. doi: 10.1007/s10933-010-9438-0
Odgaard, B. V. (1999). Fossil pollen as a record of past biodiversity. J. Biogeogr. 26, 7–17. doi: 10.1046/j.1365-2699.1999.00280.x
Olson, D. M., Dinerstein, E., Wikramanayake, E. D., Burgess, N. D., Powell, G. V. N., Underwood, E. C., et al. (2001). Terrestrial ecoregions of the world: a new map of life on earth. Bioscience 51, 933–938. doi: 10.1641/0006-3568(2001)051[0933:TEOTWA]2.0.CO;2
Power, M., Mayle, F., Bartlein, P., Marlon, J., Anderson, R., Behling, H., et al. (2013). Climatic control of the biomass-burning decline in the Americas after AD 1500. Holocene 23, 3–13. doi: 10.1177/0959683612450196
Prentice, C., Guiot, J., Huntley, B., Jolly, D., and Cheddadi, R. (1996). Reconstructing biomes from palaeoecological data: a general method and its application to European pollen data at 0 and 6 ka. Clim. Dyn. 12, 185–194. doi: 10.1007/BF00211617
R Development Core Team (2011) R: A Language and Environment for Statistical Computing. Vienna: R Foundation for Statistical Computing.
Reimer, P. J., Baillie, M. G. L., Bard, E., Bayliss, A., Beck, J. W., Bertrand, C. J. H., et al. (2004). IntCal04 Terrestrial radiocarbon age calibration, 26-0 ka BP. Radiocarbon 46, 1029–1058.
Richard, P. J. H. (1980). Histoire postglaciaire de la végétation au sud du lac Abitibi, Ontario et Québec. Geogr. phys. Quat. 34, 77–94. doi: 10.7202/1000385ar
Romme, W. H. (1982). Fire and landscape diversity in subalpine forests of Yellowstone National Park. Ecol. Monogr. 52, 199–221. doi: 10.2307/1942611
Shannon, C. E. (1948). A mathematical theory of communication. Bell Syst. Tech. J. 27, 379–423. doi: 10.1002/j.1538-7305.1948.tb01338.x
Shuman, B., Bartlein, P. J., and Webb III, T. (2005). The magnitudes of millennial- and orbital-scale climatic change in eastern North America during the late quaternary. Quat. Sci. Rev. 24, 2194–2206. doi: 10.1016/j.quascirev.2005.03.018
Suffling, R., Lihou, C., and Morand, Y. (1988). Control of landscape diversity by catastrophic disturbance: a theory and a case study of fire in a Canadian boreal forest. Environ. Manag. 12, 73–78. doi: 10.1007/BF01867378
Ter Braak, C. J. F. (1986). Canonical correspondence analysis: a new eigenvector technique for multivariate direct gradient analysis. Ecology 67, 1167–1179. doi: 10.2307/1938672
Volkov, I., Banavar, J. R., Maritan, A., and Hubbell, S. P. (2004). Neutral theory (communication arising): the stability of forest biodiversity. Nature 427, 696–696. doi: 10.1038/427696a
Walker, M., Johnsen, S., Rasmussen, S., Popp, T., Steffensen, J., Gibbard, P., et al. (2009). Formal definition and dating of the GSSP (global stratotype section and point) for the base of the holocene using the Greenland NGRIP ice core, and selected auxiliary records. J. Quat. Sci. 24, 3–17. doi: 10.1002/jqs.1227
Wardle, D., Walker, L., and Bardgett, R. (2004). Ecosystem properties and forest decline in contrasting long-term chronosequences. Science 305, 509–513. doi: 10.1126/science.1098778
Whittaker, R. H. (1972). Evolution and measurement of species diversity. Taxon 21, 213–251. doi: 10.2307/1218190
Williams, J. W., Cwynar, L. C., Lotter, A. F., and Levesque, A. J. (2002). Rapid and widespread vegetation responses to past climate change in the North Atlantic region. Geology 30, 971–974. doi: 10.1130/0091-7613(2002)030<0971:RAWVRT>2.0.CO;2
Williams, J. W., Shuman, B. N., and Webb III, T. (2001). Dissimilarity analyses of late-quaternary vegetation and climate in eastern North America. Ecology 82, 3346–3362. doi: 10.1890/0012-9658(2001)082[3346:DAOLQV]2.0.CO;2
Keywords: macroecology, richness, palynological diversity, turnover, nestedness, boreal biome, North America
Citation: Blarquez O, Carcaillet C, Frejaville T and Bergeron Y (2014) Disentangling the trajectories of alpha, beta and gamma plant diversity of North American boreal ecoregions since 15,500 years. Front. Ecol. Evol. 2:6. doi: 10.3389/fevo.2014.00006
Received: 27 October 2013; Accepted: 14 March 2014;
Published online: 01 April 2014.
Edited by:
Fabien F. Knoll, Spanish National Research Council, SpainReviewed by:
John Birks, University of Bergen, NorwayJean Nicolas Haas, University of Innsbruck, Austria
Copyright © 2014 Blarquez, Carcaillet, Frejaville and Bergeron. This is an open-access article distributed under the terms of the Creative Commons Attribution License (CC BY). The use, distribution or reproduction in other forums is permitted, provided the original author(s) or licensor are credited and that the original publication in this journal is cited, in accordance with accepted academic practice. No use, distribution or reproduction is permitted which does not comply with these terms.
*Correspondence: Olivier Blarquez, Centre d'Etude de la Forêt, Université du Québec Montréal, C.P. 8888 Succ., Centre Ville, Montrêal, QC H3C 3P8, Canada e-mail: blarquez@gmail.com;
Christopher Carcaillet, Institut de Botanique, Ecole Pratique des Hautes Etudes, 163 rue Broussonet, 34090 Montpellier, France e-mail: christopher.carcaillet@ephe.sorbonne.fr
†Co-first authors.