Hundreds of SNPs vs. dozens of SSRs: which dataset better characterizes natural clonal lineages in a self-fertilizing fish?
 Felix Mesak
 Andrey Tatarenkov
 Ryan L. Earley
 John C. Avise1
- 1Department of Ecology and Evolutionary Biology, University of California, Irvine, CA, USA
- 2Department of Biological Sciences, University of Alabama, Tuscaloosa, AL, USA
For more than two decades, mitochondrial DNA sequences and simple sequence repeats (SSRs, or microsatellite loci) have served as gold standards in population genetics. More recently, next generation sequencing (NGS) has enabled researchers to address biological questions that can benefit from hundreds or even thousands of nuclear single-nucleotide polymorphisms (SNPs) generated by restriction-site associated DNA sequencing (RAD-seq). Here we compare the performance of SSR and RAD-seq SNP methods to characterize clonal patterns in a self-fertilizing and highly inbred killifish, Kryptolebias marmoratus (mangrove rivulus) in Florida. RAD-seq analyses conducted on 18 inbred lineages of mangrove rivulus obtained from western Florida and a distant location in eastern Florida unveiled 481 polymorphic RAD loci of which 129 were homozygous within individuals and 352 loci were heterozygous in at least one individual. An initial UPGMA phenogram was constructed, based on 32 microsatellite loci, and used as a benchmark for comparisons with SNP-based phenograms, using a number of different criteria for SNP selection. A phenogram produced by the homozygous SNPs was in excellent agreement with the one generated from 32 microsatellite loci. However, heterozygous SNP data and RAD loci with more than one polymorphic site contributed more noise than usable signal and were unable to resolve clades consistently. This is likely due to errors in identifying homologous loci in the absence of a reference genome. In summary, although the RAD data were powerful in distinguishing the clonal lineages identified by SSR analyses, they also carried considerable phylogenetic noise. Our results suggest that RAD-seq methods should be used with caution for inferring fine population structure, and that stringent quality controls are necessary to reduce false phylogenetic signals.
Introduction
Historical advancements in empirical population genetics often have been tightly connected with the development of new molecular methodologies to uncover genetic variation. In the early 1980s simple sequence repeats (SSRs, or microsatellite loci) were discovered and became widely employed as highly polymorphic nuclear genetic markers (Miesfeld et al., 1981; Tautz, 1989), effectively supplanting earlier protein-electrophoretic methods that had relied on less polymorphic allozyme characters. In the mid-1980s, development of the polymerase chain reaction (PCR) (Saiki et al., 1985) combined with Sanger sequencing provided relatively straightforward access to multilocus genotypic data from natural populations, resulting in a profusion of empirical, methodological, and theoretical studies (Clark, 1990). In the 1990s, the discovery of ubiquitous single-nucleotide polymorphisms (SNPs) was suggested to replace SSR analyses due to their prevalence, potential functional importance, and stable inheritance, provided that efficient SNP typing systems could be developed (Landegren et al., 1998). For years SNP analyses were restricted to “model” organisms for which sequences of full genomes were available (Hinds et al., 2005; Clark et al., 2007), but recent next generation sequencing technologies enabled population genomics studies of non-model organisms, including characterization of phylogeography and phylogenetics (Brito and Edwards, 2009; McCormack et al., 2013). One of the most popular NGS methods to date is restriction-site associated DNA sequencing (RAD-seq) (Baird et al., 2008; Davey et al., 2011), which in recent years has figured prominently in phylogeographic and population-genetics studies (Emerson et al., 2010; Reitzel et al., 2013; Chu et al., 2014). The methodology is considered a reproducible way to generate multitudes of nuclear markers, with individual SNPs detected by short NGS reads nearby or between restriction sites scattered throughout the nuclear genome (Peterson et al., 2012).
NGS methods for screening hundreds and even thousands of loci across genomes can detect even minute genetic differences between individuals. Therefore, these methods may be useful to study organisms with reduced genetic variation, such as those found in genetically depauperate populations, clonal lineages, or highly inbred organisms. All these features are found in a self-fertilizing hermaphroditic fish, the mangrove rivulus (Kryptolebias marmoratus). Here we ask whether large number of SNPs perform better or worse than conventional microsatellite assays in characterizing highly homozygous inbred lineages in Floridian populations of mangrove rivulus.
The mangrove rivulus is a small New World rivulid fish that inhabits mangrove forests along the tropical and subtropical western Atlantic basin. This fish together with its sibling, K. ocellatus, are the only two vertebrates known to self-fertilize routinely (Tatarenkov et al., 2009, 2011). In addition to selfing, members of the mangrove rivulus complex occasionally outcross, apparently by spawning with gonochoristic males that occur at low frequencies in some populations. Thus, mangrove rivulus also provides an example of androdioecy, a rare reproductive system involving hermaphrodites plus pure males (Avise and Mank, 2009). These unique features of mangrove rivulus have prompted researchers to establish this species as a model for comparative and integrative biology (Earley et al., 2012; Orlando, 2012).
The selfing reproductive mode of K. marmoratus was discovered a half-century ago by Harrington (1961) and has since been the subject of many genetic and evolutionary analyses. Early on, Harrington and colleagues found that they could successfully graft fins and organs between a hermaphroditic individual and its offspring, or between siblings, thus indicating that the fish were genetically identical (or nearly so) and probably were homozygous at histocompatibility loci (Kallman and Harrington, 1964; Harrington and Kallman, 1968). Furthermore, recipient fish of one lineage acutely rejected artificial tissue grafts from a different donor lineage, implying that particular selfing strains must differ genetically. Harrington and Kallman used the word “clone” to refer to each such presumably highly inbred line of K. marmoratus, a terminological practice that continues today (Avise, 2008). Selfing repeated across successive generations leads to a rapid decay of heterozygosity. In lineages that lost heterozygosity completely, progeny of such inbred fish are identical among themselves and with their parent, thus being effectively clonal. One drawback of this term is that the genetic delimitation of a rivulus clone can be ambiguous or subject to change when refined molecular assays uncover cryptic genetic variation within a previously identified clonal lineage. For example, a study of 31 allozyme loci found no variation within major geographic regions (Florida, Yucatan, Curacao) and only small variation between regions, which could in principle be interpreted as evidence for an extensive regional clonal distribution (Vrijenhoek, 1985). Application of highly variable genetic markers such as multi-locus DNA fingerprinting (Turner et al., 1990, 1992; Laughlin et al., 1995) and microsatellites (Mackiewicz et al., 2006a; Tatarenkov et al., 2007) uncovered high local variation, yet also firmly established the predominance of completely homozygous fish in many populations in Florida. Indeed, offspring from a few dozen field-caught fish had the same DNA fingerprint profile as their parent (Turner et al., 1990, 1992). In a study of over 200 individuals from the Florida Keys, Tatarenkov et al. (2012) showed that 75% of the fish were fully homozygous at 32 microsatellite loci. Importantly, this predominance of homozygous fish was not a result of low marker variability, because the average expected heterozygosity was in the range of 40%. Surprisingly, although most fish were homozygous, only a few were genetically identical. The high inter-clonal diversity was explained by occasional outcrossing, which generates multiple segregated and recombinant genotypes (Mackiewicz et al., 2006b). The pattern of high inter-clonal diversity in mangrove rivulus contrasted with that found in other selfing organisms (including plants Arabidopsis, Avena, and snails in the genus Rumina), in which a single multi-locus genotype typically predominates in local populations (Avise and Tatarenkov, 2012). This result prompted the authors to conclude that the genetic composition of mangrove rivulus populations was not driven by natural selection on coadapted gene complexes, as envisioned and demonstrated by Allard et al. (1972).
Recently one of us (RLE) made extensive collections of mangrove rivulus from the northern edge of the species distribution in eastern and western Florida (previously, only single specimens were collected in those areas). Multilocus SSR genotyping, conducted by us, uncovered that these marginal populations were composed of only one or a few groups of genetically identical fish (unpublished results). This finding of a large number of identical fish suggested that marginal populations might have a distinct population genetic structure compared to populations in the rest of Florida. The presence of multiple individuals identical at a suite of highly variable microsatellite loci, in a relatively large area, indicates that clonal lineages may have persisted for a long time, during which new mutations would likely have arisen. Furthermore, if the progenitor of the apparent clonal lineages had some heterozygous loci, this would result in different alleles segregating in its offspring, and such loci presumably could be uncovered when large portions of the genomes are assayed. RAD-seq, which does not require prior knowledge of the genome, would seem to fit perfectly for this kind of assay. Furthermore, the effective isogenicity and homozygosity of the study organism—together with pronounced among-lineage differentiation—present obvious advantages for analyzing massive genomic data by setting clear predictions about the population genetic architecture of this species.
At the organismal level, a clone can be defined as any set of two or more genetically identical individuals. But “genetic identity” is to some extent a matter of degree, because even monozygotic twins may differ genetically due to post-zygotic de novo mutations. Thus, all else being equal, more refined molecular genetic assays are likely to detect greater clonal structure than are assays that are less genomically comprehensive. There are reasons to suspect that the huge numbers of molecular markers provided by RAD-seq may allow for greater resolution of clonal structure in mangrove rivulus because they should offer more power to detect both de novo mutations and/or residual genetic variation tracing back to recent outcrossing events in this androdioecious species. Here we compare the resolving power of two multilocus datasets to characterize “clonal” population structure in mangrove rivulus fish. These two datasets are as follows: (a) 32 polymorphic microsatellite (SSR, simple sequence repeat) loci; and (b) more than 480 SNPs (single nucleotide polymorphisms) generated by next generation RAD-seq (restriction-site associated DNA sequencing). We ask whether large numbers of SNPs perform better or worse than conventional microsatellite assays in characterizing “clonal” lineages in Floridian populations of mangrove rivulus. Results should be useful in comparing the relative merits of these two modern classes of molecular data in population genetics, including the broader utility of SNP analyses against multilocus SSRs in a clonal-discrimination context.
Materials and Methods
Material used in this study comes from a larger collection of mangrove rivulus fish in eastern and western Florida, at the edges of the species' distribution. Fish fin clips were collected in the field and preserved in DMSO solution (20% DMSO, 0.25M EDTA, saturated NaCl, pH 7.5; Seutin et al., 1991). Most fish were released on the site, but some were kept for breeding in the lab. Genotyping field-collected specimens with 32 microsatellite loci identified several clonal lineages: fish within each lineage were genetically identical, but they were distinct at multiple loci from other such lineages. Eighteen lab-kept mangrove rivulus individuals, representing three clonal lineages, were used to provide material (F1 offspring) for RAD-seq. Fourteen fish originated from two neighboring sites, ERIN (27°37′ 35.8″N 82°42′18.9″W) and FDS (27°37′42.1″N 82°42′13.6″W), located near Fort de Soto Park in Western Florida. Another four fish were from Emerson Point, a site across Tampa Bay (EPP, 27°31′59.9″N 82°38′43.5″W) about 5 km away from ERIN/EPP. Finally, two more fish were captured in Pepper Cove in eastern Florida (PC, 27°54′07.1″N 80°28′30.7″W), which is about 600 km away from Tampa Bay, if measured along the shore. Fish were kept in separate tanks in 25 ppt salt water and maintained at 26 ± 1°C on a 12 h light: 12 h dark photoperiod. Eggs were collected weekly and also kept in separate containers until they hatched, grew, and reached a size of about 2.5 cm. Fish < 1 month old were fed 1 ml brine shrimp (Artemia) nauplii daily and fish > 1 month old were fed 2 ml daily. One offspring from each parent was used for genomic DNA extraction. Age of the raised fish ranged from 99 (PC12) to 615 days (FDS09) with a median age of 326 days. Each fish was euthanized in sodium bicarbonate buffered MS-222, immediately preserved in DMSO solution, and stored at 4°C.
Microsatellite Genotyping
Genomic DNA for microsatellite analysis was extracted from fish fin clips using proteinase K isolation method (Milligan, 1998). 32 microsatellite loci developed for K. marmoratus (Mackiewicz et al., 2006a) were used in this study. One PCR primer for each locus was labeled with a fluorescent dye (HEX, 6-FAM, or NED) and DNA was amplified in several multiplex reactions, as described previously (Tatarenkov et al., 2012). PCR products were diluted 10–20-fold, mixed with deionized formamide and the size standard GS500 (ROX labeled; Applied Biosystems), denatured for 4 min at 95°C, and electrophoresed on a GA 3100 instrument (Applied Biosystems). Alleles were scored using Genemapper 4.0 (Applied Biosystems) and binned following the system in Tatarenkov et al. (2010).
RAD-Seq Analysis
Genomic DNA was extracted from ~100 mg of tissue sample using Proteinase K digestion method (Milligan, 1998) followed by purifications with phenol and chloroform. Genomic DNA quality was checked by visual inspection using agarose gel electrophoresis. Purity and quantity of genomic DNA were measured using a NanoDrop UV-Vis spectrophotometer (Thermo Fisher Scientific). The average genomic DNA yield from ~100 mg of tissue sample was 302 ng/uL with a purity at ratio A260/280 being 2.01.
RAD-seq library preparation for the NGS Illumina platform (Illumina, San Diego, CA) was performed by Ecogenics GmbH, Zurich, Switzerland (http://www.ecogenics.ch). We used a double digest RAD approach (Peterson et al., 2012). Briefly, 200–400 ng of genomic DNA was double-digested by EcoRI and MseI and ligated with adapters suitable for Illumina sequencing. Individual libraries were tagged with the Trueseq i5 and i7 panel. All adapters for barcoding each sample are proprietary of the Ecogenics GmbH. The resulting 18 reduced representation libraries were pooled, and a size selection for the range of 350–450 bp was done using agarose gel electrophoresis followed by extraction of the fragments from the gel using the Ecogenics GmbH's in house kit. Sequencing was performed in a single lane of an Illumina v3 cell using the 1 × 150 bp format. Quality of the sequences was evaluated with FastQC software version 0.10.1 (http://www.bioinformatics.babraham.ac.uk/projects/fastqc/). Overall, the sequencing of the reduced representation libraries performed very well, with all samples passing per base sequence quality control and per sequence quality control with scores well above cut-off values implemented in FastQC for identifying poor data. De novo assembly, grouping of sequences into the RAD loci, and SNP mining were performed with the STACKS package (Catchen et al., 2011) (http://creskolab.uoregon.edu/stacks). To generate the input files for the STACKS packages, the Illumina passed filter reads (>80 bp with Q > 30) were trimmed to 100 bp. After filtering for quality, there were on average 628,672 100 bp-long reads (63 Mb) per individual. Mean Phred quality score per base was at least 32 for all samples and >98% of the sequences had quality scores ≥30. RAD-seq data are deposited to NCBI (BioProject ID number: PRJNA261959).
Various combinations of parameters were used to process data with the STACKS modules. An initial examination of the data showed that the populations analyzed appeared to have a low SNP density with about 1 SNP per 4000 bp (see below). Taking this into account, an initial dataset was obtained using relaxed STACKS parameters, with the minimum depth of coverage required to create a stack m = 2, maximum distance (in nucleotides) allowed between stacks M = 4, the distance between catalog loci n = 2, and a diploid genome. A “stack″ is defined as a set of identical sequences. Several of these stacks may be merged forming potential loci, with parameter M constraining pairwise distance between any two merged stacks within a single individual. Main parameters can be explained as following: m, the minimum number of identical reads from a single individual used to initially create a stack; M, the maximum number of differences between stacks from a single individual used to create “stacks of stacks” for that individual that approach separate loci; and, n, the maximum number of differences between stacks from different individuals used to create the final combined loci.
For most of the results reported here we used more restrictive conditions: m = 3 (minimum number of identical sequences per stack); M = 2 (maximum pairwise distance between stacks within individual); n = 2 (distance allowed between stacks from different individuals). Potentially incorrectly merged loci and highly repetitive stacks (lumberjack stacks) were excluded using the parameters -d and –r (deleveraging and removal algorithms, respectively). Diploid model was used for calling SNPs, which assumes similar depth coverage for stacks of a common locus in an individual. The reliability of RAD loci obtained under these conditions was evaluated by their ability to group fish into three clusters, corresponding to clonal lineages as determined by microsatellite loci.
Biometrical Analyses
Pairwise genetic differences between individual fish at SSR or RAD-seq loci were estimated with the DPS distance metric (Bowcock et al., 1994) based on the proportion of shared alleles. Values of DPS can range from zero (genetic identity) to one (no shared alleles). To assess bootstrap support for genetic trees, 1000 distance matrices were calculated in Microsatellite Analyzer (Dieringer and Schlötterer, 2003). These matrices were used to construct UPGMA (unweighted pair-group method with arithmetic means) phenograms using the NEIGHBOR module of the PHYLIP package (Felsenstein, 1989); the resulting 1000 trees were passed through CONSENSE module to determine the percentage of replicate trees in which the associated taxa clustered together in the bootstrap test.
Results and Discussion
Delineation of Clonal Lineages by Microsatellites
Our multilocus (32 loci) SSR analyses of 18 mangrove rivulus fish samples uncovered two isogenic lineages in western Florida: Clone 1 consisting of specimens ERIN12, −14, −15, −18, FDS02, −04, −05, −07, −08, −09, −10, and −11; and Clone 2 consisting of specimens EPP01, −02, −04, and −07 (Figure 1A). All fish were completely homozygous and the two lineages were distinct from each other at 16 microsatellite loci. These two isogenic lineages were spatially well-separated from a third mangrove rivulus clonal lineage: Clone 3, consisting of specimens PC12 and -13 that were sampled over 600 kilometers away from a location in eastern Florida (Figure 1A). Eastern and western clonal lineages were distinct at 17–20 microsatellite loci. For purposes of comparison against the SNP data, the picture of population genetic structure painted by the SSR data (Figure 1A) can in effect also be considered a benchmark appraisal of the actual clonal relationships in mangrove rivulus.
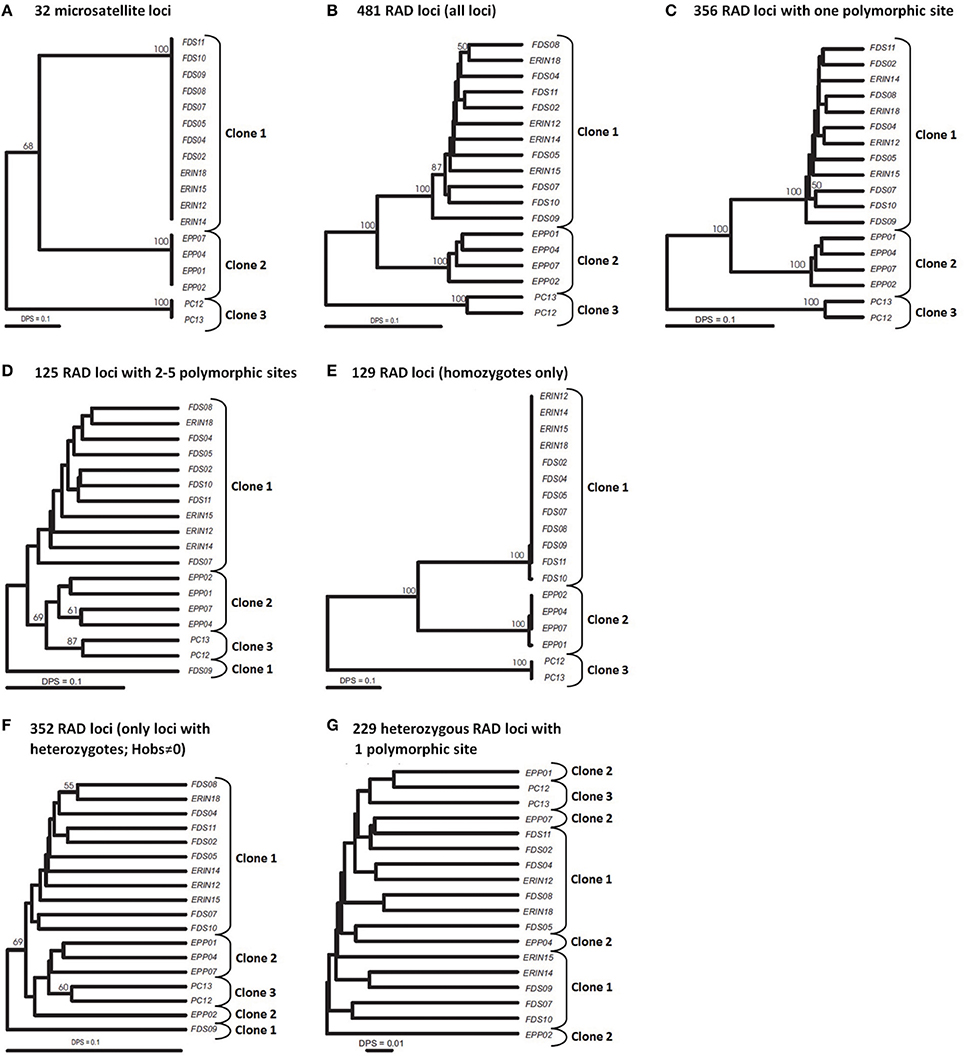
Figure 1. UPGMA trees of 18 strains of mangrove rivulus. (A) Tree constructed using 32 msat loci. (B–G) Trees constructed using RAD loci. (B) All 481 RAD loci. (C) 356 RAD loci containing 1 polymorphic site. (D) 125 RAD loci with 2-5 polymorphic sites. (E) 129 homozygous RAD loci (only loci that show no intra individual variation). (F) 352 heterozygous RAD loci (Hobs≠0). (G) 229 heterozygous RAD loci with one polymorphic site. Distance used: DPS, proportion of shared alleles for all datasets. Bootstrap support is based on 1000 replication; only values 50% or above are shown.
RAD-Seq Datasets Obtained with Relaxed vs. Strict Conditions
Our initial analysis using relaxed parameters (m = 2, M = 4, n = 2) resulted in 24,304 loci (RAD tags), each 100 bp long, that were shared among at least 14 of the 18 analyzed samples (i.e., >75%). Of these tags, 751 loci contained one or more SNPs, for a total of ~2000 polymorphic nucleotide sites and 10,000 haplotypes. 158 polymorphic loci contained more than two alleles (two haplotypes) per individual per locus, suggesting that sequences of duplicate loci and other repetitive elements were inadvertently piled together. Exclusion of loci with more than two alleles resulted in 593 loci present in at least 14 individuals, of which 168 were present in all 18 fish. Phenograms based on this dataset produced completely unresolved trees that failed at grouping individuals into the three clonal lineages (not shown). The possible reason is that the maximum distance allowed between stacks was too high, resulting in piling together alleles of paralogous loci and/or repetitive elements scattered around the genome.
Accordingly, we increased the stringency of the filtering by raising the minimum depth of coverage (m = 3) and decreasing the maximum distance allowed between stacks (M = 2). These settings resulted in 17,805 RAD tag loci, each of which was shared by at least 14 samples. 481 loci were polymorphic and made up the dataset that we analyzed further. 356 loci represented sequences with a single polymorphic site, another 83 loci had two SNPs per locus, and the remaining 42 loci had 3–5 SNPs per locus. In selfing organisms, polymorphic loci are expected to show an excess of homozygosity relative to Hardy-Weinberg expectations (in the extreme, all individuals will be homozygous for various alleles present in the population pool). Our dataset had 129 variable SNP loci that were homozygous across all individuals in which these loci were found. The remaining 352 SNP loci were present in heterozygous state in at least one individual. Correspondence of these data with microsatellites is explored below.
Comparison of RAD Loci with Various Numbers of Polymorphic Sites
RAD tags with multiple polymorphic sites often are excluded from analyses because they are likely to be an artifact of stacking alleles of paralogous loci (Emerson et al., 2010; Chu et al., 2014). In our study, the strong genetic distinctiveness of the clonal lineages presents a unique opportunity for testing the quality of the RAD-seq dataset: correctly assembled RAD tag loci should sort individuals into groups corresponding to the three major clonal lineages as identified by the SSR loci. Furthermore, this should hold both for RAD tag loci homozygous across all individuals and for RAD tag loci with heterozygotes. The phenogram constructed from all 481 RAD tag loci clearly distinguished (with high bootstrap support) the three clonal lineages (Figure 1B). We then split these loci into two groups: one containing 356 loci with a single polymorphic site; and another encompassing 125 loci with 2–5 SNPs per locus, and constructed a UPGMA phenogram for each set (Figures 1C,D). In the former case, clusters of individuals corresponding to clones became even better delineated than on the all-loci phenogram, whereas RAD tag loci with multiple SNPs were unable to resolve clonal lineages reliably. This suggested that RAD tag loci with multiple SNPs carry considerable evolutionary noise and should be treated with caution.
Another test of quality for the SNP data was based on the following reasoning. Because RAD tag loci represent short DNA stretches (100 bp in our case), each should be inherited as a single piece. Recombination on such a short stretch of DNA should have negligible effect on variation. Therefore, the behavior of such loci should be the same irrespective of the number of polymorphic sites, and, as a result, the proportion of homozygotes should be same for different categories of RAD tag loci. However, this proved not to be the case: 36% of the RAD tag loci with a single polymorphic site showed no intra-individual variation, whereas only <2% of the RAD tag loci with multiple SNPs were homozygous across all studied individuals (Table 1). This difference between groups of loci with respect to intra individual variation is highly significant (X2 = 54.8, d.f. = 2, P < 0.001). The likely explanation for the excess of heterozygosity among RAD tag loci with several polymorphic sites is that such “loci” are comprised of alleles from non-homologous regions of the genome. Of course, probably not all of the 125 loci with multiple polymorphisms reflect such artifacts of assembly. Nevertheless, to be on the conservative side in estimating sample heterozygosities—and for retrieving phylogenetic signal—it is safer to exclude them from the analysis.
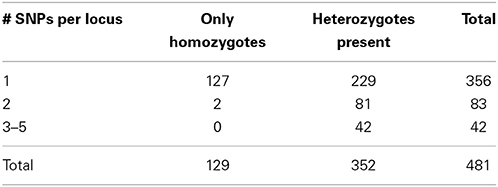
Table 1. Distribution of RAD tag loci according to the number of polymorphic sites per locus and presence or absence of intraindividual variation.
Comparison of Homozygous vs. Heterozygous RAD Loci
The unique reproductive biology of mangrove rivulus makes possible yet another test for the quality of the RAD-seq data. The complete absence of genetic variation among individuals of the clonal lineages—as evaluated by microsatellites—suggests that the common ancestor of fish in each clonal lineage was highly homozygous. Thus, polymorphic RAD tag loci that are homozygous across all individuals are likely to represent a dataset with the least amount of assembly errors. Indeed, the phenogram of mangrove rivulus strains based on variation at 129 such RAD tag loci mirrored almost perfectly the microsatellite-based phenogram (compare Figures 1A,E), with both trees revealing large genetic differences between clonal lineages and almost no variation among individuals within each clonal line (as defined by SSR loci). Indeed, in some respects these SNP data seem to contain a stronger phylogeographic signal than microsatellites, as they more clearly established relationships among clones by solidly placing the PC lineage (from eastern Florida) as the most diverged from the other fish (which were from western Florida). In contrast, a phenogram based on the 352 RAD tag loci that were heterozygous within individuals failed at grouping the fish according to clonal membership (Figure 1F). One possibility for the failure could be that the heterozygous dataset included a number of RAD tag loci with multiple polymorphic sites per locus (and these were shown to be unreliable in our previous analysis). However, heterozygous loci each with only one polymorphic site also failed to group the mangrove rivulus lineages in correspondence with their clonal affiliation (Figure 1G), suggesting that they too carry considerable noise and should not be used for estimating heterozygosity.
Great majority of 129 homozygous RAD loci were implicated in differences between three clonal lineages. However, this dataset also included two loci that were variable within clones: one locus had a SNP that distinguished fish FDS10 from the rest fish of clone 1, whereas another locus distinguished EPP01 from the other fish of clone 2 (Figure 1E). This shows that screening large portion of genomes does allow uncovering hidden genetic variation within clonal lineages defined by a suit of microsatellite loci. At the same time, the rather small intra-clonal variation at numerous loci suggests that representatives of the respective clonal lineages descend from a common ancestor that was homozygous across most of its genome.
Low SNP Density in the Rivulus RAD-Seq Dataset
Mangrove rivulus is thought to be a genetically depauperate species, probably due to its occupation of isolated microhabitats that may be conducive to population bottlenecks (Taylor and Jamieson, 2008; Taylor, 2012). Is this supported by exploring a larger portion of the genome? Altogether, about 1.78 Mb of homologous genomic regions were sequenced (17,805 RAD-Tags X 100 bp) in each of 14–18 fish, covering about 0.2–0.3% of the whole genome in K. marmoratus, estimated to be in the range of 633–900 Megabases (Mb) (Kelley et al., 2012; Rhee and Lee, 2014). Assuming that only RAD loci with one SNP are valid, the density of SNPs is about 1 per 5000 bp. This is likely to be an underestimate, because some subsets of loci in the group of multi-SNP RAD tag loci are undoubtedly true. If we consider all 481 loci, then the density increases to 1 SNP per 2700 bp. But this is likely to be an overestimate, so the true value of SNP density probably is in the range of 1 SNP per 3000–5000 bp.
Caution on RAD-Seq Analytical Parameters
Here we conducted a side-by-side comparison between multilocus SSR and NGS based RAD-seq to characterize clonal diversity in a self-fertilizing vertebrate (K. marmoratus), a “model” non-model organism that exists in nature as a collection of highly isogenic lineages. Our analyses showed that NGS-based RAD-seq was able to distinguish clonal populations of mangrove rivulus as resolved by multilocus SSR. Thus, the hundreds of SNPs from the RAD-seq analyses have a similar if not better resolving power than multilocus SSR. In principle, the effectively unlimited number of genetic markers might help to uncover hidden variation and further split seemingly homogeneous groups. On the other hand, one drawback of the RAD-seq approach compared to microsatellites was in the considerable evolutionary noise (together with obvious evolutionary signal) that the SNP dataset carried. Indeed, with some combinations of parameters, the noise was so strong that it effectively overrode the signal of lineage differentiation. Even after more stringent filtering the amount of noise was considerable. In our case, particularly worrying was an inability of the SNP method to distinguish true heterozygotes from artificially assembled variants of non-homologous but similar RAD tag loci. Clear predictions emanating from our biological system allowed us to identify and discard faulty RAD tag datasets, but such filtering may be not so practical for cases when there is a lack of strong a priori predictions based on a species' reproductive biology and/or other categories of genetic markers. As to the question of whether and which of the heterozygous RAD tag loci might be the true ones, we feel that the only reliable way to identify valid SNPs would be by doing a comparison against a fully sequenced reference genome. Availability of a reference genome presumably might allow the exclusion of duplicate and repetitive elements and thereby permit the subsequent data analyses to be restricted to unique RAD tag loci. Considering that many fish lineages have experienced repeated duplications of the whole genome, the problem of piling up non-homologous loci in analyses of the RAD-seq data may be quite pervasive, and require considerable efforts to solve it.
Conclusion
Following the use of stringent parameters, our RAD-seq analyses were able to detect a multitude of SNPs (especially from homozygous loci) that demarcate isogenic lineages that proved to be in excellent agreement with those identified from multilocus SSR analyses in a self-fertilizing species of rivulid fish. Hundreds of SNPs from both homozygous and heterozygous RAD tag loci deciphered sub-clonal populations of K. marmoratus due to de novo mutations and/or to the retention of polymorphisms from past outcrossing events within the populations analyzed. However, our genetic analyses also highlight several of the challenges and difficulties of analyzing SNPs derived from RAD-seq, and they demonstrate that researchers must exercise considerable caution is using such data for population genetic purposes.
Conflict of Interest Statement
The authors declare that the research was conducted in the absence of any commercial or financial relationships that could be construed as a potential conflict of interest.
Acknowledgments
Rivulus collections were facilitated by a Florida Fish and Wildlife Conservation Commission Special Activities License (SAL-12-1132-SR). Permissions from the Pinellas County (FL) Parks & Conservation Resources (Dr. Steven J. Harper, Pamela Leasure, and Jim Wilson), Brevard County Parks and Recreation Department (Environmentally Endangered Lands Program, Raymond Mojica) and Manatee County Natural Resources Department (Marcus Campion) to Ryan L. Earley. All procedures were approved by the University of Alabama Institutional Animal Care and Use Committee (Protocol #08-309 and #08-312). The authors would like to thank Dr. D. Scott Taylor, Elizabeth Lee, Kristy Marson, Michael Wells, Ryan Jones, and Molly Cook for logistical and field support.
References
Allard, R. W., Babbel, G. R., Clegg, M. T., and Kahler, A. L. (1972). Evidence for coadaptation in Avena barbata. Proc. Natl. Acad. Sci. U.S.A 69, 3043–3048.
Avise, J. C. (2008). Clonality: The Genetics, Ecology, and Evolution of Sexual Abstinence in Vertebrate. New York, NY: Oxford University Press. http://dx.doi.org/10.1093/acprof:oso/9780195369670.001.0001
Avise, J. C., and Mank, J. E. (2009). Evolutionary perspectives on hermaphroditism in fishes. Sex. Dev. 3, 152–163. doi: 10.1159/000223079
Avise, J. C., and Tatarenkov, A. (2012). Allard's argument versus Baker's contention for the adaptive significance of selfing in a hermaphroditic fish. Proc. Natl. Acad. Sci. U.S.A. 109, 18862–18867. doi: 10.1073/pnas.1217202109
Pubmed Abstract | Pubmed Full Text | CrossRef Full Text | Google Scholar
Baird, N. A., Etter, P. D., Atwood, T. S., Currey, M. C., Shiver, A. L., Lewis, Z. A., et al. (2008). Rapid SNP discovery and genetic mapping using sequenced RAD markers. PLoS ONE 3:e3376. doi: 10.1371/journal.pone.0003376
Pubmed Abstract | Pubmed Full Text | CrossRef Full Text | Google Scholar
Bowcock, A. M., Ruiz-Linares, A., Tomfohrde, J., Minch, E., Kidd, J. R., and Cavalli-Sforza, L. L. (1994). High resolution of human evolutionary trees with polymorphic microsatellites. Nature 368, 455–457. doi: 10.1038/368455a0
Pubmed Abstract | Pubmed Full Text | CrossRef Full Text | Google Scholar
Brito, P. H., and Edwards, S. V. (2009). Multilocus phylogeography and phylogenetics using sequence-based markers. Genetica 135, 439–455. doi: 10.1007/s10709-008-9293-3
Pubmed Abstract | Pubmed Full Text | CrossRef Full Text | Google Scholar
Catchen, J. M., Amores, A., Hohenlohe, P., Cresko, W., and Postlethwait, J. H. (2011). Stacks: building and genotyping Loci de novo from short-read sequences. G3 Genes Genomes Genetics 1, 171–182. doi: 10.1534/g3.111.000240
Pubmed Abstract | Pubmed Full Text | CrossRef Full Text | Google Scholar
Chu, N. D., Kaluziak, S. T., Trussell, G. C., and Vollmer, S. V. (2014). Phylogenomic analyses reveal latitudinal population structure and polymorphisms in heat stress genes in the North Atlantic snail Nucella lapillus. Mol. Ecol. 23, 1863–1873. doi: 10.1111/mec.12681
Pubmed Abstract | Pubmed Full Text | CrossRef Full Text | Google Scholar
Clark, A. G. (1990). Inference of haplotypes from PCR-amplified samples of diploid populations. Mol. Biol. Evol. 7, 111–122.
Clark, R. M., Schweikert, G., Toomajian, C., Ossowski, S., Zeller, G., Shinn, P., et al. (2007). Common sequence polymorphisms shaping genetic diversity in Arabidopsis thaliana. Science 317, 338–342. doi: 10.1126/science.1138632
Pubmed Abstract | Pubmed Full Text | CrossRef Full Text | Google Scholar
Davey, J. W., Hohenlohe, P. A., Etter, P. D., Boone, J. Q., Catchen, J. M., and Blaxter, M. L. (2011). Genome-wide genetic marker discovery and genotyping using next-generation sequencing. Nat. Rev. Genet. 12, 499–510. doi: 10.1038/nrg3012
Pubmed Abstract | Pubmed Full Text | CrossRef Full Text | Google Scholar
Dieringer, D., and Schlötterer, C. (2003). Microsatellite analyser (MSA): a platform independent analysis tool for large microsatellite data sets. Mol. Ecol. Notes 3, 167–169. doi: 10.1046/j.1471-8286.2003.00351.x
Earley, R. L., Hanninen, A. F., Fuller, A., Garcia, M. J., and Lee, E. A. (2012). Phenotypic plasticity and integration in the mangrove rivulus (Kryptolebias marmoratus): a prospectus. Integr. Comp. Biol. 52, 814–827. doi: 10.1093/icb/ics118
Pubmed Abstract | Pubmed Full Text | CrossRef Full Text | Google Scholar
Emerson, K. J., Merz, C. R., Catchen, J. M., Hohenlohe, P. A., Cresko, W. A., Bradshaw, W. E., et al. (2010). Resolving postglacial phylogeography using high-throughput sequencing. Proc. Natl. Acad. Sci. U.S.A. 107, 16196–16200. doi: 10.1073/pnas.1006538107
Pubmed Abstract | Pubmed Full Text | CrossRef Full Text | Google Scholar
Harrington, R. W. (1961). Oviparous hermaphroditic fish with internal self-fertilization. Science 134, 1749–1750. doi: 10.1126/science.134.3492.1749
Pubmed Abstract | Pubmed Full Text | CrossRef Full Text | Google Scholar
Harrington, R. W., and Kallman, K. D. (1968). The homozygosity of clones of the self-fertilizing hermaphrodite fish Rivulus marmoratus Poey (Cyprinodontidae, Atheriniformes). Am. Nat. 102, 337–343.
Hinds, D. A., Stuve, L. L., Nilsen, G. B., Halperin, E., Eskin, E., Ballinger, D. G., et al. (2005). Whole-genome patterns of common DNA variation in three human populations. Science 307, 1072–1079. doi: 10.1126/science.1105436
Pubmed Abstract | Pubmed Full Text | CrossRef Full Text | Google Scholar
Kallman, K. D., and Harrington, R. W. (1964). Evidence for the existence of homozygous clones in the self-fertilizing hermaphroditic teleost Rivulus marmoratus (Poey). Biol. Bull. 126, 101–114.
Kelley, J. L., Yee, M.-C., Lee, C., Levandowsky, E., Shah, M., Harkins, T., et al. (2012). The possibility of de novo assembly of the genome and population genomics of the mangrove rivulus, Kryptolebias marmoratus. Integr. Comp. Biol. 52, 737–742. doi: 10.1093/icb/ics094
Pubmed Abstract | Pubmed Full Text | CrossRef Full Text | Google Scholar
Landegren, U., Nilsson, M., and Kwok, P. Y. (1998). Reading bits of genetic information: methods for single-nucleotide polymorphism analysis. Genome Res. 8, 769–776.
Laughlin, T. F., Lubinski, B. A., Park, E. H., Taylor, D. S., and Turner, B. J. (1995). Clonal stability and mutation in the self-fertilizing hermaphroditic fish, Rivulus marmoratus. J. Hered. 86, 399–402.
Mackiewicz, M., Tatarenkov, A., Perry, A., Martin, J. R., Elder, J. F., Bechler, D. L., et al. (2006a). Microsatellite documentation of male-mediated outcrossing between inbred laboratory strains of the self-fertilizing mangrove killifish (Kryptolebias marmoratus). J. Hered. 97, 508–513. doi: 10.1093/jhered/esl017
Pubmed Abstract | Pubmed Full Text | CrossRef Full Text | Google Scholar
Mackiewicz, M., Tatarenkov, A., Turner, B. J., and Avise, J. C. (2006b). A mixed-mating strategy in a hermaphroditic vertebrate. Proc. R. Soc. B Biol. Sci. Lond. 273, 2449–2452. doi: 10.1098/rspb.2006.3594
Pubmed Abstract | Pubmed Full Text | CrossRef Full Text | Google Scholar
McCormack, J. E., Hird, S. M., Zellmer, A. J., Carstens, B. C., and Brumfield, R. T. (2013). Applications of next-generation sequencing to phylogeography and phylogenetics. Mol. Phylogenet. Evol. 66, 526–538. doi: 10.1016/j.ympev.2011.12.007
Pubmed Abstract | Pubmed Full Text | CrossRef Full Text | Google Scholar
Miesfeld, R., Krystal, M., and Arnheim, N. (1981). A member of a new repeated sequence family which is conserved throughout eucaryotic evolution is found between the human delta and beta globin genes. Nucleic Acids Res. 9, 5931–5947.
Milligan, B. (1998). “Total DNA isolation,” in Molecular Genetic Analysis of Populations, ed A. R. Hoelzel (London: Oxford University Press), 29–60.
Orlando, E. F. (2012). “Mangrove ‘killifish’: an exemplar of integrative biology”: introduction to the symposium. Integr. Comp. Biol. 52, 721–723. doi: 10.1093/icb/ics103
Pubmed Abstract | Pubmed Full Text | CrossRef Full Text | Google Scholar
Peterson, B. K., Weber, J. N., Kay, E. H., Fisher, H. S., and Hoekstra, H. E. (2012). Double digest RADseq: an inexpensive method for de novo SNP discovery and genotyping in model and non-model species. PLoS ONE 7:e37135. doi: 10.1371/journal.pone.0037135
Pubmed Abstract | Pubmed Full Text | CrossRef Full Text | Google Scholar
Reitzel, A. M., Herrera, S., Layden, M. J., Martindale, M. Q., and Shank, T. M. (2013). Going where tRADitional markers have not gone before: utility of and promise for RAD sequencing in marine invertebrate phylogeography and population genomics. Mol. Ecol. 22, 2953–2970. doi: 10.1111/mec.12228
Rhee, J. S., and Lee, J. S. (2014). Whole genome data for omics-based research on the self-fertilizing fish Kryptolebias marmoratus. Mar. Pollut. Bull. 85, 532–541. doi: 10.1016/j.marpolbul.2014.04.005
Pubmed Abstract | Pubmed Full Text | CrossRef Full Text | Google Scholar
Saiki, R. K., Scharf, S., Faloona, F., Mullis, K. B., Horn, G. T., Erlich, H. A., et al. (1985). Enzymatic amplification of beta-globin genomic sequences and restriction site analysis for diagnosis of sickle cell anemia. Science 230, 1350–1354.
Seutin, G., White, B. N., and Boag, P. T. (1991). Preservation of avian blood and tissue samples for DNA analyses. Can. J. Zool. 69, 82–90.
Tatarenkov, A., Earley, R. L., Taylor, D. S., and Avise, J. C. (2012). Microevolutionary distribution of isogenicity in a self-fertilizing fish (Kryptolebias marmoratus) in the Florida Keys. Integr. Comp. Biol. 52, 743–752. doi: 10.1093/icb/ics075
Pubmed Abstract | Pubmed Full Text | CrossRef Full Text | Google Scholar
Tatarenkov, A., Gao, H., Mackiewicz, M., Taylor, D. S., Turner, B. J., and Avise, J. C. (2007). Strong population structure despite evidence of recent migration in a selfing hermaphroditic vertebrate, the mangrove killifish (Kryptolebias marmoratus). Mol. Ecol. 16, 2701–2711. doi: 10.1111/j.1365-294X.2007.03349.x
Pubmed Abstract | Pubmed Full Text | CrossRef Full Text | Google Scholar
Tatarenkov, A., Lima, S. M., and Avise, J. C. (2011). Extreme homogeneity and low genetic diversity in Kryptolebias ocellatus from south-eastern Brazil suggest a recent foundation for this androdioecious fish population. J. Fish. Biol. 79, 2095–2105. doi: 10.1111/j.1095-8649.2011.03155.x
Pubmed Abstract | Pubmed Full Text | CrossRef Full Text | Google Scholar
Tatarenkov, A., Lima, S. M., Taylor, D. S., and Avise, J. C. (2009). Long-term retention of self-fertilization in a fish clade. Proc. Natl. Acad. Sci. U.S.A. 106, 14456–14459. doi: 10.1073/pnas.0907852106
Pubmed Abstract | Pubmed Full Text | CrossRef Full Text | Google Scholar
Tatarenkov, A., Ring, B. C., Elder, J. F., Bechler, D. L., and Avise, J. C. (2010). Genetic composition of laboratory stocks of the self-fertilizing fish Kryptolebias marmoratus: a valuable resource for experimental research. PLoS ONE 5:e12863. doi: 10.1371/journal.pone.0012863
Pubmed Abstract | Pubmed Full Text | CrossRef Full Text | Google Scholar
Tautz, D. (1989). Hypervariability of simple sequences as a general source for polymorphic DNA markers. Nucleic Acids Res. 17, 6463–6471.
Taylor, D. S. (2012). Twenty-four years in the mud: what have we learned about the natural history and ecology of the mangrove rivulus, Kryptolebias marmoratus? Integr. Comp. Biol. 52, 724–736. doi: 10.1093/icb/ics062
Pubmed Abstract | Pubmed Full Text | CrossRef Full Text | Google Scholar
Taylor, S. S., and Jamieson, I. G. (2008). No evidence for loss of genetic variation following sequential translocations in extant populations of a genetically depauperate species. Mol. Ecol. 17, 545–556. doi: 10.1111/j.1365-294X.2007.03591.x
Pubmed Abstract | Pubmed Full Text | CrossRef Full Text | Google Scholar
Turner, B. J., Elder, J. F., Laughlin, T. F., and Davis, W. P. (1990). Genetic variation in clonal vertebrates detected by simple-sequence DNA fingerprinting. Proc. Natl. Acad. Sci. U.S.A. 87, 5653–5657.
Turner, B. J., Elder, J. F., Laughlin, T. F., Davis, W. P., and Taylor, D. S. (1992). Extreme clonal diversity and divergence in populations of a selfing hermaphroditic fish. Proc. Natl. Acad. Sci. U.S.A. 89, 10643–10647.
Keywords: population genetics, next-generation sequencing, RAD-seq, SSR, microsatellite, mangrove rivulus, Kryptolebias marmoratus, self-fertilization
Citation: Mesak F, Tatarenkov A, Earley RL and Avise JC (2014) Hundreds of SNPs vs. dozens of SSRs: which dataset better characterizes natural clonal lineages in a self-fertilizing fish? Front. Ecol. Evol. 2:74. doi: 10.3389/fevo.2014.00074
Received: 05 September 2014; Accepted: 27 October 2014;
Published online: 12 November 2014.
Edited by:
Laura M. Boykin, The University of Western Australia, AustraliaReviewed by:
Susan E. Johnston, University of Edinburgh, UKMichael S. Brewer, East Carolina University, USA
Copyright © 2014 Mesak, Tatarenkov, Earley and Avise. This is an open-access article distributed under the terms of the Creative Commons Attribution License (CC BY). The use, distribution or reproduction in other forums is permitted, provided the original author(s) or licensor are credited and that the original publication in this journal is cited, in accordance with accepted academic practice. No use, distribution or reproduction is permitted which does not comply with these terms.
*Correspondence: Andrey Tatarenkov, Department of Ecology and Evolutionary Biology, University of California, 441 Steinhaus Hall, Irvine, CA 92697-2525, USA e-mail: tatarenk@uci.edu