Distribution, abundance, and feeding ecology of baleen whales in Icelandic waters: have recent environmental changes had an effect?
 Gísli A. Víkingsson1*
  Daniel G. Pike2
  Héðinn Valdimarsson3
  Anna Schleimer4
  Thorvaldur Gunnlaugsson1
  Teresa Silva3,5
  Bjarki Þ. Elvarsson1,6
  Bjarni Mikkelsen7
  Nils Øien8 Geneviève Desportes9 Valur Bogason1
  Philip S. Hammond4
- 1Marine Resources Section, Marine Research Institute, Reykjavík, Iceland
- 2Esox Associates, North Bay, ON, Canada
- 3Marine Environment Section, Marine Research Institute, Reykjavík, Iceland
- 4Sea Mammal Research Unit, Scottish Oceans Institute, University of St Andrews, St Andrews, UK
- 5Institute of Biology, University of Iceland, Reykjavík, Iceland
- 6Faculty of Physical Sciences, School of Engineering and Natural Sciences, University of Iceland, Reykjavík, Iceland
- 7Faroese Museum of Natural History, Torshavn, Faroe Islands
- 8Marine Mammal Research Group, Institute of Marine Research, Bergen, Norway
- 9GDnatur, Kerteminde, Denmark
The location of Iceland at the junction of submarine ridges in the North-East Atlantic where warm and cold water masses meet south of the Arctic Circle contributes to high productivity of the waters around the island. During the last two decades, substantial increases in sea temperature and salinity have been reported. Concurrently, pronounced changes have occurred in the distribution of several fish species and euphausiids. The distribution and abundance of cetaceans in the Central and Eastern North Atlantic have been monitored regularly since 1987. Significant changes in the distribution and abundance of several cetacean species have occurred in this time period. The abundance of Central North Atlantic (CNA) humpback and fin whales has increased from 1800 to 11,600 and 15,200 to 20,600, respectively, in the period 1987–2007. In contrast, the abundance of minke whales on the Icelandic continental shelf decreased from around 44,000 in 2001 to 20,000 in 2007 and 10,000 in 2009. The increase in fin whale abundance was accompanied by expansion of distribution into the deep waters of the Irminger Sea. The distribution of the endangered blue whale has shifted northwards in this period. The habitat selection of fin whales was analyzed with respect to physical variables (temperature, depth, salinity) using a generalized additive model, and the results suggest that abundance was influenced by an interaction between the physical variables depth and distance to the 2000 m isobaths, but also by sea surface temperature (SST) and sea surface height (SSH), However, environmental data generally act as proxies of other variables, to which the whales respond directly. Overall, these changes in cetacean distribution and abundance may be a functional feeding response of the cetacean species to physical and biological changes in the marine environment, including decreased abundance of euphausiids, a northward shift in summer distribution of capelin and a crash in the abundance of sand eel.
Introduction
Cetaceans are important top predators in Icelandic waters with a total of 23 species recorded (Hersteinsson, 2004) of which 12–14 species are considered regular inhabitants. In terms of biomass and consumption, cetaceans play an important role in the Icelandic ecosystem. Sigurjónsson and Víkingsson (1997) estimated the total annual consumption by 12 cetacean species as 6 million tons corresponding to around four times the total Icelandic fishery landings. The diet composition of these cetaceans is poorly known except for common minke whales (Balaenoptera acutorostrata), fin whales (Balaenoptera physalus) and harbor porpoises (Phocoena phocoena). Fin whales feed almost exclusively on euphausiids, mostly Meganyctiphanes norvegica, on the traditional whaling grounds in the Irminger Sea (Víkingsson, 1997). Fluctuations in environmental conditions affecting per capita prey availability have been shown to affect body condition and pregnancy rate in North Atlantic fin whales (Williams et al., 2013). Common minke whales have a much more varied diet ranging from euphausiids to large gadoid fish. Sand eel (Ammodytes sp.), herring (Clupea harengus) and capelin appear to be the most preferred prey (Víkingsson et al., 2014). The feeding ecology of blue (Balaenoptera musculus) and humpback whales (Megaptera novaeangliae) in Icelandic waters is not known. However, blue whales are known to feed exclusively on krill in the North Atlantic (Sears and Perrin, 2009) whereas humpback whales are reported to feed on both krill and pelagic schooling fish such as capelin and herring (Clapham, 2009).
Substantial warming and salinification has been observed in Icelandic and adjacent waters in the past two decades (Mortensen and Valdimarsson, 1999; Bersch, 2002; Malmberg and Valdimarsson, 2003; Hátún et al., 2005). Concurrently, pronounced changes have been reported in the distribution and abundance of several animal species in Icelandic waters. Some of these changes appear to be related to increased flow of Atlantic water masses into North Icelandic waters, including a northward expansion of the distribution of haddock (Melanogrammus aeglefinus), monkfish (Lophius piscatorius), and capelin (Mallotus villosus) (Astthorsson et al., 2007; Solmundsson et al., 2010). Sand eel abundance in southern and western Icelandic waters was apparently drastically reduced around 2005, with severe consequences for some seabird populations (Lilliendahl et al., 2013; Vigfusdottir et al., 2013). In terms of biomass, the most influential change is probably the recent invasion of Northeast Atlantic mackerel (Scomber scombrus) into Icelandic waters (Astthorsson et al., 2012). There are limited data available on temporal trends in meso- and macro zooplankton in Icelandic waters. Silva et al. (2014) found a decrease in euphausiid abundance in the oceanic (offshore) waters south and west of Iceland during 1958–2007, while in south Icelandic shelf waters they reported an increase in euphausiid larvae during 1990–2011. Recent and ongoing changes in the Icelandic marine environment affect several species that are important as prey for cetaceans. Depending on the ecological flexibility of the different species, these changes could be expected to affect the distribution and abundance of cetaceans in the area.
Large scale surveys, aimed at estimating and monitoring the distribution and abundance of cetaceans in the Central North Atlantic (CNA), have been conducted regularly since 1987 (Sigurjónsson, 1992; Lockyer and Pike, 2009; Víkingsson et al., 2009). Major changes in the distribution and abundance of several cetacean species have been observed over the past 20 years, particularly around the turn of the century. However, the potential effects on habitat use of cetaceans are poorly documented. Within the context of a changing environment, it is important to understand the link between baleen whales and their environment at various temporal and spatial scales in order to assess potential ecosystem-level effects, mediated by changing environmental conditions (Hátún et al., 2009). For future conservation and management it is of utmost importance to gain better understanding of these effects and the interactions among key species in the ecosystem.
In this paper we describe these changes in cetacean distribution and abundance and investigate to what extent they can be explained by recent biological (prey) and physical (oceanography) changes in the marine environment in this area. As part of this investigation, we present a first attempt at modeling the habitat use of fin whales in the Northeast Atlantic over a 20-year period, as a function of both physiographic and remotely sensed environmental variables. Fin whales were chosen for this exercise because of their wide distribution within the survey area and their spatial and temporal overlap with readily available environmental parameters.
Materials and Methods
Hydrography
Iceland is located at the intersection between large submarine ridges along the Mid Atlantic Ridge in the northern North Atlantic resulting in complex circulation in Icelandic waters (Figure 1). In combination with energetic atmospheric circulation this leads to a highly variable environment on the boundary between colder and warmer waters. The East Greenland Current and East Icelandic Current bring colder water from the north while the North Atlantic Current and the Irminger Current carry warmer waters from the south. With the polar front lying through the Denmark Strait area and the Irminger Sea, this climatic boundary fluctuates with various proportions of Polar, Arctic and Atlantic water, especially north of Iceland but also in the Irminger Sea.
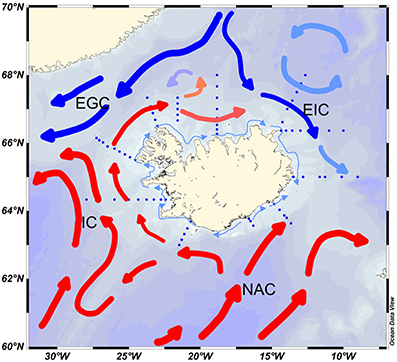
Figure 1. Oceanography of the Icelandic area. EGC, East Greenland Current; EIC, East Iceland Current; IC, Irminger Current; NAC, North Atlantic Current. The dotted lines represent sampling stations.
Oceanographic data to describe decadal changes in hydrographic conditions in Icelandic waters are based on long-term sampling conducted by the Marine Research Institute (MRI), Reykjavík Iceland (Malmberg and Valdimarsson, 2003; Valdimarsson et al., 2012). Temperature and salinity data used here were obtained with a CTD after 1990, mainly within the context of seasonal monitoring at stations around Iceland. Some data in the Irminger Sea were from an international redfish monitoring project coordinated through ICES. CTD data were processed according to internationally recommended standards. Data from before 1990 were obtained with Nansen bottles and reversing thermometers and then interpolated on 1 dbar intervals before being depth averaged in the same manner as CTD data.
Distribution and Abundance of Cetaceans
The North Atlantic Sightings Surveys (NASS and TNASS) constitute the largest series of cetacean surveys conducted to date in both spatial and temporal extent (Pike, 2009). These multi-national surveys have covered large parts of the summer distributions of North Atlantic baleen whales. To date, the series includes five large-scale surveys (1987, 1989, 1995, 2001, and 2007), the most recent one (TNASS 2007, CODA, SNESSA) extending across the whole North Atlantic from the east coast of North America to the European west coast (NAMMCO, 2009). In all these surveys, the CNA (Donovan, 1991) has been covered by Icelandic, Faroese and Norwegian research effort. The Icelandic continental shelf area was surveyed by air using cue-counting methods for abundance estimation (Donovan and Gunnlaugsson, 1989; Hiby and Hammond, 1989; Borchers et al., 2009; Pike et al., 2011a). Offshore waters of the CNA were covered by vessel surveys using conventional line transect methods (Sigurjónsson et al., 1989, 1991; Pike et al., 2009a, 2010b; Víkingsson et al., 2009). In addition to the above, full scale aerial surveys were conducted in Icelandic waters in 1986 and 2009 (Gunnlaugsson et al., 1988; Pike et al., 2011b).
The common minke whale was the primary target species of the aerial surveys covering Icelandic continental shelf waters, while the fin whales was the primary target species in the shipboard component covering Icelandic and adjacent offshore waters. The timing of the surveys was roughly the month of July, corresponding to the assumed peak abundance of the main target species, fin and common minke whales. The sei whale (Balaenoptera borealis) was a target species of the 1989 survey that had no aerial component and took place around 2 weeks later and extended further south than the other surveys (Sigurjónsson et al., 1991). The analysis presented here was largely confined to the CNA, an area that received a fairly systematic coverage by Iceland and the Faroes. To account for variable coverage within this area, post-stratification was applied for analysis of trends (Víkingsson et al., 2009). For comparisons within the shelf area, southern Icelandic waters were represented by aerial survey blocks 1, 2, 8, and 9 and northern Icelandic waters by blocks 4–7 (for delineation of aerial survey blocks Figure 6). Table 1 summarizes the aerial and shipboard surveys on which the analyses presented here are based.
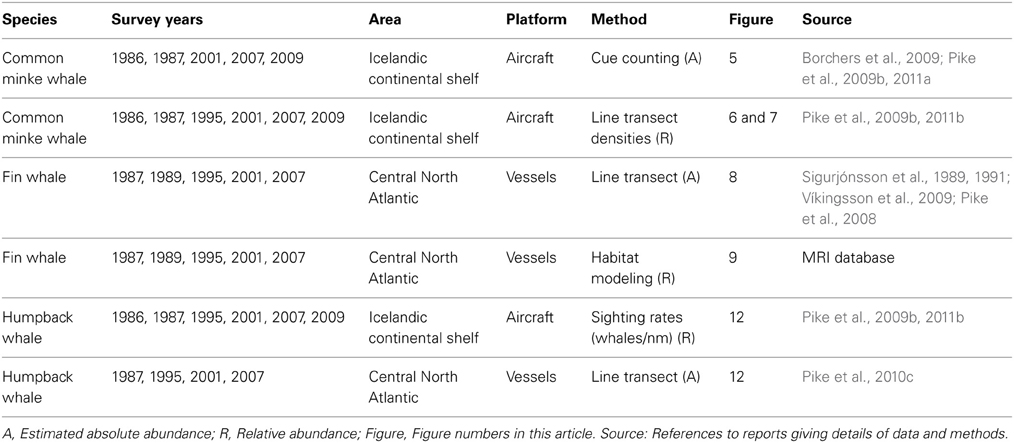
Table 1. Survey data used in the analyses of cetacean abundance.
Data on the catch distribution of fin whales were retrieved from the official databases of the MRI and the Icelandic Fisheries Directorate. Prior to the pause in fin whaling 1990–2005, positions were reported in squares (0.5° latitude × 1° longitude) used in the fisheries sector (Sigurjónsson, 1988) but, since 2006, more precise positions (to the nearest minute of latitude and longitude) have been reported.
Modeling of fin whale distribution
The large-scale link between fin whale distribution and its habitat in the Northeastern Atlantic was investigated by modeling the relationship between whale abundance and environmental covariates. Data on fin whale abundance were derived from the five Faroese and Icelandic line transect cetacean sighting surveys conducted from 1987 to 2007 (Lockyer and Pike, 2009). Transects were divided into effort segments, each of which ended when there was a change in survey conditions (sea conditions, weather) or a sighting. Data on cetaceans sighted included species, group size, and radial distance and angle to the group (Víkingsson et al., 2009).
In a first step, the detection probabilities, , of fin whales in each effort segment were estimated using the DISTANCE 6.2 software package (Thomas et al., 2010). Covariates available to improve precision and reduce bias in estimating detection probability included: sea conditions (Beaufort scale), weather index, visibility, vessel identity (nine vessels or three categories according to platform height), number of observers and group size. The weather index reflected the cloud cover as well as the amount of precipitation or fog and occasionally included wind direction. The final detection function was chosen by minimizing Akaike's Information Criterion (AIC) and by comparing the Cramér-von Mises goodness of fit test statistics (Thomas et al., 2010) and, all other things being equal, the precision of estimated average detection probability. Perpendicular distances were right truncated at 4000 m to improve detection function model fit; beyond this distance sightings were sporadic (Thomas et al., 2010). Only sightings with species identification of high and medium certainty were included in this analysis. Searching effort and sightings made in sea conditions greater than Beaufort scale 5 were excluded.
Abundance of fin whales, , in each effort segment, i, was estimated using the Horvitz-Thompson estimator:
where ni is the number of fin whales observed in the ith effort segment and ij is the estimated probability of detection of the jth detected group in segment i.
Covariate data available to model the influence of environmental features on fin whale abundance included physiographic, remotely sensed and reconstructed data (Table 2). Some covariates of interest, especially salinity and chlorophyll a, could not be included because some survey years pre-dated the use of certain satellite sensors (e.g., SeaWIFS operated only since 1997). Satellite altimetry data date back only to 1993; however, a sea surface height (SSH) data set from 1950 to 2009, reconstructed based on in situ tide-gauge records, was made available by Meyssignac et al. (2012). This dataset had global coverage up to 70°N, which led to the exclusion of a minimal number of effort segments further north. Depth, slope, seabed aspect and distance covariates were linked to effort segment midpoints in Manifold 8.0. Sea surface temperature (SST) and SSH values were assigned to effort segment midpoints by interpolating the value from four surrounding cells based on coordinates and time using R 3.0.1 (R Core Team, 2013).
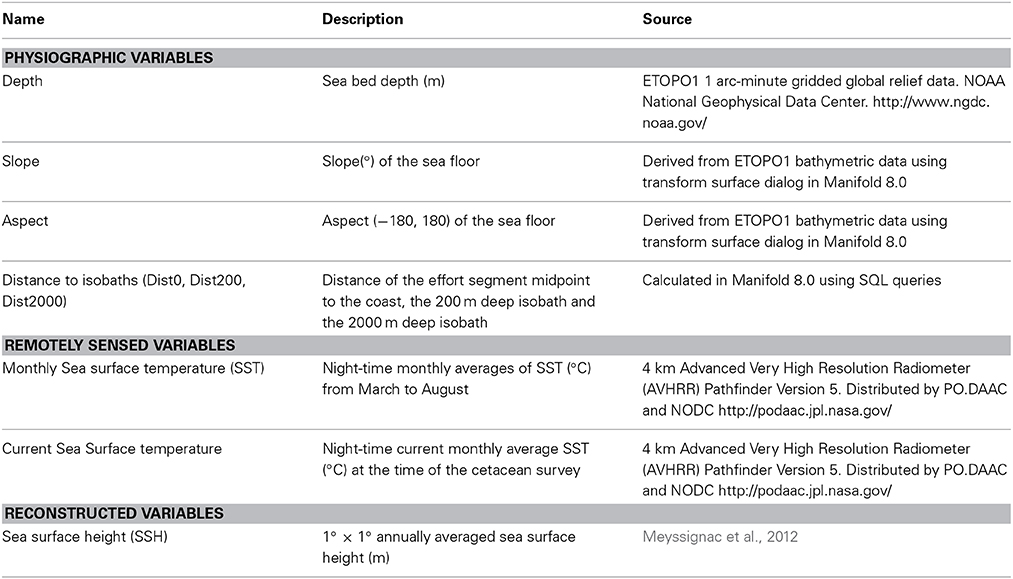
Table 2. List of physiographic and environmental covariates considered for inclusion in the model as explanatory variables.
Multi-panel scatterplots and Pearson correlation coefficients were used to assess collinearity between pairs of covariates (Zuur et al., 2009). Collinearity between two covariates was considered significant when the Pearson correlation coefficient exceeded 0.6. During the model fitting process, only the covariate that explained most of the deviance was retained in the model for covariates identified as collinear.
The relationship between estimated abundance of fin whales and environmental covariates was modeled using Generalized Additive Models (GAMs) (Hastie and Tibshirani, 1990). GAMs are commonly used to relate distribution or abundance of animals to environmental characteristics due to their greater flexibility compared to Generalized Linear Models (GLMs) (Wood, 2001).
A GAM for abundance data with log link function was used with the general structure:
where θ0 is the intercept term, fk are the smoothed functions of the explanatory covariates, and Xik is the value of the kth explanatory covariate in the ith segment.
As is common with such data, the response variable, , was overdispersed with a higher proportion of zeroes and of relatively large values than expected if the data were Poisson distributed. Models have been developed to deal with zero-inflated data (Barry and Welsh, 2002; Warton, 2005); however, a quasi-Poisson or negative binomial error distribution are appropriate when fitting models to overdispersed count data (Ver Hoef and Boveng, 2007). The Tweedie distribution has also been proposed because it has an additional parameter offering higher flexibility (Miller et al., 2013). These three error distributions, quasi-Poisson, negative binomial and Tweedie, were investigated when fitting the GAMs; quantile-quantile (QQ) plots, plots of Pearson residuals and response vs. fitted values plots were visually assessed to determine the most appropriate error distribution to use.
In models of count data, effort segments of variable length are typically accounted for by using an offset term, which assumes that the effort variable is a linear predictor with coefficient equal to 1 (Wood, 2006). However, in these data the relationship between the response variable and effort segment length did not meet this assumption and the latter was instead included as a smoothed covariate.
Data from surveys may be spatially auto-correlated and, if model covariates do not account for this, residuals may also be correlated leading to underestimated SEs of coefficients and possibly to unwarranted retention of covariates in model selection. A semi-variogram of model residuals from the final GAM plotted against distance between observations was inspected to assess whether there was spatial correlation in the model residuals (Zuur et al., 2009).
Smooth terms were modeled using penalized cubic regression splines with a shrinkage term, which allows smoothers to reduce to 0 degrees of freedom and to be dropped from the model (Wood, 2006). Interaction terms were fitted using tensor product interactions when the main effects were also included in the model. The package mgcv v. 1.8-1 for R was used to fit models (Wood, 2001).
Model selection used a forward stepwise procedure based on three evaluation criteria: (1) model GCV (Generalized Cross Validation) score, which is an approximation to AIC; (2) percentage of deviance explained; and (3) probability that a covariate was included in the model by chance using analysis of deviance tests (Wood, 2001).
For the predictive maps, a grid of 0.5° × 0.5° resolution populated with covariate values was generated in Manifold 8.0 for each survey year over the extent of survey coverage. Predictions of relative fin whale abundance in each grid cell for each survey year were generated in R based on the final GAM model. The point estimates of predicted relative abundance in each grid cell were smoothed into density surfaces using kriging with Gaussian distribution, implemented in Manifold 8.0, for presentation.
Cetacean Prey Species
Capelin
Capelin is among the most important commercially exploited pelagic fish species in Icelandic waters. The fishery for this species was initiated in the 1960s and continues to date. Acoustic monitoring of capelin distribution and abundance has been conducted by the MRI since 1980 by surveys in autumn and winter and has been reported annually in stock status reports (Marine Research Institute, 2014).
Sand eel
Sand eel have not been subject to commercial harvesting in Icelandic waters. However, they are important as a food source for other fish species, seabirds and marine mammals (Víkingsson et al., 2003, 2014; Lilliendahl and Solmundsson, 2006; Bogason and Lilliendahl, 2009; Vigfusdottir et al., 2013). Attempts to monitor sand eel abundance were not initiated until 2006, in relation to poor breeding success of seabirds in south Iceland. However, auxiliary information can be obtained from stomach content data from haddock sampled during MRI's annual groundfish surveys (Bogason and Lilliendahl, 2009; MRI, unpublished data).
Euphausiids (krill)
Data on euphausiid abundance were obtained from Sir Alistair Hardy Foundation for Ocean Science (SAHFOS) from their Continuous Plankton Recorder (CPR) program (Silva et al., 2014). The CPR collects plankton from vessels of opportunity crossing the North Atlantic along standard routes. The samples are processed, including species identification at SAFHOS (Batten et al., 2003). The northernmost routes of the CPR surveys cover the areas south and southwest of Iceland.
Results
Hydrography
Changes in temperature and salinity in the waters south and west of Iceland in recent decades have been characterized by observations from the deepest station in the Faxaflói section west of Iceland (Figure 2A). This station is located in the core of the Atlantic water as it flows northwards along the shelf break in the Irminger Current. After the basin wide changes before the mid-1990s, temperature and salinity in the mixed layer started to increase rapidly, demonstrating the increase of water of Atlantic character in this part of the Sub Polar Gyre. Similar changes were observed in temperature further north on the Latrabjarg section (station Lb4 Northwest Iceland) in the northward flow of the branch of the Irminger Current which feeds the inflow of Atlantic water to the area north of Iceland, i.e., the North Icelandic Irminger Current (Figure 2B). The rise in temperature was particularly steep between 1995 and 2000 (Figure 2). In the following years, these changes are also apparent in the shelf area to the north of Iceland and most markedly as higher winter temperatures (Figure 3). Since 1998, winter temperature and salinity were higher than the average for the measurement period (1970–2014) in all years except 2002. In general, a similar but more variable rise in temperature was observed in other seasons. Figure 4 shows changes in summer temperatures at 200 m depth in the Irminger Sea between 1994 and 2003. Appreciable warming occurred in this period, particularly in the deep water area between the continental shelves of Iceland and Greenland.
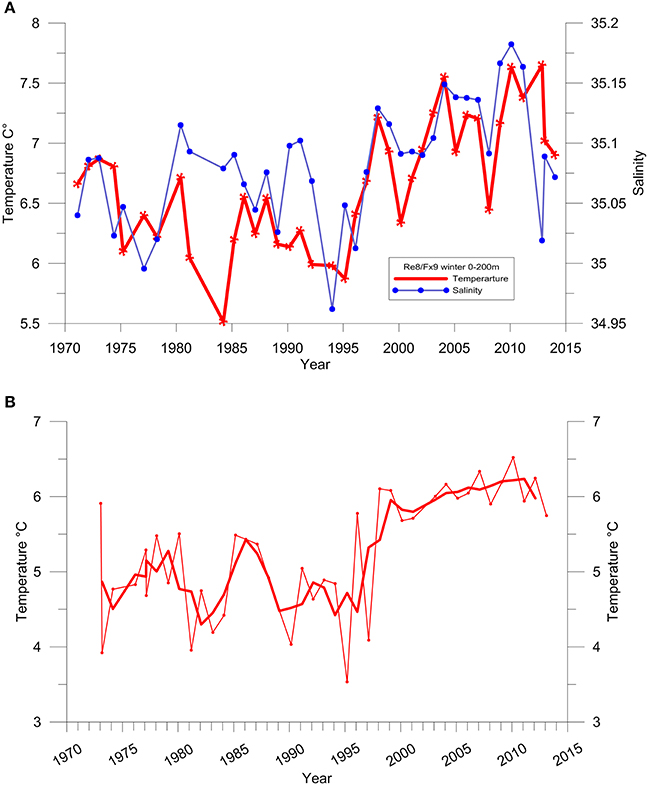
Figure 2. (A) Temperature (red) and salinity (blue) at a repeated hydrographic station, Fx9, in winter at the shelf slope west of Iceland. Dept average over 0–200 m depth. (B) Temperature at a repeated hydrographic station, Lb4, in winter at Latragrunn. Depth average over 80–180 m depth. Thick line shows 3-year running mean.
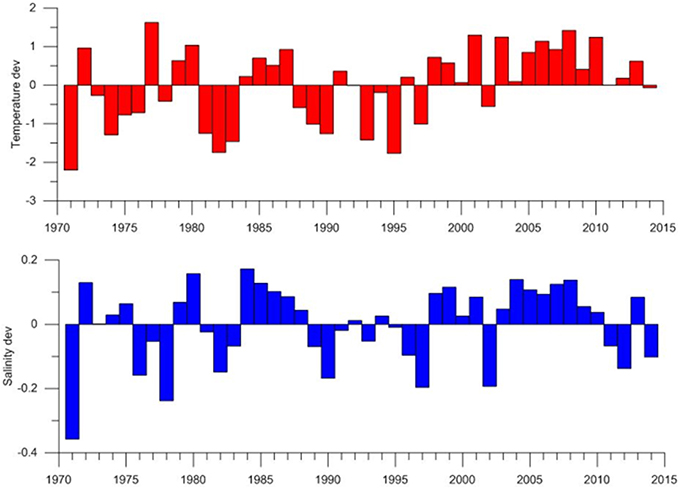
Figure 3. Temperature and salinity deviations from Siglunes section north of Iceland 1970–2013. Deviations are from depth average and mean from stations Si2–Si4.
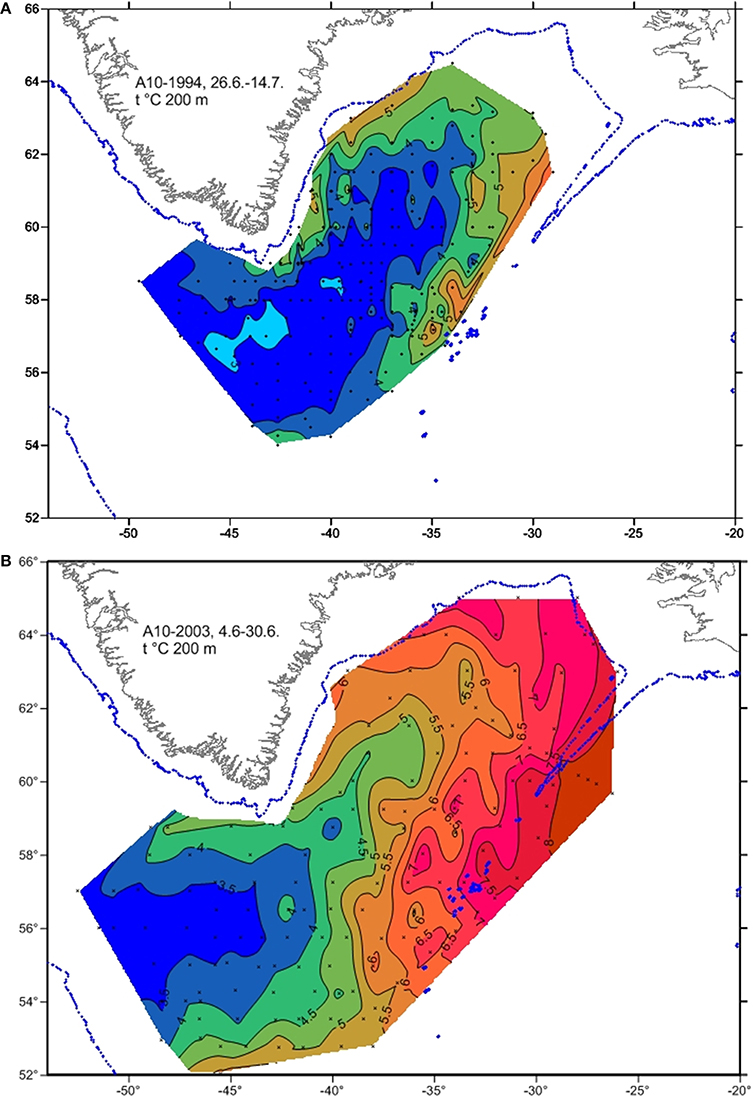
Figure 4. Sea temperatures at 200 m depth in the Irminger Sea in June 1994 (A) and 2003 (B).
Distribution and Abundance of Cetaceans
Common minke whale
Abundance estimates of common minke whales from aerial surveys conducted during 1987–2009 over the Icelandic continental shelf varied widely (Figure 5). Point estimates of abundance increased appreciably between 1987 and 2001 although the difference was only marginally significant (Borchers et al., 2009; Pike et al., 2009b). The survey in 2007 revealed a reduction in minke whale abundance to less than half that of 2001 and an extra aerial survey conducted in 2009 showed even further decline in numbers (Figure 5).
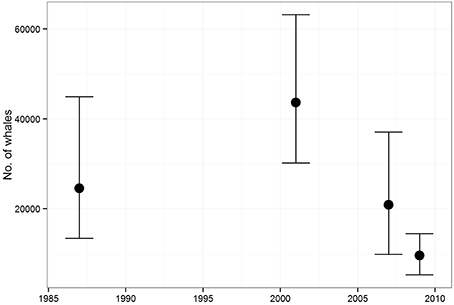
Figure 5. Abundance estimates (with 95% confidence intervals) of common minke whales in the Icelandic continental shelf area derived from aerial surveys conducted during 1987–2009.
Figure 6 shows concurrent changes in relative densities (number of whales/nm2 at the surface) of common minke whales on the Icelandic continental shelf according to the aerial surveys conducted during 1986–2009. As for the estimated abundance, the estimates for the whole survey area show a slightly increasing, but non-significant trend within the range of 0.04 and 0.06 animals/nm2 between 1986 and 2001. In the next survey (2007), the densities had decreased sharply to less than 0.02 animals/nm2 and this drop in density was confirmed in the survey conducted in 2009 (Figure 6).
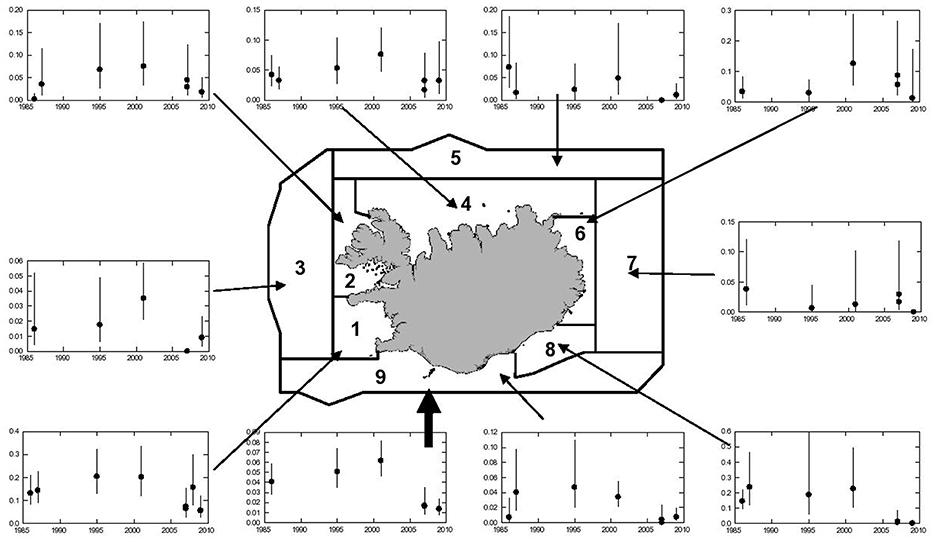
Figure 6. Trend in relative abundance (number of whales/nm2 at the surface with 95% confidence intervals) of common minke whales, 1986–2009, as indicated by line transect density in the Icelandic aerial survey area. Two estimates, using both primary observers, and a single primary observer, are shown for 2007 and 2009. The thick arrow refers to the total survey area.
The decreased densities after 2001 were evident in most sub-areas of the aerial survey. However, the degree of the decline was highly variable within the continental shelf stratum with the steepest declines in southern and western coastal waters (Figure 6). Figure 7 compares the mean densities of the southern (blocks 1, 2, 8, and 9) and northern (blocks 4–7) survey blocks for the periods 1986–2001 and 2007–2009. In the earlier period, mean density in the southern/western area was more than double that of the northern area. In the later period, density in both areas declined to about the same level; thus the decline was much steeper in the southern area (79%) than in the northern area (46%).
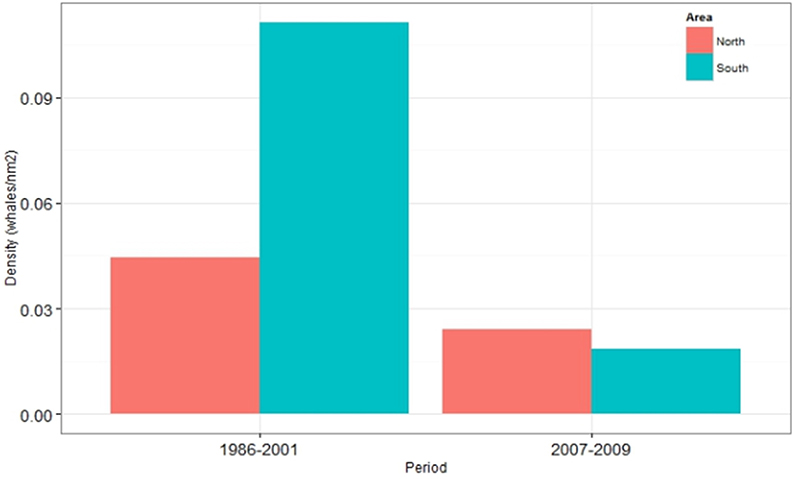
Figure 7. Comparison of changes in densities (Number of animals/nm2) of common minke whales in northern (blocks 4–7) and southern (blocks 1, 2, 8, and 9) coastal Icelandic waters. For delineation of aerial survey blocks see Figure 6.
Fin whale
The estimated abundance of fin whales increased during the survey period from 15,200 in 1987 to 20,600 in 2007 (Figure 8). During 1987–2001 the annual increase in the total CNA was estimated as 4%, while the annual growth rate was estimated as 10% in the Irminger Sea between Iceland and Greenland (Víkingsson et al., 2009).
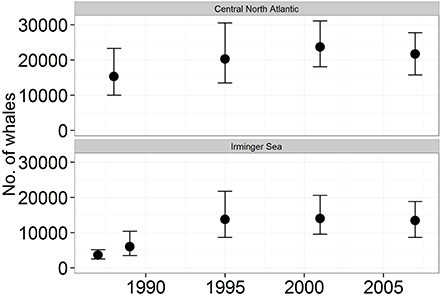
Figure 8. Abundance (with 95% confidence intervals) of fin whales according to the North Atlantic Sightings Surveys 1987–2001 in the total Central North Atlantic stock area (upper) and in the Irminger Sea west of Iceland (lower). For area delineations see Víkingsson et al. (2009).
In the habitat modeling, the covariates retained in the final GAM included smooth functions for SST, SSH and survey effort segment length, and an interaction term between depth and distance to the 2000 m isobath. A negative binomial error distribution with log link function was identified as the best description of the data. Pearson correlation coefficients showed high collinearity between all monthly SST covariates (r = 1, p < 0.0001), and between all combinations of Depth, Dist0, and Dist200 (r > 0.7, p < 0.0001). Accordingly, only one SST covariate and one of Dist0, Dist200, or Depth were included in the final model. The semi-variogram indicated that there was no spatial correlation in the model residuals (Supplementary Figure 1).
The results of the final model, which explained 15.7% of the deviance, are given in Supplementary Table 1. Figure 9 shows the fitted smooth function for each covariate included in the final model. The probability of sighting fin whales decreased with increasing segment length, supporting the decision to include effort as a smoothed covariate rather than an offset term (Figure 9F). SST in the study area at the time of the surveys ranged from 2.5°C to 15.7°C and the highest probability of encountering fin whales was predicted to be in waters with surface temperatures between 5 and 11°C peaking around 6–7°C (Figure 9D). Fin whales were less likely to be observed at greater distances from the 2000 m isobath and in shallower waters (Figures 9B,C). This pattern was also reflected in the interaction between these two covariates (Figure 9A). Sightings were mainly made at intermediate SSH of 0.02–0.04 m elevation as well as in waters with SSH depressions greater than 0.05 m (Figure 9E).
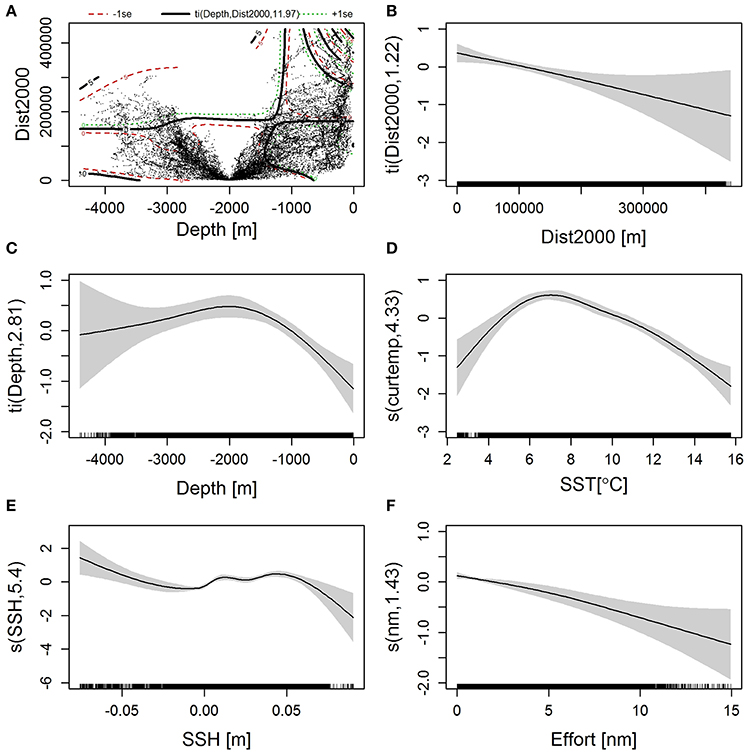
Figure 9. Smooth functions fitted in the final GAM for (A) 2-D interaction between Depth and Distance from the 2000 m isobath, (B) Distance from the 2000 m isobath, (C) Depth, (D) Sea surface temperature, (E) Sea surface height, and (F) survey effort. Positive values of the smoothed function indicate a positive effect on the response variable. In (A), the dots represent values of the response variable, and the black, green and red lines are contours of the fitted function ±1 SE. Given above the plot is the smoother term and the estimated degrees of freedom (see Supplementary Table 1). In (B–F), shaded areas represent the 95% confidence interval. Tick marks on the horizontal axis show the distribution of observations. The vertical axes describe the smoother term and estimated degrees of freedom (see Supplementary Table 1).
The Irminger Sea and the area northeast of Iceland were predicted to hold the highest abundance of fin whales in all years (Figures 10A–E), except in 1989 when the area north of Iceland was not surveyed (Figure 10B). Within the Irminger Sea, fin whales were predicted to be mostly concentrated along the 2000 m isobath. Predicted relative abundance was high along the East Greenland shelf particularly in 2001 and 2007. The area west of the British Isles had consistent low predicted abundance of fin whales. These predictions were overall in agreement with the observations of fin whales.
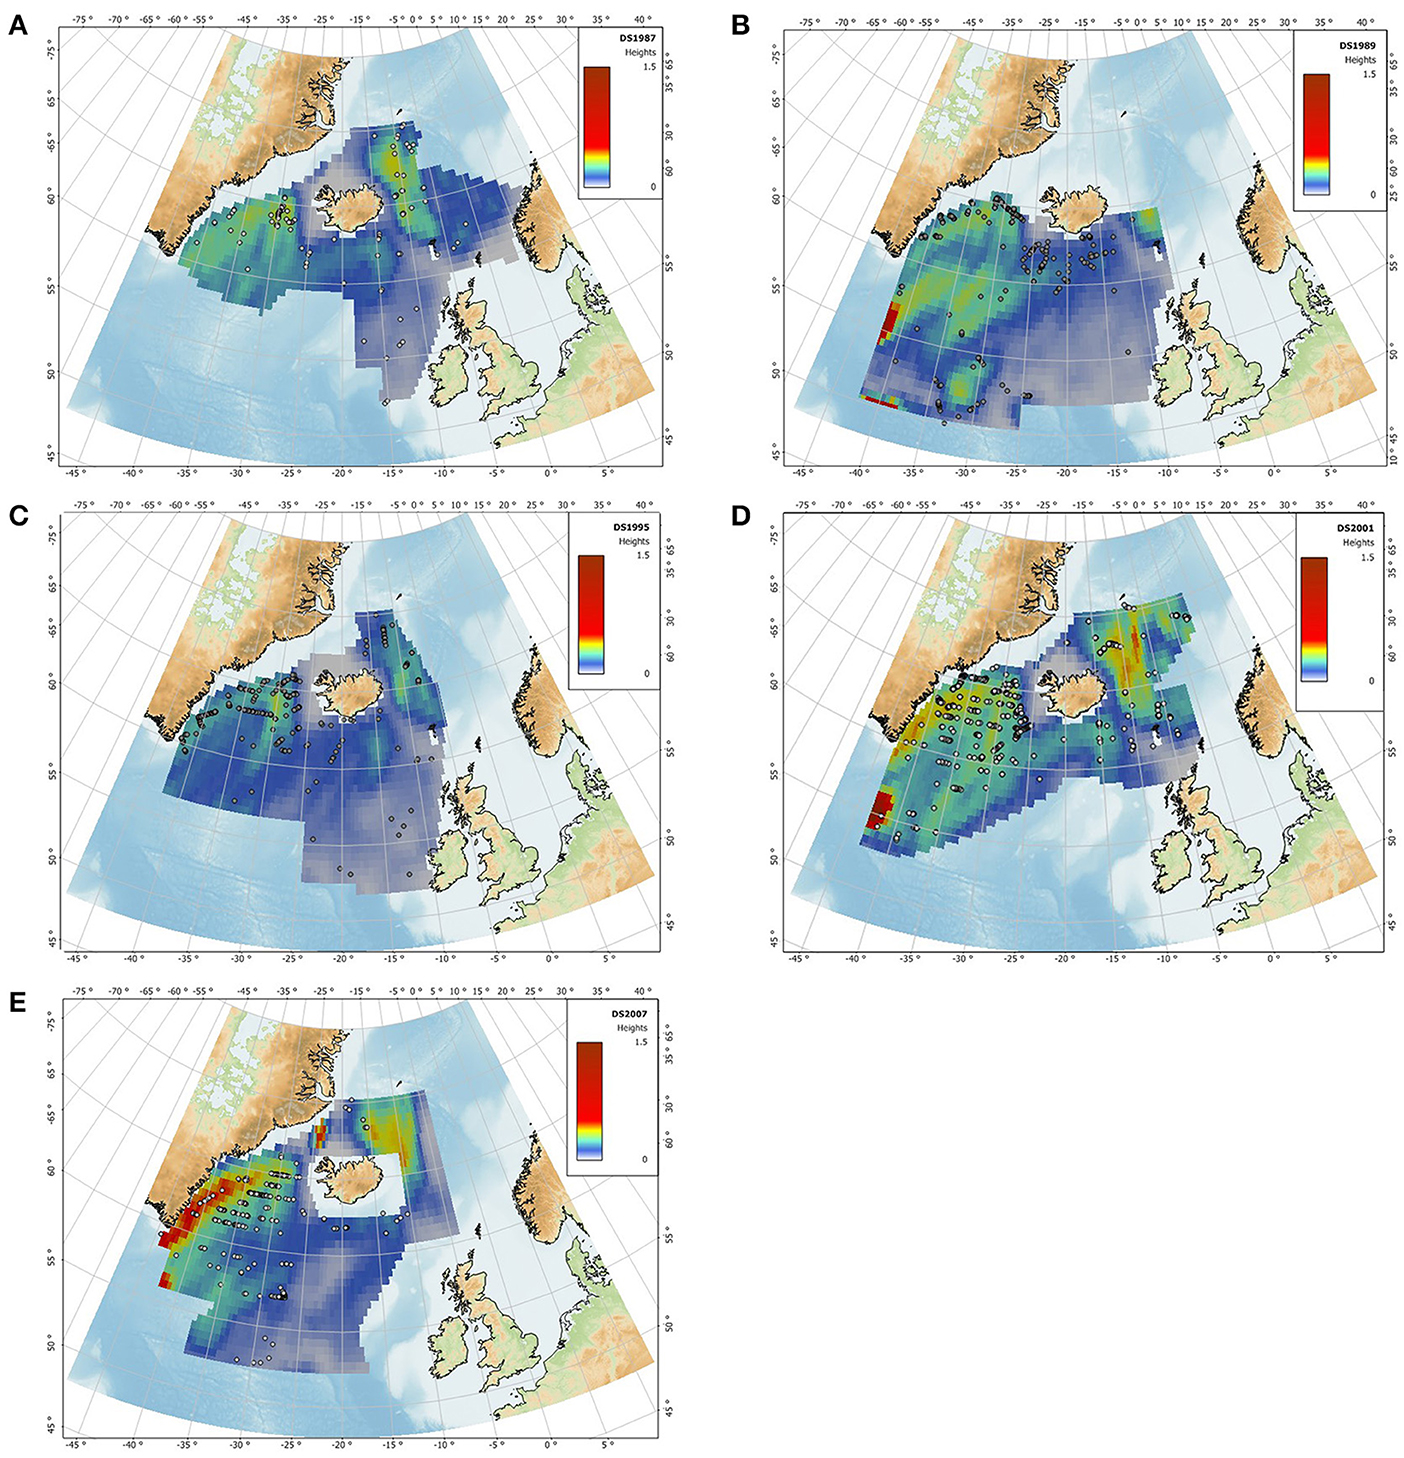
Figure 10. Predicted density surface maps derived from the final GAM with an average segment length of 1.75 nm and SST from July for the survey years 1987 (A), 1989 (B), 1995 (C), 2001 (D), and 2007 (E). Warmer colors indicate higher predicted relative abundance. Dots represent observations of fin whale groups during the surveys. Predicted relative abundance in each grid cell was smoothed using kriging.
As noted previously (Pike et al., 2008; Víkingsson et al., 2009), the distribution of fin whales has changed in the Irminger Sea. Whales aggregated over the continental slope in 1987, 1989, and 1995, but were dispersed throughout the Irminger Sea in 2001 and 2007. The model failed to explain the high number of sightings south of Iceland in 1989 (Figure 10B).
Since the resumption of fin whaling in 1948 the operation has been limited to a single land station in Hvalfjörður, West Iceland (Sigurjónsson, 1988). Because of factory regulations concerning freshness of products, catches have been limited to approximately 24 h cruising distance from the station. The distribution pattern of the fin whale catches has been rather stable and largely confined to areas close to the continental slopes of the Irminger Sea west of Iceland (Figure 11). The catch distribution of sei whales has been somewhat wider including areas further east along the southern coast of Iceland. The catch distribution of fin whales in 2014 differed appreciably from all the previous seasons since 1948. During 16–26 June, 26 fin whales were caught within the traditional fin whaling grounds west and southwest of Iceland. In the following 2 weeks only two fin whales were caught in this area despite considerable search effort. After widening the search area fin whales were found in high densities in offshore south Icelandic waters. During the rest of the season, 13 July-23 September 2014, 104 fin whales were taken in these “new” fin whaling grounds and four in the traditional grounds (Figure 11).
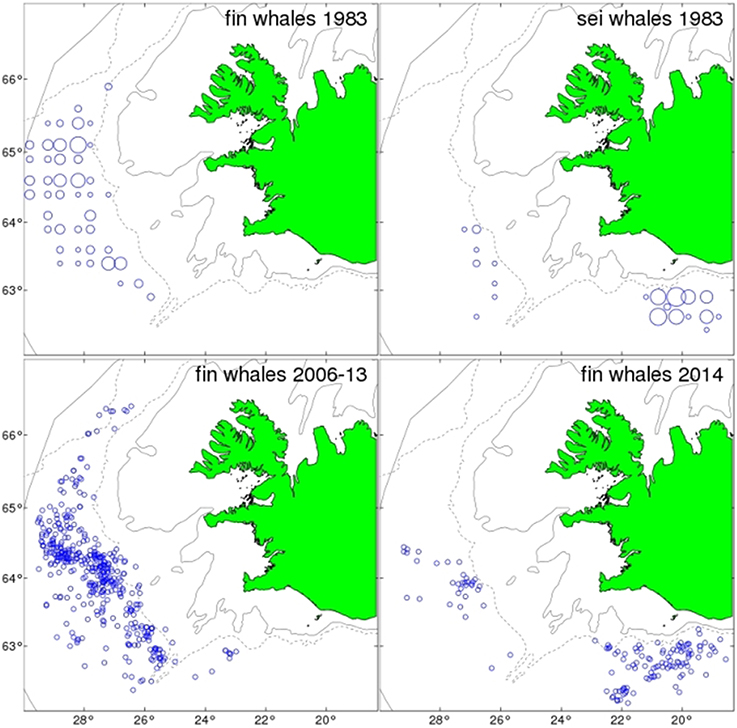
Figure 11. Catch positions of fin whales 1983, 2006–2013, and 2014, and sei whales 1983. Circles for individual whales 2006–2014, but in 1983 whales were reported by squares. Circle area is in proportion to catch numbers in square.
Humpback whale
Figure 12 shows the estimated relative abundance of humpback whales from the 1986–2009 aerial surveys and estimated absolute abundance from the 1987–2007 shipboard surveys. Both indices show an increase in the point estimates from 1986/1987 to 2001 with a slight decrease thereafter. However, confidence intervals are wide and the estimates since 1995 are not significantly different from each other.

Figure 12. Humpback whale abundance 1986–2009. Sightings rates (animals/nm) in the Icelandic continental shelf area (upper) Estimated total abundance in the Central North Atlantic (lower). Ninety five percent confidence intervals are shown.
Cetacean Prey Species
Sand eel
Figure 12 shows the average number of sand eel in haddock stomachs sampled during the annual Icelandic groundfish surveys 1997–2010. Sand eel numbers decreased sharply from around 3/stomach in 1997 to 0 in 2004. In all subsequent years except 2007, the mean number of sand eel per stomach was less than 0.25 (Figure 13).
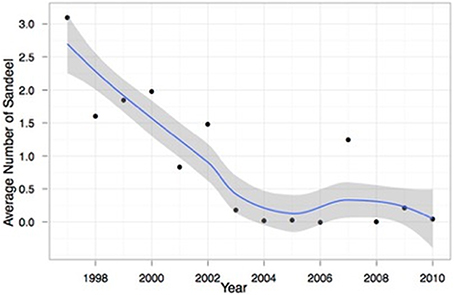
Figure 13. Mean number of sand eel in haddock stomachs analyzed in the Icelandic groundfish survey 1997–2010. A loess smoother has been fitted to the time series, shown with 95% confidence intervals.
Capelin
A major shift in distribution and migration pattern of capelin appears to have taken place around the turn of the century (Figure 14). A northward shift in distribution of 0-group capelin away from the Icelandic continental shelf waters north off Iceland was first observed in 2003, coinciding with the onset of a greatly reduced recruitment to the capelin stock (Pálsson et al., 2012a,b, 2014). This situation seems to have prevailed ever since (Marine Research Institute, 2014). The distribution of adult capelin has also shifted westwards toward the coast of Greenland (Figure 14).
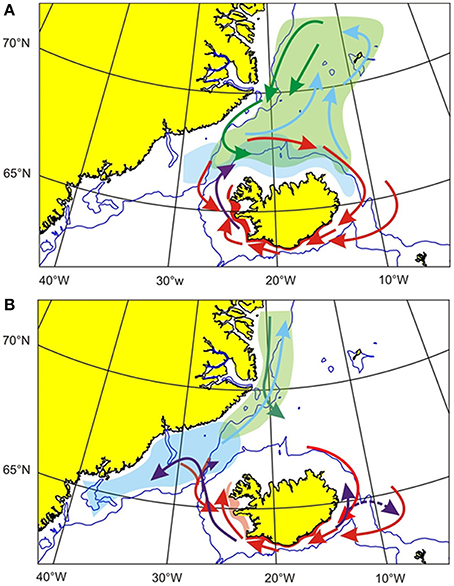
Figure 14. (A) Main patterns in distribution and migration of capelin until the turn of the last century. Light blue, Nursery area; Green, Feeding grounds of adult capelin. Blue arrows indicate feeding migrations and green arrows autumn return migrations toward Iceland waters. Red, Spawning migrations and areas; Violet arrows, 0-group drift (Modified after Vilhjalmsson, 2007). (B) A hypothesis for changed patterns of distribution and migration of capelin in recent years. Blue: Nursery area. Green: Feeding grounds of adult capelin, Spring and summer feeding migrations are indicated by blue arrows, but autumn return migrations by green arrows. Red: Spawning migrations (arrows) and main spawning areas. Violet arrows: 0-group drift. (After Pálsson et al., 2012b).
Euphausiids
Figure 15 shows total abundance of euphausiids in South Icelandic waters (area A6 in Silva et al., 2014) during 1958–2007 as recorded by the CPR. A significant decreasing trend was observed in this period (simple linear regression r2 = 0.25, p < 0.001).
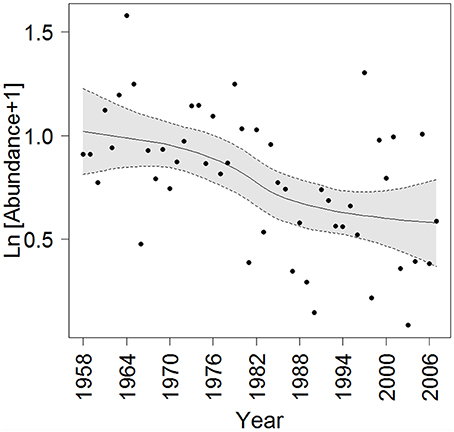
Figure 15. Total euphausiid abundance (Ind m−3) in area A6 from 1958 to 2007 as recorded by the Continuous Plankton recorder (CPR). Abundance values indicate annual averages and a loess curve (span = 0.71) with 95% confidence intervals (shaded gray area) is fitted to the data. Refer to Figure 1 in Silva et al. (2014) for location of CPR area.
Discussion
During the past two decades, pronounced changes have occurred in the marine environment around Iceland. Following 1995, an increase in temperature and salinity was observed in the waters south and west of Iceland (Figure 2), which prevailed for almost two decades and has been reflected in the biota (see below). Generally, salinity and temperature have also been higher in the waters north of Iceland since the late 1990s (Figure 3). These changes have been linked with the changed distribution and recruitment of capelin north of Iceland (Pálsson et al., 2012a,b, 2014). Concurrent with increasing temperatures and salinity and a northward shift of fronts following increased flow of Atlantic water to the areas north of Iceland, marked changes have occurred in the distribution of several fish species, including a northward shift in haddock and monkfish (Astthorsson et al., 2007; Solmundsson et al., 2010; Valdimarsson et al., 2012). At the same time an expansion in mackerel distribution westwards and northwards into Icelandic waters took place (Astthorsson et al., 2012). Due to the large size of the stock, this “mackerel invasion” into Icelandic waters represents a substantial change in the ecosystem of the Icelandic continental shelf. In addition, 0-group fish of the cold-water species capelin retreated northwards on the Icelandic shelf while the mature component has progressively spread along the shelf break off East Greenland (Vilhjalmsson, 2007; Pálsson et al., 2012a). The sand eel population off southern and western Iceland has been in decline and was drastically reduced around 2005 because of recruitment failure (Bogason and Lilliendahl, 2009). The oceanographic and ecological changes are both likely to have contributed to the changes observed in distribution and abundance of several cetacean populations.
Common Minke Whales
Densities of common minke whales in the Icelandic continental shelf area decreased markedly between 2001 and 2007 and the estimated abundance in 2009 was less than a quarter of that in 2001 (Figure 5). The shipboard component of the 2007 survey failed to detect a corresponding increase in abundance of minke whales in the offshore regions of the CNA stock area, although large areas north of Iceland and along the coast of East Greenland received no or poor coverage due to unfavorable weather and ice conditions (Pike et al., 2010a). Therefore, the details of a potential shift in distribution are unknown.
Investigations of stomach contents of minke whales have shown pronounced changes in diet composition in recent decades. During 1977–1997, sand eel was the predominant prey in southern and western Iceland while capelin occurred in 42% and euphausiids in 58% of the stomachs in the northern areas (Sigurjónsson et al., 2000). During 2003–2007 a significant change had occurred in the minke whales' diet composition with the contribution of euphausiids and capelin decreasing from 45 to 17% and 36 to 22%, respectively in comparable areas (Víkingsson et al., 2014). The proportions of large gadoids [mainly haddock and cod (Gadus morhua)] and herring increased coincidently between these two periods. The overall percentage of sand eel in minke whale stomachs was still high in the latter period, but decreased appreciably within the period from 90% in 2003 to 20% in 2007 in the southern areas (Víkingsson et al., 2014).
These dietary changes coincide well with the documented changes in the local abundance of the prey species sand eel, capelin and euphausiids (Astthorsson et al., 2007; Marine Research Institute, 2014). The massive decrease in sand eel abundance during 1997–2003 indicated by the analyses of haddock stomachs is supported by decreased breeding success of sand eel-dependent seabirds in southern Iceland (Lilliendahl et al., 2013; Vigfusdottir et al., 2013). The subsequent low levels of sand eels in minke whale stomachs are in agreement with data from a sand eel monitoring program initiated in 2006 (Bogason and Lilliendahl, 2009). The decreased proportion of capelin in the minke whale diet is also consistent with lower availability of capelin in north Icelandic waters during summer (Figure 14) and the increased contribution of haddock and herring reflects growth in these stocks (Marine Research Institute, 2014). These diet studies, together with the series of abundance estimates, suggest that minke whales appear to have responded to the environmental changes both by changes in diet and by leaving the Icelandic continental shelf area. While it seems likely that some of the whales followed the capelin to the coast of East Greenland, this cannot be verified because of the lack of coverage of that area by the 2007 survey.
Fin Whales
The habitat use modeling indicated that fin whale summer feeding areas are characterized by water depth, distance to the 2000 m isobath, SST and SSH (Table 2, Figure 9). Inter-annual variations in the predicted distribution of fin whales showed that increased use of the Irminger Sea in 2001 and 2007 (Figures 10D,E) coincided with an increase in SSH in the area. Sea-level changes are often related to ocean heat-content changes, as water expands with increasing temperatures (Church et al., 2013). The observed changes in SST and SSH over the years have previously been reported to have ecosystem consequences (Ottersen et al., 2001; Häkkinen and Rhines, 2004; Hátún et al., 2009).
While recovery following the pause in whaling in 1990 could be part of the explanation of the increase of fin whale abundance in Icelandic waters, the catch history of the 20th Century and stock assessments suggest that the stock had recovered to a large extent before the period being considered here (Víkingsson et al., 2009). The increase in fin whale abundance in the Irminger Sea between 1989 and 2001 coincided with a marked increase in sea temperature in the area (Figures 4, 10). In particular, the expansion of fin whale distribution into deeper waters (>1000 m) of the Irminger Sea seems to be related to appreciable warming of this area between 1994 and 2003 (Figure 4) as noted by Víkingsson and Valdimarsson (2006). Assuming that the diet of fin whales in this area consists overwhelmingly (> 90%) of euphausiids, mainly Meganyctiphanes norvegica (Víkingsson, 1997), it is tempting to conclude that the increased temperatures have facilitated growth in euphausiid abundance and thereby increased carrying capacity for fin whales (Víkingsson et al., 2009). However, there has been a decrease in euphausiids in shelf and oceanic habitats southwest, south and southeast of Iceland from 1958 to 2007 with the lowest numbers in each region in 2007 (Figure 14), despite increasing primary production in terms of phytoplankton in those areas (Silva et al., 2014).
Results from the habitat modeling presented here support a link between environmental conditions and fin whale abundance. However, environmental data generally act as proxies of other variables, to which the whales respond directly (Pershing et al., 2009). Prey availability often forms the missing link between oceanographic variables and higher-trophic level predators (Croll et al., 2005; Friedlaender et al., 2006; Anderwald et al., 2012). The key to understanding this link is to understand how fin whales respond to changes in prey availability, as well as how prey itself is affected by changing environmental conditions. For instance, the predicted highest abundance of fin whales around the 2000 m isobaths and virtual absence from shallow coastal waters is in accordance with the preference of the fin whale's main prey M. norvegica for deeper waters. The observed decrease in M. norvegica after 1995 could be an indication of a change in fin whale diet in recent years, similar to the diet shift in minke whales (Víkingsson et al., 2014). Such a shift would explain a less concentrated distribution along the shelf edge and higher observed and predicted numbers of fin whales throughout the Irminger Sea. Increased predation from the growing fin whale population might also have contributed to the decrease in euphausiid abundance.
Unfortunately, euphausiid monitoring by the extensive long-term Continuous Plankton Recorder (CPR, SAHFOS) series only reaches as far north as the waters south and southwest of Iceland and recent Icelandic research has mostly been confined to continental shelf waters where different euphausiid species prevail (Astthorsson and Gislason, 1997). Therefore, these studies are not necessarily representative of the main fin whale feeding grounds west of Iceland. It is noteworthy that while the CPR data show a decrease in adult euphausiid abundance during 1960–2007 (Figure 14), there was an increase in the density of euphausiid larvae during 1990–2010 in southwestern Icelandic waters (Silva et al., 2014). While this apparent discrepancy might possibly be explained by the different time frames of these two data series or by a weakened temporal synchrony between the development of young euphausiids and the phytoplankton bloom it would also be consistent with increased predation pressure on adult euphausiids, e.g., by mackerel and fin whales. The warming of the deep waters of the Irminger Sea might also have facilitated growth of other potential prey for fin whales. Updated studies on diet composition of fin whales might clarify this.
Overall, the habitat modeling results suggest that the weakening of the Subpolar Gyre, with associated changes in SST and salinity, had bottom-up effects on primary and secondary production. The poor spatial and temporal overlap between the CPR data and NASS cetacean data precluded the inclusion of krill abundance as a covariate. The explanatory power of the GAM might have been improved if data on prey biomass or primary production had been available because baleen whale distribution has been reported to be tightly coupled with zooplankton density (Friedlaender et al., 2006). However, the dynamic nature of krill requires close spatio-temporal proximity in whale sightings and measurements of krill to detect this trophic link; temporal lags as a result of independently collected prey and cetacean data can weaken the association (Laidre et al., 2010). Further work is therefore required to clarify possible changes in prey availability and diet composition of fin whales.
The fin whale catch distribution in 2014 was highly unusual with an unprecedented pattern relative to the history of the whaling operation dating back to 1948. Historically, sei whales have been caught in considerable numbers in this area, and these catches would certainly have included fin whales had they been encountered. Therefore, the unusual catch distribution in 2014 seems to indicate a sudden shift in distribution of fin whales between 2013 and 2014. According to the whalers, the traditional western area looked lifeless with no visible krill patches at the sea surface and unusually few seabirds. A notable exception to this was the widespread presence in the area of large schools of mackerel that were clearly visible at the surface. These observations from the whalers have been confirmed by a 2014 ecosystem survey that recorded high abundance of mackerel in the Irminger Sea (Nøttestad et al., 2014).
Humpback Whales
Catch statistics from the first period of modern whaling in Icelandic waters, the so-called Norwegian whaling period 1883–1915, indicate that humpback whales were hunted down to very low levels. Only six humpback whales were caught after whaling was resumed in 1948 until they received total protection again in 1955. Sigurjónsson and Gunnlaugsson (1990) reported an annual increase in relative abundance of 14.8% during 1979–1988 west of Iceland. This growth rate, coupled with the small absolute abundance estimate of around 2000 humpback whales in 1987 (Gunnlaugsson and Sigurjónsson, 1990) indicates that the number of animals in the area must still have been very small prior to 1970. Pike et al. (2009b) reported annual rates of increase in abundance of 12% for the period 1987–2001.
The most recent data presented here suggest that this rapid growth may have leveled off around the turn of the century (after the 1995 survey). Feeding habits of humpback whales in Icelandic waters are not well corroborated by stomach contents data. However, visual observations have indicated that capelin and euphausiids likely constitute important parts of the diet (MRI unpublished information). In particular numerous reports from capelin fishermen and capelin research cruises have documented substantial numbers of humpback whales following the migration of capelin in Icelandic waters during winter (Gunnlaugsson and Víkingsson, 2014). In recent years, humpback whale songs associated with mating behavior have been recorded in North Icelandic waters (Magnúsdóttir et al., 2014). Although this acoustic activity does not demonstrate that breeding actually takes place in Icelandic waters, an establishment of a new breeding area, in addition to the two known southern breeding areas, could help explain the large population increase in Icelandic waters and the apparent contradiction between abundance estimates at feeding and breeding grounds of the North Atlantic, as discussed by Smith and Pike (2009).
The increase in humpback whale abundance in Icelandic waters, leveling off around the year 2000, follows a pattern similar to the rise in temperature (Figure 2). However, it is hard to relate this growth to any known biological changes in the marine environment because the presumed most important prey species (capelin, euphausiids, and possibly sand eel) have not followed the same trends in abundance. In recent decades, high rates of increase have also been documented for humpback whales in several other areas without a clear explanation (Bannister, 1994; Stevick et al., 2003; Findlay et al., 2011; Heide-Jørgensen et al., 2012).
Blue Whales
Blue whale populations have not recovered to the same extent as the closely related fin whales or humpback whales, with estimated abundance in the CNA of around 1000 animals (Pike et al., 2009c). However, a significant increase in abundance has been reported for the period 1969–2001 (Sigurjónsson and Gunnlaugsson, 1990; Pike et al., 2009c). During 1987–2001 the increase rate was higher in Northeastern Icelandic waters than west of Iceland (Pike et al., 2009c) indicating a northward shift in relative distribution. Such a shift is consistent with anecdotal evidence from whale watching operations in Icelandic waters. A whale watching company specializing on blue whales was operated from the Snæfellsnes peninsula, West Iceland during 1996–2004. From around 2000, the number of encounters with blue whales decreased appreciably leading the company to give up their blue whale tours in 2004 due to scarcity of blue whales (Pétur Ágústsson, pers. comm). During this period of decline in West Iceland, blue whale sightings increased in the whale watching area Skjálfandi Bay in Northeast Iceland. Photo-identification matches have shown that at least some of the whales previously frequenting West Icelandic waters now occur in Northeastern Icelandic waters during midsummer (MRI, unpublished data).
Conclusions
Pronounced oceanographic changes have occurred in Icelandic waters since the mid-1990s, including a rise in sea water temperature and increased flow of warm Atlantic water into the waters north of Iceland. Although the exact mechanisms remain unclear, these changes appear to have caused a northward shift in the distribution of several fish species, a decrease in krill abundance and a collapse in the sand eel population off southern and western Iceland. Considerable changes in distribution and abundance of several cetacean species are apparent from the series of cetacean surveys dating back to 1986. Some of these changes appear to be related to these oceanographic and biological changes while others are harder to explain. Thus, the decrease in common minke whale abundance in the Icelandic continental shelf area seems to be related to the decrease in the abundance of the preferred prey species, sand eel in the southern part and capelin in the northern part. The apparent shift of blue whales from southwestern to northeastern Icelandic waters may be related to the decrease in euphausiid abundance in the waters south and southwest of Iceland.
Concurrently with increasing sea temperature in the deep waters of the Irminger Sea, the distribution of fin whales expanded into this area and the total abundance of fin whales in the Irminger Sea increased. However, the relationship between the rise in temperature and fin whale abundance is unclear. A potential increase in euphausiids, the fin whale's dominant prey species in this area, is not supported by CPR data and could instead indicate that fin whales have switched prey. However, data from the main fin whale feeding grounds are lacking because the CPR data series covers only the southernmost part of that area.
Humpback whales were rare in Icelandic waters throughout most of the 20th century but a significant increase occurred between 1970 and 2001 in the CNA. From 1995, abundance has been rather stable at around 10–15,000 whales. Feeding ecology of humpback whales in Icelandic waters is poorly documented but capelin and euphausiids are known to be among their prey species. It is hard to relate the increased abundance of humpback whales since the 1970s to any known biological changes in the marine environment.
Continued monitoring of the distribution and abundance of cetaceans as well as further studies into their feeding ecology are essential for better understanding of the recent and ongoing changes documented here.
Conflict of Interest Statement
The authors declare that the research was conducted in the absence of any commercial or financial relationships that could be construed as a potential conflict of interest.
Acknowledgments
The authors thank Ásta Guðmundsdóttir, Ólafur K. Pálsson, Ástþór Gíslason, Sverrir D. Halldórsson, and Valerie Chosson at the MRI for fruitful discussions and for help in preparing the data and providing figures. Thanks are also extended to Priscilla Licandro and SAHFOS for providing CPR data for total euphausiids. Funding for Teresa Silva was provided by the EURO-BASIN: European Union Basin-scale Analysis, Synthesis and Integration (FP7 Contract No. 264933).
Supplementary Material
The Supplementary Material for this article can be found online at: http://www.frontiersin.org/journal/10.3389/fevo.2015.00006/abstract
Supplementary Figure 1. Semi-variogram of model residuals from the final GAM plotted against distance between observations in km. Spatial independence shows itself as a horizontal band of points (Zuur et al., 2009)
References
Anderwald, P., Evans, P., Dyer, R., Dale, A., Wright, P., and Hoelzel, A. (2012). Spatial scale and environmental determinants in minke whale habitat use and foraging. Mar. Ecol. Prog. Ser. 450, 259–274. doi: 10.3354/meps09573
Astthorsson, O. S., and Gislason, A. (1997). Biology of euphausiids in the subarctic waters north of Iceland. Mar. Biol. 129, 319–330. doi: 10.1007/s002270050172
Astthorsson, O. S., Gislason, A., and Jonsson, S. (2007). Climate variability and the Icelandic marine ecosystem. Deep Sea Res. Part II Top. Stud. Oceanogr. 54, 2456–2477. doi: 10.1016/j.dsr2.2007.07.030
Astthorsson, O. S., Valdimarsson, H., Gudmundsdottir, A., and Óskarsson, G. J. (2012). Climate-related variations in the occurrence and distribution of mackerel (Scomber scombrus) in Icelandic waters. ICES J. Mar. Sci. J. Cons. 69, 1289–1297. doi: 10.1093/icesjms/fss084
Bannister, J. L. (1994). Continued increase in Group IV humpbacks off Western Australia. Rep. Int. Whal. Comm. 44, 309–310.
Barry, S., and Welsh, A. (2002). Generalized additive modelling and zero inflated count data. Ecol. Modell. 157, 179–188. doi: 10.1016/S0304-3800(02)00194-1
Batten, S., Clark, R., Flinkman, J., Hays, G., John, E., John, A., et al. (2003). CPR sampling: the technical background, materials and methods, consistency and comparability. Prog. Oceanogr. 58, 193–215. doi: 10.1016/j.pocean.2003.08.004
Bersch, M. (2002). North Atlantic Oscillation–induced changes of the upper layer circulation in the northern North Atlantic Ocean. J. Geophys. Res. 107, 3156. doi: 10.1029/2001JC000901
Bogason, V., and Lilliendahl, K. (2009). Rannsóknir á sandsíli. Hafrannsóknir 145, 36–41. Available online at: http://www.hafro.is/Bokasafn/Timarit/fjolrit-145.pdf
Borchers, D. L., Pike, D. G., Gunnlaugsson, T., and Víkingsson, G. A. (2009). Minke whale abundance estimation from the NASS 1987 and 2001 aerial cue–counting surveys taking appropriate account of distance estimation errors. NAMMCO Sci. Publ. 7, 95–110. doi: 10.7557/3.2708
Church, J., White, N., Domingues, C., Monselesan, D., and Miles, E. (2013). Sea-level and ocean heat-content change. Int. Geophys. Ocean Circ. Clim. 103, 697–725. doi: 10.1016/B978-0-12-391851-2.00027-1
Clapham, P. J. (2009). “Humpback whale, Megaptera novaeangliae,” in Encyclopedia of Marine Mammals, 2nd Edn., eds W. F. Perrin, B. Würsig, and J. G. M. Thewissen (Amsterdam; Boston; Heidelberg; London; New York; Oxford; Paris; San Diego; San Fransisco; Singapore; Sydney; Tokyo: Academic Press; Elsevier), 582–585.
Croll, D., Marinovic, B., Benson, S., Chavez, F., Black, N., Ternullo, R., et al. (2005). From wind to whales: trophic links in a coastal upwelling system. Mar. Ecol. Prog. Ser. 289, 117–130. doi: 10.3354/meps289117
Donovan, G. P., and Gunnlaugsson, T. (1989). North Atlantic Sightings Survey 1987: preliminary report of the aerial survey off Iceland. Rep. Int. Whal. Commn. 39, 437–441.
Findlay, K., Best, P., and Meÿer, M. (2011). Migrations of humpback whales past Cape Vidal, South Africa, and an estimate of the population increase rate (1988–2002). Afr. J. Mar. Sci. 33, 375–392. doi: 10.2989/1814232X.2011.637345
Friedlaender, A., Halpin, P., Qian, S., Lawson, G., Wiebe, P., Thiele, D., et al. (2006). Whale distribution in relation to prey abundance and oceanographic processes in shelf waters of the Western Antarctic Peninsula. Mar. Ecol. Prog. Ser. 317, 297–310. doi: 10.3354/meps317297
Gunnlaugsson, T., and Sigurjónsson, J. (1990). NASS-87: estimation of whale abundance based on observations made onboard Icelandic and Faroese survey vessels. Rep. Int. Whal. Commn. 40, 571–580.
Gunnlaugsson, T., Sigurjonsson, J., and Donovan, G. P. (1988). Aerial survey of cetaceans in the coastal waters off Iceland, June-July 1986. Rep. Int. Whal. Commn. 38, 489–500.
Gunnlaugsson, T., and Víkingsson, G. A. (2014). Winter Occurrence of Whales in Waters Around Iceland. IWC SC/65b/RMP06. Available online at: https://iwc.int/index.php?cID=sc-documents&page=1
Häkkinen, S., and Rhines, P. B. (2004). Decline of subpolar North Atlantic circulation during the 1990s. Science 304, 555–559. doi: 10.1126/science.1094917
Pubmed Abstract | Pubmed Full Text | CrossRef Full Text | Google Scholar
Hastie, T., and Tibshirani, R. (1990). Generalized Additive Models. Boca Raton, FL: Chapman Hall; CRC, 43.
Hátún, H., Hansen, B., Sandø, A. B., Drange, H., and Valdimarsson, H. (2005). De−stabilization of the North Atlantic thermohaline circulation by a gyre mode. Science 309, 1841–1844. doi: 10.1126/science.1114777
Hátún, H., Payne, M. R., Beaugrand, G., Reid, P. C., Sandø, A., Drange, H., et al. (2009). Large bio-geographical shifts in the north-eastern Atlantic Ocean: from the subpolar gyre, via plankton, to blue whiting and pilot whales. Prog. Oceanogr. 80, 149–162. doi: 10.1016/j.pocean.2009.03.001
Heide-Jørgensen, M., Laidre, K., Hansen, R., Burt, M., Simon, M., Borchers, D., et al. (2012). Rate of increase and current abundance of humpback whales in West Greenland. J. Cetacean Res. Manag. 12, 1–14.
Hiby, A. R., and Hammond, P. S. (1989). Survey techniques for estimating abundance of cetaceans. Rep. Int. Whal. Commn. 11, 47–80.
Laidre, K., Heide-Jørgensen, M., Heagerty, P., Cossio, A., Bergström, B., and Simon, M. (2010). Spatial associations between large baleen whales and their prey in West Greenland. Mar. Ecol. Prog. Ser. 402, 269–284. doi: 10.3354/meps08423
Lilliendahl, K., Hansen, E. S., Bogason, V., Sigursteinsson, M., Magnúsdóttir, M. L., Jónsson, P. M., et al. (2013). Viðkomubrestur lunda og sandsílis við Vestmannaeyjar (Recruitment failure of puffin and sand eel in Vestmannaeyjar). Náttúrufræðingurinn 83, 65–79.
Lilliendahl, K., and Solmundsson, J. (2006). Feeding ecology of sympatric European shags Phalacrocorax aristotelis and great cormorants, P. carbo in Iceland. Mar. Biol. 149, 979–990. doi: 10.1007/s00227-006-0259-7
Lockyer, C., and Pike, D. G. (eds.). (2009). North Atlantic Sightings Surveys 1987–2001. Counting Whales in the North Atlantic. Tromsø: NAMMCO Sci. Publ. 7. North Atlantic Marine Mammal Commission.
Magnúsdóttir, E. E., Rasmussen, M. H., Lammers, M. O., and Svavarsson, J. (2014). Humpback whale songs during winter in subarctic waters. Polar Biol. 37, 427–433. doi: 10.1007/s00300-014-1448-3
Malmberg, S.-A., and Valdimarsson, H. (2003). Hydrographic conditions in Icelandic waters, 1990–1999. ICES Mar. Sci. Symp. 219, 50–60.
Marine Research Institute. (2014). Ástand nytjastofna á Íslandsmiðum 2013/2014 Aflahorfur fiskveiðiárið 2014/2015 (State of Marine Stocks in Icelandic Waters 2013/2014—Prospects for the Quota Year 2014/2015). Reykjavík: Marine Research Institute.
Meyssignac, B., Becker, M., Llovel, W., and Cazenave, A. (2012). An assessment of two-dimensional past sea level reconstructions over 1950–2009 based on tide-gauge data and different input sea level grids. Surv. Geophys. 33, 945–972. doi: 10.1007/s10712-011-9171-x
Miller, D. L., Burt, M. L., Rexstad, E. A., and Thomas, L. (2013). Spatial models for distance sampling data: recent developments and future directions. Methods Ecol. Evol. 4, 1001–1010. doi: 10.1111/2041-210X.12105
Mortensen, J., and Valdimarsson, H. (1999). “Thermohaline changes in the irminger sea,” in International Council for the Exploration of the Sea, CM Doc. 1999/L16, 11 (Copenhagen).
NAMMCO. (2009). “Report of NAMMCO Scientific Committee on Abundance Estimates,” in NAMMCO Annual Report 2007–2008 (Tromsø: North Atlantic Marine Mammal Commission).
Nøttestad, L., Salthaug, A., Johansen, G. O., Anthonypillai, V., Tangen, Ø., Utne, K., et al. (2014). Cruise Report from the Coordinated Ecosystem Survey (IESSNS) with M/V “Brennholm,” M/V ”Vendla,” M/V “Finnur Fríði” and R/V “Árni Friðriksson” in the Norwegian Sea and surrounding waters. ICES. Available online at: http://www.hafro.is/images/frettir/2014/IESSNS_2014_Cruise_Report_Ecosystem_Survey_July-August.pdf
Ottersen, G., Planque, B., Belgrano, A., Post, E., Reid, P., and Stenseth, N. (2001). Ecological effects of the North Atlantic Oscillation. Oecologia 128, 1–14. doi: 10.1007/s004420100655
Pálsson, Ó. K., Gislason, A., Guðfinnsson, H. G., Gunnarsson, B., Ólafsdóttir, S. R., Petursdottir, H., et al. (2012a). Ecosystem structure in the Iceland Sea and recent changes to the capelin (Mallotus villosus) population. ICES J. Mar. Sci. J. Cons. 69, 1242–1254. doi: 10.1093/icesjms/fss071
Pálsson, Ó. K., Gíslason, Á., Gunnarsson, B., Guðfinnsson, H. G., Valdimarsson, H., Pétursdóttir, H., et al. (2014). Meginþættir í vistkerfi Íslandshafs og breytingar á lífsháttum loðnu. Náttúrufræðingurinn 85, 4–18.
Pálsson, Ó. K., Sveinbjörnsson, S., Valdimarsson, H., Gíslason, Á., and Vilhjálmsson, H. (2012b). Lífshættir loðnu í Íslandshafi. Hafrannsóknir 164, 119–132. Available online at: http://www.hafro.is/Bokasafn/Timarit/fjolrit-164.pdf
Pershing, A., Record, N., Monger, B., Mayo, C., Brown, M., Cole, T., et al. (2009). Model-based estimates of right whale habitat use in the Gulf of Maine. Mar. Ecol. Prog. Ser. 378, 245–257. doi: 10.3354/meps07829
Pike, D. G. (2009). North Atlantic Sightings Surveys. Introduction. NAMMCO Sci. Publ. 7, 7–18. doi: 10.7557/3.2702
Pike, D. G., Gunnlaugsson, T., Elvarsson, B., and Víkingsson, G. A. (2011a). Correcting Perception Bias for Icelandic Aerial Surveys, 2007 and 2009. NAMMCO SC18AESP08, 12. Available online at: https://iwc.int/index.php?cID=sc-documents&page=1
Pike, D. G., Gunnlaugsson, T., and Víkingsson, G. A. (2010b). Icelandic Aerial Survey 2009: Survey Report and a Preliminary Abundance Estimate for Minke Whales. NAMMCO SC/17/AS/07, 29. Available online at: https://iwc.int/index.php?cID=sc-documents&page=1
Pike, D. G., Gunnlaugsson, T., and Víkingsson, G. A. (2011b). Icelandic Aerial Survey 2009: Survey Report and a Preliminary Abundance Estimate for Minke Whales. IWC SC/60/PFI12, 29. Available online at: https://iwc.int/index.php?cID=sc-documents&page=1
Pike, D. G., Gunnlaugsson, T., Víkingsson, G. A., Desportes, G., and Bloch, D. (2009a). Estimates of the abundance of minke whales (Balaenoptera acutorostrata) from Faroese and Icelandic NASS shipboard surveys. NAMMCO Sci. Publ. 7, 81–93. doi: 10.7557/3.2707
Pike, D. G., Gunnlaugsson, T., Víkingsson, G. A., Desportes, G., and Mikkelsen, B. (2010c). Estimates of the Abundance of Humpback Whales (Megaptera novaean-gliae) from the T-NASS Icelandic and Faroese Ship Surveys Conducted In 2007. IWC, SC/62/O13, 15. Available online at: https://iwc.int/index.php?cID=scdocuments&page=1
Pike, D. G., Gunnlaugsson, T., Víkingsson, G. A., and Mikkelsen, B. (2008). Estimates of the Abundance of Fin Whales (Balaenoptera physalus) from the T-NASS Icelandic and Faroese Ship Surveys Conducted in 2007. IWCSC/60/PFI13-revised. Available online at: https://iwc.int/index.php?cID=sc-documents&page=1
Pike, D. G., Gunnlaugsson, T., Víkingsson, G. A., and Mikkelsen, B. (2010a). Estimates of the Abundance of Minke Whales (Balaenoptera acutorostrata) from the T-NASS Icelandic and Faroese Ship Surveys Conducted in 2007. IWC SC62RMP5. Available online at: https://iwc.int/index.php?cID=scdocuments&page=1
Pike, D. G., Paxton, C. G. M., Gunnlaugsson, T., and Víkingsson, G. A. (2009b). Trends in the distribution and abundance of cetaceans from aerial surveys in Icelandic coastal waters, 1986-2001. NAMMCO Sci. Publ. 7, 117–142. doi: 10.7557/3.2710
Pike, D. G., Víkingsson, G. A., Gunnlaugsson, T., and Øien, N. (2009c). A note on the distribution and abundance of blue whales (Balaenoptera musculus) in the Central and Northeast North Atlantic. NAMMCO Sci. Publ. 7, 19–29. doi: 10.7557/3.2703
R Core Team. (2013). R: A Language and Environment for Statistical Computing. Vienna: R Foundation for Statistical Computing. Available online at: http://www.R-project.org/
Sears, R., and Perrin, W. (2009). “Blue whale, Balaenoptera musculus,” in Encyclopedia of Marine Mammals, 2nd Edn., eds W. F. Perrin, B. Würsig, and J. G. M. Thewissen (Amsterdam; Boston; Heidelberg; London; New York; Oxford; Paris; San Diego; San Fransisco; Singapore; Sydney; Tokyo: Academic Press; Elsevier), 120–124.
Sigurjónsson, J. (1988). Operational factors of the Icelandic large whale fishery. Rep. Int. Whal. Comm. 38, 327–333.
Sigurjónsson, J. (1992). “Recent studies on abundance and trends in whale stocks in Icelandic and adjacent waters,” in Royal Academy of Overseas Sciences, ed J. J. Symoens (Brussels: Royal Academy of Overseas Sciences), 77–111.
Sigurjónsson, J., Galan, A., and Vikingsson, G. A. (2000). A note on stomach contents of minke whales (Balaenoptera acutorostrata) in Icelandic waters. NAMMCO Sci. Publ. 2, 82–90. doi: 10.7557/3.2973
Sigurjónsson, J., and Gunnlaugsson, T. (1990). Recent trends in abundance of blue (Balaenoptera musculus) and humpback whales (Megaptera novaeangliae) off west and southwest Iceland, with a note on occurrence of other cetacean species. Rep. Int. Whal. Commn 40, 537–551.
Sigurjónsson, J., Gunnlaugsson, T., Ensor, P., Newcomer, M., and Víkingsson, G. (1991). North Atlantic sightings survey 1989 (NASS 89). Shipboard surveys in Icelandic and adjacent waters July-August 1989. Rep. Int. Whal. Commn. 41, 559–572.
Sigurjónsson, J., Gunnlaugsson, T. H., and Payne, M. (1989). Nass 87. Shipboard sightings surveys in Icelandic and adjacent waters June-July 1987. Rep. Int. Whal. Commn. 39, 395–409.
Sigurjónsson, J., and Víkingsson, G. A. (1997). Seasonal abundance of and estimated food consumption by cetaceans in Icelandic and adjacent waters. J. Northwest Atl. Fish. Sci. 22, 271–287. doi: 10.2960/J.v22.a20
Silva, T., Gislason, A., Licandro, P., Marteinsdóttir, G., Ferreira, A. S. A., Gudmundsson, K., et al. (2014). Long-term changes of euphausiids in shelf and oceanic habitats southwest, south and southeast of Iceland. J. Plankton Res. 36, 1262–1278. doi: 10.1093/plankt/fbu050
Smith, T. D., and Pike, D. G. (2009). The enigmatic whale: the North Atlantic humpback. NAMMCO Sci. Publ. 7, 161–178. doi: 10.7557/3.2712
Solmundsson, J., Jonsson, E., and Bjornsson, H. (2010). Phase transition in recruitment and distribution of monkfish (Lophius piscatorius) in Icelandic waters. Mar. Biol. 157, 295–305. doi: 10.1007/s00227-009-1317-8
Stevick, P. T., Allen, J., Clapham, P. J., and Lien, J. (2003). North Atlantic humpback whale abundance and rate of increase four decades after protection from whaling. Mar. Ecol. Prog. Ser. 258, 263–273. doi: 10.3354/meps258263
Thomas, L., Buckland, S. T., Rexstad, E. A., Laake, J. L., Strindberg, S., Hedley, S. L., et al. (2010). Distance software: design and analysis of distance sampling surveys for estimating population size. J. Appl. Ecol. 47, 5–14. doi: 10.1111/j.1365-2664.2009.01737.x
Pubmed Abstract | Pubmed Full Text | CrossRef Full Text | Google Scholar
Valdimarsson, H., Astthorsson, O. S., and Palsson, J. (2012). Hydrographic variability in Icelandic waters during recent decades and related changes in distribution of some fish species. ICES J. Mar. Sci. J. Cons. 69, 816–825. doi: 10.1093/icesjms/fss027
Ver Hoef, J., and Boveng, P. (2007). Quasi-Poisson vs. negative binomial regression: how should we model overdispersed count data? Ecology 88, 2766–2772. doi: 10.1890/07-0043.1
Pubmed Abstract | Pubmed Full Text | CrossRef Full Text | Google Scholar
Vigfusdottir, F., Gunnarsson, T. G., and Gill, J. A. (2013). Annual and between-colony variation in productivity of Arctic Terns in West Iceland. Bird Study 60, 289–297. doi: 10.1080/00063657.2013.811214
Víkingsson, G. A. (1997). Feeding of fin whales (Balaenoptera physalus) off Iceland—diurnal and seasonal variation and possible rates. J. Northw. Atl. Fish. Sci. 22, 77–89. doi: 10.2960/J.v22.a7
Víkingsson, G. A., Elvarsson, B. T., Ólafsdottir, D., Sigurjonsson, J., Chosson, V., and Galan, A. (2014). Recent changes in the diet composition of common minke whales (Balaenoptera acutorostrata) in Icelandic waters. A consequence of climate change? Mar. Biol. Res. 10, 138–152. doi: 10.1080/17451000.2013.793812
Víkingsson, G. A., Ólafsdóttir, D., and Sigurjónsson, J. (2003). Geographical and seasonal variation in the diet of harbour porpoises (Phocoena phocoena) in Icelandic coastal water. NAMMCO Sci. Publ. 5, 243–270. doi: 10.7557/3.2829
Víkingsson, G. A., Pike, D. G., Desportes, G., Öien, N., Gunnlaugsson, T., and Bloch, D. (2009). Distribution and abundance of fin whales (Balaenoptera physalus) in the Northeast and Central Atlantic as inferred from the North Atlantic Sightings Surveys 1987–2001. NAMMCO Sci. Publ. 7, 49–72. doi: 10.7557/3.2705
Víkingsson, G. A., and Valdimarsson, H. (2006). Hvalir og umhverfisþættir (Whales and the environment). Hafrannsoknir. Fjölrit 125, 30–33.
Vilhjalmsson, H. (2007). Impact of changes in natural conditions on ocean resources. Law Sci. Ocean Manage. 11, 225. doi: 10.1163/ej.9789004162556.i-0.59
Warton, D. I. (2005). Many zeros does not mean zero inflation: comparing the goodness-of-fit of parametric models to multivariate abundance data. Environmetrics 16, 275–289. doi: 10.1002/env.702
Williams, R., Vikingsson, G. A., Gislason, A., Lockyer, C., New, L., Thomas, L., et al. (2013). Evidence for density-dependent changes in body condition and pregnancy rate of North Atlantic fin whales over four decades of varying environmental conditions. ICES J. Mar. Sci. 70, 1273–1280. doi: 10.1093/icesjms/fst059
Wood, S. N. (2006). Generalized Additive Models: An Introduction With R. Boca Raton, FL: Chapman & Hall.
Keywords: climate change, fin whale, common minke whale, whale abundance, feeding ecology, humpback whale, oceanic warming, habitat modeling
Citation: Víkingsson GA, Pike DG, Valdimarsson H, Schleimer A, Gunnlaugsson T, Silva T, Elvarsson BÞ, Mikkelsen B, Øien N, Desportes G, Bogason V and Hammond PS (2015) Distribution, abundance, and feeding ecology of baleen whales in Icelandic waters: have recent environmental changes had an effect? Front. Ecol. Evol. 3:6. doi: 10.3389/fevo.2015.00006
Received: 01 November 2014; Accepted: 13 January 2015;
Published online: 17 February 2015.
Edited by:
Tore Haug, Institute of Marine Research, NorwayReviewed by:
Ulf Lindstrøm, Institute of Marine Research, NorwayJ. Lawson, Department of Fisheries and Oceans, Canada
Copyright © 2015 Víkingsson, Pike, Valdimarsson, Schleimer, Gunnlaugsson, Silva, Elvarsson, Mikkelsen, Øien, Desportes, Bogason and Hammond. This is an open-access article distributed under the terms of the Creative Commons Attribution License (CC BY). The use, distribution or reproduction in other forums is permitted, provided the original author(s) or licensor are credited and that the original publication in this journal is cited, in accordance with accepted academic practice. No use, distribution or reproduction is permitted which does not comply with these terms.
*Correspondence: Gísli A. Víkingsson, Whale Research Unit, Marine Resources Section, Marine Research Institute, Skúlagata 4, PO. Box 1390, 121 Reykjavík, Iceland e-mail: gisli@hafro.is