Fine-scale foraging ecology of leatherback turtles
 Bryan P. Wallace
 Michael Zolkewitz3
  Michael C. James
- 1Stratus Consulting, Boulder, CO, USA
- 2Nicholas School of the Environment, Duke University Marine Laboratory, Beaufort, NC, USA
- 3Ecological Research Solutions, New Hope, PA, USA
- 4Population Ecology Division, Fisheries and Oceans Canada, Dartmouth, NS, Canada
Remote tracking of migratory species and statistical modeling of behaviors have enabled identification of areas that are of high ecological value to these widely distributed taxa. However, direct observations at fine spatio-temporal scales are often needed to correctly interpret behaviors. In this study, we combined GPS-derived locations and archival dive records (1 s sampling rate) with animal-borne video footage from foraging leatherback turtles (Dermochelys coriacea) off Nova Scotia, Canada (Northwest Atlantic Ocean) to generate the most highly-detailed description of natural leatherback behavior presented to date. Turtles traveled shorter distances at slower rates and increased diving rates in areas of high prey abundance, which resulted in higher prey capture rates. Increased foraging effort (e.g., dive rate, dive duration, prey handling time, number of bites) was not associated with increased time at the surface breathing to replenish oxygen stores. Instead, leatherbacks generally performed short, shallow dives in the photic zone to or above the thermocline, where they disproportionately captured prey at bottoms of dives and during ascents. This foraging strategy supports visual prey detection, allows leatherbacks to exploit physically structured prey at relatively shallow depths (typically <30 m), and increases time turtles spend in warmer water temperatures, thus optimizing net energy acquisition. Our results demonstrate that leatherbacks appear to be continuously foraging during daylight hours while in continental shelf waters off Nova Scotia, and that leatherback foraging behavior is driven by prey availability, not by whether or not a turtle is in a resource patch characterized by a particular size or particular prey density. Our study demonstrates the fundamental importance of obtaining field-based, direct observations of true behaviors at fine spatial and temporal scales to enhance our efforts to both study and manage migratory species.
Introduction
A major challenge to understanding the ecology and population dynamics of animal species is characterizing their fine-scale habitat use in spatio-temporally discrete areas that provide necessary resources for vital life history functions. This is particularly true for migratory species that travel through diverse habitats and environmental conditions to exploit areas that provide predictable resources (e.g., food, mates, conditions suitable for reproduction) critical for meeting life history demands, and, by extension, supporting healthy population dynamics. Because protecting enormous areas that encompass entire geographic distributions is generally not a feasible conservation goal, definition of critical habitats where migratory species can reliably acquire resources is a top priority for management (Block et al., 2011).
In recent years, broad-scale migration and habitat use patterns of many migratory species have been described through advances in biotelemetry (Hart and Hyrenbach, 2009), biochemical markers (Hobson, 2008), statistical analyses of tracking data to discern behavioral states and identify high-use habitats (Jonsen et al., 2003; Patterson et al., 2008), and other research techniques. Ideally, results and conclusions from models that distinguish areas based on inferred differences in animal behavior would be “ground-truthed” by complementary direct, field-based observations of behaviors in these areas, thus ensuring accurate definition of behavioral states to inform broad-scale inferences (Seminoff et al., 2006; Robinson et al., 2007; Hebblewhite and Haydon, 2010). Although logistical challenges sometimes preclude obtaining direct observations on free-ranging animals, researchers have successfully employed various data recording instruments such as satellite transmitters, accelerometers, animal-borne video cameras, and time-depth recorders, to collect and classify field-based behavioral data for a wide variety of species including marine turtles (e.g., Reina et al., 2005; Seminoff et al., 2006), penguins (Ponganis et al., 2000), marine mammals (Williams et al., 2004), sharks (Heithaus et al., 2002), and others (see Moll et al., 2007 for review).
Understanding the site-scale mechanisms that underlie inferred habitat use observed at seascape- or landscape-scales can elucidate the true relationships between migratory species and the environments through which they move and from which they acquire necessary resources. Once in habitats with high resource availability, migratory animals must optimize resource acquisition relative to expenditure, which is particularly important given the great distances and temporal durations between such habitats. Foraging patterns exhibited by migratory species can be interpreted in the context of optimal foraging theory (Charnov, 1976), particularly when prey resources are patchily distributed and/or ephemeral in nature. For example, variation in foraging movements should be scale-dependent based on spatial distribution of prey resources and other environmental factors, i.e., predators should increase travel distances and rates when in low-density resource patches, or when traveling to or between patches, but travel less within high-density patches (Fauchald, 1999; Thompson and Fedak, 2001). Several marine migratory species exhibit patch foraging behavior that varies according to different spatio-temporal scales, and that includes alternate behaviors and movements depending on resource distribution and competing life history demands (e.g., marine predators (Sims et al., 2008), including seabirds (Fritz et al., 2003; Weimerskirch, 2007), pinnipeds (Thompson and Fedak, 2001), cetaceans (Bailey et al., 2009), and marine turtles (Jonsen et al., 2007; Shillinger et al., 2008; Fossette et al., 2010a,b; Bailey et al., 2012a,b; Dodge et al., 2014). Careful, detailed analyses of fine-scale behaviors in putatively important habitats are critical to characterizing important ecological and physiological drivers of population dynamics and life history traits of migratory species (Moll et al., 2007).
Leatherback turtles (Dermochelys coriacea) are among the most widely distributed of any extant animal species, with breeding and nesting areas throughout the tropics, and foraging areas extending to temperate and boreal waters at high latitudes (Eckert et al., 2012). Leatherbacks routinely migrate thousands of kilometers between nesting beaches and foraging areas, an energetically demanding feat that is fueled exclusively by a highly-specialized diet of gelatinous zooplankton (i.e., jellyfish). In recent years, broad-scale migrations of leatherbacks have been characterized in the Atlantic (e.g., James et al., 2005a,b; Hays et al., 2006; Fossette et al., 2010a,b; Dodge et al., 2014), Pacific (e.g., Shillinger et al., 2008; Bailey et al., 2012a), and Indian Oceans (Lambardi et al., 2008), and regional variation in resource availability driven by environmental conditions has been linked to intraspecific differences in leatherback body sizes, reproductive output, and population status (Wallace and Saba, 2009). Fine-scale analyses of leatherback foraging ecology are lacking in general, but are important not only for illustrating relationships between prey availability and foraging behaviors, but also for understanding the importance of discrete habitats for resource acquisition to leatherback bioenergetics and population dynamics.
In the Northwest Atlantic (NWA), long-term monitoring of marine turtles using directed captures and satellite tracking has documented relatively high numbers of leatherbacks in Canadian waters off Nova Scotia, including the southern Gulf of St. Lawrence, during July-October each year (James et al., 2005a,b, 2006, 2007). Leatherbacks feed almost exclusively on large scyphozoan jellyfish (Cyanea capillata) while in Canadian waters (James and Herman, 2001; Heaslip et al., 2012), and apparently time their residency in Canadian foraging habitat to coincide with conditions that favor high abundance of prey (Sherrill-Mix et al., 2007). Furthermore, tag returns, genetic analyses, and satellite telemetry have revealed that these annual cohorts of foraging leatherbacks comprise breeding and non-breeding adults as well as subadults representing all distinct breeding stocks throughout the Wider Caribbean (James et al., 2005a, 2007; Stewart et al., 2013). Another multi-year study has revealed similar patterns among leatherbacks foraging off the coast of New England, USA (Dodge et al., 2014). Therefore, Canadian (and New England, USA) continental shelf waters appear to provide critical habitat for a large segment of the NWA leatherback subpopulation because they offer predictable resource availability to support energetic requirements of reproduction, growth, and migration.
Despite the wealth of information that has been collected about leatherback behavior in Canadian waters in the past decade, including local and long-distance movements (e.g., James et al., 2005a,b; Jonsen et al., 2007; Sherrill-Mix et al., 2007), interactions between prey availability and leatherback diving and feeding behaviors at fine scales have not been definitively revealed. Such analyses are rare for marine migratory species in general (e.g., Seminoff et al., 2006; Moll et al., 2007). Leatherback dives are shorter and shallower while foraging off Nova Scotia than during migration or while in lower latitudes, and feeding is restricted to daylight hours (James et al., 2005a; Casey et al., 2014; Hamelin et al., 2014). Hamelin et al. (2014) used high-resolution dive data from three leatherbacks to show that turtles foraging in Atlantic Canada remain at or above the main thermocline, suggesting that prey resource distribution is associated with water mass. In addition, Heaslip et al. (2012) used turtle-borne video to estimate rates of prey biomass ingestion and energy intake for leatherbacks foraging off Nova Scotia.
In this study, we characterized the fine-scale foraging ecology of leatherback turtles off Nova Scotia using simultaneous collection of GPS locations, time-temperature and depth recorder data, and video. We updated (with new deployments) and re-analyzed the dataset used by Heaslip et al. (2012), and used it to test specific hypotheses about the interactions between leatherback diving and feeding activities and prey availability and density, and consequences for tradeoffs between increased foraging effort and increased prey capture (see Methods: Hypotheses). Our results provide the most highly-detailed description of leatherback foraging behavior to date, and demonstrate the importance of quantifying fine-scale foraging behavior of a marine migratory species for better understanding of habitat selection and resource acquisition.
Methods
Field Site and Instrument Deployments
The field portion of this study was conducted in the temperate shelf waters off Neil's Harbor, Cape Breton Island, Nova Scotia, Canada (Figure 1) during August and September (2008–2011, 2013). We used a custom-built turtle-borne integrated data logger capable of recording video footage as well as high-resolution dive data (Serrano-V tag, Xeos Technologies Inc., Bedford, NS, Canada). Serrano-V is a charged-coupled device color, video camera system (235 × 83 mm, 270 mm with antennae, 1013 g) that operates under low light, without the need for accessory lighting, and records 320 × 240 QVGA. The instrument contains an integrated time-depth and temperature recorder (1 s sampling interval), GPS Receiver, suction cap attachment, remote release, and a 900 MHz spread spectrum two-way radio transceiver to command the unit. We also attached a miniature time-temperature and depth recorder (LAT1400, Lotek Wireless Inc., St. John's, NL, Canada) to Serrano-V's housing, yielding a second, independent record of dive behavior (also at 1 s sampling interval). Battery and storage media limitations of Serrano-V prescribed a maximum 4-h deployment duration, with the instrument set to automatically release after this time; however, the maximum deployment duration was not reached because the tag required activation when potential study subjects were first sighted (vs. when tag was placed on the carapace). During some deployments, we commanded premature release of the tag because of deteriorating sea state. In other instances, the recording session ended after the tag slid off the carapace.
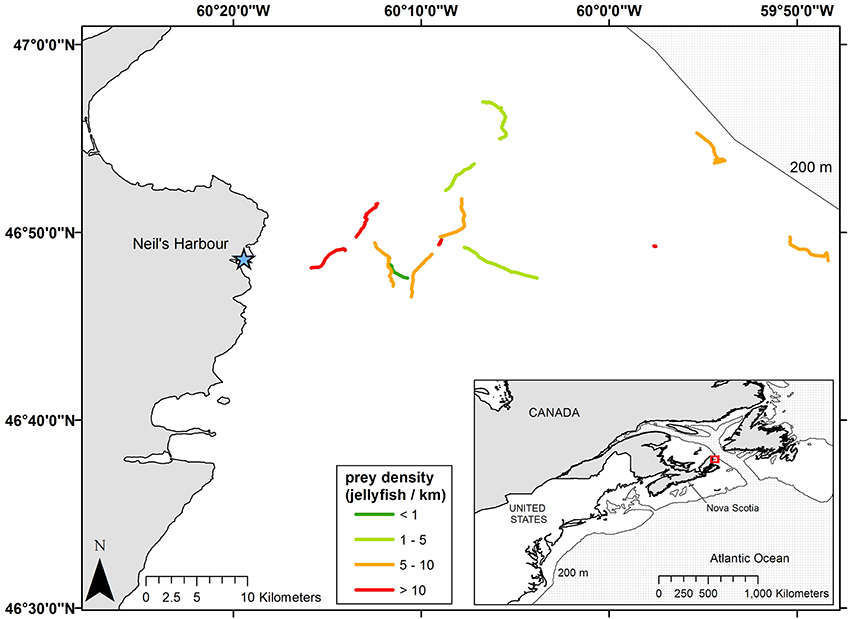
Figure 1. Tracklines of leatherback turtles (Dermochelys coriacea) foraging in the Northwest Atlantic Ocean off Neil's Harbor, Nova Scotia, Canada, during 2008–2013 (n = 12). Tracks are coded to show variation in prey density (number of jellyfish sighted km−1 traveled); there were no among-year differences in prey densities. Prey sightings were documented by turtle-borne video camera/time-depth and temperature recorders, and distances that turtles traveled were calculated using GPS coordinates of turtles' surfacing intervals recorded by the tags. The light gray line in both inset and main maps represents the 200 m isobath. Data are unprojected.
We deployed instruments on 24 free-swimming, foraging leatherbacks across 5 years (2008, n = 7; 2009, n = 4; 2010, n = 7; 2011, n = 4; 2013, n = 2), and recording periods were limited to daylight hours. The paired video and dive data provided a rare, nearly “turtle's-eye” view of prey captures, handling, diving, and surfacing, facilitating a highly-detailed analysis of foraging behavior. Importantly, we eliminated potential handling effects by deploying tags without capture, resulting in uninterrupted foraging, which was confirmed by video and dive profile data. Three turtles were excluded from analyses (deployments: 14 August 2008, 16 August 2008, 25 August 2013, all unknown gender) because their deployments lasted less than 30 min (6–27 min), which was insufficient to adequately quantify diving and feeding behavioral data. Data from these turtles do not appear in results.
When possible, following remote release of the camera system from the carapace, turtles were captured at or near the sea surface using a breakaway hoop-net, and curved carapace length (CCL) and width (CCW) were collected when sea state permitted. Because mature leatherbacks exhibit sexual dimorphism in tail length (Eckert et al., 2012), we used this trait to assign sex to leatherbacks. To reduce the potential of erroneous assignment of sex to turtles of smaller size classes, we conservatively assigned sex to turtles of ≥145 cm CCL only, and classified any turtle with CCL<145 cm as immature (following James et al., 2007; Stewart et al., 2013), as this reflects the minimum size at maturity for most leatherbacks in the NWA (Stewart et al., 2007). We recognize that this threshold likely omits inclusion of some mature females (we confirmed that some turtles <145 cm CCL were adult females through subsequent reports of nesting, tag returns, or satellite telemetry data; Stewart et al., 2013), but it also increases our confidence in visual assignments of sex to turtles encountered away from nesting beaches.
Data Analyses: Search Effort and Prey Density
Reliable depth data was recorded for 13 turtles, but one was excluded because of an insufficient tracking duration (Table 2). We plotted tracklines for the remaining 12 leatherbacks—four males, four females, and four turtles of undetermined gender—using GPS locations recorded by the Serrano tags during surface interval. From these data, we estimated total linear displacement (i.e., total distance traveled, including both horizontal and vertical components) and horizontal linear displacements (i.e., distance traveled while at the surface, as well as the distance traveled while diving between each surface interval) for each turtle during the recording period (Figure 1). In addition, we estimated vertical displacements for each turtle during descents to, and ascents from, maximum depths for each dive, and summed these values across all dives for each turtle. Summing these two measurements provided total displacement (km), and dividing total displacement by total deployment duration provided total displacement rate (km h−1).
We considered these displacement trajectories to be non-random transect lines on which turtles were actively searching for prey. These trajectories could therefore be used as measures of search effort to which we could combine prey encounter data (e.g., prey density) and capture data (e.g., number of prey captured per unit search effort) (see next section for details). This approach allowed us to compare relative foraging success across turtles, sexes, reproductive status, and years, and to define behavior patterns and search effort related to increased foraging success.
Data Analyses: Feeding and Diving Behaviors
We quantified feeding and diving behaviors by analyzing turtle-borne video with the event scoring software JWatcher 2.0 (Blumstein and Daniel, 2007). This application allows investigator-defined coding parameters to identify and enumerate discrete behavioral events as well as behavioral states. Specifically, we manually scored video data in JWatcher to quantify the following metrics: deployment time, total dive time, total surface time, breaths per surface interval, breaths per dive time, number of prey encountered, number of prey captures, number of bites (total and per prey capture), prey handling time (i.e., time between first and last bite for each prey item), and handling time relative to total dive time and total duration of deployment (Figure 2; Supplemental Material: http://dx.doi.org/10.6084/m9.figshare.1305089). We analyzed video footage for all turtles reported in Heaslip et al. (2012), as well as five additional deployments, using a new, unique coding scheme, criteria for identifying behavioral events and states, and data analyses specific to our research questions (see below for hypotheses).
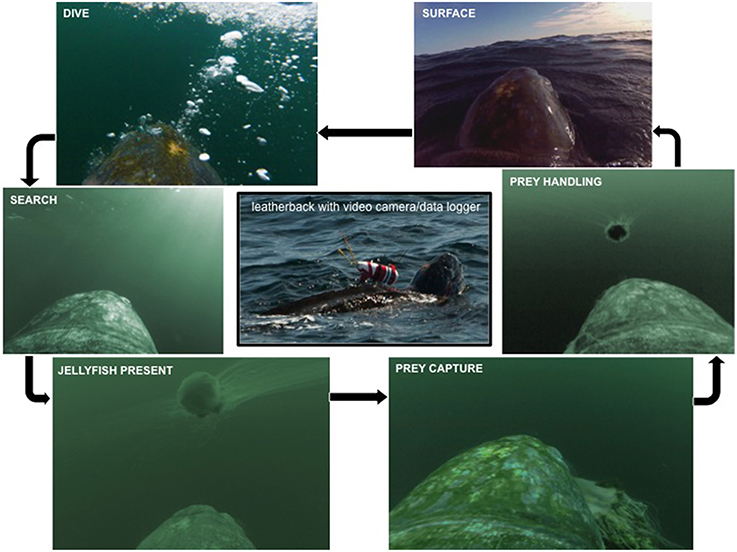
Figure 2. Schematic of a typical dive cycle with prey capture using images from turtle-borne video footage. Starting in the upper right and moving counter-clockwise; surface: turtle at the surface breathing and resting between dives; dive: bubbles denote turtle plunging below surface to begin a dive; search: turtle swimming, looking for prey; jellyfish present: prey item in field-of-view; prey capture: turtle successfully captures prey; prey handling: turtle repeatedly bites prey to ingest.
Observed behavioral events and states that were truncated at the beginning (prior to instrument deployment) or end (due to tag release from an animal) of a video recording session were excluded from calculations of average and total durations (i.e., natural events and states; Blumstein and Daniel, 2007). However, because prey encounter data were used in our prey density and displacement analysis, we included all jellyfish encountered, regardless if an event was truncated or not. Because the camera provided a 90° field-of-view, we were unable to count all jellyfish that were potentially visible to leatherbacks. Therefore, our estimates of prey encounters, and resulting estimates of prey densities, are almost certainly underestimates.
Concurrent to video data, we also recorded dive data at 1 s intervals using the camera system's integrated time-depth and temperature (Tw) recorder (TDR). TDR data coupled with GPS-based location during surfacing, allowed us to calculate basic dive parameters, including dive and surface durations, average and maximum dive depths, and Tws experienced (average, minimum, and maximum water temperatures). We calculated surface time from each turtle's first breath after a dive episode through to its last breath before resubmerging. We scored dives only if the turtle was submerged greater than 1 m below the surface.
For each turtle, we synchronized data collected from the TDR and events scored through video analysis to construct ethograms that described leatherback foraging behavior over time (Figure 3; Supplemental Material: http://dx.doi.org/10.6084/m9.figshare.1305089). These ethograms allowed us to visualize the temporal, sequential nature of various diving, surfacing, and feeding behaviors and how they related to deployment time, water temperatures, and depths experienced by turtles. Because behavioral events and states were collected independently from the TDR data, we merged data files using the elapsed deployment time for each dataset. To accurately sync the files, we used depth readings from the TDR and surfacing/diving episodes scored from video to identify and calculate interval dive and surface times for each data set. Using these interval times, we compared and aligned data sets accordingly.
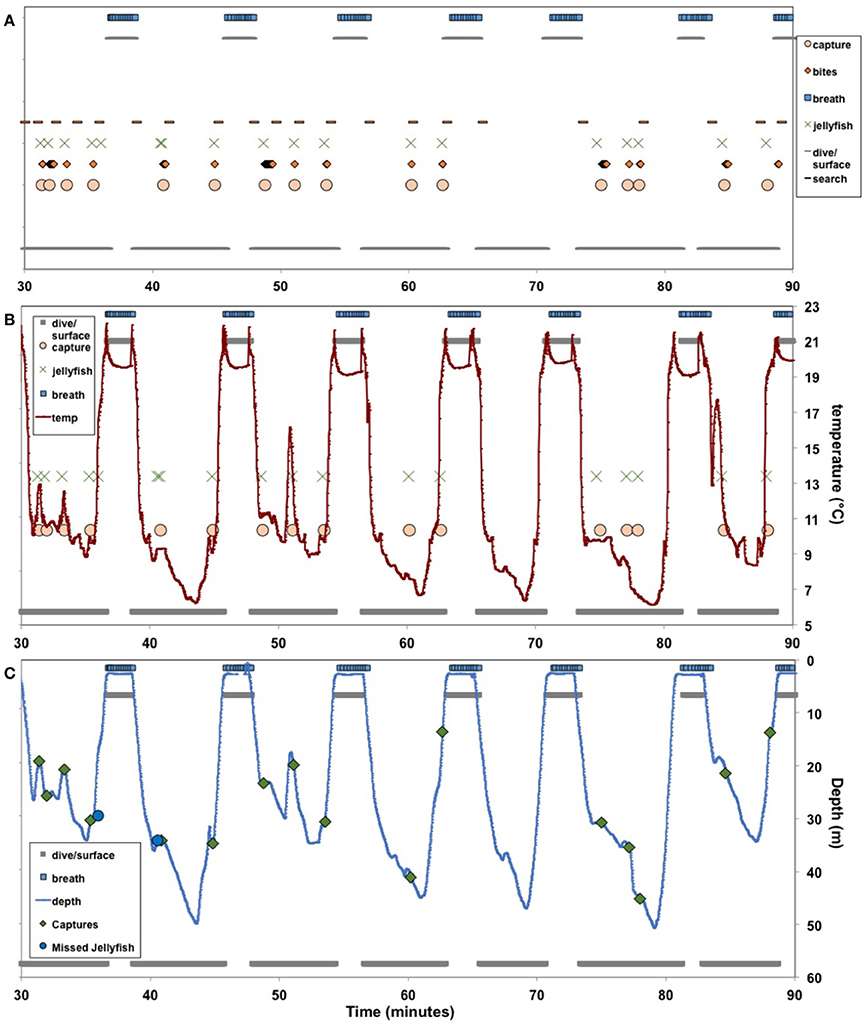
Figure 3. Ethograms of leatherback turtles (Dermochelys coriacea) foraging in the Northwest Atlantic Ocean off Nova Scotia, Canada. Behaviors were documented from video footage obtained using turtle-borne video camera/time-depth recorders, coded using specialized computer software (Blumstein and Daniel, 2007), and durations and frequencies of different behaviors were quantified. Search, feeding, and breathing behaviors were plotted against time to visualize behavioral sequences for individual turtles (A), particularly prey captures in relation to water temperatures (B) as well as water depth and dive profile—i.e., whether captures occurred during ascent, descent, bottom of a dive, or at the surface (C). See Supplemental Material (http://dx.doi.org/10.6084/m9.figshare.1305089) for animated ethogram and corresponding video segment.
Hypotheses
Overall, our goal was to describe patterns in foraging behavior in the context of optimization of diving and search effort relative to prey density, capture success, and capture efficiency. Using the combination of dive data (e.g., dive and surface durations, diving rates, depths) and search effort (e.g., displacements) from the GPS-equipped TDRs and feeding data (e.g., prey captures, prey handling, bites, breaths) from the video, we were able to test the following hypotheses that characterize patterns of search and feeding effort as a function of the variation in prey availability and density.
First, because leatherback prey is non-uniformly distributed in unpredictable patches (Houghton et al., 2006; Lilley et al., 2011), leatherbacks should increase diving effort in areas of high prey availability and density to take advantage of available resources, and increase travel rates in areas of lower prey availability and density. Specifically, we hypothesized that as prey encountered (i.e., number of prey sighted during a recording period) and prey density (i.e., number of prey km−1 traveled by a turtle during a recording period) increase, dive durations and rates, as well as capture efficiency (i.e., number of prey captures per unit search effort) should increase, while total displacement and displacement rates should decrease.
Second, although increased feeding activity has a direct benefit to turtles through energy acquisition, turtles that spend more time handling prey while submerged might incur energetic costs that drive tradeoffs for air-breathing divers between food resources underwater and oxygen above the surface (Hochscheid, 2014). Therefore, we predicted that turtles that exhibited higher diving (e.g., durations, depths, diving rates) and feeding effort (e.g., handling time, number of bites per capture and per minute handling) should spend more time at the surface (e.g., extended surface durations, increased number of breaths at the surface) to replenish on-board oxygen stores that are depleted during apneic diving (Costa et al., 2001; Wallace et al., 2005).
Third, leatherbacks capture prey at depth, apparently where prey is physically structured at or near the thermocline (Hamelin et al., 2014), indicating that many captures might occur at or near the bottoms of dives. However, leatherbacks are also frequently observed handling prey at the surface (James and Herman, 2001; Heaslip et al., 2012), suggesting that leatherbacks also capture prey on ascent, possibly targeting the prey silhouetted against the water surface backed by lighter sky. For these reasons, we hypothesized that prey captures would mainly occur at bottoms and ascents of dives.
Results
Summary Dive Data
Deployments of the camera system lasted 123 min on average (± 57.1 min, range: 41–213 min). Overall, turtles spent 61.5% of recording periods below the surface diving, and the remaining 38.5% at the surface. Likewise, average dive durations (~4.5 min) were roughly 1.5 times longer than average surface intervals (~3 min). Average and maximum dive depths were 36.3 ± 9.7 m and 51.1 ± 13.0 m, respectively, and mean Tw experienced by turtles was 17.2 ± 1.6°C (overall range: ~5–~25°C). On average, turtles took <3 breaths min−1 dive time, just over 5 breaths min−1 surface time, and 14 breaths per surface interval. All dive and surface summary data are shown in Table 1.
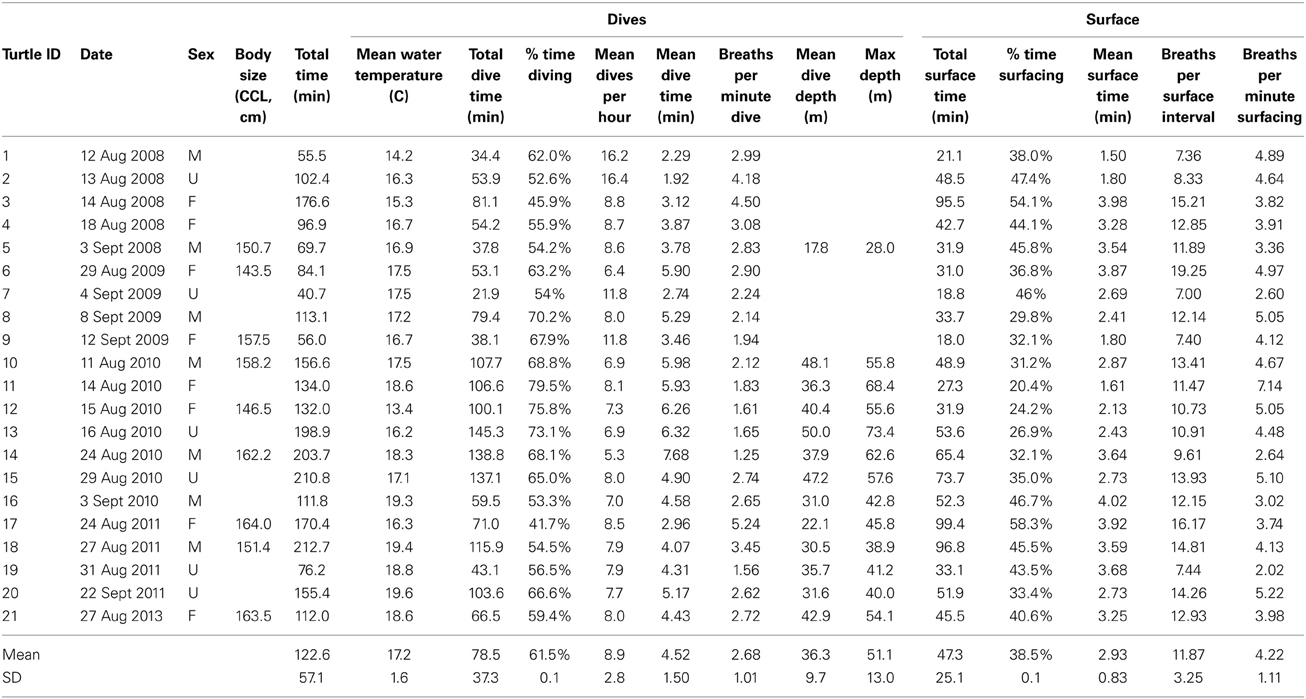
Table 1. Dive and surface behavior data for foraging leatherback turtles (Dermochelys coriacea) off Nova Scotia, Canada.
Search Effort, Prey Density, Capture Success and Efficiency
Overall, tracks of 12 foraging leatherbacks ranged from 1.03 to 7.64 km in total displacement, and displacement rates ranged from 0.71 km h−1 to 3.28 km h−1 (Figure 1, Table 2). Although the vertical component of the overall displacement rates (i.e., overall distance traveled by turtles while submerged, estimated based on maximum depths reached during dives) ranged from 0.35 to 2.67 km, neither vertical displacement nor vertical displacement rate was significantly related to total displacement or displacement rates (p > 0.05) (Table 2). In contrast, horizontal displacement (i.e., the summed linear distance between each pair of consecutive surfacing events along a trackline) explained nearly all the variance in total linear displacement (km) [F(11) = 97.7; r2 = 0.91, p < 0.0001]; a similar relationship existed between horizontal displacement rates and overall displacement rates [F(11) = 184.0; r2 = 0.95; p < 0.0001].
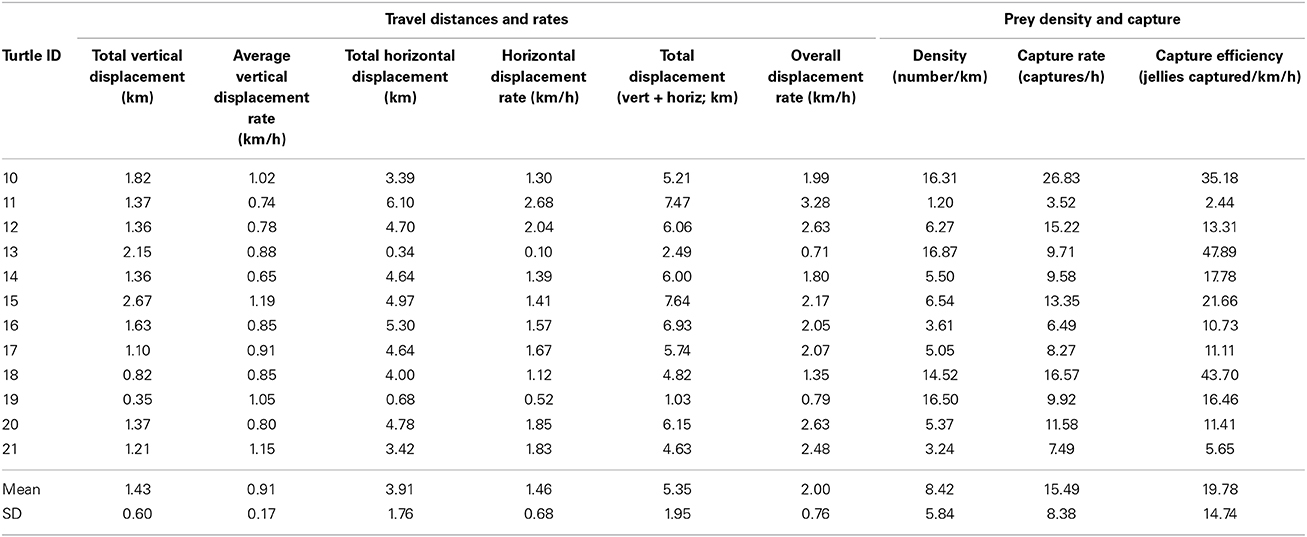
Table 2. Vertical, horizontal, and total displacements and displacement rates (i.e., travel distances and rates), as well as prey density and capture rates for foraging leatherback turtles (Dermochelys coriacea) off Nova Scotia, Canada.
Number of prey encountered during recorded periods ranged from 4 to 85, while number of prey captures ranged from 4 to 70 (Table 3). Prey densities—i.e., number of jellyfish encountered km−1 displacement—ranged from just over 1 jellyfish km−1 to nearly 17 jellyfish km−1, and did not vary significantly among years, sex, or maturity status (all p > 0.05) (Figure 1, Table 2). On average, leatherbacks captured more than 15 jellyfish h−1 (range: 3.5–26.8). Capture efficiency—i.e., prey captures per unit search effort (km h−1)—ranged from fewer than 3 to nearly 50 jellyfish captured per km h−1 of search effort (Table 2).
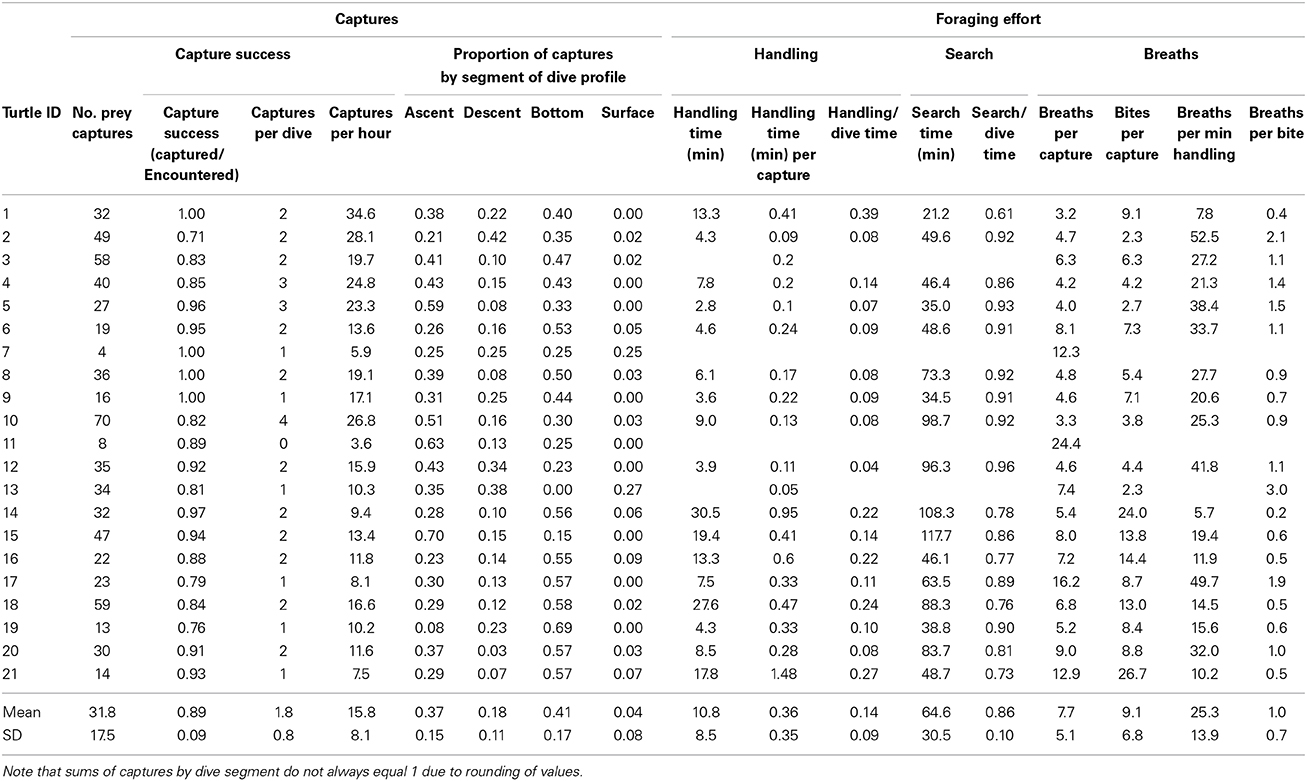
Table 3. Prey capture and foraging effort data for foraging leatherback turtles (Dermochelys coriacea) off Nova Scotia, Canada.
Horizontal displacement rates [F(11) = 20.8; r2 = 0.70, p < 0.001] (Figure 4A) and total displacement rates [F(11) = 23.7; r2 = 0.74, p < 0.001] were inversely related to prey density (number of jellyfish encountered km−1) (Figure 4B). Likewise, capture success (prey captured/prey encountered) decreased with prey density (r2 = 0.52, p < 0.01) (Figure 4C), but capture efficiency—i.e., the number of captures relative to search effort (km h−1)—increased significantly (r2 = 0.73, p < 0.001) (Figure 4D). Furthermore, horizontal [F(11) = 10.1; r2 = 0.50, p = 0.01] and total [F(11) = 12.5; r2 = 0.56, p = 0.005] displacement rates decreased with increasing capture efficiency (Figure 5).
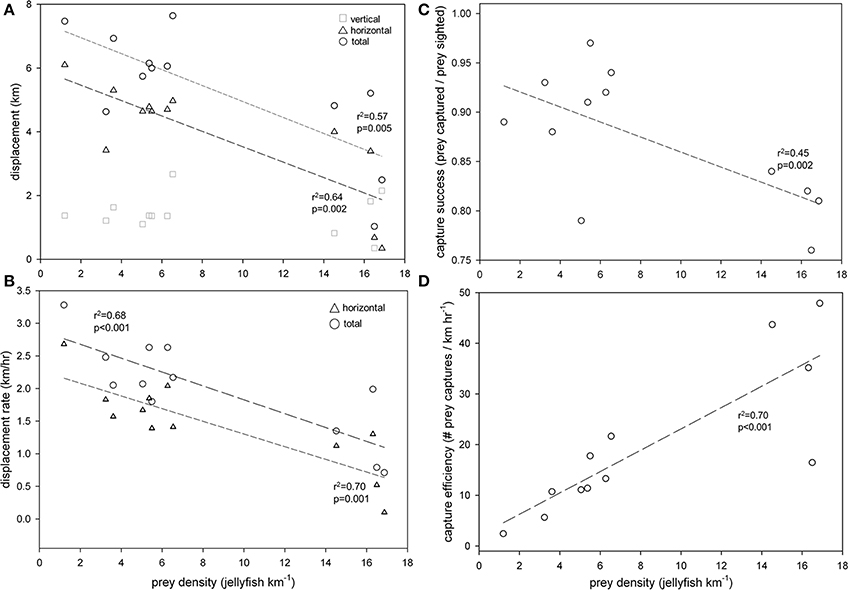
Figure 4. Prey density (number of jellyfish sighted km−1) was inversely related to (A) displacement (km) and (B) displacement rates (km h−1) of leatherback turtles (Dermochelys coriacea) foraging in the Northwest Atlantic Ocean off Nova Scotia, Canada. Total displacement (and rate) included both horizontal (straight-line distance between GPS locations at the surface) and vertical (round-trip distance from the surface to maximum depth on all dives) components. Capture success (prey captured/prey encountered) (C) declined, but capture efficiency [prey captured/search effort (km h−1)] (D) increased with prey density.
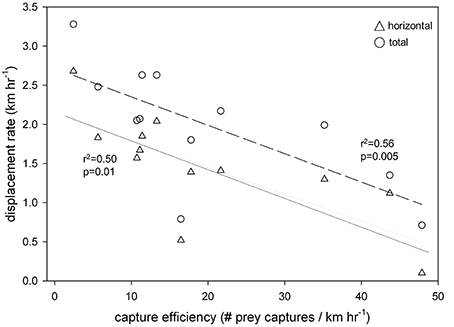
Figure 5. Displacement rate (km h−1) of leatherback turtles (Dermochelys coriacea) was inversely related to efficiency of prey capture [number of jellyfish captured per unit search effort (km h−1)] in the Northwest Atlantic Ocean off Nova Scotia, Canada.
Inter-annual variation in prey abundance could influence leatherback foraging patterns, but we found no significant variation in prey abundance nor foraging behaviors among years (p > 0.05); however, unequal and small samples likely prevented our ability to detect significant differences.
Feeding and Diving Behaviors
All turtles captured prey items during a recording period (Table 3). Dive rates (h−1) provided an indicator of dive effort that related to several relevant variables in assessing overall foraging activity among leatherbacks. For example, mean dive durations [F(20) = 33.7; r2 = 0.64; p < 0.0001], mean surface durations [F(20) = 9.6; r2 = 0.34; p = 0.006], and mean breaths per surface interval [F(20) = 8.2; r2 = 0.30 p = 0.01] were all inversely related to mean dive rate (Figure 6). Mean dive durations also increased with mean dive depths among turtles [F(12) = 6.9; r2 = 0.38; p = 0.02]. There were no significant relationships between mean dive duration, rate, or depth and displacement or displacement rates (all p > 0.05).
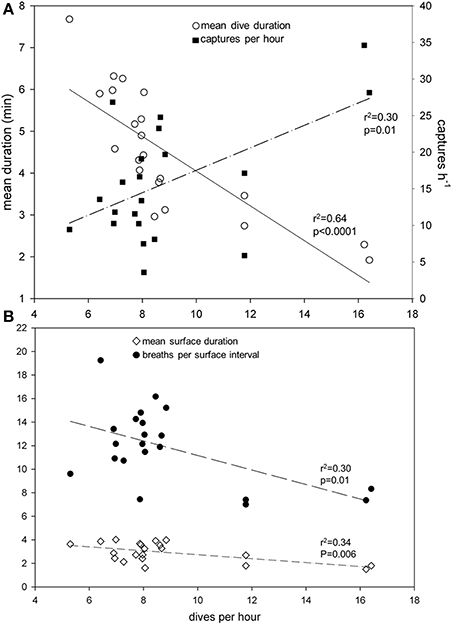
Figure 6. Prey capture rate (number of jellyfish captured h−1) increased and mean dive duration (min) decreased with increased dive rate (dives h−1) (A) of leatherback turtles (Dermochelys coriacea) foraging in the Northwest Atlantic Ocean off Nova Scotia, Canada. Dive rate was also inversely related to mean surface duration (min) and breaths per surface interval (B).
Prey capture rate increased significantly with increased dive rate [F(20) = 8.1; r2 = 0.30 p = 0.01] (Figure 6A). Moreover, both number of captures h−1 [F(20) = 5.4; r2 = 0.22; p = 0.03] and number of captures dive−1 [F(20) = 12.7; r2 = 0.40; p = 0.002] increased significantly with number of prey encountered (Figure 7).
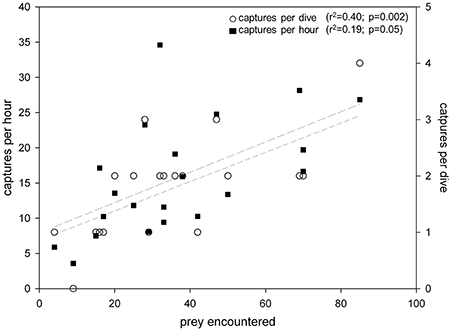
Figure 7. Prey captures per dive and capture rates (number of prey captured h−1) increased significantly with number of prey encountered by leatherback turtles (Dermochelys coriacea) foraging in the Northwest Atlantic Ocean off Nova Scotia, Canada.
As the proportion of handling time relative to total dive time increased, bites per capture [F(17) = 5.5; r2 = 0.26; p = 0.03] and handling time per capture [F(17) = 6.5; r2 = 0.29; p = 0.02] increased significantly, while breaths per minute of prey handling decreased [F(17) = 18.5; r2 = 0.54; p < 0.001] (Figure 8). Furthermore, handling time per capture increased significantly [F(19) = 235.2; r2 = 0.93; p < 0.0001], while breaths per bite decreased non-linearly [F(19) = 9.6; r2 = 0.53; p = 0.002] with increasing bites per capture (Figure 9).
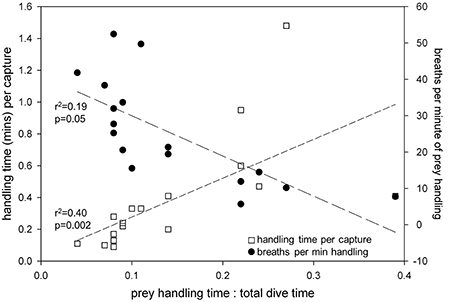
Figure 8. Handling time (min) per capture increased while breaths per minute of prey handling decreased with increasing proportion of prey handling time relative to total dive time in leatherback turtles (Dermochelys coriacea) foraging in the Northwest Atlantic Ocean off Nova Scotia, Canada.
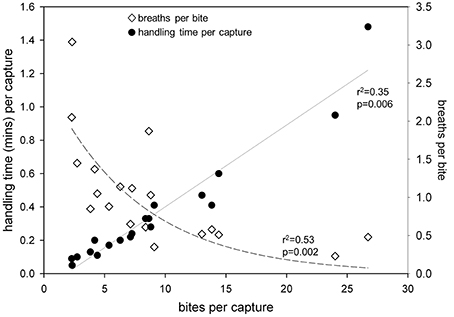
Figure 9. Handling time (min) per capture increased while breaths per bite decreased with increasing number of bites per capture in leatherback turtles (Dermochelys coriacea) foraging in the Northwest Atlantic Ocean off Nova Scotia, Canada.
Despite not having precise depth data for all turtles, we confirmed that water temperature was a reliable proxy for segments of dive profiles (i.e., ascent, descent, bottom of dives, surface). Therefore, we were able to evaluate proportion of prey captures by dive profile segments. Among all turtles, prey captures were non-uniformly distributed on dive profiles; i.e., nearly 80% of captures occurred at the bottoms and during ascents of dives (Figures 3C, 10). The proportion of captures decreased significantly from bottoms (41% of all prey captures) and ascents (37%) to descents (18%) to surfacing intervals (4%) (One-Way Analysis of Variance: F83 = 36.2; p < 0.0001) (Table 3, Figure 10).
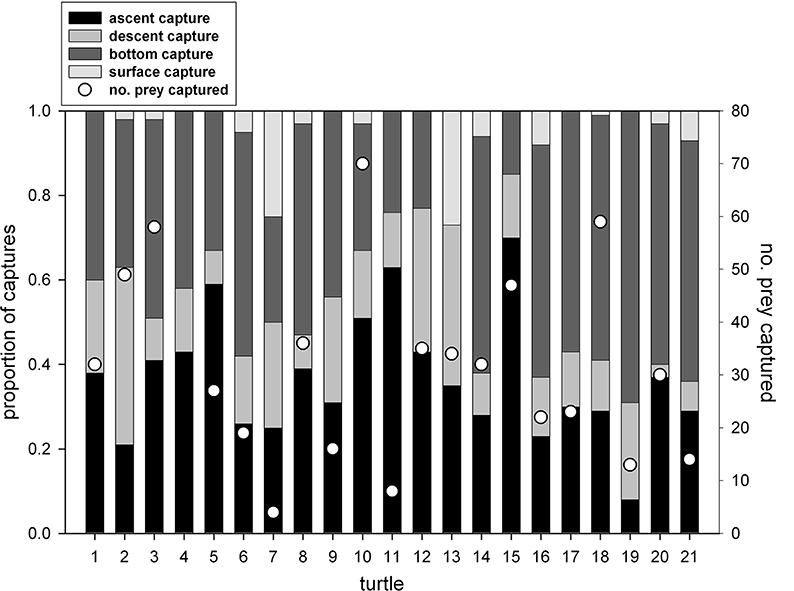
Figure 10. Proportion of prey captures within different segments of leatherback turtle (Dermochelys coriacea) dive profiles (number of captures also included for reference). Statistically significant differences among proportions of captures by dive segments were as follows: bottom, ascents > descents > surface intervals [F(87) = 29.0, p < 0.0001] (See (Table 3).
Discussion
Our analyses of fine-scale behaviors derived from turtle-borne video, GPS, and dive recorder data reveal that leatherback foraging activity in temperate coastal waters of the NW Atlantic is well within the species' physiological capabilities, and does not reflect tradeoffs between maximizing energy expenditure during prey capture and handling, and recovering or resting between more active dives. Instead, diving effort is highest where prey is most abundant and in highest densities, and turtles increase search effort when prey is less available or in lower densities (Figures 1, 4, 5), consistent with predictions of optimal foraging theory and theoretical predictions of diving predator behavior (Thompson and Fedak, 2001), and generally corroborating previous analyses using satellite telemetry that have shown scale-dependent migratory and search behavior by leatherbacks across vast distances to reach foraging areas (e.g., James et al., 2005a; Shillinger et al., 2008; Fossette et al., 2010a,b; Bailey et al., 2012a,b; Dodge et al., 2014). In other words, leatherbacks demonstrate scale-dependent patch foraging behaviors comparable to those exhibited by diverse taxa in a variety of habitat types, with movements between patches increasing in length and speed to minimize time during which energy is not acquired, and activity within patches increasing in diving rate and duration to maximize energy acquisition (e.g., Fauchald, 1999; Thompson and Fedak, 2001; Weimerskirch, 2007; Sims et al., 2008). However, the detailed characterization of leatherback foraging activity in Atlantic Canada we present here takes prior findings a step further by illustrating the vital importance of defined, reliable areas for leatherbacks to acquire sufficient resources to fuel their high-energy life history. Integrating long-distance migratory behaviors reported previously with the fine-scale feeding activities we report here deepens our understanding of leatherback behavioral ecology across the species' range and associated environmental conditions.
In continental shelf waters off Nova Scotia, variation in prey distribution and density drive leatherback foraging behavior in terms of both transit and diving activity. Collective analysis of all turtle tracklines and associated prey densities provides a composite view of generalized leatherback foraging behavior in relation to prey availability, and reveals both the patchy distribution of prey in our relatively fine-scale study area, as well as how turtles respond to this patchiness (Figure 1). Turtles are apparently always on the move in search of prey during daylight hours, but as prey densities increase, turtles travel shorter overall distances and increase capture success (prey captured/prey encountered) and efficiency (captures per unit effort) (Figures 4, 5). Turtles also dive more frequently and have higher prey capture rates (Figure 6) in areas of greater prey abundance (Figure 7). These findings generally support our first set of hypotheses: that leatherback foraging behavior off Nova Scotia reflects area-restricted search, in which animals locate areas of high prey density and then increase behaviors that maximize resource acquisition there (Thompson and Fedak, 2001; Weimerskirch, 2007; Sims et al., 2008; Bailey et al., 2009, 2012a,b; Fossette et al., 2010a,b).
Increased dive rates are associated with shorter dive and surface durations and fewer breaths during surface intervals (Figure 6), and increased prey handling time as a function of total dive time (and in terms of the number of bites per prey capture) requires fewer breaths per minute handling (or per bite) (Figures 8, 9). These findings are in contrast to our second hypothesis that increased diving activity requires increased surface time to replenish oxygen stores used to fuel underwater foraging. Despite their well-documented capacity for deep and prolonged diving (maximum recorded depth: 1250 m; Houghton et al., 2008; maximum recorded dive duration: 86.5 min; López-Mendilaharsu et al., 2009; see Lutcavage and Lutz, 1997; Hochscheid, 2014 for review), leatherback foraging dives in high latitude shelf habitat rarely exceed 70 m depth and an average of 8 min in duration (Table 1) (James et al., 2005a). James et al. (2005a, 2006) contrasted this pattern of short, shallow dives to the longer (>20 min), deeper (>100 m) dives performed by the same individuals during their southward migrations from Nova Scotia to low latitude breeding areas.
Based on field metabolic rate measurements, aerobic dive limits calculated for leatherbacks range between 11 and 44 min (Wallace et al., 2005), which means that dive durations of turtles in our study were essentially always within aerobic limits, thus obviating the need for prolonged surface intervals to replenish on-board oxygen stores for continued diving. Similarly, although leatherbacks are well-adapted to generating and maintaining high body temperatures in cold water (Wallace and Jones, 2008; Bostrom et al., 2010), their relatively shallow, short diving behavior off Nova Scotia limits time in cold temperatures and increases time in warmer surface waters. In addition, more frequent diving and essentially continuous swimming generates endogenous heat (Bostrom et al., 2010). Casey et al. (2014) reported that variation in leatherback body temperatures off Nova Scotia is best explained by time spent in surface waters, and that swimming activity also plays a role in maintaining a significant thermal gradient between leatherback body temperatures and ambient water temperatures. Therefore, although leatherbacks increase diving activity to achieve higher prey capture rates, which, in turn, increases the time they spend handling prey, this increased activity does not impose physiological costs that restricts their foraging effort, in contrast to theoretical predictions for diving predators (Thompson and Fedak, 2001). Rather, leatherbacks are apparently able to maintain high levels of apneic diving and prey handling activity with short surface intervals and fewer breaths to exploit areas of high prey availability. Our results also corroborate recent findings that green turtles (Chelonia mydas) modulate surface durations and number of breaths per surface interval during several consecutive foraging dive cycles to maintain aerobic activity (Okuyama et al., 2014).
This pattern of shallow, frequent dives provides further empirical support for the notion that leatherback prey distributions in shelf waters off Nova Scotia appear to be physically structured by local water mass conditions—i.e., at or above the main thermocline (Hamelin et al., 2014)—and that prey are not primarily concentrated at the surface (only 4% of prey captures; Table 3, Figure 10), unlike what has been reported in some other leatherback foraging areas (Houghton et al., 2006). Leatherbacks most frequently capture prey within the bottom 2 m of dives (41% of all captures) and during ascents (37% of captures), probably silhouetting prey against the illuminated ocean surface (Figure 10). This is consistent with our third hypothesis as well as previous inferences (Hamelin et al., 2014). The relatively shallow distribution of leatherback prey allows leatherbacks to avoid deep, prolonged foraging dives, thereby minimizing time transiting to and from depths at which prey are principally concentrated. Frequent, shallow, and short dives should maximize net energy gain to leatherbacks by increasing interactions with available prey while also allowing turtles to remain within preferred aerobic and thermal ranges, thereby maintaining high levels of activity and keeping energetic costs relatively low. Future research should explore the potential role of differences in foraging strategies as drivers of observed variation in life history and population dynamics among regional leatherback populations (Wallace and Saba, 2009; Bailey et al., 2012b).
Our results have important implications for inferred foraging or “residency” areas for leatherbacks and other marine migratory species determined statistically from satellite tracking data (e.g., Jonsen et al., 2007; Fossette et al., 2010a,b; Block et al., 2011; Bailey et al., 2012a,b; Dodge et al., 2014). For example, Jonsen et al. (2007) applied a state-space model to satellite-derived locations of turtles equipped with satellite transmitters that integrates metrics for the degree of turning (or “tortuosity”) and travel speeds (consistent with area restricted search) to distinguish foraging and transiting segments of individual turtle tracks. These results suggested dichotomous behavioral patterns of transiting between patches vs. remaining resident within patches, with residency presumed to indicate areas of active foraging. However, the present results suggest that in the absence of field-based or other direct observations, modeled assignments of behavioral states may portray a degree of false precision about the relative importance of different areas for leatherbacks. Using a combination of video and GPS data recorded with high spatio-temporal resolution, we observed that leatherbacks move and feed continuously, even while swimming in relatively straight lines —that some movement models might consider “transiting”—and where prey encounter rates and prey densities were relatively low (Figure 1). Therefore, based on observations of “true” behaviors, leatherbacks appear to always be foraging while in waters off Nova Scotia, and that variation in foraging activity is related to variation in prey availability, and not to whether or not a turtle is in a resource patch characterized by a particular size or prey density.
We acknowledge that the different spatio-temporal scales of leatherback state-space modeling (SSM) (using satellite tracking data) and our data presented here preclude direct comparison. SSM approaches have typically used daily locations with some associated spatial error and have estimated behavioral state across days and broad distances (10–1000 s of kilometers), while our results represent comparatively short deployments (<4 h) spanning several kilometers. Nonetheless, our results illustrate that modeled behaviors based on satellite-derived estimates of location are, at best, only inferences about what an animal is actually doing in a broad area during a specific time interval. Observations using technology and methods akin to those that we used in the present study present true behaviors at an ecologically fine-scale, and can complement or improve interpretation of longer term satellite tracking observations. For example, inferences from satellite telemetry studies have shown differences in travel speeds in putative foraging vs. transit areas (Fossette et al., 2010b; Bailey et al., 2012b), an interpretation that was supported by our finding that speed of travel was generally an indicator of high prey abundance and foraging success (Figures 4, 5).
Because critical habitat definition for migratory species is often a top priority for resource managers, characterizing fine-scale behavioral patterns and understanding the environmental factors that drive those behaviors are fundamental to effective management (Hebblewhite and Haydon, 2010). We strongly advocate “ground-truthing” of broad-scale inferences about habitat use with field-based observations to help interpret behavioral states and evaluate the relative importance of certain geographic areas to the life history and population dynamics of migratory species (Wilson et al., 2007; Hebblewhite and Haydon, 2010). Furthermore, our characterization of fine-scale behaviors off Nova Scotia, particularly horizontal and vertical habitat use, could be vital to addressing the significant management challenge of reducing leatherback entanglement in buoy lines associated with fixed fishing gear in temperate shelf waters (James et al., 2005b, 2007). While obtaining direct observations of fine-scale behaviors for migratory species like leatherbacks is logistically challenging, such data can ensure that management actions are properly defined according to a species' true habitat use patterns.
Conflict of Interest Statement
The authors declare that the research was conducted in the absence of any commercial or financial relationships that could be construed as a potential conflict of interest.
Acknowledgments
The work was supported by Fisheries and Oceans Canada, Canadian Wildlife Federation, Natural Sciences and Engineering Research Council of Canada, and United States National Oceanic and Atmospheric Administration's National Marine Fisheries Service (NOAA-NMFS). Fieldwork in Canada was conducted in partnership with the Canadian Sea Turtle Network, and in accordance with guidelines of the Canadian Council on Animal Care, with review and approval by the Dalhousie University Animal Care Committee (permit numbers 08–077, 09–069 and 11–073) and Fisheries and Oceans Canada (license and permit numbers 2008–454, MAR-SA-2008–006, 323395, 323398, 326240 and 332697). We are grateful to Xeos Technologies Inc., and K. Sokolenko for their collaboration in developing custom instrumentation. We thank employees and volunteers of the Canadian Sea Turtle Network and members of its field research team, including D. Archibald, L. Bennett, K. Fahey, B. Fricker, H. Fricker, J. Fricker, K. Fricker, K. Hamelin, P. MacDonald, K. Martin, B. Mitchell, and M. Nicholson for collection and organization of data used in this study.
References
Bailey, H., Benson, S. R., Shillinger, G. L., Bograd, S. J., Dutton, P. H., Eckert, S. A., et al. (2012a). Identification of distinct movement patterns in Pacific leatherback turtle populations influenced by ocean conditions. Ecol. App. 22, 735–747. doi: 10.1890/11-0633
Pubmed Abstract | Pubmed Full Text | CrossRef Full Text | Google Scholar
Bailey, H., Fossette, S., Bograd, S. J., Shillinger, G. L., Swithenbank, A. M., Georges, J.-Y., et al. (2012b). Movement patterns for a critically endangered species, the leatherback turtle (Dermochelys coriacea), linked to foraging success and population status. PLoS ONE 7:e36401. doi: 10.1371/journal.pone.0036401
Pubmed Abstract | Pubmed Full Text | CrossRef Full Text | Google Scholar
Bailey, H., Mate, B. R., Palacios, D. M., Irvine, L., Bograd, S. J., and Costa, D. P. (2009). Behavioural estimation of blue whale movements in the Northeast Pacific from state-space model analysis of satellite tracks. Endang. Species Res. 10, 93–106. doi: 10.3354/esr00239
Block, B. A., Jonsen, I. D., Jorgensen, S. J., Winship, A. J., Shaffer, S. A., Bograd, S. J., et al. (2011). Tracking apex marine predator movements in a dynamic ocean. Nature 475, 86–90. doi: 10.1038/nature10082
Pubmed Abstract | Pubmed Full Text | CrossRef Full Text | Google Scholar
Blumstein, D. T., and Daniel, J. C. (2007). Quantifying Behavior the JWatcher Way. Sunderland, MA: Sinauer Associates.
Bostrom, B. L., Jones, T. T., Hastings, M., and Jones, D. R. (2010). Behaviour and physiology: the thermal strategy of leatherback turtles. PLoS ONE 5:e13925. doi: 10.1371/journal.pone.0013925
Pubmed Abstract | Pubmed Full Text | CrossRef Full Text | Google Scholar
Casey, J. P., James, M. C., and Williard, A. S. (2014). Behavioral and metabolic contributions to thermoregulation in freely swimming leatherback turtles at high altitudes. J. Exp. Biol. 217, 2331–2337. doi: 10.1242/jeb.100347
Pubmed Abstract | Pubmed Full Text | CrossRef Full Text | Google Scholar
Charnov, E. L. (1976). Optimal foraging, the marginal value theorem. Theor. Pop. Biol. 9, 129–136. doi: 10.1016/0040-5809(76)90040-X
Pubmed Abstract | Pubmed Full Text | CrossRef Full Text | Google Scholar
Costa, D. P., Gales, N. J., and Goebel, M. E. (2001). Aerobic dive limit: how often does it occur in nature? Comp. Biochem. Physiol. A 129, 771–783. doi: 10.1016/S1095-6433(01)00346-4
Pubmed Abstract | Pubmed Full Text | CrossRef Full Text | Google Scholar
Dodge, K. L., Galuardi, B., Miller, T. J., and Lutcavage, M. E. (2014). Leatherback turtle movements, dive behavior, and habitat characteristics in ecoregions of the Northwest Atlantic Ocean. PLoS ONE 9:e91726. doi: 10.1371/journal.pone.0091726
Pubmed Abstract | Pubmed Full Text | CrossRef Full Text | Google Scholar
Eckert, K. L., Wallace, B. P., Frazier, J. G., Eckert, S. A., and Pritchard, P. C. H. (2012). Synopsis of the biological data on the Leatherback Sea Turtle, Dermochelys coriacea (Vandelli, 1761). US Fish and Wildlife Service PO no. 20181-0-0169, Jacksonville, FL.
Fauchald, P. (1999). Foraging in a hierarchical patch system. Am. Nat. 153, 603–613. doi: 10.1086/303203
Fossette, S., Girard, C., López-Mendilaharsu, M., Miller, P., Domingo, A., Evans, D., et al. (2010a). Atlantic leatherback migratory paths and temporary residence areas. PLoS ONE 5:e13908. doi: 10.1371/journal.pone.0013908
Pubmed Abstract | Pubmed Full Text | CrossRef Full Text | Google Scholar
Fossette, S., Hobson, V. J., Girard, C., Calmettes, B., Gaspar, P., Georges, J.-Y., et al. (2010b). Spatio-temporal foraging patterns of a giant zooplanktivore, the leatherback turtle. J. Mar. Sys. 81, 225–234. doi: 10.1016/j.jmarsys.2009.12.002
Fritz, H., Said, S., and Weimerskirch, H. (2003). Scale-dependent hierarchical adjustments of movement patterns in a long-range foraging seabird. Proc. Roy. Soc. Lond. B 270, 1143–1148. doi: 10.1098/rspb.2003.2350
Pubmed Abstract | Pubmed Full Text | CrossRef Full Text | Google Scholar
Hamelin, K. M., Kelley, D. E., Taggart, C. T., and James, M. C. (2014). Water mass characteristics and solar illumination influence leatherback turtle dive patterns at high latitudes. Ecosphere 5: 19.
Hart, K. M., and Hyrenbach, K. D. (2009). Satellite telemetry of marine megavertebrates: the coming of age of an experimental science. Endang. Sp. Res. 10, 9–20. doi: 10.3354/esr00238
Hays, G. C., Hobson, V. J., Metcalfe, J. D., Righton, D., and Sims, D. W. (2006). Flexible foraging movements of leatherback turtles across the North Atlantic Ocean. Ecology, 87, 2647–2656. doi: 10.1890/0012-9658(2006)87[2647:FFMOLT]2.0.CO;2
Pubmed Abstract | Pubmed Full Text | CrossRef Full Text | Google Scholar
Heaslip, S. G., Iverson, S. J., Bowen, W. D., and James, M. C. (2012). Jellyfish support high energy intake of leatherback sea turtles (Dermochelys coriacea): video evidence from animal-borne cameras. PLoS ONE 7:e33259. doi: 10.1371/journal.pone.0033259
Pubmed Abstract | Pubmed Full Text | CrossRef Full Text | Google Scholar
Heithaus, M. R., Dill, L. M., Marshall, G. J., and Buhleier, B. (2002). Habitat use and foraging behavior of tiger sharks (Galeocerdo cuvier) in a seagrass ecosystem. Mar. Biol. 140, 237–248. doi: 10.1007/s00227-001-0711-7
Pubmed Abstract | Pubmed Full Text | CrossRef Full Text | Google Scholar
Hebblewhite, M., and Haydon, D. T. (2010). Distinguishing technology from biology: a critical review of the use of GPS telemetry data in ecology. Phil. Trans. Roy. Soc. B 365, 2303–2312. doi: 10.1098/rstb.2010.0087
Pubmed Abstract | Pubmed Full Text | CrossRef Full Text | Google Scholar
Hobson, K. A. (2008). “Applying isotopic methods to tracking animal movements,” in Tracking animal migration with stable isotopes, eds K. A. Hobson, and L. I. Wassenaar (London: Academic Press;Elsevier), 45–78.
Hochscheid, S. (2014). Why we mind sea turtles' underwater business: a review on the study of diving behavior. J. Exp. Mar. Biol. Ecol. 450, 118–136. doi: 10.1016/j.jembe.2013.10.016
Houghton, J. D. R., Doyle, T. K., Davenport, J., Wilson, R. P., and Hays, G. C. (2008). The role of infrequent and extraordinary deep dives in leatherback turtle (Dermochelys coriacea). J. Exp. Biol. 211, 2566–2575. doi: 10.1242/jeb.020065
Pubmed Abstract | Pubmed Full Text | CrossRef Full Text | Google Scholar
Houghton, J. D. R., Doyle, T. K., Wilson, M. W., Davenport, J., and Hays, G. C. (2006). Jellyfish aggregations and leatherback turtle foraging patterns in a temperate coastal environment. Ecology 87, 1967–1972. doi: 10.1890/0012-9658(2006)87[1967:JAALTF]2.0.CO;2
Pubmed Abstract | Pubmed Full Text | CrossRef Full Text | Google Scholar
James, M. C., and Herman, T. B. (2001). Feeding of Dermochelys coriacea on medusae in the northwest Atlantic. Chel. Cons. Biol. 4, 202–205.
James, M. C., Myers, R. A., and Ottensmeyer, C. A. (2005a). Behaviour of leatherback sea turtles, Dermochelys coriacea, during the migratory cycle. Proc. Roy. Soc. Lond. B 272, 1547–1555. doi: 10.1098/rspb.2005.3110
James, M. C., Ottensmeyer, C. A., Eckert, S. A., and Myers, R. A. (2006). Changes in diel diving patterns accompany shifts between northern foraging and southward migration in leatherback turtles. Can. J. Zool. 84, 754–765. doi: 10.1139/z06-046
James, M. C., Ottensmeyer, C. A., and Myers, R. A. (2005b). Identification of high-use habitat and threats to leatherback sea turtles in northern waters: new directions for conservation. Ecol. Lett. 8, 195–201. doi: 10.1111/j.1461-0248.2004.00710.x
James, M. C., Sherrill-Mix, S. A., and Myers, R. A. (2007). Population characteristics and seasonal migrations of leatherback sea turtles at high latitudes. Mar. Ecol. Prog. Ser. 337, 245–254. doi: 10.3354/meps337245
Jonsen, I. D., Myers, R. A., and Flemming, J. M. (2003). Meta-analysis of animal movement using state-space models. Ecology 84, 3055–3063. doi: 10.1890/02-0670
Jonsen, I. D., Myers, R. A., and James, M. C. (2007). Identifying leatherback turtle foraging behavior from satellite telemetry using a switching state-space model. Mar. Ecol. Prog. Ser. 337, 255–264. doi: 10.3354/meps337255
Lambardi, P., Lutjeharms, J. R. E., Mecacci, R., Hays, G. C., and Luschi, P. (2008). Influence of ocean currents on long-distance movement of leatherback sea turtles in the Southwest Indian Ocean. Mar. Ecol. Prog. Ser. 353, 289–301. doi: 10.3354/meps07118
Lilley, M. K. S., Beggs, S. E., Doyle, T. K., Hobson, V. J., Stromberg, K. H. P., and Hays, G. C. (2011). Global patterns of epipelagic gelatinous zooplankton biomass. Mar. Biol. 158, 2429–2436. doi: 10.1007/s00227-011-1744-1
Pubmed Abstract | Pubmed Full Text | CrossRef Full Text | Google Scholar
López-Mendilaharsu, M., Rocha, C. F. D., Domingo, A., Wallace, B. P., and Miller, P. (2009). Prolonged, deep dives by the leatherback turtle Dermochelys coriacea: pushing their aerobic dive limits. J. Mar. Biol. Assoc. 2:e32. doi: 10.1017/S1755267208000390
Lutcavage, M. E., and Lutz, P. L. (1997). “Diving physiology,” The Biology of Sea Turtles, Vol. 1, eds P. L. Lutz and J. A. Musick (Boca Raton, FL: CRC Press), 277–297.
Moll, R. J., MIllspaugh, J. J., Beringer, J., Sartwell, J., and He, Z. (2007). A new ‘view' of ecology and conservation through animal-borne video systems. Trends Ecol. Evol. 22, 660–668. doi: 10.1016/j.tree.2007.09.007
Pubmed Abstract | Pubmed Full Text | CrossRef Full Text | Google Scholar
Okuyama, J., Tabata, R., Nakajima, K., Arai, N., Kobayashi, M., and Kagawa, S. (2014). Surfacers change their dive tactics depending on the aim of the dive: evidence from simultaneous measurements of breaths and energy expenditure. Proc. Roy. Soc. Lond. B 281:20140040. doi: 10.1098/rspb.2014.0040
Pubmed Abstract | Pubmed Full Text | CrossRef Full Text | Google Scholar
Patterson, T. A., Thomas, L., Wilcox, C., Ovaskainen, O., and Matthiopoulos, J. (2008). State-space models of individual animal movement. Trends Ecol. Evol. 23, 87–94. doi: 10.1016/j.tree.2007.10.009
Pubmed Abstract | Pubmed Full Text | CrossRef Full Text | Google Scholar
Ponganis, P. J., Van Dam, R. P., Marshall, G., Knower, T., and Levenson, D. H. (2000). Sub-ice foraging behavior of emperor penguins. J. Exp. Biol. 203, 3275–3278.
Reina, R. D., Abernathy, K. J., Marshall, G. J., and Spotila, J. R. (2005). Respiratory frequency, dive behavior and social interactions of leatherback turtles, Dermochelys coriacea, during the inter-nesting interval. J. Exp. Mar. Biol. Ecol. 316, 1–16. doi: 10.1016/j.jembe.2004.10.002
Robinson, P. W., Tremblay, Y., Crocker, D. E., Kappes, M. A., Kuhn, C. E., Shaffer, S. A., et al. (2007). A comparison of indirect measures of feeding behavior based on ARGOS tracking data. Deep Sea Res. II 54, 356–368. doi: 10.1016/j.dsr2.2006.11.020
Seminoff, J. A., Jones, T. T., and Marshall, G. J. (2006). Underwater behavior of green turtles monitored with video-time-depth recorders: what's missing from dive profiles? Mar. Ecol. Prog. Ser. 322, 269–280. doi: 10.3354/meps322269
Sherrill-Mix, S. A., James, M. C., and Myers, R. A. (2007). Migration cues and timing in leatherback turtles. Behav. Ecol. 19, 231–236. doi: 10.1093/beheco/arm104
Shillinger, G. L., Palacios, D. M., Bailey, H., Bograd, S. J., Swithenbank, A. M., Gaspar, P., et al. (2008). Persistent leatherback turtle migrations present opportunities for conservation. PLoS Biol. 6:e171. doi: 10.1371/journal.pbio.0060171
Pubmed Abstract | Pubmed Full Text | CrossRef Full Text | Google Scholar
Sims, D. W., Southall, E. J., Humphries, N. E., Hays, G. C., Bradshaw, C. J. A., Pitchford, J. W., et al. (2008). Scaling laws of marine predator search behaviour. Nature 451, 1098–1103. doi: 10.1038/nature06518
Pubmed Abstract | Pubmed Full Text | CrossRef Full Text | Google Scholar
Stewart, K., Johnson, C., and Godfrey, M. H. (2007). The minimum size of leatherbacks at reproductive maturity, with a review of sizes for nesting females from the Indian, Atlantic, and Pacific Ocean basins. Herp. J. 17, 123–128.
Stewart, K. R., James, M. C., Roden, S., and Dutton, P. H. (2013). Assignment tests, telemetry and tag-recapture data converge to identify natal origins of leatherback turtles foraging in Atlantic Canadian waters. J. Anim. Ecol. 72, 791–803. doi: 10.1111/1365-2656.12056
Pubmed Abstract | Pubmed Full Text | CrossRef Full Text | Google Scholar
Thompson, D., and Fedak, M. A. (2001). How long should a dive last? A simple model of foraging decisions by breath-hold divers in a patchy environment. Anim. Behav. 61, 287–296. doi: 10.1006/anbe.2000.1539
Wallace, B. P., and Jones, T. T. (2008). What makes marine turtles go: a review of metabolic rates and their consequences. J. Exp. Mar. Biol. Ecol. 356, 8–24. doi: 10.1016/j.jembe.2007.12.023
Wallace, B. P., and Saba, V. S. (2009). Environmental and anthropogenic impacts on intra-specific variation in leatherback turtles: opportunities for targeted research and conservation Endang. Species Res. 7, 1–11. doi: 10.3354/esr00177
Wallace, B. P., Williams, C. L., Paladino, F. V., Morreale, S. J., Lindstrom, L. T., and Spotila, J. R. (2005). Bioenergetics and diving activity of internesting leatherback turtles (Dermochelys coriacea) at parque nacional marino las baulas, Costa Rica. J. Exp. Biol., 208, 3873–3844. doi: 10.1242/jeb.01860
Pubmed Abstract | Pubmed Full Text | CrossRef Full Text | Google Scholar
Weimerskirch, H. (2007). Are seabirds foraging for unpredictable resources? Deep-Sea Res. II 54, 211–223. doi: 10.1016/j.dsr2.2006.11.013
Pubmed Abstract | Pubmed Full Text | CrossRef Full Text | Google Scholar
Williams, T. M., Fuiman, L. A., Horning, M., and Davis, R. W. (2004). The cost of foraging by a marine predator, the Weddell seal Leptonychotes weddellii: pricing by the stroke. J. Exp. Biol. 207, 973–982. doi: 10.1242/jeb.00822
Pubmed Abstract | Pubmed Full Text | CrossRef Full Text | Google Scholar
Keywords: animal-borne instruments, critical habitat, diving behavior, migratory species, leatherback turtles, optimal foraging, predator-prey, Atlantic Ocean
Citation: Wallace BP, Zolkewitz M and James MC (2015) Fine-scale foraging ecology of leatherback turtles. Front. Ecol. Evol. 3:15. doi: 10.3389/fevo.2015.00015
Received: 04 December 2014; Paper pending published: 05 January 2015;
Accepted: 02 February 2015; Published online: 23 February 2015.
Edited by:
François Criscuolo, Centre National de la Recherche Scientifique, FranceReviewed by:
Graeme Clive Hays, Deakin University, AustraliaJean-Yves Georges, Centre National de la Recherche Scientifique, France
Arnaud Tarroux, Norwegian Polar Institute, Norway
Copyright © 2015 Wallace, Zolkewitz and James. This is an open-access article distributed under the terms of the Creative Commons Attribution License (CC BY). The use, distribution or reproduction in other forums is permitted, provided the original author(s) or licensor are credited and that the original publication in this journal is cited, in accordance with accepted academic practice. No use, distribution or reproduction is permitted which does not comply with these terms.
*Correspondence: Michael C. James, Population Ecology Division, Fisheries and Oceans Canada, Bedford Institute of Oceanography, Dartmouth, NS B2Y 4A2, Canada e-mail: mike.james@dfo-mpo.gc.ca