Collective search by ants in microgravity
 Stefanie M. Countryman1
  Martin C. Stumpe2
  Sam P. Crow3
  Frederick R. Adler4
  Michael J. Greene5
  Merav Vonshak6
  Deborah M. Gordon6*
- 1BioServe Space Technologies, University of Colorado, Boulder, CO, USA
- 2AnTracks Computer Vision Systems, Mountain View, CA, USA
- 3Department of Computer Science and Engineering, University of Washington, Seattle, WA, USA
- 4Department of Mathematics, University of Utah, Salt Lake City, UT, USA
- 5Department of Integrative Biology, University of Colorado Denver, Denver, CO, USA
- 6Department of Biology, Stanford University, Stanford, CA, USA
The problem of collective search is a tradeoff between searching thoroughly and covering as much area as possible. This tradeoff depends on the density of searchers. Solutions to the problem of collective search are currently of much interest in robotics and in the study of distributed algorithms, for example to design ways that without central control robots can use local information to perform search and rescue operations. Ant colonies operate without central control. Because they can perceive only local, mostly chemical and tactile cues, they must search collectively to find resources and to monitor the colony's environment. Examining how ants in diverse environments solve the problem of collective search can elucidate how evolution has led to diverse forms of collective behavior. An experiment on the International Space Station in January 2014 examined how ants (Tetramorium caespitum) perform collective search in microgravity. In the ISS experiment, the ants explored a small arena in which a barrier was lowered to increase the area and thus lower ant density. In microgravity, relative to ground controls, ants explored the area less thoroughly and took more convoluted paths. It appears that the difficulty of holding on to the surface interfered with the ants' ability to search collectively. Ants frequently lost contact with the surface, but showed a remarkable ability to regain contact with the surface.
Introduction
In collective search, a group of agents move around independently, using only information from local interactions to adjust their paths so as to cover the area (Hayes, 2002). The collective goal is to have an individual search almost everywhere so that if there is something to find, some individual will encounter it (Adler and Gordon, 1992). If time is limited, there is a tradeoff between covering the area thoroughly, for which a convoluted path is most effective, and covering ground, which requires moving in straighter lines so as to traverse more distance (Bell, 1991; Benhamou, 1994). This tradeoff depends on the density of searchers. For example, suppose that you lost something small and valuable –a contact lens, or a diamond ring - on a football field. If you have a 100 friends to help search, each can choose a small area to search very thoroughly. But if you have only a few friends to help, each one must walk up and down the field to be sure to cover the entire area. Collective search algorithms, used in robotics, seek to solve this problem using local, decentralized cues (Hecker et al., 2012), for example to design ways that robots can use local information to perform search and rescue operations.
Ant colonies operate without central control, coordinating their behavior through local interactions with each other (Gordon, 2010). Ants perceive only local, mostly chemical and tactile cues. For a colony to monitor its environment, to detect both resources and threats, ants must move around so that if something happens, or a food source appears, some ant is likely to be near enough to find it. A previous study of the invasive Argentine ant (Gordon, 1995) showed that this species manages the tradeoff for the colony, between thorough search and covering as much area as possible, by adjusting ant path according to local density. When density is high, and ants can afford to be thorough (Adler and Gordon, 1992), ants use a more convoluted path, approaching a random walk, which leads each ant to move around in a relatively confined area (Collignan et al., 2014). When density is low, ants use straighter paths that cover more ground. It appears that an ant assesses the local density of nestmates through its rate of brief antennal contact with them. In the course of a brief antennal contact, an ant can assess the cuticular hydrocarbon profile of another and use this olfactory information to determine if the other ant is a nestmate and, at least in some species, what task the other ant has been performing (Greene and Gordon, 2003).
Ants are an extremely diverse taxon that have evolved to function in every habitat on Earth. There are species that search collectively on the ground, underground, in trees, inside stems and twigs, and on many different kinds of vegetation. Because species differ in the resources they collect and the threats they contend with, they are likely to differ as well in the ways that they search. Here we examined the relation between collective search and local conditions in an extremely unusual condition: we investigated how ants carry out collective search in microgravity. The experiment, conducted on the International Space Station in January 2014, used the pavement ant Tetramorium caespitum, an invasive species introduced from Europe, abundant in cities worldwide throughout the Northern temperate zone, commonly found nesting between paving stones and near other human-built structures (Nuhn and Wright, 1979; McGlynn, 1999; Klots et al., 2008). Ants of this species recruit to food sources (Collignon and Detrain, 2010), but in the experiment described here, the ants explored an arena without any food sources, and so there was no recruitment. In the experiment, the ants were allowed to explore one section of a small arena. Then a barrier was lowered to allow the ants access to a second section of equal area; this increase in area could lead to a lower ant density (Figure 1). We examined how the searching ants responded to a larger area to search. Ant search behavior has never been observed before in microgravity. We expected that the effort to carry out searching in microgravity might influence behavior enough to interfere with the usual relation of interaction rate and density, and thus to influence how ants adjust path shape when the area to be searched expands.
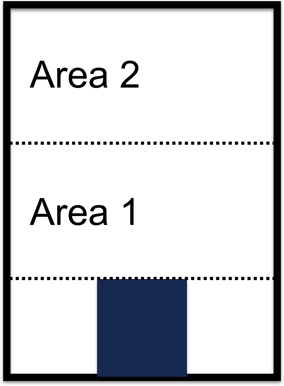
Figure 1. Diagram of arena used in the experiment. The blue rectangle in the bottom section represents the nest area. Dotted lines represent barriers that were opened from the outside. The data reported here compare ant behavior in Area 1 and Area 2, before and after the barrier was opened that separated Area 1 from Area 2.
Methods
All experiments were conducted using arenas made of plastic and plexiglass (Figures 1, 2) designed and constructed by Jacob Burrows Freeman. One section, at one end of the arena, was a nest area of 23 by 23 mm, of which 23 by 13 mm was plaster of Paris. This plaster area was moistened with 12 ml of Sigma-Aldrich Minimum Essential Medium Eagle that had 0.03% methylparaben v/v added to it to prevent mold. The floor of the arena had a rougher surface, of Delrin plastic, than the polycarbonate ceiling, and the ants in microgravity mostly clung to this rougher surface; very few ants walked on the other, smoother, ceiling surface of the arena. Each arena had an inner dimension of 8 by 11.1 cm, divided into three sections, separated by metal barriers that could be turned, using a wrench on the outside of the arena, until the barrier was flush with the arena floor.
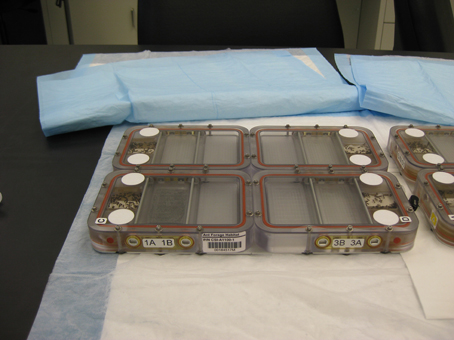
Figure 2. Arenas right before loading on Cygnus capsule to travel to the space station.
Eighty ants were placed in the nest area of each arena, but in all replicates, some ants died before the experiment was conducted. The experiment began when the barrier next to the nest was lowered, allowing the ants to enter freely from the nest into Area 1, and to return. During all experiments, some ants remained inside the nest area, and the numbers of ants in all areas fluctuated. After about 25 min, the second barrier, between Areas 1 and 2, was lowered and the ants could move freely from Area 1 to Area 2 and back. Because Area 1 and 2 were the same size, opening the barrier doubled the area accessible to the ants.
The ants were loaded into the arenas for transportation to the International Space Station in a laboratory located at NASA's Wallops Flight Facility, in Wallops Island, VA. Each arena, while completely sealed to prevent liquid escape per NASA safety requirements, had air vents within the nest area that provided appropriate gas exchange to the ants, but prevented liquid escape. These vents were holes manufactured into the polycarbonate window but covered with a small Gore Tex patch. Once the ants were placed in the nest area of each arena, the arenas were placed in groups of 4 and connected to an aluminum plate. The 2 plates of 4 arenas were placed in separate unsealed bubble bags for protection and placed in a NASA hard sided transportation locker. This locker was then loaded into the Orbital Sciences Cygnus capsule. The ant arenas were maintained in the correct orientation, with the gravity vector going down toward the floor of the arena at all times during this phase of the experiment, except for a brief period (13.5 h) when the arenas were in the rocket and while the rocket remained horizontal for cargo loading.
The ant arenas were launched to the International Space Station on January 9, 2014 at 18:07 GMT on the mission called “Orbital 1” and arrived at 08:44 GMT on January 12, 2014. During the time from loading until the experiment was performed on board the ISS, the ants were held at ambient temperature. The ambient temperature was between 21 and 24°C during transport to ISS and while on board the ISS. The same temperature range was maintained for the ground controls.
The experiment was replicated 8 times on the ISS on January 13, 2014, 1 day after the Cygnus capsule had berthed with the space station. The 8 arenas were placed in 2 groups of 4, arbitrarily numbered 1 through 8, and the experiment was begun for all replicates between 11:20 and 13:00 GMT; replicates 1 and 2 began at 11:20, 3 and 4 13:01, 5 and 6 11:50, 7 and 8 12:43. The experiment was also replicated 5 times in ground controls in the laboratory of BioServe Space Technologies at the University of Colorado Boulder. Ants were collected from colonies in North Carolina, Colorado and Virginia. A total of 80 ants were loaded into each arena. For both the flight and ground controls, 12 days elapsed between the day the ants were placed into the nest area of the arenas and the day the experiment was conducted. For 4 of the 5 ground controls, loading and thus the experiment occurred 10 days later than the experiments on the ISS. Both the flight and ground controls followed the same timeline for loading into the habitat, changes in orientation when loaded into the rocket and launched, and the time elapsed between loading and the beginning of the experiment. For all the ISS and 1 ground control, the units were loaded on January 1 2014 and the experiments were performed on January 13 2014. For 4 ground controls the ants were loaded on January 11 2014 and the experiments were performed on January 23 2014. In all replicates, both on the ISS and on the ground, some ants died between the time they were loaded and the time the experiment was conducted, so there were some dead ants in the nest area when the experiment was conducted.
Measures of Ant Behavior
During all replicates of the experiment, the movements of the ants were recorded on video. The trajectories of the ants were extracted from the videos using the image analysis software AnTracks (http://www.antracks.org).
Often groups of ants were clustered in the corners and at the edges of the arena, and it was not possible to distinguish their trajectories with image analysis. We defined the edges as a distance of about 5 mm of the edge of the arena, including the barrier which formed one edge of Area 1 before the barrier was opened. To evaluate the proportion of ants in the center and edges of the arena, we made an instantaneous count in each frame of the number of ants present, and then found from these counts the average numbers of ants per frame in the center and edges over the entire 25 min of video for Area 1 when the barrier was closed, and for Areas 1 and 2 combined when the barrier was open.
In the data analysis described below we used the trajectories obtained by image analysis. We eliminated the trajectories from ants within a distance of about 5 mm of the edge of the arena, including the barrier which formed one edge of Area 1 before the barrier was opened. This led to many small fragments of trajectories; for example, when an ant entered the region close to the edge and then returned to the arena, this produced 2 short trajectories. To analyze the data, we divided the image of the ants' trajectories into a grid of squares about 9.2 mm on each side, each 2–3 times the length of an ant (2.5–4 mm). To eliminate small trajectory fragments, we analyzed data only from trajectories of ants that had traversed more than 10 squares in any direction. When an ant left a square and then entered it again, this was counted as traversing 2 squares. The cutoff of 10 squares was chosen after examining the distribution of trajectory numbers, and led to numbers of trajectories ranging from 7 to 188 in ISS trials, and 3 to 200 in ground controls, up to about 3 times the number of ants actually observed at one time in the arena. Measures of the distances traveled are approximate; because the camera was not always at exactly the same distance from the arena, images varied slightly in size.
We estimated the standard deviation of turning angle for each trajectory that traversed 10 or more 9.2 mm squares. Each trajectory was divided into steps using a piecewise-linear discretization, with each step about 5 mm, slightly longer than the length of an ant. We found the turning angle in degrees between each pair of successive steps. For each trajectory, the standard deviation of turning angle was then the standard deviation of all turning angles in that trajectory (Kareiva and Shigesada, 1983). The maximum possible standard deviation of turning angle, that of a random walk, would be 103.9 degrees; the minimum for a straight line or perfect circle, would be 0 (Berg, 1953).
The numbers of interactions were estimated by binning all trajectories into 30 s windows, and finding the number of times that trajectories met during that interval.
To examine the response of the ants to an increase in the area to be searched, we compared ant movement only in the 5 min before and after the barrier was opened, with 60–100 s omitted while the barrier was being opened. After about 5 min since the barrier was opened, so many ants had moved into Area 2 that density was not appreciably lower, and in some cases was higher.
Data Analysis
To illustrate the thoroughness of search before and after the barrier was opened, we created heat maps showing the density of search. To do this we divided the image into small square regions of about 1.9 mm on each side, for a total of about 43 by 33 small grid squares for each region. The images for Area 1 differed slightly in size when the barrier was open because an edge of about 5 mm was excluded from analysis, and when the barrier was open, the region close to the barrier was no longer an edge. We found the number of ant trajectories ever to enter each small (1.9 by 1.9 mm) grid square during the 5 min of observation before and the 5 min after the barrier was opened. If an ant entered, left and re-entered a grid square, this would be counted as 2 ants. We chose a cutoff of 100; the mean maximum number of times an ant entered a small grid square in 5 min was about 150. We created heat maps for Area 1 before, and Areas 1 and 2 after the barrier was opened.
To examine the extent to which each area was searched in ground controls and in Space, we found the frequency distribution of the number of times a grid square was entered by an ant. We then examined how this distribution shifted after the barrier was opened and density decreased.
To compare the thoroughness of search in ground controls and in the ISS, we compared the mean numbers of ants per grid square across treatments. We used linear mixed effect models on log transformed data using replicate as a random effect (R function lme from the nlme package) to compare the mean numbers of ants per grid square in ground controls and ISS replicates. The models compared numbers in Area 1 with the barrier closed to those in Area 1 with the barrier open and Area 2 with the barrier open. We tested whether the number of ants that explored Area 1 changed with the barrier open, and compared the number of ants that explored Area 2 after the barrier was opened with the number in Area 1 before the barrier was opened. We examined both the main effects of treatment (Earth or Space) and their interaction with Area.
To estimate the rate at which ants in microgravity lost hold of the surface, we used 8 3 min samples, 4 from before the barrier was opened, and 4 from after, from 4 replicates. In each sample, an observer watching the video recorded the time elapsed from when an ant left the bottom surface and then regained its hold on the surface. The observer also counted the number of ants present in the arena during that 3 min. We then found the proportion of ants present that lost hold of the surface and the mean duration of time spent floating.
To compare whether ants covered more distance when given a larger area to explore, after the barrier was opened, than before the barrier was opened, we counted the number of squares that each ant traversed. For this analysis we considered only trajectories that traversed 10 or more 9.2 mm squares. We then found the difference between the mean number of squares traversed by all ants in Area 1 before the barrier was opened, and the mean number of squares traversed by all ants in Area 2 after the barrier was opened. We tested whether ants were better able to adjust path shape to cover more distance when the area to be searched increased, in Area 2 after opening the barrier, in ground controls than in microgravity, by comparing the mean differences between distance traversed in Area 2 after the barrier was opened, relative to Area 1 when the barrier was closed. Because we expected a more thorough search, and straighter paths, in ground controls than in microgravity, we used a one-tailed Mann–Whitney U test to determine if the mean difference for the 5 ground control replicates was higher than that for the 8 ISS replicates.
To estimate changes in path shape before and after the barrier was opened, we first estimated the standard deviation of turning angle for each trajectory that traversed 10 or more 9.2 mm squares. We tested whether ants on Earth were more likely than ants in microgravity to adjust path shape when density was lower, in Area 2 after opening the barrier. We found the difference between the mean standard deviation of turning angle for all trajectories in Area 1 before the barrier was opened, and the mean standard deviation of turning angle for all trajectories in Area 2 after the barrier was opened. We used a one-tailed Mann–Whitney U test to determine if the mean difference for the 5 ground control replicates was higher than that for the 8 ISS replicates.
We examined, for ground control and ISS trials, the relations among path shape, number of ants, and number of interactions. We plotted the number of interactions, counted as the number of all trajectories that met, vs. the number of ants, counted as the number of trajectories that traversed more than 10 grid squares, and the mean standard deviation of turning angle for all trajectories vs. the number of interactions for each area in the 5 min before and 5 min after the barrier was opened (Area 1 when closed, Area 1 when open, Area 2 when open). We used a Spearmann's rank correlation test to examine whether there was a significant correlation between number of interactions and number of ants, and between mean standard deviation of turning angle and number of interactions.
Results
More ants entered the arenas from the nest area in ground controls than in microgravity. The mean (SD) number of ants in the arena at any time, from instantaneous counts made in each video frame, was higher in ground controls [35.9 (5.6) in Area 1 when closed, 39.3 (7.9) in Areas 1 and 2 combined when open] than in microgravity [5.9 (7.6) in Area 1 when closed, 23.1 (8.4) in Areas 1 and 2 combined when open] (Mann–Whitney U test, z - 2.7, U 1, p < 0.05 for Area 1 closed, z - 2.4, U 3, p < 0.05 for Areas 1 and 2 combined). The maximum number of ants observed in Areas 1 and 2 when open, in any instantaneous count in a single frame, was 66 for ground controls, and 74 for the ISS replicates. In Area 1 when the barrier was closed, a higher proportion of ants went around the edges in ground controls [mean (SD) proportion at edges (0.59) (0.03)] than in the ISS replicates [0.53 (0.06)] (Mann–Whitney U test, Z - 1.97, U 6, p < 0.05), but the proportion of ants at the edges were not different for Areas 1 and 2 combined when the barrier was open [ground controls 0.51 (0.05), ISS replicates 0.57 (0.06), Mann–Whitney U test, Z - 1.39, U 10, p = 0.2]. We estimated from the videos how many ants had died in the nest area between the time that the ants were loaded into the arenas, and the experiments were performed. The mean (SD) numbers of dead ants were 9.2 (3.1) with range 5–12, in the ground controls, and 12.1 (6.8), with range 5–25, in the ISS replicates.
It appears that in microgravity, relative to ground controls, ants searched less effectively in response to an increase in the area to be explored. In microgravity, relative to ground controls, there were more regions of the arena that were never, or very rarely, visited by any ant after the barrier was opened, creating a larger area to search (Figure 3).
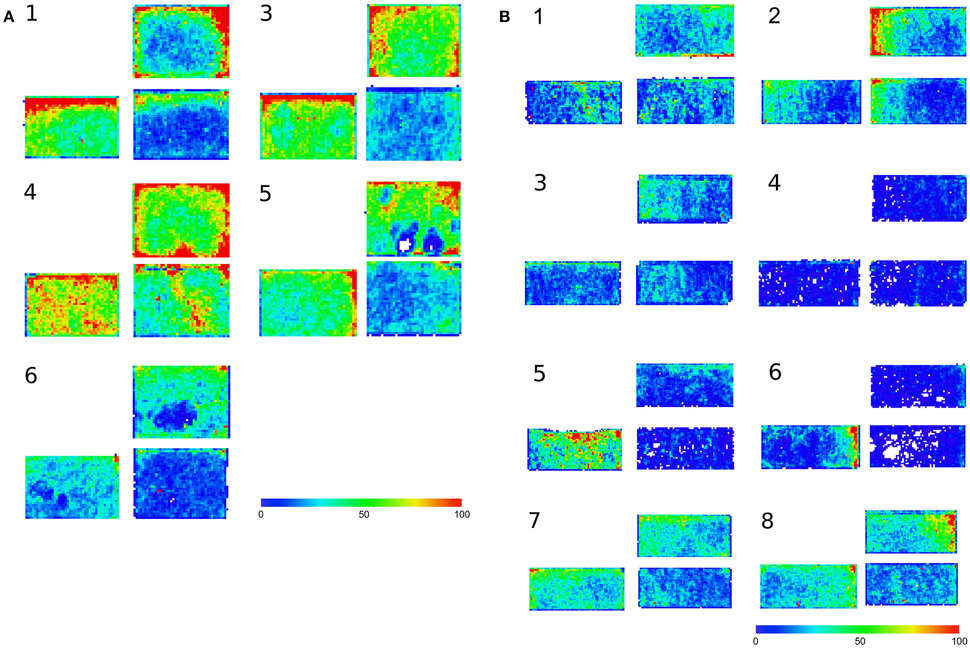
Figure 3. Heat maps showing number of times any ant entered a small grid square during 5 min. (A) Earth. (B) Space. 3 maps are shown for each replicate trial. Each small grid square is 1.9 mm on the side. Within a replicate trial group of 3 maps: Left: 5 min before barrier was opened, Area 1. Right: 5 min after barrier was opened. Bottom: Area 1. Top: Area 2.
In the ground controls, ants expanded their search when the barrier was open, to move into the novel area, Area 2, and to cover the entire arena thoroughly. In the ground controls the distribution of number of ants per grid square shifts to the right, reflecting a higher mean, from Area 1 to Area 2 when the barrier was open (Figure 4A). In microgravity the ants were less likely to do this (Figure 4B), especially in replicates 1–4.
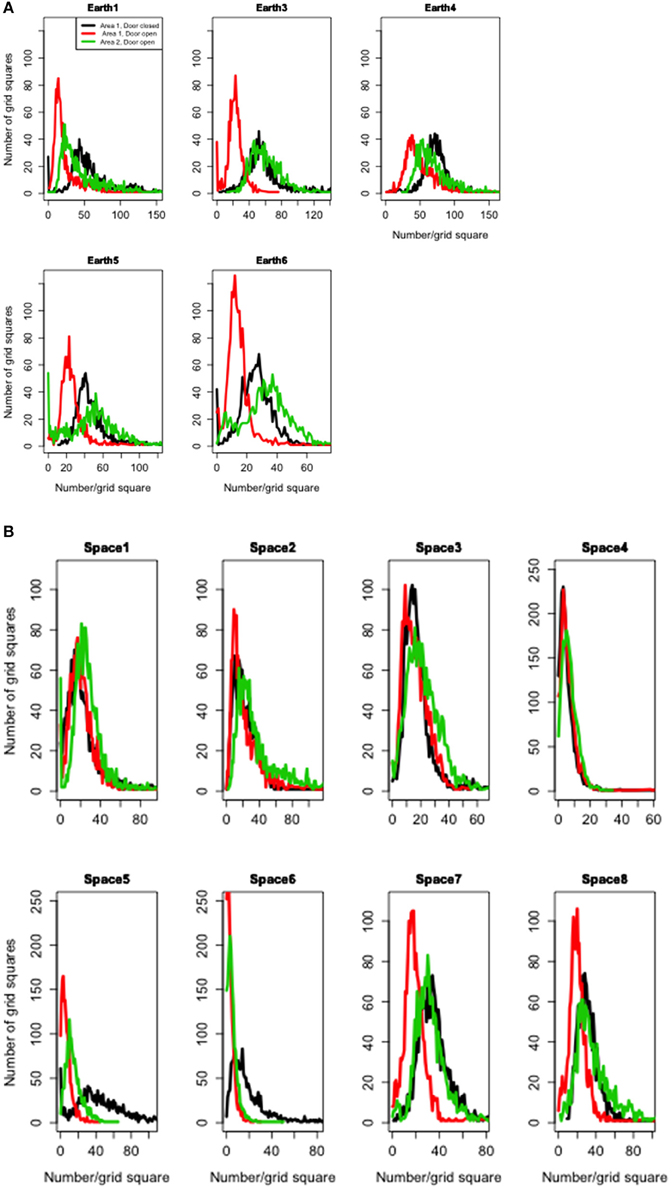
Figure 4. Thoroughness of search as the search area expanded. (A) Earth. (B) Space. Each curve shows the frequency distribution of number of ants per large grid square (9.2 by 9.2 mm). Black, Area 1 with barrier closed; Red, Area 1 with barrier open; Green, Area 2 after barrier was opened.
The mean numbers of ants per grid square reflect these trends; the ants searched more thoroughly on Earth than in microgravity. There were more ants per grid square in Area 1 when closed in ground controls than on the ISS replicates (Table 1, Figure 5). Overall fewer ants explored each grid square on the ISS than in ground controls (Table 2), and the number of ants exploring Area 1 decreased when the barrier was opened, and was slightly lower in Area 2 after opening than in Area 1 before opening. The significant statistical interaction of treatment (Earth vs. Space) and Area shows that in Space, activity declined less in Area 1 after the barrier was opened, and is slightly lower in Area 2.
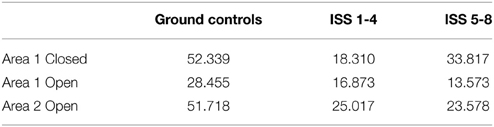
Table 1. Mean number of ants per 9.2 mm grid square.
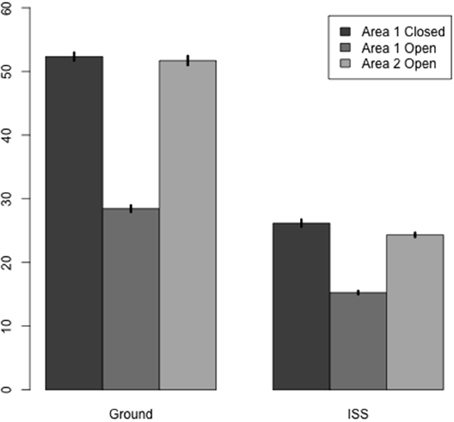
Figure 5. Change in thoroughness of search when the search area expanded. Each bar shows the mean number of ants per large grid square (9.2 by 9.2 mm). Dark, Area 1 with barrier closed; Medium, Area 1 with barrier open; Light gray, Area 2 after barrier was opened.
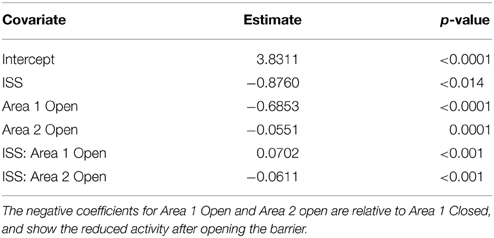
Table 2. Results of linear mixed effect model of mean number of ants per square against Area and treatment (ISS or ground controls), with replicates serving as a random effect.
In microgravity the ants did not adjust path shape to density as much as they did on Earth. When the barrier was opened, creating a larger area to search (Figure 1), the ants in ground controls, relative to ants in microgravity, tended to change their paths so as to traverse more area (Figure 6A) and use straighter paths (Figure 6B). There was a tendency, which was not statistically significant, for the mean number of grid squares traversed to increase more in ground controls than in microgravity when there was a larger area to search (one-tailed Mann–Whitney U test, Z = 0.81, U = 14, p = 0.2); in fact, in microgravity the ants often traversed fewer grid squares when there was a larger area to search, leading to a positive difference between numbers in Area 1 when the barrier was closed and Area 2 when it was open (Figure 6A). Overall the mean numbers of grid squares traversed in microgravity were more variable (range 13–22 in Area 1 closed, 15–20 Area 2 open, range of difference −6.9–5.9) than in ground controls (range 12–17 in Area 1 closed, 14–16 Area 2 open, range of difference −2.3–8.5).
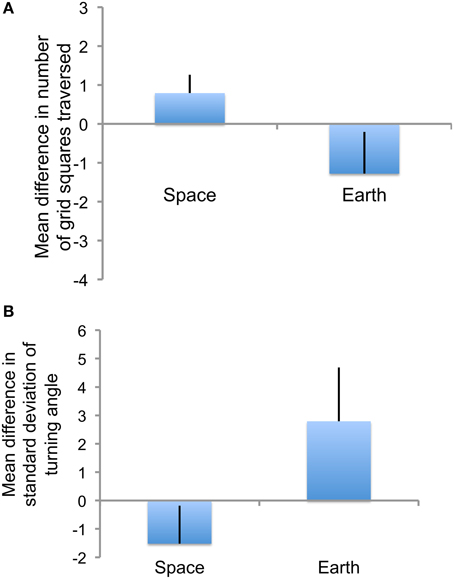
Figure 6. (A) Comparison of distance traversed per ant when the search area expanded. Shown are the means over all replicates of the mean numbers of large grid squares (9.2 mm by 9.2 mm) traversed in Area 1 before the barrier was opened minus the mean numbers of grid squares traversed in Area 2 after the barrier was opened. Error bars show standard errors of the mean. (B) Comparison of path shape when the search area expanded. Shown are the means over all replicates of the mean standard deviation of turning angle in Area 1 before the barrier was opened minus the mean standard deviation in turning angle in Area 2 after the barrier was opened. Error bars show standard errors of the mean.
Ants in microgravity, relative to ground controls, were somewhat less likely to straighten their paths in response to an increase in the area to be searched. The straighter the path, the smaller the standard deviation of turning angle; for example, a path in a straight line would have a standard deviation of turning angle of 0 because every step is in the same direction as the previous one. When the barrier was opened, increasing the area to be searched, the mean standard deviation of turning angle decreased more, indicating a stronger trend toward a straighter path, in ground controls than in microgravity. The mean difference between mean standard deviations of turning angle in Area 1 when closed and Area 2 when open tended to be larger in ground controls (one-tailed Mann–Whitney U test, Z = −1.68, U = 8, p = 0.05; two-tailed test ns at p = 0.09). In fact, in microgravity the ants' trails often became more convoluted, not straighter, after the barrier opened; in many trials, the standard deviation of turning angle increased (Figure 6B). The mean standard deviation of turning angles was more variable in microgravity (Space range 71–83 Area 1 closed, 75–82 Area 2 open, difference range −6 to −2) than in ground controls (Earth range 80–86 Area 1 closed, 76–80 Area 2 open, difference −2 to 8).
Although the ants were mostly able to walk around on the arena surface in microgravity, many ants occasionally left the surface and tumbled around in the air. They quickly regained their hold on the surface; the time an ant spent in the air ranged from 3 to 8.2 s, with a mean of 5.08 (SD 1.74). The proportion of ants that lost hold of the surface in 3 min ranged from 0.12 to 0.28, or about 7% per min.
Ants in Space may have missed interactions with each other because they were moving more slowly to manage walking on the surface in microgravity, and some were floating in the air. However, we saw no difference between ground controls and the ISS trials in the relation of number of interactions to number of ants (Figure 7), and the relation of standard deviation of turning angle to number of interactions (Figure 8). There was no significant correlation between mean standard deviation of turning angle and number of interactions either in the ground controls or in microgravity (R 0.35, p = 0.2 Earth, R 0.26, p = 0.2 Space, Spearmann's rank correlation). There was no significant correlation between the number of interactions and the number of ants in ground controls (R 0.01, p = 0.9), while the significant correlation in microgravity (R 0.44, p = 0.03) appears to be due to the 6 points with very low numbers of ants (Figure 7).
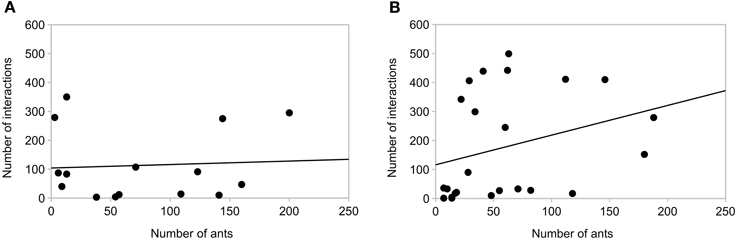
Figure 7. Relation of number of interactions and number of ants. (A) Earth (B) Space. Each point shows the number of interactions and the number of trajectories that entered one area: Area 1 closed, for 5 min before the barrier was opened, Area 1 open, for 5 min after the barrier was opened, and Area 2 open for 5 min after the barrier was opened. There are 15 points in Panel 7A (3 Areas, 5 replicates) and 24 for Panel 7B (3 areas, 8 replicates). Lines show the least squares fit.
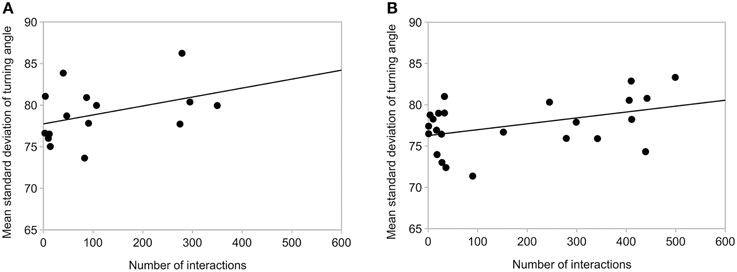
Figure 8. Relation of mean standard deviation of turning angle and number of interactions. (A) Earth. (B) Space. Each point shows the mean standard deviation of turning angle and the number of interactions in one area: Area 1 closed, for 5 min before the barrier was opened, Area 1 open, for 5 min after the barrier was opened, and Area 2 open for 5 min after the barrier was opened. There are 15 points in Figure 7A (3 Areas, 5 replicates) and 24 for Figure 7B (3 areas, 8 replicates). Lines show the least squares fit.
Discussion
The ants did not perform collective search as effectively in microgravity as they did in the ground controls. Because ants in microgravity did not use straighter paths or traverse more distance when the area to be searched expanded, they did not search the area thoroughly. In microgravity there were more regions of the arena that were never, or very rarely, visited by any after the barrier was opened (Figure 3), and the mean number of ant visits to each part of the search area was lower than on Earth (Figure 5). On Earth as the area to be searched expanded, the ants spread out more to cover it (Figure 4); on the ISS the ants did not spread out (first 4 replicates) or spread out much less than they did on Earth. In microgravity the ants tended to traverse less ground and take more convoluted paths when the area to be searched expanded (Figure 6).
Searching was less effective in microgravity than on Earth in part because on Earth, slightly fewer ants entered the arena from the nest. However, the differences were not due to number alone; the pattern of search also differed in microgravity. In the ground controls, relative to the ISS replicates, more areas of the arena were searched by many ants, and ant searchers spread out more when the barrier between Areas 1 and 2 was opened. This is shown in the greater shift to the right the distribution of searching, indicating more squares searched by many ants, as the barriers were opened, on Earth than in Space (Figure 4). This is also reflected in the interaction of Area and treatment (Earth or Space) in the statistical analysis of the mean number of ants per square (Table 2). Relative to the results for ground controls, the mean numbers of ants per square increased less in microgravity when the barrier separating Areas 1 and 2 was opened (Figure 5).
The searching behavior of the pavement ant, T. caespitum, differs from that of the Argentine ant, L. humile, studied in previous work (Gordon, 1995). Argentine ants adjusted path shape to local density. Groups of pavement ants, by contrast, concentrated their search on the side of the arena furthest from the nest area, both in ground controls and in microgravity (Figure 3). It appears that their method of collective search leads ants away from the nest. Conflict between neighboring nests occurs frequently in Tetramorium pavement ants (Sanada-Morimura et al., 2006). Competition between neighboring nests for foraging area may have shaped the evolution of an algorithm for collective search that takes ants to the edges of their foraging areas, where they encounter ants of neighboring colonies.
We do not know how much the collective search behavior of ants in microgravity was due to unreliable information about local density. Interaction rate can provide a cue to density (Adler and Gordon, 1992); the more ants are nearby, the higher the probability of an encounter. However, in microgravity many ants left the surface and landed somewhere else, thus disrupting the relation between density and encounter rate. This may have interfered with each ant's ability to assess local density and to adjust its path shape accordingly. There was no clear relation of path shape and density either on Earth or in Space. In Space, the relation of number of ants and the local density of ants in any one area may have been obscured by the fact that at any time, about 7% of the ants were not in contact with the surface. We saw no obvious trends in the relation of interaction rate and path shape, but our estimates of number of interactions per ant were not precise. We counted interactions based on fragments of trajectories; the image analysis broke trajectories into fragments, so we did not track the interactions of particular ants. A more detailed analysis would be needed to determine how individual ants changed turning angle in response to interactions with other ants.
Changes in olfaction in microgravity may have influenced the ants' response to interactions. Microgravity affects the ability of humans to perceive odor and taste (Olabi et al., 2002). Ants assess local rates of interaction through the detection of chemical recognition cues (e.g., Greene and Gordon, 2003).
Groups of ants varied in their responses to microgravity. Slight variation in initial conditions, such as how many ants leave the nest initially, or the response of particular ants to interaction, may produce variation among groups in the thoroughness of their search.
It is not clear how much the effort to stay on the surface, and time spent floating when an ant released its contact with the surface, influenced the ants' searching behavior in microgravity. The ants showed an impressive ability to walk on the surface in microgravity, and an even more remarkable capacity to regain their contact with the surface once they were tumbling around in the air. It seems that ants made an effort to maintain contact with the surface. An ant that lost contact with the surface usually turned and tumbled in the air, or skidded rapidly, in the small space between the two surfaces of the arena. This indicates that the ant exerted some pressure on the surface before losing contact with it; otherwise the ant would have just floated away from the surface without turning in the air or going quickly in one direction. Sometimes an ant attached itself to another ant to climb back down to the surface. Once back at the surface an ant appeared to hold on to it by flattening its body toward the surface, a movement characteristic of distantly related arboreal species (e.g., Cephalotes goniodontus, DMG pers obs). In other ant species, ants use their ability to hold onto each other to form bridges or balls of ants that can float when the nest is flooded (e.g., Mlot et al., 2011), and it is not known exactly how an ant can regain its hold on a tree after gliding through the air from above (Yanoviak et al., 2005). Further observation in microgravity might elucidate this biomechanical process, which may be of interest for roboticists using biomimesis of adhesion (e.g., Hawkes et al., 2014).
It seems likely that invasive species, such as Argentine ants (Gordon, 1995) and the pavement ants studied here, are effective at solving the problem of collective search, as they easily find resources in human-dominated environments. Ants are an extremely diverse taxon of about 20,000 species, and have evolved to search without central control in an enormous variety of conditions (Gordon, 2014). By repeating this experiment on Earth with different species of ants, we are likely to discover many new distributed algorithms for collective search, and to learn about how evolution has shaped collective behavior in response to local conditions. It would be especially interesting to examine the search behavior of the many tropical ant species whose behavior has never been studied.
Author Contributions
SMC supervised the design of the arena, set up the experiment, wrote the protocols, and loaded the ants for the ISS (several times due to postponements of the flights), conducted the ground controls.; MCS performed the video analysis to extract the trajectories of the ants from video; both SPC and FRA contributed to data analysis and produced some of the figures; MJG collected some of the ants and advised on maintaining T. caespitum in the laboratory; MV collected some of the ants; DMG designed the experiment, participated in the design of the arena, supervised and did some of the data analysis, and wrote the manuscript.
Conflict of Interest Statement
The authors declare that the research was conducted in the absence of any commercial or financial relationships that could be construed as a potential conflict of interest.
Acknowledgments
We thank Taylor Prentice and Eleanor Spicer Rice for their help in collecting the ants, and Clint Penick for his advice in housing and feeding the ants. The experiment would not have been possible without the excellent work of Jacob Burrows Freeman in designing and constructing the arenas. We would also like to thank NASA and the Center for the Advancement of Science in Space for sponsoring this experiment, as well as the staff at BioServe Space Technologies. We are very grateful to the astronauts, Rick Mastracchio and Micheal Hopkins, for their careful attention in conducting the experiment on the ISS.
Supplementary Material
The Supplementary Material for this article can be found online at: http://www.frontiersin.org/journal/10.3389/fevo.2015.00025/abstract
References
Adler, F. R., and Gordon, D. M. (1992). Information collection and spread by networks of patrolling ants. Am. Nat. 40, 3731100.
Benhamou, S. (1994). Spatial memory and searching efficiency. Anim. Behav. 47, 1423–1433. doi: 10.1006/anbe.1994.1189
Collignan, B., Cervantes Valdivieso, L. I., and Detrain, C. (2014). Group recruitment in ants: who is willing to lead? Behav. Proc. 108, 98–104. doi: 10.1016/j.beproc.2014.09.033
PubMed Abstract | Full Text | CrossRef Full Text | Google Scholar
Collignon, B., and Detrain, C. (2010). Distributed leadership and adaptive decision-making in the ant Tetramorium caespitum. Proc. Roy. Soc. B 277, 1267–1273. doi: 10.1098/rspb.2009.1976
PubMed Abstract | Full Text | CrossRef Full Text | Google Scholar
Gordon, D. M. (1995). The expandable network of ant exploration. Anim. Behav. 50, 995–1007. doi: 10.1016/0003-3472(95)80100-6
Gordon, D. M. (2010). Ant Encounters: Interaction Networks and Colony Behavior. Princeton, NJ: Princeton University Press. doi: 10.1515/9781400835447
Gordon, D. M. (2014). The ecology of collective behavior. PLoS Biol. 12:e1001805. doi: 10.1371/journal.pbio.1001805
PubMed Abstract | Full Text | CrossRef Full Text | Google Scholar
Greene, M. J., and Gordon, D. M. (2003). Social insects: cuticular hydrocarbons inform task decisions. Nature 423, 35–32. doi: 10.1038/423032a
PubMed Abstract | Full Text | CrossRef Full Text | Google Scholar
Hawkes, E. W., Eason, E. V., Christensen, D. L., and Cutkosky, M. R. (2014). Human climbing with efficiently scaled gecko-inspired dry adhesives. J. R. Soc. Interface. 12:20140675. doi: 10.1098/rsif.2014.0675
PubMed Abstract | Full Text | CrossRef Full Text | Google Scholar
Hayes, A. T. (2002). How many robots? group search and efficiency in collective search. Distr. Auton. Robot. Syst. 5, 289–298. doi: 10.1007/978-4-431-65941-9_29
Hecker, J. P., Letendre, K., Stolleis, K., Washington, D., and Moses, M. E. (2012). Formica ex machina: ant swarm foraging from physical to virtual and back again. Swarm Intell. 7461, 252–259. doi: 10.1007/978-3-642-32650-9_25
Kareiva, P., and Shigesada, N. (1983). Analyzing insect movement as a correlated random walk. Oecologia 56, 234–238.
Klots, J., Hansen, L., Pospischil, R., and Rust, M. (2008). Urban Ants of North America: Identification, Biology, and Management. Ithaca, NY: Cornell University Press.
McGlynn, T. P. (1999). The worldwide transport of ants: geographic distribution and ecological invasions. J. Biogeogr. 22, 535–548.
Mlot, N. J., Tovey, C. A., and Hu, D. L. (2011). Fire ants self-assemble into waterproof rafts to survive floods. Proc. Natl. Acad. Sci. U.S.A. 108, 7669–7673. doi: 10.1073/pnas.1016658108
PubMed Abstract | Full Text | CrossRef Full Text | Google Scholar
Nuhn, T. P., and Wright, C. G. (1979). Ecological survey of ants (Hymenoptera, Formicidae) in a landscaped suburban habitat. Am. Midl. Nat. 102, 353–362. doi: 10.2307/2424662
Olabi, A. A., Lawless, H. T., Hunter, D. A., Levitsky, D. A., and Halpern, B. P. (2002). The effect of microgravity and space flight on the chemical senses. J. Food Sci. 67, 468–478. doi: 10.1111/j.1365-2621.2002.tb10622.x
PubMed Abstract | Full Text | CrossRef Full Text | Google Scholar
Sanada-Morimura, S., Satoh, T., and Obara, Y. (2006). Territorial behavior and temperature preference for nesting sites in a pavement ant, Tetramorium tsushimae. Insectes Soc. 53, 141–148. doi: 10.1007/s00040-005-0849-2
Yanoviak, S. P., Dudley, R., and Kaspari, M. (2005). Directed aerial descent in canopy ants. Nature 433, 624–626. doi: 10.1038/nature03254
PubMed Abstract | Full Text | CrossRef Full Text | Google Scholar
Keywords: exploration, distributed algorithm, international space station, searching behavior, collective behavior
Citation: Countryman SM, Stumpe MC, Crow SP, Adler FR, Greene MJ, Vonshak M and Gordon DM (2015) Collective search by ants in microgravity. Front. Ecol. Evol. 3:25. doi: 10.3389/fevo.2015.00025
Received: 07 January 2015; Accepted: 27 February 2015;
Published: 30 March 2015.
Edited by:
James A. R. Marshall, University of Sheffield, UKReviewed by:
Chris R. Reid, New Jersey Institute of Technology, USATakao Sasaki, Arizona State University, USA
Thomas Owen Richardson, University of Lausanne, Switzerland
Copyright © 2015 Countryman, Stumpe, Crow, Adler, Greene, Vonshak and Gordon. This is an open-access article distributed under the terms of the Creative Commons Attribution License (CC BY). The use, distribution or reproduction in other forums is permitted, provided the original author(s) or licensor are credited and that the original publication in this journal is cited, in accordance with accepted academic practice. No use, distribution or reproduction is permitted which does not comply with these terms.
*Correspondence: Deborah M. Gordon, Department of Biology, Stanford University, Gilbert Biological Sciences Building, 371 Serra Mall, Stanford, CA 94305-5020, USA dmgordon@stanford.edu