Tracking past changes in lake-water phosphorus with a 251-lake calibration dataset in British Columbia: tool development and application in a multiproxy assessment of eutrophication and recovery in Osoyoos Lake, a transboundary lake in Western North America
 Brian F. Cumming1*
  Kathleen R. Laird1 Irene Gregory-Eaves2 Kyle G. Simpson2,3
  Michael A. Sokal4
  Rick N. Nordin5 Ian R. Walker6
- 1Paleoecological Environmental Assessment and Research Laboratory, Department of Biology, Queen's University, Kingston, ON, Canada
- 2Department of Biology, McGill University, Montreal, QC, Canada
- 3Institute of Ocean Sciences, Fisheries and Oceans Canada, Sidney, BC, Canada
- 4Environmental Protection, British Columbia Ministry of Environment, Penticton, BC, Canada
- 5Limnos Water Associates, North Saanich, BC, Canada
- 6Paleoecology Laboratory, University of British Columbia Okanagan, Kelowna, BC, Canada
Recently, there has been an active discussion about the potential and challenges of tracking past lake-water trophic state using paleolimnological methods. Herein, we present analyses of the relationship between modern-day diatom assemblages from the surface sediments of 251 fresh-water lakes from British Columbia and contemporary limnological variables. Total phosphorus (TP) was significantly related to the modern distribution of diatom assemblages. The large size of this new calibration dataset resulted in higher abundances and occurrences of many diatom taxa thereby allowing a more accurate quantification of the optima of diatom taxa to TP in comparison to previous smaller calibration datasets. Robust diatom-based TP inference models with a moderate predictive power were developed using weighted-averaging regression and calibration. Information from the calibration dataset was used to interpret changes in the diatom assemblages from the north and south basins of Osoyoos Lake, in conjunction with fossil pigment analyses. Osoyoos Lake is a large salmon-bearing lake that straddles the British Columbia-Washington border and has undergone cultural eutrophication followed by recovery due to substantial mitigation efforts in managing sources of nutrients. Both diatom assemblages and sedimentary pigments indicate that eutrophication began c. 1950 in the north basin and c. 1960 in the southern basin, reaching peak levels of production between 1960 and 1990, after which decreases in sedimentary pigments occurred, as well as decreases in the relative abundance and concentrations of diatom taxa inferred to have high TP optima. Post-1990 changes in the diatom assemblage suggests conditions have become less productive with a shift to taxa more indicative of lower TP optima in concert with measurements of declining TP, although two of these diatom taxa, Cyclotella comensis and Cyclotella gordonensis, that were previously rare are now abundant.
Introduction
Cultural eutrophication is one of the most pervasive environmental issues impacting freshwater ecosystems around the world and is largely the result of anthropogenic loading of excess nutrients. Lake-water phosphorus is the strongest predictor of mean annual phytoplankton biomass, but lake-water temperature is also an important predictor (Elliott et al., 2006). Eutrophication can result in many ecological and environmental changes that are less desirable from a human perspective. This typically includes increases in algal biomass, including cyanobacteria blooms which are recognized as a threat to water quality worldwide (O'Neil et al., 2012). Similar to overall algal production, the factors most strongly related to increases in cyanobacteria are nutrients and temperature (Jöhnk et al., 2008; Kosten et al., 2012; Taranu et al., 2012; Beaulieu et al., 2013), as well as lake depth (Taranu et al., 2015).
It is not a surprise that the economic impact from the adverse ecological and environmental changes associated with cultural eutrophication have been large, estimated to be in excess of $2.2 billion USD per year for freshwaters of the United States (Dodds et al., 2008). Fortunately, the nutrient status of lakes in many parts of North America and Europe are improving due to nutrient management and control, whereas in many developing countries, rapid population growth and watershed development have led to increases in nutrient loads (O'Neil et al., 2012).
Paleolimnology, the science that uses the physical, chemical, and biological characteristics that are preserved in the sedimentary record to reconstruct past ecological and/or environmental conditions, has been useful in studies of lake eutrophication (e.g., Battarbee, 1999). The long-term perspective of paleolimnological approaches, which pre-date high-quality records of water chemistry and/or ecological monitoring, makes paleolimnology well-suited to study cultural eutrophication, a process that typically occurs over decades. Paleolimnological approaches have been developed to study eutrophication (reviewed by Davidson and Jeppesen, 2013) have included changes in: (i) the relative composition and/or abundance of proxies of primary producers from lake sediments, including sub-fossil pigments, diatoms and other algal remains, as well as changes in plant composition from aquatic macrophytes; (ii) changes in the composition, abundance and size structure of many invertebrate groups (e.g., cladocera, and chironomids); and (iii) chemical proxies including direct measurements of total phosphorus (TP), that can be problematic (Ginn et al., 2012), as well as isotopic changes in carbon (C), nitrogen (N), and silica (Si) that can be related to changes in lake production (Davidson and Jeppesen, 2013). Given the limitations of many approaches and the complexities of lake ecosystems, most researchers advocate a multiproxy approach to reconstruct changes in nutrient dynamics, as well as a combination of both limnological and paleolimnological approaches (e.g., Battarbee et al., 2005).
Biological proxies are amongst the most widely used paleolimnological indicators to infer changes associated with eutrophication, with changes in diatom assemblages and pigment concentrations being commonly used. To help interpret changes in biotic assemblages in sediment cores is the use of a modern-day calibration dataset that involves the global estimation of species parameters (primarily species optima to TP). This approach has been termed the calibration-function approach (Birks et al., 1990, 2010; Charles et al., 1990), although there are other approaches including the indicator-species approach, and the assemblage approach (Birks et al., 2010). A large number of calibration datasets, primarily from North America, Europe, Australia, New Zealand, and China have been developed with the goal of understanding how diatom taxa are structured relative to concentrations of lake-water TP concentrations (23 calibration datasets summarized in Hall and Smol, 2010).
The majority of these diatom-based TP transfer functions are constructed from those taxa present in sedimentary diatom assemblages that meet a minimum exclusion criterion (e.g., achieving at least 1 or 2% relative abundance in a small number of lakes), using simple weighted-average (WA) models or models based on WA partial least squares (Hall and Smol, 2010). Weighted-average (WA) regression is the most widely used technique to estimate the relationship of each taxon to lake-water TP. The WA estimates (with the weight being the relative abundance of a taxon in a sample) become parameters of TP optima for the species, which are then used to estimate lake-water TP based on the assemblage composition of sub-fossil assemblages in cores (termed weighted-average calibration, Birks et al., 2010). The weighted-average approach is simple, and is based on the concept that the optima of a particular taxon is highest in the lakes at which it achieves its highest abundance. Over the years, many different calibration approaches have been attempted (e.g., see Birks et al., 2010), but these typically more-complex approaches, have not out-performed the simpler WA approach (Birks and Simpson, 2013). Although changes in diatom assemblages in sediment cores, and the use of diatom-based TP inferences have become widely accepted techniques for tracking trajectories associated with eutrophication (Hall and Smol, 2010), this approach may be misleading, especially if there have been violations made in the assumptions associated with the use of transfer functions (e.g., Juggins, 2013). As an example, there is particular concern over the confounding influence of secondary variables in the training sets, as well as poor or no spatial replicability in diatom optima to lake-water TP across different regional calibration datasets (Juggins, 2013; Juggins et al., 2013).
The measurement of pigments preserved in sediment cores has also been a widely used technique for assessing the extent, magnitude and recovery of nutrient enrichment in lakes, because sedimentary pigments have been shown to be a good proxy for algal biomass (Leavitt and Findlay, 1994; Battarbee, 1999; Leavitt and Hodgson, 2001). Sedimentary pigments are the net result of overall production and degradative processes prior to and after deposition into lake sediments. Degradative processes include herbivorous grazing, photo-oxidation, chemical or microbe-mediated oxidation (Leavitt, 1993; Leavitt and Hodgson, 2001). Fortunately, chlorophylls, carotenoids and derivative products are generally well-preserved and can persist for long periods of time within lake sediments (Leavitt and Hodgson, 2001).
The objectives of this paper are to: (i) develop a large fresh water calibration set based on the abundance of diatom assemblages spanning 251 freshwater lakes (salinity < 0.5 g/L) in British Columbia to understand the relationship between dominant diatom taxa and lake-water TP and other chemical and physical variables; and (ii) use both sedimentary pigments and diatom assemblage data to obtain better information on the historic nutrient status of Osoyoos Lake so that realistic restoration goals can be estimated. Osoyoos Lake was chosen as reductions in nutrient loading have resulted in measured declines in lake-water TP since the early-to-mid 1990s. Although previous studies have been undertaken on sediment cores from Osoyoos Lake addressing a variety of proxies from pollen, diatoms, chironomids and geochemistry (Anderson, 1973; Pinsent and Stockner, 1974; Ryder, 1994), these studies suffered from having insufficiently long cores to capture the last 200 years of sediment accumulation, poor dating, and lower resolution analyses.
Materials and Methods
The British Columbia calibration dataset used in this study consisted of diatom assemblage data and summer water chemistry from 251 freshwater lakes (Figure 1). These lakes were sampled to be broadly representative of freshwater lakes across British Columbia, with an effort at collecting samples from deep and shallow lakes across a nutrient concentration gradient. This sampling included several biogeoclimatic zones, from warmer semi-arid regions (< 300–400 mm precipitation) on the southern interior plateau (Wilson et al., 1996) to cool sub-humid regions with moderate precipitation in the north (~600 mm/year, Laird and Cumming, 2001), to coastal maritime climates with very high precipitation (2500–5000 mm/year, Laird et al., 2001). The vegetation varied greatly among sampling sites with the semi-arid regions on the southern interior plateau being broadly characterized by Ponderosa pine and bunchgrass, with increasing amounts of interior Douglas fir in the central regions of the interior plateau. Regions farther to the north were dominated by sub-boreal spruce, lodgepole pine, and in some areas trembling aspen and sub-alpine fir. Vancouver Island is characterized by a marine-moderated climate with vegetation dominated by western hemlock and western red cedar (Valentine et al., 1978).
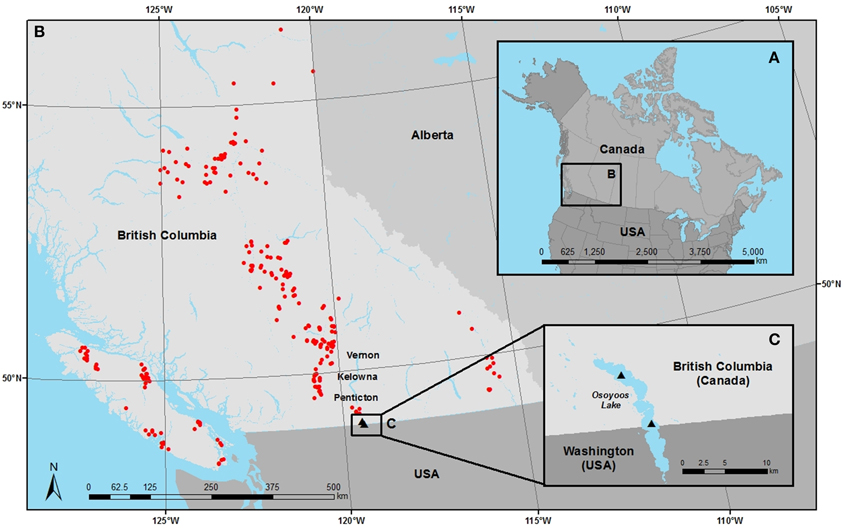
Figure 1. (A) Location of the study region in western Canada, (B) the location of the 251 freshwater lakes from the province of British Columbia where surface-sediment samples and contemporary lake-water chemistry were taken to characterize the modern-day diatom assemblages, and (C) the location from where sediment cores were removed from the north and south basins of Osoyoos Lake.
Osoyoos Lake is a relatively large (Figure 1; surface area = 23 km2, maximum depth = 63 m, mean depth = 14 m) salmon-bearing lake with a north-south orientation, and two basins, that straddle the Canada/USA border (Jensen et al., 2012). Osoyoos Lake is the last lake in a chain that drains the Okanagan basin, an area of ~8280 km2, into the Okanagan River (USA) which is a tributary to the Columbia River and ultimately the Pacific Ocean. The relatively warm climate supports a recreation-based economy, agriculture (mainly orchards and vineyards), cattle ranching and forestry, and the cities of Vernon, Kelowna, West Kelowna, Penticton, and Osoyoos. Estimates of point-source phosphorus inputs from sewage treatment facilities in the Okanagan Valley were ~59,000 kg/year in 1970, which were subsequently reduced by over 10-fold to between 2000 and 4000 kg/year by the mid 1990s (Jensen and Epp, 2002). These reductions are largely due to the introduction of improved sewage treatment plants in Penticton and Kelowna. Nutrient reductions have also resulted from non-point source reductions due to improvements to the agricultural code and Forest Practices Act in British Columbia and other land-management programs; however, these changes were estimated to be small relative to point-source changes (Jensen and Epp, 2002). Measurements of spring TP in the uppermost 10 m of water in the northern basin of Osoyoos Lake between 1969 and 1990 were high, ranging from ~18 to 37 μg/L (mean 27 ± 7 μg/L, n = 14). In contrast, between 1990 and 2009, the spring TP was on average ~10 μg/L lower, and the range in TP-values was smaller (TP range 1990–2009 = ~6 to 25 μg/L; mean = 17 ± 5 μg/L, n = 14) (Jensen et al., 2012). Similarly, fall epilimnetic TP measurements were ~6 μg/L higher between 1968 and 1990 (TP range ~12–26 μg/L; mean = 16 ± 4 μg/L, n = 17), as compared to fall TP measurements between 1990 and 2009 (TP range 4.5–16 μg/L; mean = 9.9 ± 4μg/L, n = 18) (Jensen et al., 2012). These changes parallel the measured TP concentration changes in the Okanagan River ranging from approximately 15–40 μg/L in the late 1980s to early 1990s (n = ~25) to between 5 and 20 μg/L from 2004 to 2009 (n >30) (B.C. Ministry of the Environment, unpublished data).
Calibration Dataset
The 251-lake calibration dataset (Figure 1) was compiled from summer (June to early September) sampling trips over four different years that included: (i) 1991 and 1993 (92 of the freshwater lakes from the Central Interior Plateau and Rocky Mountain Trench of British Columbia (B.C.) as a part of the larger 219-lake salinity calibration dataset of Wilson et al. (1996), (ii) 1996 (51 freshwater lakes sampled from the mid-to-lower interior plateau of B.C., and 50 lakes from Vancouver Island), and (iii) from 1997, where 53 lakes from a ~250-km radius centered around Prince George, British Columbia were sampled (i.e., the more northern sites on Figure 1), as well as five more nutrient-rich lakes from around Victoria, BC. The majority of lakes were sampled by canoe, but a number of lakes were sampled by float plane (Laird and Cumming, 2001; Laird et al., 2001).
The diatom assemblage data for each lake comes from the analysis of the uppermost 1 cm of sediment collected from the bottom of a central large basin of each lake using either a miniature gravity corer (Glew, 1991), or a modified K-B gravity corer (Glew, 1989). Water chemistry samples from a depth of ~0.5 m were also collected from each lake from the same central location in the lake into polyethylene bottles that were rinsed with lake water at least three times prior to obtaining the sample. Water chemistry samples were shipped in coolers on ice, and chemical analyses were normally completed within 96 h of sample collection. Water chemistry analyses for major cations (Ca2+, Mg2+, Na+, K+), anions (dissolved inorganic carbon (DIC), Cl−, SO2−4), pH, specific conductivity, and nutrients (TP, nitrogen and dissolved silica) followed standard protocols outlined in Wilson et al. (1994). Chemical measurements were not made for DIC and total Kjeldahl nitrogen (TKN) for two lakes, and five lakes additional lakes were missing measurements for TKN. These seven lakes were omitted from the correlation matrix of the standardized environmental variables, but were included in all other analyses.
Slides for diatom analysis were prepared using standard techniques (Cumming et al., 1995). Briefly, a small amount of wet sediment was suspended in a 50:50 (molar) mixture of sulfuric and nitric acid in a 20-ml glass vial for 24 h prior to being submersed at 70°C in a hot water bath for approximately 5 h. The remaining sediment material was settled for a period of 24 h, at which time the acid above the sample was removed. The sample was rinsed with distilled water and allowed to settle once again for 24 h. The procedure was repeated approximately 8 times until the sample was the same pH as distilled water (litmus test). The samples were settled onto coverslips in a series of four 100% dilutions, which when dry, were mounted onto glass slides using the high-resolution mounting medium Naphrax®. For each sample, at least 400 diatom valves were enumerated with a Leica DMRB microscope equipped with differential interference contrast optics at 1000X magnification (numerical aperture of the objective = 1.3). Diatom identifications were based primarily on the references of Krammer and Lange-Bertalot (1986, 1988, 1991a,b); Patrick and Reimer (1966, 1975), and Cumming et al. (1995).
The distributions of all of the physical and chemical environmental variables were visually examined for normality, and transformed if required. A Principal Components Analysis (PCA), in conjunction with a correlation matrix between transformed environmental data, was used to summarize the strength and covariance between the physical and chemical characteristics in the B.C. calibration dataset. The PCA was undertaken on centered and standardized environmental variables, following transformations to better approximate a normal distribution, using the computer program CANOCO v. 5. (ter Braak and Šmilauer, 2012).
Both unconstrained (correspondence analysis, CA) and constrained ordination (canonical correspondence analysis, CCA) were used to identify the main directions of diatom species variation in the 251-lake dataset and to select the minimum number of measured environmental variables that could account for variance in the diatom data, respectively. The strength of the explanatory power of TP was also assessed by the strength of the first eigenvalue of a CCA when TP was the only explanatory variable. All ordinations were undertaken with the computer program CANOCO v. 5.
To reduce the number of potential explanatory variables used to explain the distribution of diatom assemblages in the calibration set, the number of variables was reduced by grouping environmental variables that had correlation coefficients of > 0.7, and one representative environmental variable was chosen from each group. Ordinations were based on: (i) all diatom taxa that achieved at least 2% relative abundance, and (ii) diatom taxa that were represented by at least a Hill's N2 of 5 (i.e., represented equally in the dataset by at least five occurrences). Taxa that achieved a Hill's N2 of at least 5, were further divided into abundant taxa, achieving an abundance of >10%, and subdominant taxa (N2 > 5, but maximum relative abundance < 10%). Ordinations were run on all taxa that achieved an N2 > 5 (i.e., the dominant and subdominant taxa) (ter Braak and Šmilauer, 2012).
Diatom-based TP inference models were developed based on the 251-lake dataset using simple weighted-averaging models, on both non-transformed and square-root transformed species relative abundance data following techniques outlined in Birks et al. (1990). In weighted-averaging models, averages are taken twice (once in the regression step and once in the calibration step), which results in the shrinkage of the original gradient (e.g., TP). To correct for this, we used both inverse and classical deshrinking techniques in our models (Birks et al., 1990). The strength of the models was assessed using the coefficient of determination of the inference model after bootstrapping (r2boot) and the root mean squared error of prediction (RMSEP), and estimates of the optimum and the tolerance of the dominant diatom taxa to lake-water TP were made using the computer program C2 v. 1.7.5 (Juggins, 2003).
Osoyoos Lake Sediment Cores
Two sediment cores were retrieved from Osoyoos Lake with a slide hammer corer (internal diameter ~6.35 cm) on June 17 and 18th, 2009, from a depth of ~50 m in the north basin, and a depth of 23 m in the south basin (Figure 1C). The cores from the north and south basins were 90 and 99 cm in length, respectively and were sectioned into ~0.5-cm intervals on site. Core chronologies (i.e., core depth-time profiles) were based on measurement of total 210Pb, 214Bi (a proxy of supported 210Pb) and 137Cs in each core from twenty-one and twenty-two samples from the north and south basin cores, respectively, using gamma spectroscopy (Schelske et al., 1994). Unsupported 210Pb activities were used to estimate the chronology of the cores using the constant rate of supply (CRS) model (Appleby and Oldfield, 1978) using the computer program developed by Binford (1990).
Sedimentary pigments in the cores were analyzed from 32 intervals from each of the two cores from Osoyoos Lake. Sedimentary pigments were extracted from freeze-dried sediments in acetone under an argon atmosphere at −20°C for 24 h. During pigment extraction samples were kept in the dark and on ice at all times to avoid pigment deterioration from light, heat, and oxygen (Leavitt and Hodgson, 2001). Samples were then centrifuged, the supernatant was decanted and filtered (0.2 μm), and finally placed into sealed glass vials. Sample extracts were analyzed using a Waters High Performance Liquid Chromatography (HPLC) system equipped with a photo diode array (Waters model 2996) and a multi wavelength fluorescence detector (Waters Model 2475) following the solvent protocol outlined in Zapata et al. (2000). The HPLC produces chromatograms in a specific sequence based on the properties of the compounds being analyzed. The resulting retention time and absorbance spectra were compared to purified reference materials to quantify the sedimentary pigments. For all pigments, the area under the curve was used to calculate the quantity present in each sample. Pigments were expressed as nmol/g organic dry weight, and percent organic matter (OM) was determined using the standard loss-on-ignition method (Dean, 1974).
Diatoms were analyzed from the same intervals that were sampled for fossil pigments. Diatom valves were enumerated following procedures stated above for the calibration dataset but with the exception that microspheres were added to each sample prior to settling on coverslips to allow for calculations of the diatom-valve concentration following the procedure outlined by Battarbee and Keen (1982). Briefly, to each slurry a known concentration of microspheres was added and were enumerated along with the diatoms and used to calculate estimates of the number of diatoms per gram dry weight. Total diatom concentration provides an additional proxy to assess diatom assemblage changes in sediment cores.
The diatom assemblage changes over the last 200 years in the Osoyoos Lake sediment core were critically assessed to determine: (i) if the TP inferences tracked the main directions of variation in the diatom species assemblages, (ii) if the sub-fossil assemblages in the sediment core were well-represented in the modern 251-lake calibration dataset, and (iii) if the changes in the diatom assemblages were consistent with the known history of eutrophication and recovery of Osoyoos Lake, based on modern water chemistry data, and other eutrophication proxies including changes in diatom concentrations, and changes in sedimentary pigments.
To assess if the extent to which the TP inference tracked the main directions of variation in the diatom assemblages we calculated: (a) the λR/λP ratio, and (b) correlations between the diatom-inferred TP-values in the core to the axis-1 and -2 scores of a principal components analysis (PCA) of the diatom assemblage (Juggins et al., 2013). The λR/λP ratio expresses the variance accounted for by the diatom-inferred TP as a fraction of the maximum explainable variance in the core, and is calculated by: dividing the eigenvalue of the first axis of a redundancy analysis (RDA) of the diatom assemblage in the sediment core constrained to the diatom-inferred TP (λR) divided by the eigenvalue of the first axis of a PCA on the same downcore diatom assemblage (λp). Additionally, greater confidence that the diatom assemblages are tracking the changes related to phosphorus (or correlated variables) is increased when the correlation between the diatom-inferred TP-values to the main direction of variation in the PCA axis-1 and -2 scores are high. If the correlation between the main direction of variation and the diatom-inferred phosphorus values is weak or non-existent, then other environmental variables or interactions between environmental variables, are likely responsible for the observed changes in diatom assemblages, and lead to less confidence in the diatom-based inference. The main directions of variation in the diatom assemblages in the Osoyoos Lake cores were determined from PCA axis-1 and -2 scores using both non-transformed and transformed species abundance data. PCA was chosen to represent the main directions of variation of the diatom assemblages because the gradient length in an initial detrended correspondence analysis was < 1.5 standard deviation units.
To assess the applicability of the modern diatom assemblages to the core assemblages we examined how well each of the dominant taxa in the core was represented in the modern training set. This was assessed by comparing the number of occurrences and the relative abundances of taxa in the core assemblages to the modern assemblages. If core assemblages were not well represented, we re-ran the TP inference models, excluding the influence of the poorly represented taxa, and compared the results of the two WA inference models.
Finally, we assessed changes in the downcore diatom concentrations as an additional proxy to nutrient additions. Data expressed as concentrations (and/or accumulations) can also be used, in addition to percentages, to assess changes in diatom assemblages. Changes in the diatom assemblages and TP inferences were also compared in relation to pigment changes in the core, as well as to historical and water quality information from Osoyoos Lake.
Results
Calibration Data Set
The study lakes span a large portion of the central to southern interior of B.C., the Rocky Mountain Trench, and Vancouver Island, and represent a large diversity of freshwater lakes (salinity < 500 mg/L) with large gradients in lake depth (~1–71 m), pH (6.1–9.7), and nutrients (TP from 2 to 227 μg/L, TKN from 20 to 5000 mg/L, and dissolved silica from 0.1 to 35.4 mg/L) (Figure 1, Supplemental 1). The first two axes of a PCA ordination of the physical and chemical lake-water characteristics captured 73% of the variation with the main environmental gradients associated with conductivity, pH and associated variables dominating the first PCA axis (Figure 2A). Not surprisingly, pH, specific conductance, salinity, TKN and the base cations are all highly correlated (r > 0.78–0.97) (Table 1). Other water chemistry gradients were seen in the PCA including those associated with moderately correlated nutrients (TP, TKN, and DOC) which were negatively correlated with lake depth, as well as gradients associated with sulfate and chloride (Figure 2A, Table 1).

Figure 2. (A) Principal components analysis (PCA) biplot of the location of each of the 251 lakes (open circles) in relation to the standardized physical and chemical variables (mean 0, and unit variance) from these lakes, illustrating the approximate correlations and relative gradient lengths of the chemical and physical environmental variables. (B) A canonical correspondence analysis (CCA) biplot, of axis 1 vs. axis 2, showing the relationship between the diatom taxa (Hill's N2, a measure of species evenness across samples, of at least 5) and the forward-selected environmental variables from the surface-sediment diatom assemblages and measured environmental variables from the 251 calibration dataset. The environmental variables to which the species were constrained are shown by solid red arrows. An ordination based on all taxa that achieved a >2% relative abundance, with downweighting of rare taxa, resulted in the selection of the same environmental variables and in the same order of selection, suggesting the robust nature of the results presented above. The labeled diatom taxa (shown as triangles) represents the more abundant taxa (referred to as the dominant diatom taxa, and defined by all taxa that achieved a species evenness (Hill's N2) of at least 5 and a relative abundance of at least 10% in at least one sample). Taxa represented by crosses achieved a Hill's N2 of at least 5, but did not achieve a relative abundance of greater than 10%. Diatom taxa that did not achieve a Hill's N2 of at least 5, and were present at a relative abundance of greater than 2%, were not included in this ordination. Species corresponding to numbers on (B) are listed in Table 2. Abbreviations: Log Cond, log specific conductance; Log Sal, log salinity; Log TKN, Log total Kjeldahl nitrogen; Log TP, log total phosphorus; Log Cl, log chloride; Log DIC, log dissolved inorganic carbon; Log SO4, log sulfate; Log DOC, log dissolved organic carbon; Log Ca, log calcium; Log K, log potassium; Log Mg, log magnesium; Log Na, log sodium; and Log Si, log silica. Numbers represent taxa that can be identified from Table 2.
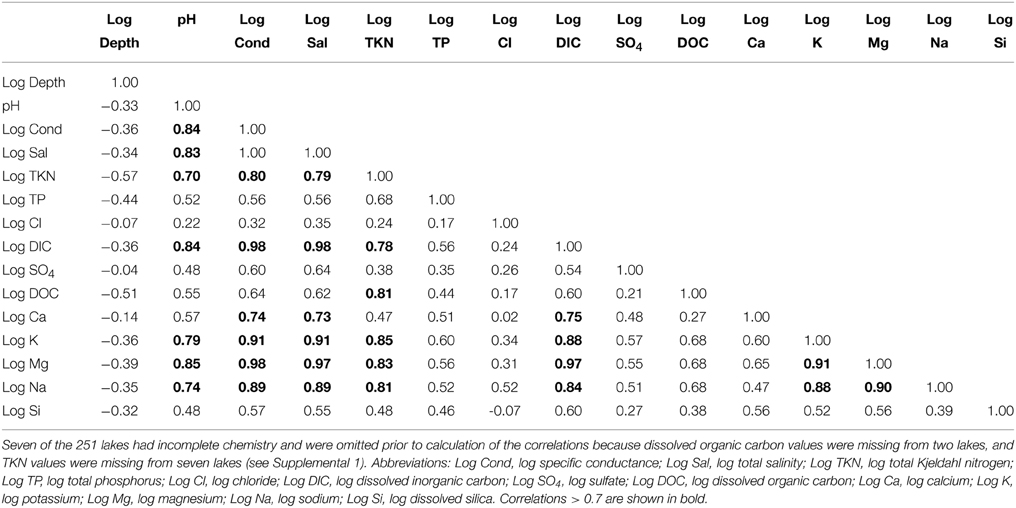
Table 1. Correlation matrix of the environmental variables in 244 calibration lakes for which complete chemistry was available.
A total of 209 diatom taxa that achieved a relative abundance of greater than 2% in at least one sample were identified in the 251-lake dataset. These 209 taxa accounted for an average relative abundance of 89% ± 8.8 of the total assemblage across all 251 samples. Of these taxa, 48 achieved a relative abundance of greater than 10% and had a Hill's N2 of greater than 5 (i.e., the dominant taxa), and accounted for an average relative abundance of 72.9% (±20.9) of the assemblage in the 251 lakes. An additional 79 taxa achieved a Hill's N2 of at least 5 (subsequently referred to as the subdominant taxa) and together with the dominant taxa accounted for a majority of the total relative abundance of the assemblage in all of the lakes (82.4% ± 17).
CCA ordinations were undertaken on the full (209 diatom taxa × 251 lake) dataset, as well as on the dominant and sub-dominant taxa (127 diatom taxa × 251 lake) dataset, both with and without a square-root transformation of the diatom taxa using a set of explanatory variables that included: specific conductance, depth, TP, Cl−, SO2−4, DOC, and Si. Specific conductance was chosen to act as a surrogate for the many highly correlated variables associated with this gradient in the dataset including: pH, salinity, TKN, DIC, and base cations due to high correlations among these variables (Table 1). In all analyses, similar patterns of species and sites emerged on the ordinations, with specific conductance, TP and log depth, consistently being identified as the environmental variables that could account for the largest amounts of variance in the diatom data. In all CCA ordinations, the eigenvalues of the first axis ranged from 0.4 (transformed dominant and subdominant diatoms) to 0.51 (all 209 taxa with no species transformations), with eigenvalues for axis 2 ranging from 0.17 (transformed dominant and subdominant taxa) to 0.27 (all 209 taxa, with no species transformations). In all cases, placement of the species and sample scores were similar. As an example, we show the CCA based on square-root transformed dominant and sub-dominant diatom taxa (127 taxa), seven environmental variables (specific conductance, TP, depth, Cl-, DOC, sulfate, and Si) were forward selected (Figure 2A). Deep-water, high-TP diatom taxa including Cyclostephanos invisitatus, Stephanodiscus hantzschii, and Stephanodiscus hantzshii v. tenuis plot in the lower-left quadrant, whereas deep-water, low-TP taxa such as Aulascoseira distans, Cyclotella glomerata, and Discostella stelligera plot in the right quadrants of the CCA ordination (Figure 2). Shallow-water, higher-TP benthic taxa including Navicula oblonga and Amphora libyca, plot in the upper-left quadrant of the ordination.
The single strongest environmental variables in all CCA ordinations was specific conductance (the eigenvalue of the first axis when constrained to specific conductance alone ranged from 0.37 to 0.46 depending on the full or dominant/subdominant dataset, with and without a square-root transformation). TP was the next strongest environmental variable in all ordinations (the eigenvalue of the first axis when constrained to TP alone ranged from 0.17 to 0.29 depending on the full or dominant/subdominant dataset, with and without a square-root transformation).
The dominant diatom taxa showed clear patterns in their estimated TP optima and tolerance across the TP gradient (Figure 3B). Only six dominant diatom taxa had an estimated TP optima > 30 μg/L (eutrophic), two taxa had optima >50 μg/L, and 11 had estimated TP optima < 10 μg/L (oligo-mesotrophic) (Figure 3B). The vast majority of the dominant taxa in this dataset fell within the meso-eutrophic category (10–30 μg/L). The dominant diatom taxa occurred in many lakes (27–200) and at relative abundances ranging from 10 to 92% (average = 36.3% ± 25.3) (Table 2). Although a species evenness (Hill's N2) of 5 was one of the criteria that was used to define a dominant taxa, Hill's N2 was much greater than five in the majority of samples, and even higher when calculated species optima were based on square-root transformed species abundances. Estimates of the species TP optima and tolerances for the dominant diatom taxa were highly similar between TP optima based on non-transformed and transformed species abundances (r > 0.96) with no apparent bias (Table 2).
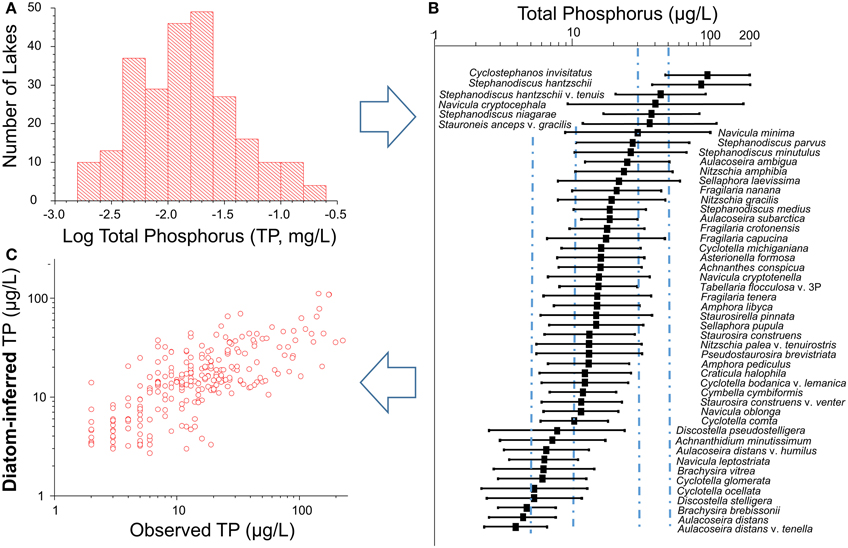
Figure 3. Schematic diagram showing the steps involved in developing a “training” set for inferring lake-water total phosphorus based on the species assemblages preserved in the surface sediments of 251 freshwater lakes from British Columbia. (A) Lakes were selected to span a large gradient of total phosphorus (TP) in freshwater lakes (salinity < 0.5 g/L) from which surface sediments were collected and analyzed for diatom assemblages and from which contemporary physical and chemical variables were collected; (B) estimates of the bootstrapped weighted-average optima (square) and tolerances (weighted standard deviation) of the dominant diatom taxa (relative abundance >10%; and Hill's N2 of at least 5. Vertical lines are shown at 5, 10, 30, and 50 μg/L TP, representing the boundaries between oligotrophic (< 5 μg/L), oligo-mesotrophic (5–10 μg/L), meso-eutrophic (10–30 μg/L) and eutrophic taxa (>30 μg/L) (Wetzel, 2001); (C) the relationship between observed TP-values in the 251 calibration lakes vs. the bootstrapped estimate of diatom-inferred TP. The correlation between the observed and diatom-inferred values is 0.74 (n = 251, p < 0.01).

Table 2. Estimates of simple weighted-average optima and tolerances for the dominant diatom taxa in the 251-lake calibration dataset, based on both untransformed and square-root transformed species data.
Models developed to infer lake-water TP based on weighted average calibration had moderate predictive abilities (e.g., Figure 3C). These models, were based on: (i) all 209 taxa, with and without square-root species transformations; and ii) on taxa that achieved a Hill's N2 of at least 5 (i.e., 127 dominant and subdominant taxa), with and without square-root species transformations. For all eight models, the apparent coefficient of determination varied only marginally from 0.57 to 0.63, with the bootstrapped coefficient of determination between 0.51 and 0.55. Similarly, the RMSEP varied between 0.31 and 0.32 for the models using inverse deshrinking, and between 0.37 and 0.4 for the models that used classical deshrinking.
Paleolimnological Analysis of Osoyoos Lake
Chronology
The total 210Pb activity in the north-basin core followed a significant exponential decay with core depth (r2 = 0.73, p < 0.01, n = 21), with a 0.14 Bq/g maximum toward the top of the core declining to ~ 0.06 Bq/g low at 80-cm depth. Measured 137Cs activity showed a distinct peak between 43 and 58 cm (maximum 137Cs of 0.046 Bq/g at 50.6 cm, approximately 4–5 × surface concentrations). The CRS model, based on the unsupported 210Pb concentrations, estimated that the last 200 years were contained in the 90-cm core, and the CRS date of 1963 occurred at a depth of ~ 42.5 cm, just slightly later than the 137Cs peak. The organic matter (OM) was low throughout the core ranging from 5 to 12%, with higher concentrations in the top 15 cm. Similarly, the total 210Pb activity in the south-basin core followed a significant exponential decay (r2 = 0.80, p < 0.01, n = 22), with 0.18 Bq/g maximum toward the core top declining to a low of ~ 0.05 Bq/g below 70 cm in the core. Measured 137Cs activity showed a distinct peak between 39 and 47 cm (maximum 137Cs of 0.043 Bq/g at ~43.5 cm, approximately 4–5 × surface concentrations). The CRS model estimated that the 99-cm core contained at least 200 years of sediment accumulation, and the CRS date of 1963 occurred at a depth of ~ 42.5 cm, close to the 137Cs maximum. The OM content is low throughout the core ranging from 3 to 13%, with higher concentrations in the top 15 cm. The age-depth relationship in both cores follows a strong and significant linear relationship in both cores (north core, r = 0.97; south core, r = 0.98).
Pigment and Diatom Changes
The cores from both the north and south basins indicated large changes in both pigments (Figure 4) and diatom assemblages (Figure 5) over the last 200 years. The changes through time are described below in three broad time periods: (i) a pre-disturbance period, c. 1800 to 1950; (ii) a period of nutrient enrichment, ~c. 1950 to 1990; and (iii) a period of recovery, post c. 1990. Throughout the cores, the planktonic taxa were in higher abundances than the benthic taxa.

Figure 4. Changes in the pigment concentrations from the dominant algal groups from the dated sediment cores from the north (A) and south (B) basins of Osoyoos Lake over the last 200 years. These pigments include: diatoxanthin (predominantly diatoms), echinenone (cyanobacteria), lutein (green algae), and alloxanthin (cryptophytes). The ratio of chlorophyll a: pheophytin is a widely used index of preservation, often an indicator of incomplete post-depositional processes. The blue rectangle represents the zone from which pigment concentrations begin to increase to c. 1990, when the dominant pigment, diatoxanthin, begins to decline, consistent with measured decreases of total phosphorus in modern water chemistry samples.
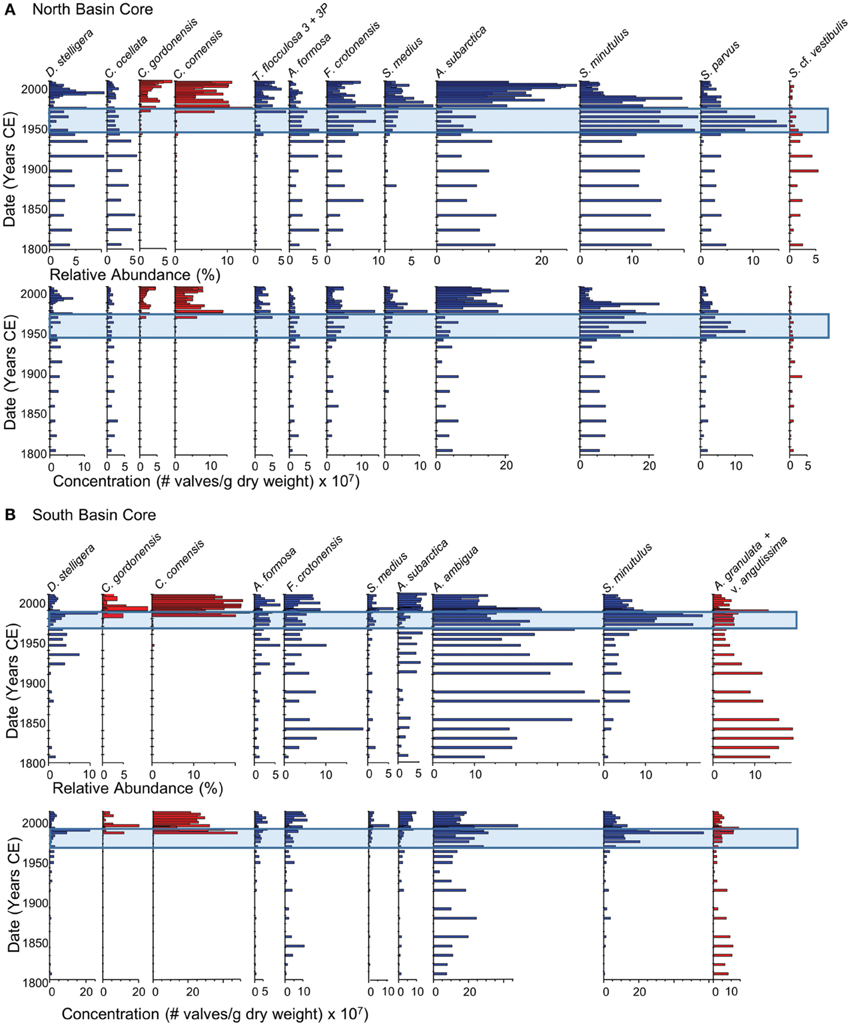
Figure 5. Summary of the changes in the relative abundance and concentrations of the dominant planktonic diatom taxa (>5% relative abundance) over the last 200 years in dated sediment cores from the north (A) and south (B) basins of Osoyoos Lake. Taxa are arranged from left to right based on increasing diatom-inferred total phosphorus optima (Table 2). Diatom taxa that were well-represented in the calibration data set are shown in blue (an N2-value of at least 5, and a minimum relative abundance of at least 10%), whereas diatom taxa that were poorly represented (N2 < 5) are shown in red. The blue rectangle represents the period of eutrophication.
Pre-disturbance Period (c. 1800–1950)
The pigment data from c. 1800 to 1950 illustrate the high concentrations of the diatom pigment diatoxanthin in both cores, with the core from the shallower southern basin having substantially much higher concentrations of all pigments in comparison to the north-basin core (Figure 4). In the north-basin core, pre-1950 levels of the cyanobacterial pigment echinenone, and the cryptophyte-associated pigment alloxanthin were lower in concentration than the pigment associated with green algae, lutein. In contrast, the south-basin core, pigment concentrations were equally represented by echinenone, lutein, and alloxanthin, which were all at higher concentrations in comparison to the north-basin core.
The diatom assemblages in the north- (Figure 5A) and south-basin cores (Figure 5B) were both indicative of meso-eutrophic conditions between c. 1800 and 1950. During this time, the diatom assemblages in the north-basin core included a number of planktonic taxa that are well-represented in the modern diatom assemblages including: diatom taxa with TP optima < 10 μg/L (D. stelligera and Cyclotella ocellata), taxa with TP optima between 10 and 20 μg/L (Asterionella formosa and Fragilaria crotonensis) as well as higher abundances of meso-eutrophic taxa (Aulacoseira subarctica and Stephanodiscus minutulus) and smaller relative abundances of the meso-eutrophic taxon Stephanodiscus parvus. In addition, Stephanodiscus cf. vestibulus, a taxon not represented in the modern calibration dataset, was present at small abundances (i.e., typically less than 5% relative abundance, Figure 5A). Diatom-inferred TP inferences from c. 1800 to 1950 generally varied between ~15 and 20 μg/L in the north-basin core (Figure 6). The largest difference in the c. 1800 to 1950 diatom assemblages in the south-basin core relative to the north-basin core, was the high and variable abundances of the meso-eutrophic taxon Aulacoseira ambigua. This species varied between 10 and 30% in the south basin, but did not achieve a relative abundance of >5% in the north-basin core (Figures 5A,B). The high relative abundance of this taxon is mirrored by its high concentrations, along with the relatively high abundance and concentrations of the meso-eutrophic taxon F. crotonensis, and the higher relative abundance and concentrations of Aulacoseira granulata v. angustissima, a taxon that is not well-represented in the modern calibration dataset (Figure 5B). In contrast to the relatively stable diatom-inferred mesotrophic conditions in the c. 1800–1950 period in the north-basin core, the diatom-inferred TP-values from c. 1800 to 1950 varied from ~15 to 35 μg/L in the south-basin core (Figure 6).
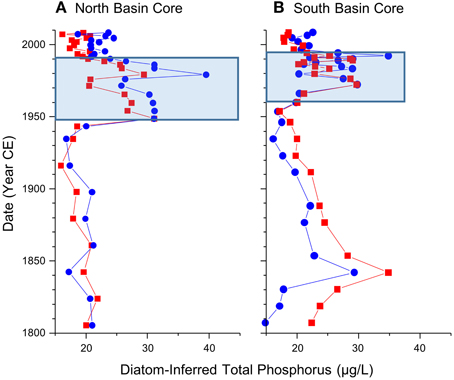
Figure 6. Diatom-inferred total phosphorus values, with (in red) and without (in blue) the poorly represented diatom taxa in the calibration dataset (i.e., taxa shown in red in Figure 5) from the dated sediment cores from the north (A) and south (B) basins of Osoyoos Lake over the last 200 years.
Nutrient-enrichment Period (c. 1950–1990)
Starting in the late 1950s in the northern core, and 1960 in the southern core, pigment concentrations began to increase from relatively stable background levels, and increased by ~2–3 times background concentration for all algal groups (Figure 4). Starting in the 1950s in the northern core, there was an increase in the relative abundance and concentration of the meso-eutrophic taxa S. minutulus and S. parvus, with corresponding decreases in the relative abundance and concentrations of A. subarctica, as well as decreases in the relative abundance of the oligo-mesotrophic taxa D. stelligera and C. ocellata (Figure 5A). In the southern core, increases in the relative abundance and concentrations of the more nutrient-rich taxon, S. minutulus occurred c. 1960, with a corresponding decrease in the relative abundance of A. ambigua, which occurred despite an increase in the concentration of this taxon (Figure 5B). These changes resulted in increases in the diatom-inferred TP from ~15–20 μg/L to 20–40 μg/L between 1950 and 1990 in the northern core (Figure 6A), and similar increases at this time in the southern core (Figure 6B).
Recovery Period (Post 1990)
Starting in the late 1980s/early 1990s in both cores, there was generally a decrease in the concentration of diatoxanthin, the dominant pigment in both cores, whereas the concentrations of echinenone, lutein, and alloxanthin remain relatively stable (Figure 4). The ratio of chlorophyll a to pheophytin, a commonly used indicator of preservation (Guilizzoni and Lami, 2003), remained elevated in the post-1990 period in both cores (Figure 4). In both cores, there were decreases in the relative abundance and concentrations of the most nutrient-rich diatom taxa (S. parvus and S. minutulus in the northern core, and S. minutulus and A. ambigua in the southern core), and resulting increases in the relative abundance and concentrations of many mesotrophic taxa with lower TP optima including A. subarctica (Figure 5). Taxa that are not well-represented in the modern calibration set, Cyclotella comensis and Cyclotella gordonensis, increased in both relative abundance and concentration (Figure 5). Diatom-inferred TP inferences similarly decrease, with and without the poorly represented taxa in the calibration set (Figure 6). The diatom-inferred TP-values between 1950 and 1990 of between 20 and 40 μg/L compare favorably with the measured spring TP between 1969 and 1990 that ranged from ~18 to 37 μg/L (mean 27 ± 7 μg/L, n = 14). Similarly, the post-1990 diatom-inferred values were typically between 15 and 25 μg/L, only slightly higher than the measured values between 1990 and 2009 of between ~6 and 25 μg/L (mean = 17 ± 5 μg/L, n = 14).
Statistical Analyses
The correlations between the main directions of variation in the dominant diatom taxa in the cores from Osoyoos Lake, based on both non-transformed and square-root transformed species abundances, and the diatom-based TP reconstructions (four models: all taxa; all taxa following a square-root transformation; taxa with N2 > 5; and taxa with an N2 > 5 following a square-root transformation) were calculated over the past 200 years, in the north- and south-basin cores. The dominant diatom taxa in the north-basin sediment core accounted for ~73 ± 4% of the overall abundance of diatom taxa (Figure 5A). In the northern core, the PCA axis-1 (r = 0.93) and PCA axis-2 scores (0.90) between the non-transformed and transformed diatom taxa were high, as were all of the diatom-based TP reconstructions (correlations between models ranged from 0.86 to 0.99). The diatom-based TP reconstructions were all highly correlated to the PCA axis-2 scores (mean r = 0.91 ± 0.04). However, the λR/λP ratio was relatively low, ranging from 0.24 to 0.29. Similar patterns were seen in the core from the southern basin. In the southern core, the dominant diatom taxa accounted for ~79 ± 4% of the overall abundance of diatom taxa (Figure 5B). The correlation between the PCA axis-1 (r = 0.98) and PCA axis-2 scores (0.63) between the non-transformed and transformed diatom taxa were high, but with a slightly weaker correlation between the axis-2 scores in comparison to the northern core. As in the northern core, the diatom-based TP reconstructions between the four models were highly correlated (mean r = 0.68 ± 0.14), but the agreement was not as strong as in the northern core. In the southern core, the λR/λP ratio was relatively low, ranged from 0.16 to 0.38, a range much more variable than seen in the northern core.
The vast majority of the diatom taxa that were present in the Osoyoos Lake cores (i.e., taxa represented in blue in Figures 5A,B) are well-represented as dominant diatom taxa in the modern calibration dataset (Table 2), with four exceptions. Taxa present but poorly represented in the modern calibration dataset include C. gordonensis and C. comensis, which together occur at a maximum of 10% relative abundances in the modern calibration dataset, but with a species evenness (Hill's N2) of only 2.8. Another taxon, A. granulata v. angustissima occurs in the calibration dataset at a maximum abundance of ~24%, but with a low species evenness (N2 = 3.4). Finally, S. cf. vestibulis is not represented in the modern calibration dataset. The diatom-based TP reconstructions without these poorly represented taxa, were highly similar (e.g., Figure 6).
Discussion
Modern-day Calibration Dataset
Algae have historically been a widely used biological proxy for environmental conditions (e.g., reviewed in Stevenson, 2014). Our 251-lake dataset represents one of the largest calibration datasets developed to examine the relationship between diatom assemblages and important limnological variables, including nutrient concentrations. The large gradients in lake-water chemistry in freshwater lakes (i.e., < 0.5 g/L salinity) in this study reflect the tremendous limnological diversity in British Columbia lakes (Figure 2A, Supplemental 1), which range from extremely low-TP waters to lakes with greater than 200 μg/L of TP. Using correlations and PCA analyses, we identified strong associations between dissolved inorganic carbon and base cation concentrations, as well as conductivity and salinity (Table 1, Figure 2A). Fortunately, TP is only moderately correlated with these variables (Table 1, Figure 2A), thereby allowing the development of a diatom-based transfer function for TP that is at least partially independent from other key environmental gradients. Our application of this model to diatom stratigraphies in sediment cores from Osoyoos Lake, together with the comparison of these data to sedimentary pigment data and water chemistry measurements from the lake, provide further confidence in the validity of our inferences of past lake-water trophic state.
Within the 251-lake calibration set, the dominant (maximum relative abundance >10%, and represented equally in at least five samples) 48 diatom taxa accounted for a mean of 73% of the total assemblage in all lakes, and together with the subdominant taxa accounted for a mean of 82%. The constrained ordinations undertaken on the full diatom dataset of 209 taxa, and the 127 dominant and subdominant taxa, both with or without a square-root transformations, resulted in similar forward-selected environmental variables, eigenvalues, and placement of taxa and lakes, revealing the robustness of this dataset to species transformations. The importance of specific conductance and related variables (pH, DIC), and TP as environmental variables that maximize the dispersion of diatom taxa in the 251-lake dataset is not surprising given the importance of osmotic stress, pH and nutrients from a physiological perspective. Many previous studies have consistently identified conductivity (e.g., Wilson et al., 1996), pH (e.g., Battarbee et al., 2010) and nutrients (e.g., Hall and Smol, 2010; Reavie et al., 2014) as important limnological variables influencing the distribution of diatom assemblages. Estimates of the optima of the dominant taxa to lake-water TP in this dataset, reveal fewer dominant taxa at the extreme ends of the TP gradient, which is not surprising given the physiological constraint associated with coping with too little, or too much phosphorus, as well as the relative rarity of these oligotrophic and more eutrophic lakes (Figure 3A). Of the dominant 48 diatom taxa (Figure 3B) half are planktonic species, and half are benthic species, and the estimates of species optima are extremely resilient to species transformations, as similar TP optima were estimated with and without a square-root transformation of the species data (Table 2).
There has been an active discussion in the paleolimnological community regarding the strength and validity of tracking past conditions, including phosphorus from modern samples. In this study, estimates of the species optima are provided for the dominant diatom taxa (Figure 3, Table 2). A comparison of the relative TP optima between the dominant planktonic taxa in our dataset (Figure 3) with the dominant planktonic taxa from another large dataset from the Laurentian Great Lakes (Reavie et al., 2014), shows strong and significant correlation for the 17 planktonic taxa that are in common (r = 0.69, p = 0.002), whereas the correlation of the TP optima of the 11 benthic taxa in common is not significant (r = 0.15, p = 0.66). In an examination of eight relatively small regional datasets (each dataset between 42 and 152 lakes, median ~68) Juggins et al. (2013) found only 7 of 28 comparisons (or 25%) yielded significant, but weak correlations between the TP optima of benthic taxa, but 9 of 14 (or 64%) resulted in significant and much stronger correlations for planktonic taxa. These results are consistent with earlier observations of the weaker TP responses of benthic taxa that has been noted especially in shallow lakes (e.g., Bennion et al., 2001; Davidson and Jeppesen, 2013). Lower coherence between common benthic taxa across calibrations sets has been suggested to be related to the higher complexity of the benthic habitats and sedimentary nutrient sources (Bennion et al., 2010; Davidson and Jeppesen, 2013). We suggest that comparing taxa that are in common, but poorly represented between relatively small datasets, can introduce noise into comparisons of optima. The stronger correlations between estimates of TP optima from larger datasets is because such datasets provide more rigorous estimates of optima due to higher abundances and occurrences of the dominant taxa. If we had used the inclusion criterion of Juggins et al. (2013) (i.e., that a taxon must occur in at least 10 samples), we would have increased the number of common taxa in our training set by 100 taxa, which would have caused poor comparison of optima between these poorly represented taxa. Our stricter definition of a dominant taxon in addition to using a large dataset are likely why transformed or non-transformed estimates of TP optima for the dominant taxa are of the same magnitude and highly correlated (r = 0.96).
The influence of our 251-lake dataset in determining species optima to TP is further shown by comparing optima from a dataset based on 64 lakes from B.C. (Reavie et al., 1995a). Of the 48 dominant taxa in the 251-lake dataset (Table 2), only 22 are present in the smaller 64-lake dataset from B.C. with a range in taxa optima from 6 to 42 μg/L (Reavie et al., 1995a) in comparison to 4 to almost 100 μg/L in the 251-lake dataset. The estimates of taxa with high TP optima in the 251-lake dataset are underestimated in the 64-lake dataset (Reavie et al., 1995a), whereas taxa with low TP optima in the 251-lake dataset are overestimated. Examples of the underestimates of taxa with the highest TP optima in the 251-lake dataset include: 87 vs. 14 μg/L for S. hantzschii, 43 vs. 15 μg/L in the smaller dataset for S. hantzschii v. tenuis, 44 vs. 17 μg/L for S. parvus, 33 vs. 14 μg/L for S. minutulus, and 35 vs. 22 μg/L for A. ambigua. Similarly, the TP optima with low TP taxa in the 251-lake dataset are overestimated in the smaller dataset (e.g., 4 vs. 15 μg/L for A. distans, 5 vs. 14 μg/L for D. stelligera, 5 vs. 20 μg/L for C. ocellata). Based on these estimates of TP optima, depending on the taxa present in a core (Reavie et al., 1995b, 2000), past approaches could result in an overestimation of TP-values if more oligotrophic taxa were present, or an underestimation if more eutrophic taxa were present. This bias is likely present in other regions besides British Columbia, since smaller calibration datasets are normally used in the development of lake-water TP models (i.e., of the 23 calibration datasets summarized by Hall and Smol (2010), the number of lakes range from 30 to 238 lakes, with a median dataset size of 53 lakes), and larger datasets appear to be the exception (Dixit et al., 1999; Reavie and Edlund, 2013; Reavie et al., 2014).
In the 251-lake dataset there was little difference in the predictive abilities of the TP inference models developed using all taxa, and/or only the dominant and subdominant taxa, with or without species transformations based on analyses of the 251-lake dataset. All TP inference models had moderate predictive abilities with apparent coefficients of determination of between 0.57 and 0.63 and bootstrapped values between 0.51 and 0.55 (e.g., Figure 3C). This is well within the range of 0.31 to 0.82 reported from the 17 studies that reported these values (mean = 0.55; standard deviation = 0.18) (Hall and Smol, 2010). However, the models from the 251-lake dataset represent an improvement over many of these smaller calibration datasets. For example, the 46-lake dataset of Hall and Smol (1992) from B.C. had a relatively high apparent coefficient of determination of 0.78, which declined to 0.28 when bootstrapped (Cumming et al., 1995), due to a lack of redundancy in taxa that could not be reproduced upon bootstrapping. When the Hall and Smol (1992) dataset was augmented to include 18 additional lakes (Reavie et al., 1995a), the coefficient of determination after bootstrapping increased to 0.46.
Much effort has gone into investigating the optimal sample size for diatom-based inference models for inferring pH and salinity, as well as lake-water TP (Wilson et al., 1996; Reavie and Juggins, 2011; Bennett et al., 2014), mainly using model performance parameters including model coefficient of determination, error and bias, and have normally resulted in estimates of at least 50 samples. However, this current study suggests an assessment of the minimum number of lakes to produce good indicators of model performance, is not the same question as developing a calibration dataset with the goal of producing precise and accurate estimates of species parameters (e.g., optima) of the taxa that are present in the cores. The number of lakes required for the latter is much greater than the former, and at this point, our current 251-lake dataset only adequately represents the species optima to TP for 48 taxa, albeit taxa that are common and abundant in many lakes. Modern calibration datasets will need to be much larger, if taxa in the cores occur at a higher abundance than taxa in the modern calibration datasets.
Paleolimnological Analysis of Osoyoos Lake
The present study is based on longer, better-dated sediment cores, allowing a more thorough reconstruction of human impacts on the lake than in the earlier paleoenvironmental studies of Osoyoos Lake (Anderson, 1973; Pinsent and Stockner, 1974; Ryder, 1994). This study employed a multiproxy analysis of primary producers using algal pigments and several metrics based on the modern ecological characteristics of diatom assemblages, including relative abundances and concentration changes, proxies that were not undertaken in earlier studies. These proxies provide estimates of background conditions, evidence of cultural eutrophication starting in the 1950s, and subsequent recovery from eutrophication starting c. 1990, a trend also apparent in the long-term water chemistry measurements. Changes in the planktonic diatom taxa were emphasized because planktonic taxa are better indicators of lake-water TP (see earlier), and also an important component of the diatom flora in the Osoyoos Lake (Figure 5). The various metrics that were used to assess the strength of the diatom-based TP reconstructions, indicate that the reconstructions do track a main direction of variation in the diatom assemblages (as indicated by the strong correlation with PCA axis-2 scores), but that other factors are also important. The main direction of variation (the PCA axis-1 scores) tracks the abrupt change in diatom assemblages c. 1990, which is consistent with declines in TP concentration, but is likely also linked to more complex changes in Osoyoos Lake that may be related to climate.
Background conditions of trophic status of the north basin suggest meso-eutrophic background conditions from c. 1800 to c. 1950. These estimates were based on the pigments, the relative abundances and concentrations of diatom taxa, and associated diatom-based TP inferences of meso-eutrophic background conditions (Figure 6). Prior to 1950, pigment concentrations in both cores were lower than post-1950 concentrations. All diatom taxa in the north core are well represented by dominant taxa in the calibration dataset, with the exception of S. cf. vestibulus, a taxon that was present at a low abundance, suggesting the taxa optima on which the TP inferences are based are reliable. The background conditions c. 1800 to pre-1960 period in the south basin of Osoyoos Lake suggests meso-eutrophic conditions, but with more variability in the background conditions in comparison to the core from the northern basin. During this period, pigment concentrations in the southern core were also relatively low and relatively stable between 1800 and 1960 in comparison to post-1960 concentrations, but concentrations were approximately double the values seen in the northern core (Figure 4). The dominant diatom taxon in the southern basin was A. ambigua, a meso-eutrophic diatom (Figure 3, Table 2), which fluctuated between 10 and 30% relative abundance from c. 1800 to 1960 (Figure 5). The diatom taxon, Aulacoseira granulata v. angutissima had sustained relative abundances of over 10% between c. 1800 and 1850, which contributes to the higher TP inferences due to a high TP optimum for this taxon in the 251-lake calibration (74 μg/L). However, the TP optimum for this taxon is based on data where it did not achieve a species evenness > 5 (Hill's N2-value = 3.4 with 14 occurrences). Nonetheless, the TP inferences remained high once all taxa with Hill's N2-values < 5 were eliminated (Figure 6), suggesting that the reconstruction is only partially sensitive to the elimination of A. granulata v. angustissima. Larger variation in the TP-values prior to 1950 could be due to the shallower nature of the southern basin (maximum depth of ~23 m, in comparison to the northern basin that has a maximum depth in excess of 60 m) that could make it more sensitive to changes in settlement, climate and/or factors associated with salmon migration. The higher concentrations of pigments in the southern basin in comparison to the northern basin is also likely due to the higher preservation of pigments at shallower sites (Cuddington and Leavitt, 1999).
The pigment and diatom proxy data infer an increase in primary producers in Osoyoos Lake beginning c. 1950 in the northern basin and c. 1960 in the southern core, likely associated with the enhanced loading from point- and non-point sources (Jensen and Epp, 2002) due to the exponential growth of human activities in the Okanagan since the 1940s. Increases in algal pigments occur in both cores, and there were increases in the relative abundance and concentrations of diatom taxa with higher TP optima including S. minutulus and S. parvus in the northern core, and S. minutulus and A. granulata v. angustissima in the southern core, as well as increases in the concentration of A. ambigua (Figure 5). The abundances of these taxa remain elevated until c. 1990, as do the diatom-based TP inferences (Figure 6). The diatom-based TP increases correspond with increases in the concentrations of all pigments c. 1950 in the northern core and c. 1960 in the southern core, a trend that equates to an approximate doubling in the dominant sedimentary pigment diatoxanthin, a robust diatom indicator (Leavitt and Hodgson, 2001). The increased pigments c. 1950/1960 is not an artifact of changes in pigment preservation with sediment depth because the ratio of chl a: total phaeopigments (Figure 4), a common and conservative metric for evaluating diagenesis (Guilizzoni and Lami, 2003), was relatively stable from c. 1800 to ~2000. The earlier onset of eutrophication in the northern and southern basins cannot be discerned with a high degree of certainty, given the relatively low unsupported 210Pb activities in both cores.
Post-1990 changes in the cores are consistent with the controls on nutrient loading, especially the enhanced P removal at municipal sewage treatment facilities (Jensen and Epp, 2002). The diatoxanthin concentrations decrease post-1990, but the chl a: total phaeopigment ratio is elevated, suggesting that diagenetic processes are not complete, and that measured pigment concentrations may be an overestimate (Figure 4). There were large changes in the diatom assemblage from both basins c. 1990, where there were decreases in the abundances and concentrations of more eutrophic taxa in both cores, and pronounced increases in C. gordonensis and C. comensis. These two taxa were poorly represented in our 251-lake calibration dataset achieving a Hill's N2 of only 2.8. (i.e., effectively present in only 2.8 lakes, but occurred in 9 lakes). The removal of the taxa with an N2 < 5 from the inference model, resulted in a similar decrease in the diatom-inferred TP-value to generally < 20 μg/L in both the northern and southern basins, consistent with a decrease in the mean spring lake-water TP concentrations between 1969 and 1990 of 10 μg/L.
The abrupt appearance of C. gordonensis and C. comensis, taxa that did not exist in this lake before the 1990s, suggests that other environmental changes, apart from the decreases in TP, may have occurred. Recent increases in small Cyclotella species (including C. comensis/gordonensis group) have been noted in many lakes and have been attributed to climate-related changes, including enhanced ice-free periods and stratification (Rühland et al., 2008). However, in the Osoyoos Lake sediment cores Aulacoseira taxa increased, a taxon that has been noted to decline in other studies, and thus surmised to further support enhanced stratification as a potential mechanism for the rises in Cyclotella (e.g., Rühland et al., 2008). Saros and Anderson (2014) emphasize the importance of the ecology of individual Cyclotella taxa and stress the importance of several factors, including nutrients, dissolved organic carbon and light. The present study cannot deduce the actual mechanism behind the increase in C. comensis/gordonensis. This new assemblage is likely the result of other limnological changes (including changes in seasonality) perhaps influenced by warmer conditions experienced in the Okanagan over the past several decades and/or changes in precipitation patterns (Pacific Climate Impact Consortium, 2010) that can impact lake dynamics. However, studies on the seasonality of these taxa would be an important first step to understanding their recent increases in Osoyoos Lake.
In conclusion, the development of strong and appropriate diatom-based inference models inferring lake-water TP is challenging. Large diatom-based datasets allow better estimates of modern relationships than smaller datasets, because more taxa with higher abundances and more even occurrences are encountered. Estimates of species optima to any environmental variable, need to be critically assessed, especially when these estimates are based on low abundances and occurrences, as is typical of many small calibration datasets. Sediment cores from the north and south basins from Osoyoos Lake were investigated using sediment pigments and diatom assemblages to infer background conditions, assess the timing of cultural eutrophication, and assess if biological proxies could track post-1990 trends in improved water quality associated with mitigation efforts in the watershed. Both basins of Osoyoos Lake were inferred to be mesotrophic, and became increasingly eutrophic in the mid-20th century co-incident with the onset of rapid population growth and nutrient loading in the Okanagan. Mitigation efforts have resulted in diatom-inferred TP levels declining to values similar to pre-disturbance values (pre-1950), albeit with a different diatom assemblage. Multiproxy paleolimnological approaches are the only way to provide key insights into changes in lakes over centuries that can be helpful in understanding long-term trophic dynamics which can be helpful in developing realistic mitigation targets.
Conflict of Interest Statement
The authors declare that the research was conducted in the absence of any commercial or financial relationships that could be construed as a potential conflict of interest.
Acknowledgments
The modern calibration work was funded by an NSERC Discovery Grant RGPIN/170321 to BC and in-kind support from B.C. Ministry of the Environment (BCMOE), as well as the logistical support provided by: Bob Grace, Kris Williams, Norm Zirnhelt, and Vic Jensen. We would like to thank the Okanagan Basin Water Board, Osoyoos Lake Water Quality Society, Okanagan Nation Alliance, British Columbia Ministry of Environment, and the University of British Columbia Okanagan for their support of the paleolimnology research on Osoyoos Lake, including the grant contributions provided by the Okanagan Basin Water Board and the BCMOE. The pigment work was funded by an NSERC Discovery Grant to IG. We thank MacKenzie Waller for her mapping skills that resulted in Figure 1. We also thank the two reviewers and many of our colleagues from PEARL for providing valuable comments on earlier version of this paper.
Supplementary Material
The Supplementary Material for this article can be found online at: https://www.frontiersin.org/article/10.3389/fevo.2015.00084
References
Anderson, T. W. (1973). Historical Evidence of Land Use in a Pollen Profile from Osoyoos Lake, British Columbia. Report of Activities, Paper 73-1 Part A (Geological Survey of Canada), 178–180. doi: 10.4095/105155
Appleby, P. G., and Oldfield, F. (1978). The calculation of lead-210 dates assuming a constant rate of supply of unsupported 210Pb to the sediment. Catena 5, 1–8. doi: 10.1016/S0341-8162(78)80002-2
Battarbee, R. W. (1999). The importance of paleolimnology to lake restoration. Hydrobiologia 395–396, 149–159. doi: 10.1023/A:1017093418054
Battarbee, R. W., Anderson, N. J., Jeppesen, E., and Leavitt, P. R. (2005). Combining paleolimnological and limnological approaches in assessing lake ecosystem response to nutrient reduction. Freshw. Biol. 50, 1772–1780. doi: 10.1111/j.1365-2427.2005.01427.x
Battarbee, R. W., Charles, D. F., Bigler, C., Cumming, B. F., and Renberg, I. (2010). “Diatoms as indicators of lake-water acidity,” in The Diatoms: Applications for the Environmental and Earth Sciences, eds J. P. Smol and E. F. Stoermer (Cambridge: Cambridge University Press), 98–121. doi: 10.1017/CBO9780511763175.007
Battarbee, R. W., and Keen, M. J. (1982). The use of electronically counted microspheres in absolute diatom analysis. Limnol. Oceanogr. 27, 184–188. doi: 10.4319/lo.1982.27.1.0184
Beaulieu, M., Pick, F., and Gregory-Eaves, I. (2013). Nutrients and water temperature are significant predictors of cyanobacterial biomass in a 1147 lakes data set. Limnol. Oceanogr. 58, 1736–1746. doi: 10.4319/lo.2013.58.5.1736
Bennett, J. R., Sisson, D. R., Smol, J. P., and Cumming, B. F. (2014). Optimizing taxonomic resolution and sampling effort to design cost-effective ecological models for environmental assessment. J. Appl. Ecol. 51, 1722–1732. doi: 10.1111/1365-2664.12312
Bennion, H., Appleby, P., and Phillips, G. (2001). Reconstructing nutrient histories in Norfolk Broads, UK: implications for the role of diatom-total phosphorus transfer functions in shallow lake management. J. Paleolimnol. 26, 181–204. doi: 10.1023/A:1011137625746
Bennion, H., Sayer, C. D., Tibby, J., and Carrick, H. J. (2010). “Diatoms as indicators of environmental change in shallow lakes,” in The Diatoms: Applications for the Environmental and Earth Sciences, eds J. P. Smol and E. F. Stoermer (Cambridge: Cambridge University Press), 152–173. doi: 10.1017/CBO9780511763175.009
Binford, M. W. (1990). Calculation and uncertainty analysis of 210Pb dates for PIRLA project lakes sediment cores. J. Paleolimnol. 3, 253–267. doi: 10.1007/BF00219461
Birks, H. J. B., Heiri, O., Seppä, H., and Bjune, A. E. (2010). Strengths and weaknesses of quantitative climate reconstructions based on late-Quaternary biological proxies. Open Ecol. J. 3, 68–110. doi: 10.2174/1874213001003020068
Birks, H. J. B., Line, J. M., Juggins, S., Stephenson, A. C., and ter Braak, C. J. F. (1990). Diatoms and pH reconstruction. Philos. Trans. R. Soc. Lond. B 327, 263–278. doi: 10.1098/rstb.1990.0062
Birks, H. J. B., and Simpson, G. L. (2013). ‘Diatoms and pH reconstructions’ (1990) revisited. J. Paleolimnol. 49, 363–371. doi: 10.1007/s10933-013-9697-7
Charles, D. F., Binford, M. W., Furlong, E. T., Hites, R. A., Mitchell, M. J., Norton, S. A., et al. (1990). Paleoecological investigation of recent lake acidification in the Adirondack Mountains, N.Y. J. Paleolimnol. 3, 195–241.
Cuddington, K., and Leavitt, P. R. (1999). An individual-based model of pigment flux in lakes: implications for organic biogeochemistry and paleoecology. Can. J. Fish. Aquat. Ecol. 56, 1964–1977. doi: 10.1139/f99-108
Cumming, B. F., Wilson, S. E., Hall, R. I., and Smol, J. P. (1995). “Diatoms from British Columbia (Canada) Lakes and their relationship to salinity, nutrients and other limnological variables (with 248 figures, 6 tables and 1041 photos on 60 plates),” Bibliotheca Diatomologica, Vol. 31 (Stuttgart), 207.
Davidson, T. A., and Jeppesen, E. (2013). The role of palaeolimnology in assessing eutrophication and its impact on lakes. J. Paleolimnol. 49, 391–410. doi: 10.1007/s10933-012-9651-0
Dean, W. E. (1974). Determination of carbonate and organic matter in calcareous sediments and sedimentary rocks by loss on ignition: comparison with other methods. J. Sediment. Petrol. 44, 242–248.
Dixit, S. S., Smol, J. P., Charles, D. F., Hughes, R. M., Paulsen, S. G., and Collins, G. B. (1999). Assessing water quality changes in the lakes of the Northeastern United States using sediment diatoms. Can. J. Fish. Aquat. Sci. 56, 131–152. doi: 10.1139/f98-148
Dodds, W. K., Bouska, W. W., Eitzmann, J. L., Pilger, T. J., Pitts, K. L., Riley, A. J., et al. (2008). Eutrophication of U.S. freshwaters: analysis of potential economic damages. Environ. Sci. Technol. 43, 12–19. doi: 10.1021/es801217q
Elliott, J. A., Jones, I. D., and Thackeray, S. J. (2006). Testing the sensitivity of phytoplankton communities to changes in water temperature and nutrient load, in a temperate lake. Hydrobiologia 559, 401–411. doi: 10.1007/s10750-005-1233-y
Ginn, B. K., Rühland, K. M., Young, J. D., Hawryshyn, J., and Quinlan, R. (2012). The perils of using sedimentary phosphorus concentrations for inferring long-term changes in lake nutrient levels: comments on Hiriart-Baer et al., 2011. J. Great Lakes Res. 38, 825–829. doi: 10.1016/j.jglr.2012.09.002
Glew, J. (1991). Miniature gravity corer for recovering short sediment cores. J. Paleolimnol. 5, 285–287. doi: 10.1007/BF00200351
Guilizzoni, P., and Lami, A. (2003). “Paleolimnology: use of algal pigments as indicators,” in Encyclopedia of Environmental Microbiology, ed G. Bitton (New York, NY: Wiley), 2306–2317. doi: 10.1002/0471263397.env313
Hall, R. I., and Smol, J. P. (1992). A weighted-averaging regression and calibration model for inferring total phosphorus concentrations from diatoms in British Columbia (Canada) lakes. Freshw. Biol. 27, 417–434. doi: 10.1111/j.1365-2427.1992.tb00551.x
Hall, R. I., and Smol, J. P. (2010). “Diatoms as indicators of lake eutrophication,” in The Diatoms: Applications for the Environmental and Earth Sciences, eds J. P. Smol and E. F. Stoermer (Cambridge: Cambridge University Press), 122–151. doi: 10.1017/CBO9780511763175.008
Jensen, V., and Epp, P. F. (2002). Water quality trends in Okanagan, Skaha and Osoyoos Lakes in response to nutrient reductions and hydrologic variation. Penticton, BC: Ministry of Water and Air Protection. Available online at: http://www.env.gov.bc.ca/epd/regions/okanagan/waterqual/pdf/EBMpapermain2.pdf
Jensen, V., Sokal, M., St. Hilaire, D., Rieberger, K., and McQueen, D. (2012). Water Quality Assessment and Objectives for Osoyoos Lake: A First Update. British Columbia Ministry of the Environment Technical Report. Available online at: http://www.env.gov.bc.ca/epd/regions/okanagan/waterqual/pdf/osoyoos_wqo_final2012.pdf
Jöhnk, K. D., Huisman, J., Sharples, J., Sommeijer, B., Visser, P. M., and Stroom, J. M. (2008). Summer heatwaves promote blooms of harmful cyanobacteria. Glob. Change Biol. 14, 495–512. doi: 10.1111/j.1365-2486.2007.01510.x
Juggins, S. (2003). C2 version 1.7.5. Software for Ecological and Palaeoecological Data Analysis and Visualization. Newcastle upon Tyne: University of Newcastle.
Juggins, S. (2013). Quantitative reconstructions in paleolimnology: new paradigm or sick science? Q. Sci. Rev. 64, 20–32. doi: 10.1016/j.quascirev.2012.12.014
Juggins, S., Anderson, N. J., Hobbs, J. M. R., and Heathcote, A. J. (2013). Reconstructing epilimnetic total phosphorus using diatoms: statistical and ecological constraints. J. Paleolimnol. 49, 373–390. doi: 10.1007/s10933-013-9678-x
Kosten, S., Huszar, V. L. M., Becares, E., Costa, L. S., Van Donk, E., Hansson, L. A., et al. (2012). Warmer climates boost cyanobacterial dominance in shallow lakes. Glob. Change Biol. 18, 118–126. doi: 10.1111/j.1365-2486.2011.02488.x
Krammer, K., and Lange-Bertalot, H. (1986). “Bacillariophyceae. 1. Teil: Naviculaceae,” in Süßwasserflora von Mitteleuropa Band 2/1, eds H. Ettl, G. Gärtner, J. Gerloff, H. Heynig, and D. Mollenhauer (Stuttgart; New York: Gustav Fischer Verlag), 876.
Krammer, K., and Lange-Bertalot, H. (1988). “Bacillariophyceae. 2. Teil: Bacillariaceae, Epithemiaceae, Surirellaceae,” in Süßwasserflora von Mitteleuropa Band 2/2, eds H. Ettl, G. Gärtner, J. Gerloff, H. Heynig, and D. Mollenhauer (Stuttgart; New York: Gustav Fischer Verlag), 596.
Krammer, K., and Lange-Bertalot, H. (1991a). “Bacillariophyceae. 3. Teil: Centrales, Fragilariaceae, Eunotiaceae,” in Süßwasserflora von Mitteleuropa, Band 2/3, eds H. Ettl, G. Gärtner, J. Gerloff, H. Heynig, and D. Mollenhauer (Stuttgart; Jena: Gustav Fischer Verlag), 576.
Krammer, K., and Lange-Bertalot, H. (1991b). “Bacillariophyceae. 4. Teil: Achnanthaceae Kritische Ergänzungen zu Navicula (Lineolatae) und Gomphonema,” In Süßwasserflora von Mitteleuropa, Band 2/3, eds H. Ettl, G. Gärtner, J. Gerloff, H. Heynig, and D. Mollenhauer (Stuttgart; Jena: Gustav Fischer Verlag), 437.
Laird, K. R., and Cumming, B. F. (2001). A regional paleolimnological assessment of the impact of clearcutting on lakes from the central interior of British Columbia. Can. J. Fish. Aquat. Sci. 58, 492–505. doi: 10.1139/f00-264
Laird, K. R., Cumming, B. F., and Nordin, R. (2001). A regional paleolimnological assessment of the impact of clearcutting on lakes from the west coast of Vancouver Island, British Columbia. Can. J. Fish. Aquat. Sci. 58, 479–491. doi: 10.1139/f00-265
Leavitt, P. R. (1993). A review of factors that regulate carotenoid and chlorophyll deposition and fossil pigment abundance. J. Paleolimnol. 9, 109–127. doi: 10.1007/BF00677513
Leavitt, P. R., and Findlay, D. L. (1994). Comparison of fossil pigments with 20 years of phytoplankton data from eutrophic Lake 227, Experimental Lakes Area, Ontario. Can. J. Fish. Aquat. Sci. 51, 2286–2299. doi: 10.1139/f94-232
Leavitt, P. R., and Hodgson, D. (2001). “Sedimentary pigments,” in Tracking Environmental Change using Lake Sediments, Vol. 3: Terrestrial, algal, and siliceous indicators, eds J. P. Smol, H. J. B. Birks, and W. M. Last (Dordrecht: Kluwer Academic Publishers), 295–325.
O'Neil, J. M., Davis, T. W., Burford, M. A., and Gobler, C. J. (2012). The rise of harmful cyanobacteria blooms: the potential roles of eutrophication and climate change. Harmful Algae 14, 313–334. doi: 10.1016/j.hal.2011.10.027
Pacific Climate Impact Consortium (PCIC). (2010). Climate Summary for: Thomson/Okanagan Region. Available online at: http://www.pacificclimate.org/sites/default/files/publications/Climate_Summary-Thompson-Okanagan_0.pdf
Patrick, R., and Reimer, C. (1966). The Diatoms of the United States Exclusive of Alaska and Hawaii, Vol. 1. Philadelphia, PA: The Academy of Natural Sciences of Philadelphia, Monograph 13. doi: 10.2307/1351135
Patrick, R., and Reimer, C. (1975). The Diatoms of the United States Exclusive of Alaska and Hawaii. Vol. 2, Part 1. Philadelphia, PA: The Academy of Natural Sciences of Philadelphia, Monograph 13.
Pinsent, M. E., and Stockner, J. G. (eds.). (1974). Technical Supplement V to the Final Report: The Limnology of the Major Okanagan Basin Lakes. Penticton, BC: Office of the Study Director, Canada- British Columbia Okanagan Basin Agreement.
Reavie, E. D., and Edlund, M. (2013). Assessing the performance of a diatom transfer function on four Minnesota lake sediment cores: effects of training set size and sample age. J. Paleolimnol. 50, 87–104. doi: 10.1007/s10933-013-9706-x
Reavie, E. D., Heathcote, A., and Shaw Chraïbi, V. L. (2014). Laurentian Great Lakes phytoplankton and their water quality characteristics, including a diatom-based model for paleoreconstruction of phosphorus. PLoS ONE 9:e104705. doi: 10.1371/journal.pone.0104705
Reavie, E. D., and Juggins, S. (2011). Exploration of sample size and diatom-based indicator performance in three North American phosphorus training sets. Aquat. Ecol. 45, 529–538. doi: 10.1007/s10452-011-9373-9
Reavie, E. D., Hall, R. I., and Smol, J. P. (1995a). An expanded weighted-averaging model for inferring past total phosphorus concentrations from diatom assemblages in eutrophic British Columbia (Canada) lakes. J. Paleolimnol. 14, 49–67. doi: 10.1007/BF00682593
Reavie, E. D., Smol, J. P., and Carmichael, N. B. (1995b). Postsettlement eutrophication histories of six British Columbia (Canada) lakes. Can. J. Fish. Aquat. Sci. 52, 2388–2401. doi: 10.1139/f95-831
Reavie, E. D., Smol, J. P., Sharpe, I. D., Westenhofer, L. A., and Roberts, A.-M. (2000). Paleolimnological analyses of cultural eutrophication patterns in British Columbia lakes. Can. J. Bot. 78, 873–888. doi: 10.1139/b00-058
Rühland, K., Paterson, A. M., and Smol, J. P. (2008). Hemispheric-scale patterns of climate-related shifts in planktonic diatoms from North America and European lakes. Glob. Change Biol. 14, 2740–2754.
Ryder, B. (1994). Chironomid Taxa, and Phosphorus and Metal Concentrations in Sediment Cores from Osoyoos Lake. Directed Studies Report, Okanagan University College.
Saros, J. E., and Anderson, N. J. (2014). The ecology of the planktonic diatom Cyclotella and its implications for global environmental change studies. Biol. Rev.
Schelske, C. L., Peplow, A., Brenner, M., and Spencer, C. N. (1994). Low background gamma counting: applications for 210Pb dating of sediments. J. Paleolimnol. 10, 115–128. doi: 10.1007/BF00682508
Stevenson, J. (2014). Ecological assessments with algae: a review and synthesis. J. Phycol. 50, 437–461. doi: 10.1111/jpy.12189
Taranu, Z. E., Gregory-Eaves, I., Leavitt, P. R., Bunting, L., Buchaca, T., Catalan, J., et al. (2015). Acceleration of cyanobacterial dominance in north temperate-subarctic lakes during the Anthropocene. Ecol. Lett. 18, 375–384. doi: 10.1111/ele.12420
Taranu, Z., Zurawell, R., Pick, F., and Gregory-Eaves, I. (2012). Predicting cyanobacterial dynamics in the face of global change: The importance of scale and environmental context. Glob. Change Biol. 18, 3477–3490. doi: 10.1111/gcb.12015
ter Braak, C. J. F., and Šmilauer, P. (2012). Canoco reference manual and user‘s guide: software for ordination (version 5.0). Ithaca, NY: Microcomputer Power.
Valentine, K. W. G., Sprout, P. N., Baker, T. E., and Lavkulich, L. M. (eds.). (1978). The Soil Landscapes of British Columbia. Victoria, BC: British Columbia Ministry of Environment.
Wilson, S. E., Cumming, B. F., and Smol, J. P. (1994). Diatom salinity relationships in 111 lakes from the Interior Plateau of British Columbia, Canada: the development of diatom-based models for paleosalinity reconstructions. J. Paleolimnol. 12, 197–221. doi: 10.1007/BF00678021
Wilson, S. E., Cumming, B. F., and Smol, J. P. (1996). Assessing the reliability of salinity inference models from diatom assemblages: an examination of a 219-lake data set from western North America. Can. J. Fish. Aquat. Sci. 53, 1580–1594. doi: 10.1139/f96-094
Keywords: cultural eutrophication, nutrients, phosphorus, proxy methods, diatoms, pigments, inference models
Citation: Cumming BF, Laird KR, Gregory-Eaves I, Simpson KG, Sokal MA, Nordin RN and Walker IR (2015) Tracking past changes in lake-water phosphorus with a 251-lake calibration dataset in British Columbia: tool development and application in a multiproxy assessment of eutrophication and recovery in Osoyoos Lake, a transboundary lake in Western North America. Front. Ecol. Evol. 3:84. doi: 10.3389/fevo.2015.00084
Received: 29 April 2015; Accepted: 07 July 2015;
Published: 03 August 2015.
Edited by:
Isabelle Larocque-Tobler, The L.A.K.E.S. Institute, SwitzerlandReviewed by:
Scott David Mooney, University of New South Wales, AustraliaJohn Birks, University of Bergen, Norway
Copyright © 2015 Cumming, Laird, Gregory-Eaves, Simpson, Sokal, Nordin and Walker. This is an open-access article distributed under the terms of the Creative Commons Attribution License (CC BY). The use, distribution or reproduction in other forums is permitted, provided the original author(s) or licensor are credited and that the original publication in this journal is cited, in accordance with accepted academic practice. No use, distribution or reproduction is permitted which does not comply with these terms.
*Correspondence: Brian F. Cumming, Paleoecological Environmental Assessment and Research Laboratory, Department of Biology, Queen's University, Kingston, 116 Barrie St., Kingston, ON K7L 3J9, Canada, cummingb@queensu.ca