Do Oxygen Isotope Values in Collagen Reflect the Ecology and Physiology of Neotropical Mammals?
 Brooke E. Crowley
 Amanda D. Melin
 Justin D. Yeakel
 Nathaniel J. Dominy
- 1Department of Anthropology, University of Cincinnati, Cincinnati, OH, USA
- 2Department of Geology, University of Cincinnati, Cincinnati, OH, USA
- 3Department of Anthropology, Washington University, Saint Louis, MO, USA
- 4Department of Anthropology, Dartmouth College, Hanover, NH, USA
- 5Santa Fe Institute, Santa Fe, NM, USA
- 6School of Natural Science, University of California, Merced, Merced, CA, USA
- 7Department of Biological Sciences, Dartmouth College, Hanover, NH, USA
Stable isotope data provide insight into the foraging ecology of animals. Traditionally, carbon and nitrogen isotope values have been used to infer dietary and habitat preferences. Oxygen isotopes are used less frequently but may complement the ecological information provided by carbon and nitrogen, particularly in densely forested or arid environments. Additionally, because oxygen is preserved in both bioapatite and collagen, it is useful for paleoecological studies. To investigate the suitability of oxygen isotopes for complementing and building on ecological applications of carbon and nitrogen isotopes, we analyze all three isotopes in bone collagen for nearly identical assemblages of Costa Rican mammals in two ecologically distinct habitats - an evergreen rainforest and a seasonal dry forest. We assess the degree to which differences in habitat, activity pattern, diet, arboreality, and thermoregulation are revealed by each of the isotope systems. Our results highlight the potential of oxygen isotopes in modern and paleoecological contexts. In addition to reflecting habitat type, oxygen isotope values in collagen distinguish species on the basis of vertical habitat stratification and drinking behavior. Within a locality, individuals with low oxygen isotope values likely track meteoric water, whereas those with elevated values most likely consume evaporatively-enriched plant tissues, such as canopy leaves. These patterns will be useful in reconstructing paleoenvironments and interpreting ecological differences among taxa both extant and extinct.
Introduction
Stable isotope data provide insight into the foraging ecology of species—including cryptic and extinct taxa—by preserving a record of ingested food and water. Traditionally, carbon (δ13C) and nitrogen (δ15N) isotope values have been used to infer differences in diet and habitat among species. However, the practical value of these isotope systems is limited in certain ecological contexts, such as densely forested or arid localities. Additionally, nitrogen isotope values can be measured only in proteinaceous tissues (i.e., collagen and keratin), which seldom preserve beyond several thousand years (Tuross et al., 1988). Oxygen isotope (δ18O) values also have the potential to identify ecological differences among organisms (e.g., Bryant and Froelich, 1995; Lee-Thorp and Sponheimer, 2005; Nelson, 2013). Additionally, because oxygen is present in collagen and bioapatite, which is well preserved in the fossil record, it is well suited for investigating the foraging ecology of extant and extinct organisms. Yet few studies have investigated how variation in diet or habitat might affect oxygen isotope variation in modern or fossil communities (Bocherens et al., 1995, 1996; Kohn, 1996; Cerling et al., 2004; Lee-Thorp and Sponheimer, 2005; Levin et al., 2006; Secord et al., 2008; White et al., 2009; Pietsch et al., 2011; Moritz et al., 2012; Krigbaum et al., 2013; Nelson, 2013; Crowley, 2014; Carter and Bradbury, 2015).
The carbon, nitrogen and oxygen isotope values of animals are reflections of foraging behavior. Oxygen isotope values track those for carbon and nitrogen insofar as they are higher for plants and animals inhabiting dry, hot habitats compared to moist, cool ones (e.g., Cormie et al., 1994; Nelson, 2013). In addition, the δ18O values of plants are positively related to height in stratified canopies (Sternberg et al., 1989; Ometto et al., 2005). These patterns are primarily driven by varying temperature, humidity, light, vapor pressure deficit, and the δ18O of atmospheric water vapor beneath the forest canopy (Farquhar and Sharkey, 1982; Ometto et al., 2005; Barbour et al., 2007). Given that isotopic differences in canopy and understory vegetation are transmitted to the animals that forage in these strata, it is plausible that oxygen isotopes can distinguish arboreal species from those that feed on or near the forest floor (Krigbaum et al., 2013; Nelson, 2013; Carter and Bradbury, 2015).
In contrast to the prevailing pattern for carbon and nitrogen, faunivores tend to have lower δ18O values than sympatric herbivores, particularly in arid habitats (Ambrose, 1992; Bocherens et al., 1995; Lee-Thorp and Sponheimer, 2005). Lower δ18O values for faunivores may result from the consumption of 18O-depleted animal fats and proteins or from frequent drinking. These same patterns may be able to distinguish faunivores that predominantly consume invertebrates from those that consume vertebrates. Additionally, oxygen isotope values may better discriminate folivores and frugivores than carbon or nitrogen isotopes values (Cerling et al., 2004; Krigbaum et al., 2013; Nelson, 2013). For example, fruits can exhibit higher δ13C and lower δ15N values than leaves, but these differences are relatively small and inconsistent (Cerling et al., 2004; Codron et al., 2006; Cernusak et al., 2009; Crowley et al., 2011). Although most plant tissues are not enriched in 18O relative to source water, evapotranspiration increases δ18O values of leaf tissues, particularly in arid localities or in the upper canopy (Sternberg et al., 1989; Yakir, 1997; Farquhar et al., 2007). In consequence, folivores, especially those foraging in the canopy, can have substantially higher δ18O values than other animals (Cerling et al., 2004; Levin et al., 2006; Nelson, 2013; Carter and Bradbury, 2015).
Importantly, some animals may better reflect local temperature and humidity than others. For example, as nocturnal animals (particularly folivores) eat 18O-depleted foods, they should be less affected by thermal stress and evaporative water loss than diurnal animals (Bocherens et al., 1996). Cooler nocturnal temperatures and the incorporation of oxygen from atmospheric CO2, water vapor, and dewfall results in lower δ18O values for foliage at night (Ometto et al., 2005; Seibt et al., 2007). Such diel differences may differentiate nocturnal and diurnal consumers. In addition, physiological factors, such as body size, drinking frequency, and water loss mechanisms could attenuate or obscure ecological signals. Body size affects metabolic rates and dictates the relative contributions of drinking water, ingested food, and inspired air to the δ18O values of tissues (reviewed in Bryant and Froelich, 1995). Drinking water is the primary source of oxygen for all animals, even small-bodied species (Bryant and Froelich, 1995; Podlesak et al., 2008). Nevertheless, obligate drinkers are likely to have δ18O values that follow environmental conditions more closely than species that drink infrequently (Levin et al., 2006; Pietsch et al., 2011; Moritz et al., 2012; Nelson, 2013). Finally, the degree to which a species pants or sweats can impact its δ18O values. Whereas, sweat is isotopically indistinct from an animal's body water pool, oxygen expelled via panting is substantially depleted in 18O compared to body water (reviewed in Bryant and Froelich, 1995). Panting also increases the pH of blood (Richards, 1970). Both of these factors can result in higher tissue δ18O values for panters than sweaters. Such behavioral and physiological differences can influence paleoclimate and paleoenvironmental reconstructions if not accounted for properly.
Here we use a multi-isotope approach to investigate the degree to which oxygen isotope analysis can complement and build on ecological applications of carbon and nitrogen isotope analyses. Our focus is on mammalian assemblages in two Costa Rican tropical forests with profoundly different rainfall patterns—an evergreen rainforest and a seasonal dry forest. These forests have similar species compositions with taxa representing a range of dietary categories including carnivory, insectivory, omnivory, frugivory, and folivory. Such a system is ideal for testing the degree to which oxygen isotopes can discriminate diets, activity patterns, and foraging strata. We test the following hypotheses:
1. Oxygen isotope values are higher for animals inhabiting the seasonal dry forest than those in the evergreen rainforest.
2. Oxygen isotope values distinguish animals that consume different foods, forage at different heights within the forest canopy, and are active at different times of the day. We predict that: (i) faunivores have lower δ18O values than herbivores, and among the faunivores, those that consume vertebrates have higher δ18O values than those that primarily consume invertebrates; (ii) frugivores have lower δ18O values than folivores; (iii) animals that feed on the forest floor have lower δ18O values than those that feed in the canopy, and (iv) nocturnal animals have lower δ18O values than diurnal animals.
3. Physiological adaptations impact δ18O values. Animals that pant or drink infrequently have higher δ18O values than those that sweat or drink frequently.
Materials and Methods
Study Sites and Species
We sampled osteological collections from two protected ecosystems in Costa Rica (Figure 1). Sector Santa Rosa (SSR), Area de Conservación Guanacaste, encompasses over 108 km2 (10,800 ha) of semi-deciduous forest in northwestern Costa Rica (10.84N, 85.62W). The region receives 800–2600 mm of annual rainfall (average 1473 mm) during a 6-month rainy season (Holmes et al., 2011; Melin et al., 2014a). Average daily temperatures range from 28°C in the rainy season to 30.3°C in the dry season (Campos and Fedigan, 2009). However, differences in maximum daily temperatures are more dramatic: 28°C in the rainy season vs. 34.5°C in the dry season. The forest at SSR is primarily secondary regrowth at various successional stages. Canopy height is variable (12–30 m), and the canopy is relatively discontinuous, particularly during the dry season when many large trees are defoliated (Kalacska et al., 2007; Holmes et al., 2011).
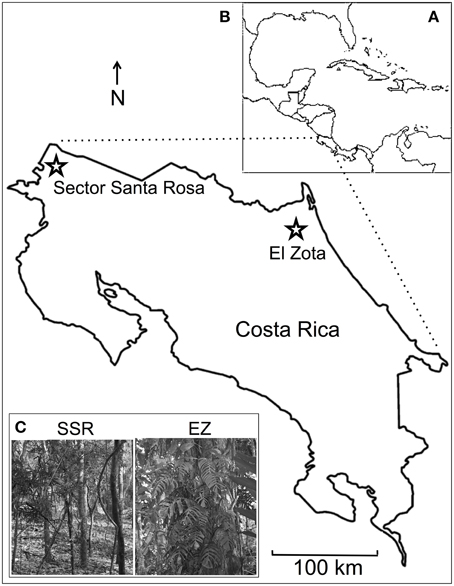
Figure 1. Overview of the study area including maps of (A) Central America, and (B) Costa Rica with study areas highlighted, and (C) photographs of the forests at Sector Santa Rosa (SSR) and El Zota (EZ). Photographs by BC.
El Zota (EZ) Biological Field Station is a 10 km2 (1000 hectare) private reserve located in northeastern Costa Rica (10.56N, 83.74W). Seasonality at EZ is less pronounced: most of the annual rainfall (ca. 4000 mm) occurs from April through June and November through December (Lattanzio and Laduke, 2012). A brief and unpronounced dry season occurs between August and October (Senf, 2009). Average daily temperatures range from 18.5°C in the rainy season to 32.8°C in the dry season (Lindshield, 2006). The majority (700 ha) of EZ is primary tropical lowland rainforest and swamp forest (Lindshield, 2006; Senf, 2009). Tree plantations (270 ha) and pasture (30 ha) account for the remainder of the reserve (Lindshield, 2006; Senf, 2009). The canopy is relatively continuous throughout the forested portions of EZ, although gaps exist in plantation areas (Lindshield, 2006). Canopy heights range from 15 to 25 m with emergent trees reaching 40–60 m (Israel Mesen, personal communication).
Samples were obtained from osteological collections maintained by the field stations at EZ and SSR. Accession notes (when available) suggest that all specimens were less than 10 years old at the time of sampling. At each site we sampled all accessible osteological material from a diverse assortment of mammal taxa that span a variety of dietary, activity, and canopy height preferences (Table 1). There is substantial species overlap between the two sites. In order to minimize destruction of the osteological specimens, we sampled fragmented material, vertebrae, or ribs whenever possible. Therefore, minimal (< 1‰; Tuross et al., 2008) isotopic differences may exist among bones due to variable composition and turnover rates. The species in this study include sweaters and panters, as well as species that avoid thermal stresses through behavioral mechanisms (Table 1). Species vary dramatically in their body masses, but the vast majority are >1 kg (Table 1). We verified that no statistical correlation exists between isotope values and log body mass (R2 < 0.03 and p > 0.05 for all three isotope systems).
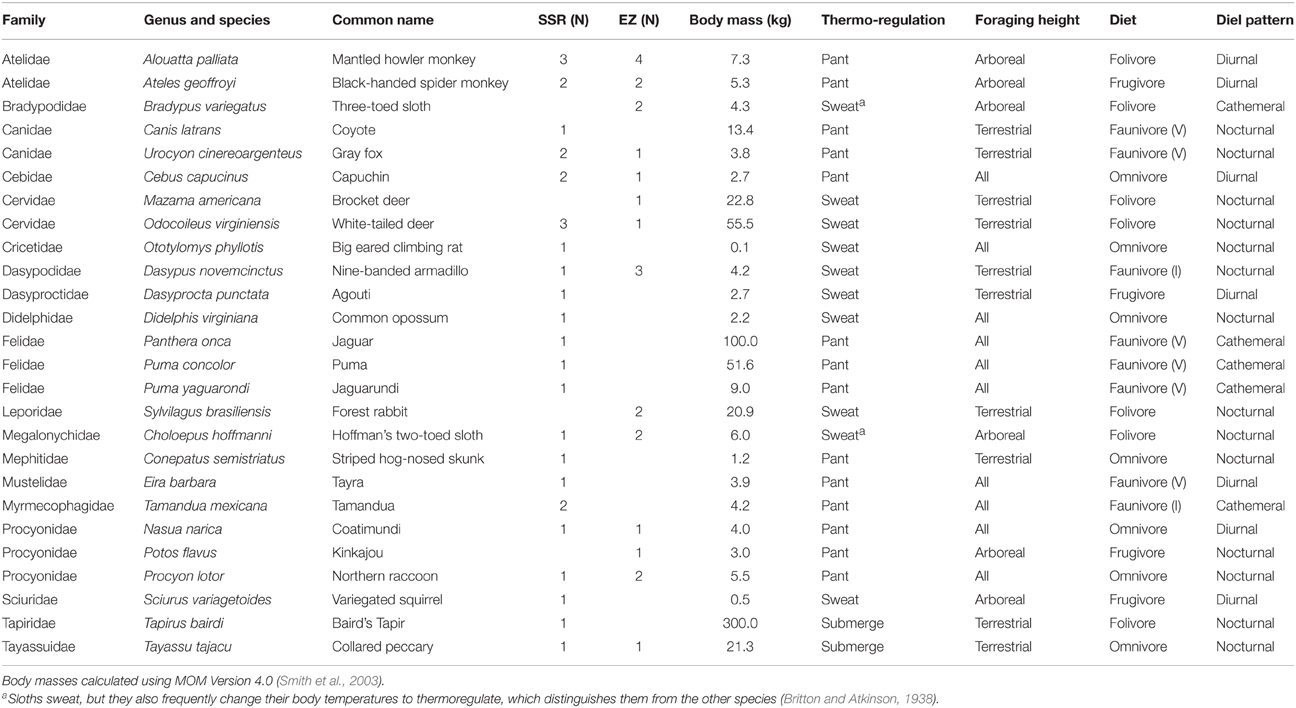
Table 1. Sample sizes, body masses, primary thermoregulatory mechanism, foraging height, dietary, and diel activity classifications for mammalian taxa included in this study.
Sample Preparation and Analysis
We coarsely crushed samples using an agate mortar and pestle. We decalcified bone using 0.5 M hydrochloric acid and removed lipids using petroleum ether (following Crowley et al., 2010). Carbon and nitrogen isotope data are previously published for El Zota primates and all Santa Rosa individuals (Crowley et al., 2010; Melin et al., 2014b), and oxygen isotope data are previously published for primates from both sites (Crowley, 2014). New collagen data were measured at the UC Davis Stable Isotope Facility. Carbon and nitrogen were analyzed using a PDZ Europa ANCA-GSL elemental analyzer interfaced to a PDZ Europa 20–20 isotope ratio mass spectrometer (Sercon Ltd., Cheshire, UK). Data were normalized using 15N-enriched glutamic acid (USGS-41), bovine liver, and nylon. The average differences in δ13C and δ15N between samples run in duplicate (n = 6) were 0.5 and 0.1‰, respectively. Collagen oxygen isotope values were analyzed using an Elementar PyroCube interfaced to a PDZ Europa 20-20 isotope ratio mass spectrometer. Data were normalized using IAEA 600 (Caffeine), IAEA 601 and 602 (benzoic acid), alanine, and glutamic acid. The average difference in δ18O between samples run in duplicate (N = 5) was 0.4‰. We report δ13C relative to V-PDB, δ15N relative to AIR, and δ18O values relative to V-SMOW.
Statistical Analysis
We examined the effects of forest type, water loss mechanism, and diet, feeding height, and activity pattern on collagen isotope values using general Linear Mixed Models (LMMs). We first investigated isotopic differences among individuals according to habitat (moist vs. dry forest). Because of slight differences in species compositions at each locality, we included species as a random variable in these comparisons. We also examined the effects of water loss mechanism (panting vs. sweating) along with forest type on collagen δ18O values.
To investigate the effects of diet, feeding height, and activity pattern, we ran general linear models (GLMs) and categorized species by their primary diet (folivore, frugivore, omnivore, vertebrate faunivore, invertebrate faunivore), canopy use (arboreal, terrestrial, both), and diel pattern (nocturnal, diurnal, cathemeral; see Table 1). We were not able to include interaction terms among diet, canopy use and diel pattern in our analyses due to insufficient degrees of freedom. The δ13C value for a raccoon from EZ was identified as an outlier (Supplementary Table 1, Supplementary Figure 1), and was therefore excluded from all analyses. We speculate that this individual foraged on arthropods or C4 grasses from the pasture portion of the reserve. We used planned contrasts to compare isotope values between (i) primary consumers (combining frugivores and folivores) and secondary consumers (combining vertebrate and invertebrate consumers), (ii) arboreal and terrestrial species, and (iii) diurnal and nocturnal species. Species that are omnivorous, cathemeral or forage at more than one height within the forest canopy were excluded from these planned comparisons. We chose to use planned contrasts rather than post-hoc comparisons because they are designed to test our a priori hypotheses, and are not susceptible to multiple comparison penalties. Because we tested directional predictions, we report one-tailed p-values for forest type comparisons and all planned contrasts. LMMs and GLMs with planned contrasts were conducted using PROC MIXED (forest comparison) or PROC GLM (diet, activity, feeding height) in SAS 9.4. Significance for all tests set at α = 0.05.
Lastly, we compared the efficacy of different pairs of isotope systems (C:N, C:O, N:O) against the full 3-dimensional isotope system (C:N:O) at distinguishing groups by calculating the isotopic overlap between all pairs of groups within the dietary, trophic, activity, and feeding height categories. We also calculated overlap values between SSR and EZ limiting our analysis to the subset of taxa that were sampled at both sites. We calculated the overlap of both two dimensional ellipses (using each isotope pair C:O, C:N, and N:O) and three dimensional ellipsoids (C:N:O) among groups in each category with the R-package nicheROVER v. 1.0 (Swanson et al., 2015). For a given pair of isotopic distributions (e.g., group A and B), the nicheROVER package employs a Bayesian algorithm to produce posterior estimates of the probability that a member of A falls within the 95% confidence ellipsoid of B (pr{A|B}), and the probability that a member of B falls within the 95% confidence ellipsoid of A (pr{B|A}). Because we were interested in the proportional amount of area/volume shared by the confidence ellipsoids of each pair of groups within a given category, we calculated the intersection between A and B, such that:
Because nicheROVER is designed to analyze n-dimensional systems, these methods were the same for both 2-dimensional and 3-dimensional isotope systems.
Results
Isotope data for each individual and summary data for each species are presented in Supplementary Table 1 and Supplementary Figure 1.
Effects of Habitat, Diet, Activity, and Height
Individuals from EZ have significantly lower δ18O, δ13C, and δ15N values than those from SSR (Table 2). This pattern is robust for the majority of species sampled at both sites (Figure 2). We also detected significant differences in δ13C values as a function of diet and canopy height, but not activity pattern (Table 3). The δ13C values for frugivores and folivores are lower than those for species that consume animal matter (Figure 3; Table 5), leading to a significant difference in δ13C values between herbivores and faunivores (Table 4). We detected only a marginally significant difference between terrestrial and arboreal species (Table 5). Surprisingly, semi-arboreal species that utilize multiple heights have lower δ13C values than those that are either strictly arboreal or terrestrial (Figure 3; Table 5), but this appears to be confounded by diet (Table 1).
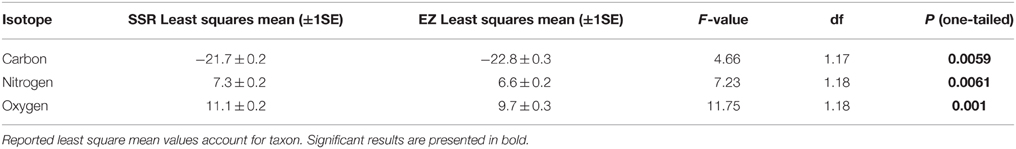
Table 2. General linear mixed model results for forest comparisons.
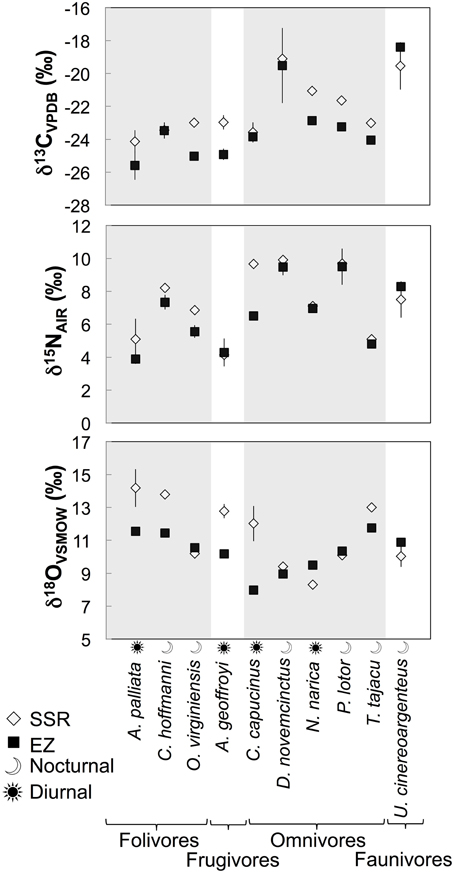
Figure 2. Average δ13C, δ15N, and δ18O values (±1σ) for the 10 species that were sampled at both Sector Santa Rosa and El Zota.
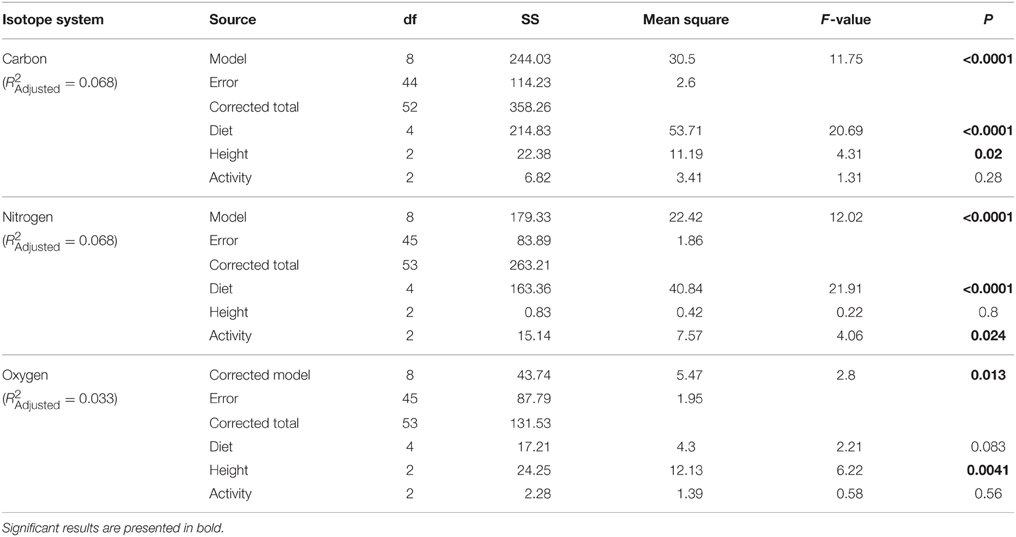
Table 3. General linear model results for diet, foraging height, and diel activity.
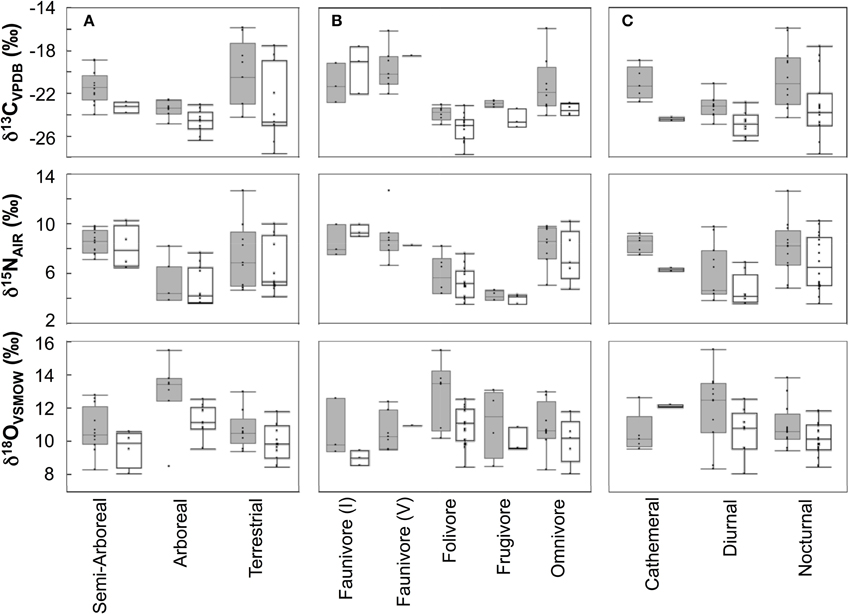
Figure 3. Box plots showing isotopic distributions for taxa with (A) different foraging heights, (B) dietary affinities, or (C) activity patterns at each site. Boxes for Sector Santa Rosa are shaded. Boxes include median, 1st and 3rd quartiles, and whiskers extend 1.53 the interquartile range from the boxes.
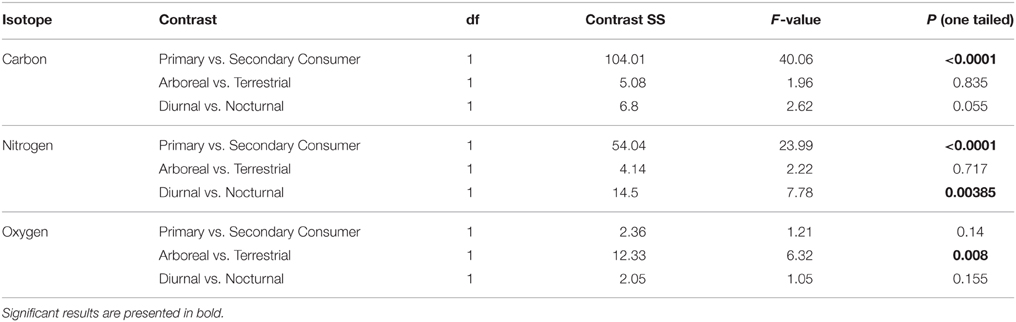
Table 4. Planned contrast results for collagen isotopes.
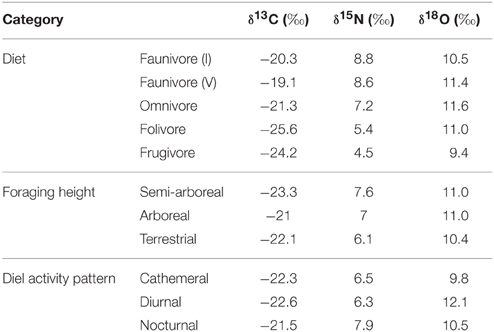
Table 5. Least square mean carbon, nitrogen, and oxygen isotope values for each dietary, foraging height, and diel activity category.
Nitrogen isotope values vary as a function of diet and activity pattern (Table 3). Frugivores have the lowest δ15N values, followed by folivores. Vertebrate and invertebrate faunivores have the highest δ15N values, whereas omnivores are intermediate (Figure 3; Table 5). The difference between herbivores and faunivores is significant (Table 4). Nocturnal species have higher δ15N values than diurnal or cathemeral species (Figure 3; Table 5). The difference between diurnal and nocturnal species is significant (Table 4).
Finally, we detected differences in δ18O values as a function of diet and foraging height, but not activity pattern (Table 3). Frugivores have lower δ18O values than folivores, and faunivores have lower δ18O values than herbivores (Figure 3; Table 5). However, there is little overall variability in δ18O values among groups and our comparison of herbivores vs. faunivores does not reach significance (Table 4). Arboreal species have higher δ18O values than terrestrial species and semi-arboreal species that utilize multiple canopy heights (Figure 3; Table 5). The difference between arboreal and terrestrial species is significant (Table 4).
Niche Overlap
Multi-isotope overlap comparisons generally reinforce results seen in single system analyses. There is clear differentiation (i.e., little overlap) between some dietary, foraging height, and diel groups for multi-isotopic 2-dimensional ellipses and 3-dimensional ellipsoids (e.g., faunivores vs. frugivores, primary vs. secondary consumers, arboreal and semi-arboreal species, cathemeral vs. diurnal species). Other groups exhibit low differentiation (high overlap) in both 2-D and 3-D isotope systems (e.g., semi-arboreal vs. terrestrial fauna, and faunivores vs. omnivores), highlighting ecological similarities between these latter groups (Figure 4; Supplementary Table 2, Supplementary Figure 2).
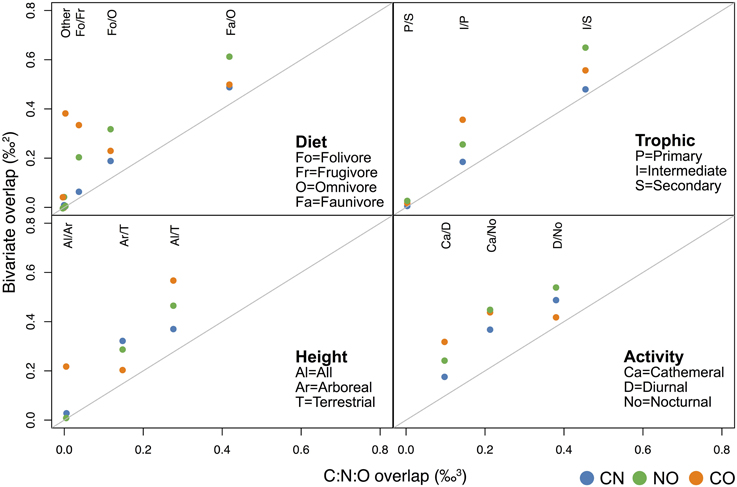
Figure 4. Mean overlap values for 2-dimensional vs. 3-dimensional isotope systems for diet, trophic, canopy position (height), and activity categories. The “other” comparisons in panel a include Fa/Fo, Fa/Fr, and Fr/Om. Overlap values for all of these pairwise comparisons are very close to zero (see Supplementary Table 2).
Overlap values between 3-dimensional standard ellipsoids tend to be lower than those between 2-dimensional ellipses. This is due to the former measuring volume (‰3) and the latter measuring area (‰2; Figure 4; Supplementary Table 2, Supplementary Figure 2). The degree to which the addition of a third isotope improves our ability to distinguish groups varies considerably among isotope systems and categories. For example, when three isotopes are used, it may be possible to securely discriminate cathemeral vs. nocturnal and cathemeral vs. diurnal groups (ca. 21 and 11% overlap, respectively; Figure 4). However, overlap between diurnal and nocturnal taxa in C:N:O space is likely too large to be useful for separating these groups (39%).
In general, overlap among 3-D ellipsoids is only slightly lower than overlap calculated for 2-D C:N ellipses, but substantially lower than that calculated for most C:O or N:O ellipses (Figure 4; Supplementary Table 2, Supplementary Figure 2). For diet and trophic categories in particular, C:N ellipses and C:N:O ellipsoids produce very similar overlap estimates (Figures 4, 5), which suggests that oxygen isotopes add little in the way of unique dietary information. There are, however, cases in which overlap estimates for C:O ellipses are more similar to C:N:O ellipsoids than other 2-dimensional isotope systems. For example, C:O is more effective than C:N or N:O at distinguishing localities, arboreal vs. terrestrial taxa, and nocturnal vs. diurnal taxa (Figure 4; Supplementary Table 2, Supplementary Figure 2).
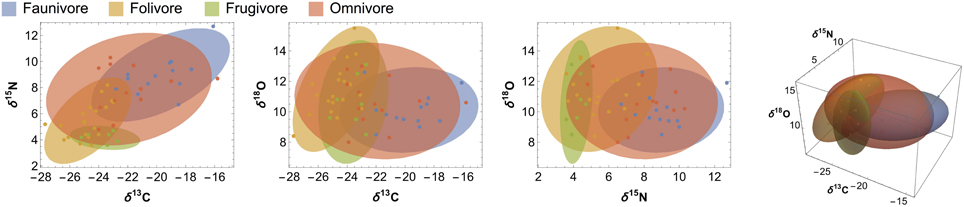
Figure 5. Ninety-five percent confidence ellipses and ellipsoids illustrating overlap among 2- and 3-dimensional isotope systems for each dietary category. Raw data points are included to illustrate ellipsoid fit.
Effects of Physiology
Using published data for water samples from various locations in Costa Rica (Lachniet and Patterson, 2002), we estimate that δ18O values for surface waters at SSR and EZ are ca. −2 and −5‰, respectively. Additionally, based on the isotopic offset between bone collagen and drinking water for lab rats (Kirsanow and Tuross, 2011), we expect δ18O values for bone collagen to be 12.5–15‰ higher than those in drinking water (i.e., expected δ18O = 10–13‰ at SSR and 8–11‰ at EZ). Average δ18O values for most species at each site are within these expected ranges (11.3 ± 1.8‰ at SSR and 10.4 ± 1.3‰ at EZ; Supplementary Table 1, Supplementary Figure 1). The species with higher than expected δ18O values include howler monkeys (Alouatta palliata), sloths (Choelopus hoffmani, Bradypus variegatus), coyotes (Canis latrans), and peccaries (Tayassu tajacu).
We found no differences in δ18O values among species with different water loss mechanisms overall, or at either site (p > 0.05, Figure 6). However, our data set is perhaps too limited to conclusively rule out this effect. Relative humidity at SSR is low, particularly during the day. Apparent differences in δ18O values between panters and sweaters are more pronounced among the majority of diurnal animals at this locality (Figure 6), and a larger sample size may reveal a significant effect of water loss mechanism on δ18O values.
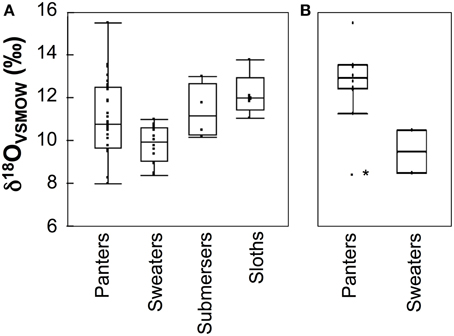
Figure 6. Box plots comparing δ18O values among species that utilize different thermoregulatory mechanisms for (A) all sampled species, and (B) diurnal species at Sector Santa Rosa. For each group, boxes include median, 1st and 3rd quartiles, and whiskers extend 1.53 the interquartile range from the box. Submersers rely on submersion in mud or water to thermoregulate. Sloths are listed separately because they are able to change their internal body temperature (Britton and Atkinson, 1938). The asterisk denotes a coati with an outlier δ18O value. For a list of the primary thermoregulatory mechanism used by each species, see Table 1.
Discussion
Do Oxygen Isotope Values Distinguish Individuals from Dry and Moist Forests?
As predicted, collagen δ18O, δ13C, and δ15N values are higher for individuals from the deciduous dry forest at SSR (Table 2). These results suggest baseline isotopic differences between the two sites (most likely related to soil moisture), and evaporative enrichment that is more pronounced at SSR than at EZ. Patterns are broadly consistent across taxa that were sampled at both localities (Figure 2). Variability among taxa may be an artifact of small sample sizes; it could also result from meaningful ecological or physiological differences between individuals from the two sites. Among the four species with greater δ18O spacing between habitats, three are diurnal (A. palliata, Ateles geoffroyi, and Cebus capucinus), suggesting that environmental disparities between habitats (e.g., evaporative enrichment) may be exacerbated for diurnal species. Differences in relative humidity and temperature between the two sites are likely less pronounced after the sun sets (Sternberg et al., 1989). Additionally, offset in δ18O and δ15N values between sites is generally higher for herbivores than for omnivores or faunivores (Figure 2), which affirms previous suggestions that the influence of relative humidity may decrease in importance with increasing trophic level (e.g., Kohn, 1996; Pietsch et al., 2011). The exceptions are herbivorous deer (Odocoileus virginiensis), which are nocturnal, and omnivorous capuchins (C. capucinus), which are diurnal.
Can Oxygen Isotope Values Distinguish Species that Consume Different Foods?
Contrary to our prediction, we did not detect significant differences in δ18O values among dietary groups. Carbon and nitrogen are considerably more effective at differentiating dietary and trophic groups (Figures 3, 4; Tables 3, 4). Although the LMM results suggest that diet has a marginal influence on δ18O values, planned contrasts indicate that herbivores and faunivores are indistinguishable. Each dietary group exhibits rather variable δ18O values, resulting in considerable isotopic overlap among categories. Additionally, patterns among dietary categories are not consistent between sites. For example, faunivores that consume vertebrates have higher δ18O values than those that consume invertebrates at EZ, but not at SSR. Omnivorous species exhibit a large range of δ13C and δ15N values, particularly at SSR, which likely reflects the variable amount of animal protein in their diets (Hyodo et al., 2010). Folivores have higher δ18O values than other groups at SSR, which would be expected if they consume leaves that are affected by 18O enrichment during evapotranspiration (Yakir, 1997). Lack of evidence for 18O-enriched folivores at EZ may result from the elevated soil moisture and relative humidity at this site, which likely lead to less evaporative enrichment in leaves than at SSR (Ometto et al., 2005; Barbour et al., 2007).
Are Oxygen Isotope Values Effective at Distinguishing Foraging Heights within the Forest Canopy?
Oxygen isotope values are effective at distinguishing arboreal and terrestrial species (Figure 3; Table 4). More pronounced differences in δ18O values between foraging heights at SSR than at EZ is a logical result; stratification in δ18O values is predominantly driven by a gradient in relative humidity under the forest canopy (Sternberg et al., 1989). Whereas, we might expect substantial differences in relative humidity between the canopy and understory in the dry forest at SSR, relative humidity (and δ18O values) should be more consistent in the moist forest at EZ.
Unexpectedly, foraging height has a negligible impact on δ13C values. There is no discrete overstory at SSR (Kalacska et al., 2007). However, we had expected to find differences in δ13C values among heights at EZ, which has a dense upper canopy (Lindshield, 2006). Although dietary factors could be obscuring any carbon isotope signal related to foraging at EZ (van der Merwe and Medina, 1991; Krigbaum et al., 2013), other researchers have also reported inconsistent δ13C values among animals feeding at different canopy heights in African forests (Krigbaum et al., 2013; Nelson, 2013). This calls into question the reliability of δ13C for distinguishing terrestrial vs. arboreal taxa, or identifying strata within a dense canopy (Voigt, 2010). The ability for oxygen to discern foraging height appears to be more robust (Krigbaum et al., 2013; Nelson, 2013; Carter and Bradbury, 2015), suggesting that oxygen may have attractive utility for reconstructing paleoenvironmental conditions.
Can Oxygen Isotope Values Distinguish Species with Distinctive Diel Patterns?
Contrary to our expectations, oxygen isotope values in collagen are ineffective at distinguishing nocturnal and diurnal species. This suggests that either (i) there are insubstantial differences in relative humidity or the δ18O value of respired CO2 between night and day, or (ii) activity pattern is of minor importance compared to other factors, such as diet, foraging height, or physiology. Nitrogen isotope values differ significantly among diel groups. However, we suspect that this pattern reflects an interaction between activity, diet and possibly locality; most faunivores and omnivores are nocturnal or cathemeral and none of the diurnal species we sampled are dedicated faunivores (Table 1). Larger variability in δ15N values for nocturnal animals compared to diurnal ones likely reflects a mix of higher δ15N values for faunivores and omnivores, and lower δ15N values for nocturnal herbivores, such as tapirs, deer, and agoutis. Considerable isotopic overlap between both 2-D and 3-D ellipsoids for nocturnal, diurnal and cathemeral taxa (Figure 4) suggests that carbon, nitrogen, and oxygen are not particularly well-suited for distinguishing diel groups, though the C:O isotope system performs marginally better at distinguishing diurnal vs. nocturnal species than either C:N or N:O.
Physiological Adaptations Impact δ18O Values
Differences in water loss mechanisms or drinking frequency may be responsible for some of the observed variability in δ18O values at SSR and EZ (Levin et al., 2006; Moritz et al., 2012). Overall, mean δ18O values do not differ among species with different water loss mechanisms, but this is likely due to the large range in δ18O values exhibited by panters (Figure 6). We anticipate that some panters minimize water loss and thermal stress by traveling less, modifying their circadian activity, or submersing themselves in water or mud (e.g., Campos and Fedigan, 2009; Oliveira-Santoa et al., 2010). Although the influence of water loss mechanism on δ18O values could complicate the interpretation of ecological differences among species, we note that it is not large enough to obscure differences in δ18O values among species that forage at different heights.
Higher δ18O values for howler monkeys (A. palliata), sloths (C. hoffmani; B. variegatus), coyotes (C. latrans), and peccaries (T. tajacu) most likely reflect drinking water frequency. These species differ in their diet, foraging height, activity pattern, and water loss mechanisms, but they all share the ability to meet their water requirements through the food they consume (Zervanos and Day, 1977; Glander, 1978; Nagy and Montgomery, 1980; Golightly and Ohmart, 1984). Additionally, δ18O values for these facultative drinkers are more elevated than other taxa at SSR than at EZ (Supplementary Table 1, Supplementary Figure 1). The lowest δ18O values at both EZ and SSR are similar (ca. 8‰). However, the maximum δ18O values at SSR are higher than those at EZ, which results in a larger overall spread in δ18O values among taxa at the dry forest site (7.2 vs. 4.5‰). These data bolster the findings of Levin et al. (2006) that species that drink frequently have lower δ18O values than those that drink infrequently, particularly in arid settings, and confirm that oxygen isotope values in bone collagen can distinguish species based on their sensitivity to evaporative enrichment in tropical forest settings.
Implications for Paleoenvironmental Reconstructions
Researchers are often limited to carbon and oxygen isotopes in enamel carbonate when working with the fossil record. However, collagen may be better suited for the investigation of environmental conditions and foraging ecologies for well-preserved historic, Holocene, or Late-Pleistocene specimens. It is straightforward to assess collagen integrity (e.g., Ambrose, 1990), and the ability to analyze three isotopes in one material reduces the need for multiple preparation techniques.
Our analysis shows that overlap values among collagen C:O ellipses are rather large compared to C:N ellipses or C:N:O ellipsoids (Figure 4; Supplementary Table 2, Supplementary Figure 2). Although oxygen and carbon may be just as effective as three isotope systems at distinguishing localities, nocturnal and diurnal species, terrestrial and arboreal species, or folivores and faunivores (Figure 4), we note that overlap estimates between some of these pairs range from 40 to 60%, which may be too large to securely distinguish groups. The exceptions are arboreal vs. terrestrial taxa (ca. 20% overlap) and folivores vs. faunivores (ca. 5% overlap).
Combined, δ13C, δ15N, and δ18O values in collagen are effective at distinguishing species with different diets, canopy positions, and physiological adaptations. Oxygen may also be able to distinguish species based on their drinking frequency. Fossil assemblages with more variable collagen δ18O values among species likely indicate drier habitats than those with less variable δ18O values. Additionally, within a particular assemblage, species with the lowest δ18O values likely consumed water frequently. Their δ18O values should track meteoric water most closely. Species with high δ18O values are likely to be more enriched in 18O than meteoric water, and are therefore suboptimal for interpreting paleoclimate. Although our results suggest some caution should be used when interpreting isotopic data, when used in combination, carbon, nitrogen, and oxygen isotope data from bone collagen may be able to provide comprehensive reconstructions of environments and extinct communities dating back to the Late Pleistocene.
Author Contributions
BC, Conceived the project, collected and analyzed samples, wrote the manuscript. AM, Collected samples, designed and conducted data analyses, wrote the manuscript. JY, Conducted data analyses, wrote the manuscript. ND, Conceived the project, wrote the manuscript.
Conflict of Interest Statement
The authors declare that the research was conducted in the absence of any commercial or financial relationships that could be construed as a potential conflict of interest.
Acknowledgments
We thank D. Andreasen, R. Blanco Segura, S. Cheves Hernandez, A. J. Cunningham, K. E. Glander, J. Guevara, W. McCandless, L. McPherson, J. Matthews, I. Mesen, K. Nguyen, and M. Ramsier for generous technical and logistical assistance. We also thank our two reviewers. Funding was received from Dartmouth College (Claire Garber Goodman Fund Grant to AM), the Natural Sciences and Engineering Research Council of Canada (Postdoctoral Fellowship to AM), and the University of Cincinnati (faculty start-up to BC). Permission to sample and export bones was granted by the Ministerio de Ambiente, Energía y Telecomunicaciones and the Sistema Nacional de Areas de Conservacion of Costa Rica (permit nos. ACG-PI-007-2012 and DGVS-622-2012). Samples from CITES Appendix I-listed species were imported under certificate no. 09US684773/9.
Supplementary Material
The Supplementary Material for this article can be found online at: https://www.frontiersin.org/article/10.3389/fevo.2015.00127
References
Ambrose, S. H. (1990). Preparation and characterization of bone and tooth collagen for isotopic analysis. J. Archaeol. Sci. 17, 431–451. doi: 10.1016/0305-4403(90)90007-R
Ambrose, S. H. (1992). The oxygen isotope ecology of East African mammal bone. J. Vert. Paleontol. 12, 16A.
Barbour, M. M., Fischer, R. A., Sayre, K. D., and Farquhar, G. D. (2007). Oxygen isotope ratio of leaf and grain material correlates with stomatal conductance and grain yield in irrigated wheat. Aust. J. Plant Physiol. 27, 625–637. doi: 10.1071/PP99041
Bocherens, H., Fogel, M. L., Tuross, N., and Zeder, M. (1995). Trophic structure and climatic information from isotopic signatures in Pleistocene cave fauna of Southern England. J. Archaeol. Sci. 22, 327–340. doi: 10.1006/jasc.1995.0035
Bocherens, H., Koch, P. L., Mariotti, A., Geraads, D., and Jaeger, J.-J. (1996). Isotopic biogeochemistry of mammalian enamel (13C, 18O) from African Pleistocene hominid sites. Palaios 11, 306–318. doi: 10.2307/3515241
Britton, S. W., and Atkinson, W. E. (1938). Poikilothermism in the sloth. J. Mammal. 19, 94–99. doi: 10.2307/1374287
Bryant, J. D., and Froelich, P. N. (1995). A model of oxygen isotope fractionation in body water of large mammals. Geochim. Cosmochim. Acta 59, 4523–4537. doi: 10.1016/0016-7037(95)00250-4
Campos, F. A., and Fedigan, L. M. (2009). Behavioral adaptations to heat stress and water scarcity in white-faced capuchins (Cebus capucinus) in Santa Rosa National Park, Costa Rica. Am. J. Phys. Anthropol. 138, 101–111. doi: 10.1002/ajpa.20908
Carter, M., and Bradbury, M. (2015). Oxygen isotope ratios in primate bone carbonate reflect amount of leaves and vertical stratification in the diet. Am. J. Primatol. doi: 10.1002/ajp.22432. [Epub ahead of print].
Cerling, T. E., Hart, J. A., and Hart, T. B. (2004). Isotope ecology in the Ituri forest. Oecologia 138, 5–12. doi: 10.1007/s00442-003-1375-4
Cernusak, L. A., Tcherkez, G., Keitel, C., Cornwell, W. K., Santiago, L. S., Knohl, A., et al. (2009). Why are non-photosynthetic tissues generally 13C enriched compared with leaves in C3 plants? Review and synthesis of current hypotheses. Funct. Plant Biol. 36, 199–213. doi: 10.1071/FP08216
Codron, D., Lee-Thorp, J. A., Sponheimer, M., de Ruiter, D., and Codron, J. (2006). Inter-and intrahabitat dietary variability of Chacma baboons (Papio ursinus) in South African savannas based on fecal δ13C, δ15N, and %N. Am. J. Phys. Anthropol. 129, 204–214. doi: 10.1002/ajpa.20253
Cormie, A. B., Luz, B., and Schwarcz, H. P. (1994). Relationship between the hydrogen and oxygen isotopes of deer bone and their use in the estimation of relative humidity. Geochim. Cosmochim. Acta 58, 3439–3449. doi: 10.1016/0016-7037(94)90097-3
Crowley, B. E. (2014). Oxygen isotope values in bone collagen and bone carbonate are consistently offset for New World monkeys. Biol. Lett. 10:20140759. doi: 10.1098/rsbl.2014.0759
Crowley, B. E., Carter, M. L., Karpanty, S. M., Zihlman, A. L., Koch, P. L., and Dominy, N. J. (2010). Stable carbon and nitrogen isotope enrichment in primate tissues. Oecologia 164, 611–626. doi: 10.1007/s00442-010-1701-6
Crowley, B. E., Thorén, S., Rasoazanabary, E., Vogel, E. R., Barrett, M. A., Zohdy, S., et al. (2011). Explaining geographical variation in the isotope composition of mouse lemurs (Microcebus). J. Biogeogr. 38, 2106–2121. doi: 10.1111/j.1365-2699.2011.02551.x
Farquhar, G. D., Cernusak, L. A., and Barnes, B. (2007). Heavy water fractionation during transpiration. Plant Physiol. 143, 11–18. doi: 10.1104/pp.106.093278
Farquhar, G. D., and Sharkey, T. D. (1982). Stomatal conductance and photosynthesis. Annu. Rev. Plant Physiol. 33, 317–345. doi: 10.1146/annurev.pp.33.060182.001533
Glander, K. E. (1978). Drinking from arboreal water sources by mantled howling monkeys (Alouatta palliata Gray). Folia Primatol. 29, 206–217. doi: 10.1159/000155840
Golightly, R. T. J., and Ohmart, R. D. (1984). Water economy of two desert canids: coyote and kit fox. J. Mammal. 65, 51–58. doi: 10.2307/1381199
Holmes, T. D., Bergstrom, M. L., and Fedigan, L. M. (2011). Sleeping site selection by white-faced capuchins (Cebus capucinus) in the Area de Conservación Guanacaste, Costa Rica. Ecol. Environ. Anthropol. 6, 1–9.
Hyodo, F., Matsumoto, T., Takematsu, Y., Kamoi, T., Fukuda, D., Nakagawa, M., et al. (2010). The structure of a food web in a tropical rain forest in Malaysia based on carbon and nitrogen stable isotope ratios. J. Trop. Ecol. 26, 205–214. doi: 10.1017/S0266467409990502
Kalacska, M., Sanchez-Azofeifa, G. A., Rivard, B., Caelli, T., White, H. P., and Calvo-Alvarado, J. C. (2007). Ecological fingerprinting of ecosystem succession: estimating secondary tropical dry forest structure and diversity using imaging spectroscopy. Remote Sens. Environ. 108, 82–96. doi: 10.1016/j.rse.2006.11.007
Kirsanow, K., and Tuross, N. (2011). Oxygen and hydrogen isotopes in rodent tissues: impact of diet, water and ontogeny. Palaeogeogr. Palaeoclimatol. Palaeoecol. 310, 9–16. doi: 10.1016/j.palaeo.2011.03.022
Kohn, M. J. (1996). Predicting animal δ18O: accounting for diet and physiological adaptation. Geochim. Cosmochim. Acta 60, 4811–4829. doi: 10.1016/S0016-7037(96)00240-2
Krigbaum, J., Berger, M. H., Daegling, D. J., and McGraw, W. S. (2013). Stable isotope canopy effects for sympatric monkeys at Taï Forest, Côte d'Ivoire. Biol. Lett. 9:20130466. doi: 10.1098/rsbl.2013.0466
Lachniet, M. S., and Patterson, W. P. (2002). Stable isotope values of Costa Rican surface waters. J. Hydrol. 260, 135–150. doi: 10.1016/S0022-1694(01)00603-5
Lattanzio, M. S., and Laduke, T. C. (2012). Habitat use and activity budgets of emerald basilisks (Basiliscus plumifrons) in northeast Costa Rica. Copeia 3, 465–471. doi: 10.1643/CP-11-025
Lee-Thorp, J. A., and Sponheimer, M. (2005). Opportunities and constraints for reconstructing palaeoenvironments from stable light isotope ratios in fossils. Geol. Q. 49, 195–204. Available online at: https://gq.pgi.gov.pl/article/view/7379
Levin, N. E., Cerling, T. E., Passey, B. H., Harris, J. M., and Ehleringer, J. R. (2006). A stable isotope aridity index for terrestrial environments. Proc. Natl. Acad. Sci. U.S.A. 103, 11201–11205. doi: 10.1073/pnas.0604719103
Lindshield, S. M. (2006). The Density and Distribution of Ateles Geoffroyi in a Mosaic Landscape at El Zota Biological Field Station, Costa Rica. M.A. thesis, Iowa State University.
Melin, A. D., Crowley, B. E., Brown, S. T., Wheatley, P. V., Moritz, G. L., Yit Yu, F. T., et al. (2014b). Calcium and carbon stable isotope ratios as paleodietary indicators. Am. J. Phys. Anthropol. 154, 633–643. doi: 10.1002/ajpa.22530
Melin, A. D., Young, H. C., Mosdossy, K., and Fedigan, L. (2014a). Seasonality, extractive foraging and the evolution of primate sensorimotor intelligence. J. Hum. Evol. 71, 77–86. doi: 10.1016/j.jhevol.2014.02.009
Moritz, G. L., Fourie, N., Yeakel, J. D., Phillips-Conroy, J. E., Jolly, C. J., Koch, P. L., et al. (2012). Baboons, water, and the ecology of oxygen stable isotopes in an arid hybrid zone. Physiol. Biochem. Zool. 85, 421–430. doi: 10.1086/667533
Nagy, K. A., and Montgomery, G. G. (1980). Field metabolic rate, water flux, and food consumption in three-toed sloths (Bradypus variegatus). J. Mammal. 61, 465–472. doi: 10.2307/1379840
Nelson, S. V. (2013). Chimpanzee fauna isotopes provide new interpretations of fossil ape and hominin ecologies. Proc. Biol Sci. 280:20132324. doi: 10.1098/rspb.2013.2324
Oliveira-Santoa, L. G. R., Machado-Filho, L. C. P., Tortato, M. A., and Brusius, L. (2010). Influence of extrinsic variables on activity and habitat selection of lowland tapirs (Tapirus terrestris) in the coastal sand plain shrub, southern Brazil. Mammal. Biol. 75, 219–226. doi: 10.1016/j.mambio.2009.05.006
Ometto, J. P. H., Flanagan, L. B., Martinelli, L. A., and Ehleringer, J. R. (2005). Oxygen isotope ratios of waters and respired CO2 in Amazonian forest and pasture ecosystems. Ecol. Appl. 15, 58–70. doi: 10.1890/03-5047
Pietsch, S. J., Hobson, K. A., Wassenaar, L. I., and Tutken, T. (2011). Tracking cats: problems with placing feline carnivores on δ18O, δD isoscapes. PLoS ONE 6:e24601. doi: 10.1371/journal.pone.0024601
Podlesak, D. W., Torregrossa, A. M., Ehleringer, J. R., Dearing, M. D., Passey, B. H., and Cerling, T. E. (2008). Turnover of oxygen and hydrogen isotopes in the body water, CO2, hair, and enamel of a small mammal. Geochim. Cosmochim. Acta 72, 19–35. doi: 10.1016/j.gca.2007.10.003
Richards, S. A. (1970). The biology and comparative physiology of thermal panting. Biol. Rev. Camb. Philos. Soc. 45, 223–264. doi: 10.1111/j.1469-185X.1970.tb01631.x
Secord, R., Wing, S. L., and Chew, A. (2008). Stable isotopes in early Eocene mammals as indicators of forest canopy structure and resource partitioning. Paleobiology 34, 282–300. doi: 10.1666/0094-8373(2008)034[0282:SIIEEM]2.0.CO;2
Seibt, U., Wingate, L., and Berry, J. A. (2007). Nocturnal stomatal conductance effects on the δ18O signatures of foliage gas exchange observed in two forest ecosystems. Tree Physiol. 27, 585–595. doi: 10.1093/treephys/27.4.585
Senf, M. J. (2009). Interspecific and Integroup Interactions of Mantled Howling Monkeys (Alouatta Palliata) in Primary Versus Secondary Forest at El Zota Biological Field Station, Costa Rica. M.A. thesis, Iowa State University.
Smith, F. A., Lyons, S. K., Ernest, S. K. M., Jones, K. E., Kaufman, D. M., Dayan, T., et al. (2003). Body mass of late Quaternary mammals. Ecology 84, 3402. doi: 10.1890/02-9003
Sternberg, L. S. L., Mulkey, S. S., and Wright, S. J. (1989). Oxygen isotope ratio stratification in a tropical moist forest. Oecologia 81, 51–56. doi: 10.1007/BF00377009
Swanson, H. K., Lysy, M., Power, M., Stasko, A. D., Johnson, J. D., and Reist, J. D. (2015). A new probabilistic method for quantifying n-dimensional ecological niches and niche overlap. Ecology 96, 318–324. doi: 10.1890/14-0235.1
Tuross, N., Fogel, M. L., and Hare, P. E. (1988). Variability in the preservation of the isotopic composition of collagen from fossil bone. Geochim. Cosmochim. Acta 52, 929–935. doi: 10.1016/0016-7037(88)90364-X
Tuross, N., Warinner, C., Kirsanow, K., and Kester, C. (2008). Organic oxygen and hydrogen isotopes in a porcine controlled dietary study. Rapid Commun. Mass Spectrom. 22, 1741–1745. doi: 10.1002/rcm.3556
van der Merwe, N. J., and Medina, E. (1991). The canopy effect, carbon isotope ratios and foodwebs in Amazonia. J. Archaeol. Sci. 18, 249–259. doi: 10.1016/0305-4403(91)90064-V
Voigt, C. C. (2010). Insights into strata use of forest animals using the ‘canopy effect’. Biotropica 46, 634–637. doi: 10.1111/j.1744-7429.2010.00703.x
White, T. D., Ambrose, S. H., Suwa, G., Su, D. F., DeGusta, D., Bernor, R. L., et al. (2009). Macrovertebrate paleontology and the Pliocene habitat of Ardipithecus ramidus. Science 326, 87–93. doi: 10.1126/science.1175822
Yakir, D. (1997). “Oxygen-18 of leaf water: a crossroad for plant associated isotopic signals,” in Stable Isotopes: Integration of Biological, Ecological, and Geochemical Processes, ed H. Griffiths (Oxford: Bios Scientific), 147–168.
Keywords: Costa Rica, collagen, niche overlap, carbon, nitrogen, oxygen
Citation: Crowley BE, Melin AD, Yeakel JD and Dominy NJ (2015) Do Oxygen Isotope Values in Collagen Reflect the Ecology and Physiology of Neotropical Mammals? Front. Ecol. Evol. 3:127. doi: 10.3389/fevo.2015.00127
Received: 04 September 2015; Accepted: 26 October 2015;
Published: 12 November 2015.
Edited by:
Valentí Rull, Institute of Earth Sciences “Jaume Almera” (ICTJA-CSIC), SpainReviewed by:
Xavier Jordana, Institut Català de Paleontologia Miquel Crusafont, SpainHervé Bocherens, Universität Tübingen, Germany
Copyright © 2015 Crowley, Melin, Yeakel and Dominy. This is an open-access article distributed under the terms of the Creative Commons Attribution License (CC BY). The use, distribution or reproduction in other forums is permitted, provided the original author(s) or licensor are credited and that the original publication in this journal is cited, in accordance with accepted academic practice. No use, distribution or reproduction is permitted which does not comply with these terms.
*Correspondence: Brooke E. Crowley, brooke.crowley@uc.edu