Mammuthus Population Dynamics in Late Pleistocene North America: Divergence, Phylogeography, and Introgression
 Jacob Enk1,2,3* Alison Devault1,3
  Christopher Widga4 Jeffrey Saunders4
  Paul Szpak5 John Southon6 Jean-Marie Rouillard3
  Beth Shapiro7
  G. Brian Golding2
  Grant Zazula8
  Duane Froese9,10
  Daniel C. Fisher11
  Ross D. E. MacPhee12*
  Hendrik Poinar1,2,13*
- 1Department of Anthropology, McMaster Ancient DNA Centre, McMaster University, Hamilton, ON, Canada
- 2Department of Biology, McMaster University, Hamilton, ON, Canada
- 3MYcroarray, Ann Arbor, MI, USA
- 4Geology Section, Illinois State Museum Research and Collections Center, Springfield, IL, USA
- 5Department of Anthropology, University of British Columbia, Vancouver, BC, Canada
- 6Keck Carbon Cycle Accelerator Mass Spectrometer, Earth Systems Science Department, University of California, Irvine, Irvine, CA, USA
- 7Ecology and Evolutionary Biology, University of California Santa Cruz, Santa Cruz, CA, USA
- 8Yukon Palaeontology Program, Department of Tourism and Culture, Yukon Government, Whitehorse, YT, Canada
- 9Department of Earth and Atmospheric Sciences, University of Alberta, Edmonton, AB, Canada
- 10Museum of Paleontology and Department of Geological Sciences, University of Michigan, Ann Arbor, MI, USA
- 11Museum of Paleontology and Department of Earth and Environmental Sciences, University of Michigan, Ann Arbor, MI, USA
- 12Division of Vertebrate Zoology/Mammalogy, American Museum of Natural History, New York, NY, USA
- 13Michael G. DeGroote Institute for Infectious Disease Research, McMaster University, Hamilton, ON, Canada
After evolving in Africa at the close of the Miocene, mammoths (Mammuthus sp.) spread through much of the northern hemisphere, diversifying morphologically as they entered various habitats. Paleontologically, these morphs are conventionally recognized as species. In Pleistocene North America alone, several mammoth species have been recognized, inhabiting environments as different as cold tundra-steppe in the north and the arid grasslands or temperate savanna-parklands of the south. Yet mammoth phylogeographic studies have overwhelmingly focused on permafrost-preserved remains of only one of these species, Mammuthus primigenius (woolly mammoth). Here we challenge this bias by performing a geographically and taxonomically wide survey of mammoth genetic diversity across North America. Using a targeted enrichment technique, we sequenced 67 complete mitochondrial genomes including non-primigenius specimens representing Mammuthus columbi (Columbian mammoth), Mammuthus jeffersonii (Jeffersonian mammoth), and Mammuthus exilis (pygmy mammoth), including specimens from contexts not generally associated with good DNA preservation. While we uncovered clear phylogeographic structure in mammoth matrilines, their phylogeny as recovered from mitochondrial DNA is not compatible with existing systematic interpretations of their paleontological record. Instead, our results strongly suggest that various nominal mammoth species interbred, perhaps extensively. We hypothesize that at least two distinct stages of interbreeding between conventional paleontological species are likely responsible for this pattern—one between Siberian woolly mammoths and resident American populations that introduced woolly mammoth phenotypes to the continent, and another between ecomorphologically distinct populations of woolly and Columbian mammoths in North America south of the ice.
Introduction
The conventional dual-source view of New World mammoth evolution (Harington, 1984; Agenbroad, 2005; Fisher, 2009; Saunders et al., 2010) holds that the Late Pleistocene diversity originated from two distinct, differently adapted ancestral lineages (or species). After diverging from other elephantids in the late Miocene, the earliest mammoths spread from Africa to Eurasia, reaching the Siberian subarctic by the Early Pleistocene. During the early Irvingtonian North American Land Mammal Age (NALMA), 1.8–0.24 Ma, the primitive species Mammuthus meridionalis (southern mammoth) entered North America over the Bering Land Bridge. From this source arose the Columbian mammoth, Mammuthus columbi, a widespread species adapted to mid-continental parklands and grasslands, together with perhaps one or two other more specialized taxa (Mammuthus exilis, Channel Islands pygmy mammoth, and the eastern woodlands Mammuthus jeffersonii, Jefferson's mammoth). Meanwhile, in western Beringia (Chukotka), a different primitive species, cold-adapted Mammuthus trogontherii (steppe mammoth), evolved into the woolly mammoth (Mammuthus primigenius), which first entered northwestern North America during the early Rancholabrean NALMA, 0.125–0.011 Ma. Thereafter, woolly mammoths progressively moved southward along steppe habitats bordering the Laurentide ice sheet, eventually reaching the present-day Great Lakes region and Atlantic Coast. Despite their success in expanding into almost every habitable region within Late Pleistocene North America, all mammoth species were extinct by the start of the Holocene or shortly thereafter (Haile et al., 2009).
Lister and Sher (2015) recently challenged a central feature of this model. On the basis of a detailed morphological investigation of large samples of mammoth third molars, they concluded that there is no acceptable evidence for the presence of M. meridionalis in North America at any time during the Pleistocene. In their analysis, specimens previously identified as such either represent M. trogontherii or are too damaged or ambiguous for secure placement. Since M. columbi is universally regarded as a North American endemic, it must have arisen from the only available antecedent, M. trogontherii. As evidence of M. meridionalis is also lacking in northeastern Eurasia, it follows that M. trogontherii must also be the ancestor of the earliest known examples of M. primigenius, which occur in western Beringia and are dated on biostratigraphic grounds to the interval 0.8–0.4 Ma (Lister and Sher, 2001). The steppe mammoth is thus also the direct ancestor of later clades of woolly mammoths that crisscrossed Beringia, both into and out of North America, prior to their final extinction (Debruyne et al., 2008).
This new single-source hypothesis simplifies some aspects of mammoth evolution in the New World, but does not resolve all major puzzles. First, the strength of the morphological argument depends fundamentally on the assumption that perceived patterns of morphological change in mammoth molars were unidirectional, at least on average. Two important characters, average lamellar counts and relative crown height as a measure of hypsodonty, are assumed to have uniformly increased over the course of mammoth evolution, but to different degrees in different lineages (Maglio, 1973; Lister, 1996; Todd and Roth, 1996; Sanders, 2010). Thus, molars of M. meridionalis are less hypsodont and simpler in lamellar construction than those of M. trogontherii; likewise, typical M. columbi third molars express lower hypsodonty indices and average lamellar counts than those of M. primigenius. According to the dual-source hypothesis, the distribution of states of these features across time implies two directed evolutionary sequences, such that meridionalis→columbi and trogontherii→primigenius. But it is obvious that, given the assumption of unidirectionality, in principle either of the two primitive mammoths could have produced the North American taxa. Lister and Sher (2015) concluded that the ancestor must have been trogontherii not only because meridionalis teeth cannot be recognized unequivocally in the North American record, but also because a handful of other features, such as enamel thickness and skull and jaw shape, also correlate with the primary features of the molars. Nonetheless, these authors recognized that these assumptions might be problematic if unidirectionality does not apply, and acknowledged that, despite their exhaustive analysis, they cannot completely discount the possibility that M. meridionalis might have reached North America in an earlier, presumably dead-end incursion.
Secondly, the single-source hypothesis requires that temporally and biogeographically distinct populations of M. trogontherii gave rise to the successor species M. columbi and M. primigenius, which thereafter (it is assumed) prospered in genetic isolation from each other. In particular, this hypothesis requires a gap of well over 1 Ma between the imputed divergence time of M. columbi in North America (?1.5 Ma) and the first arrival of M. primigenius in eastern Beringia (?0.1 Ma), meaning that the earliest interactions these species might have had with each other would have been well within Rancholabrean time. This timing possibly conflicts with recent genomic and phylogeographic investigations (Hagelberg et al., 1994; Höss et al., 1994; Ozawa et al., 1997; Krause et al., 2006; Barnes et al., 2007; Debruyne et al., 2008; Gilbert et al., 2008; Nystrom et al., 2010; Enk et al., 2011; Palkopoulou et al., 2013) which show that the population dynamics of Late Pleistocene mammoths were complex and reticulated, involving not only migratory movements in both directions over the Bering Land Bridge but also introgressions among nominal species or distinct populations.
In an initial effort to explore this apparent conflict between paleontological and genomic indicators of species boundaries, Enk et al. (2011) presented evidence supporting a more complex genetic history for Mammuthus in North America than is implied by the conventional model of M. columbi and M. primigenius having evolved independently for over a million years. In this study, two terminal Pleistocene mammoth specimens, nominally regarded as Columbian, were found to be mitochondrially more closely related to North American woolly mammoths (closest to Clade I/haplogroup C) than woolly mammoths from different continents were to each other, indicating that at points in the past, the two paleontological species had interbred. However, given the severe limitation in samples, it could not be settled whether these instances of woolly-Columbian mitogenomic affinity were typical or exceptional. If exceptional, it is possible that the lineages of the Columbian mammoths originally studied had acquired woolly mammoth mitochondrial genomes through hybridization events. There is behavioral precedent for introgression among extant African elephants (Roca et al., 2005), and some authors have suggested this might explain intermediate woolly-Columbian morphologies (sometimes distinguished taxonomically as M. jeffersonii) found in Pleistocene ecotonal regions (Hoyle et al., 2004; Fisher, 2009). On the other hand, if mitogenomic affinity between the two taxa is not exceptional but rather the norm, it is plausible that North American woolly mammoths acquired their mitochondrial genomes from endemic North American populations that descended from the initial invasion of M. trogontherii in the Middle Pleistocene.
In order to address whether the signal retrieved by Enk et al. (2011) is typical or exceptional for Columbian mammoths, a survey of mitochondrial diversity in non-woolly North American mammoths is needed. In addition to addressing questions of mammoth systematics and behavior, such a survey would also potentially allow us to examine the population structure and dynamics of Mammuthus in previously uncharacterized parts of their range.
The possibility of routinely assembling large phylogeographic datasets from Pleistocene specimens found in low-latitude, thermolabile contexts has only recently emerged. The relatively dry and thermostable depositional contexts found at higher latitudes more readily preserve DNA in fragment lengths practical for gene resequencing with overlapping PCR amplicons (Smith et al., 2003; Mitchell et al., 2005; Kircher, 2012). The constraints imparted by PCR-based approaches have also led to the predominant use of relatively short contiguous sequences (< 800 bp) for reconstructing the phylogeographic history of mammoths and other megafauna (Barnes et al., 2007; Debruyne et al., 2008; Nystrom et al., 2010; Palkopoulou et al., 2013). Fortunately, recent technological advances in targeted enrichment and high throughput sequencing now permit efficient sequencing of the heavily fragmented DNA typical of more exposed and thermolabile contexts (Bos et al., 2011; Carpenter et al., 2013; Enk et al., 2013; Wagner et al., 2014). Here we use these technologies to capture, sequence and analyze the complete mitochondrial genomes of mammoths that lived south of the Laurentide ice sheet. This enabled a broad survey of North American mammoth mitogenomic diversity and permitted a plausible reconstruction of certain aspects of mammoth population structure and dynamics during the last part of the Pleistocene.
Materials and Methods
Specimen Sampling
Mammuthus hard and soft tissue specimens were sampled from the University of Michigan Museum of Paleontology, New York State Museum, Illinois State Museum, University of Nebraska State Museum, Denver Museum of Nature and Science, University of California Museum of Paleontology, Santa Barbara Museum of Natural History, Central Washington University, Northern Arizona University, Geological Museum of the University of Wyoming, Canadian Museum of Nature, and the Yukon Government Paleontological collections. Specimens came from 25 U.S. states, two Canadian provinces/territories, and Siberia. Some specimens had been formally described and allocated to one or another of the nominal taxa M. primigenius, M. columbi, M. jeffersonii, or M. exilis on the basis of morphology, but many had not. We did not revise any formal allocations, even when the basis for referral was unclear. Some specimens having no previous allocation were examined and referred to taxon following Maglio (1973). However, as will be evident from the genetic results presented here, it is obvious that a re-evaluation of the actual effectiveness of morphological bases for discriminating taxa within Mammuthus would be useful. Locality information, taxon, and radiocarbon ages (when available) of the specimens yielding complete or nearly complete mitogenomes are provided in Supplemental Table 1A.
DNA Extraction
Specimens were initially subsampled by the authors or contributing scientists at the site of curation. Once at the McMaster Ancient DNA Centre, specimens were handled in dedicated ancient DNA laboratory facilities, where we further subsampled 50–500 mg of cementum, dentin, bone, coprolite, or muscle tissue and pulverized these with a hammer to particle sizes ranging from powder to 1–5 mm fragments. A bone specimen from a Pleistocene Mylodon darwinii was also subsampled and included in all extraction sets in a ratio of at least 1:16 mylodon:mammoth to serve as a negative control for monitoring contamination (one mylodon extract for every 16 mammoth samples). Subsamples were then subjected to an initial wash for 0.5–1.5 h in 0.5 M EDTA (pH 8.0) with agitation at room temperature, centrifuged and decanted. These pre-washed pellets were then demineralized with EDTA overnight at room temperature, and the supernatants removed following centrifugation. Then the pellets were either demineralized again or digested with a Tris-HCl-based proteinase K digestion solution with 0–0.5% sodium lauryl sarcosine (sarcosyl, Fisher Scientific), 0–1% polyvinylpolypyrrolidone (PVP, Fisher Scientific), 0–50 mM dithiothreitol (DTT), 0–2.5 mM N-phenacyl thiazolium bromide (PTB, Prime Organics), and 2.5 mM calcium chloride (CaCl2). These proteinase digestions were performed at room temperature overnight, or between 37 and 55°C for 3–10 h with agitation. Following centrifugation, the digestion supernatants were removed and in most cases pooled with the demineralization supernatants, although in some cases they were kept separate. For several pellets that remained undigested, we repeated this process, pooling with the original rounds or keeping them separate for use in shotgun sequencing. Organics were removed from pooled or individual supernatants using phenol:chloroform:isoamyl alcohol (PCI, 25:24:1), and the resulting post-centrifugation aqueous solution was again extracted with chloroform:isoamyl alcohol (25:1). We then concentrated the final aqueous phases with 10 or 30 kDA Amicon centrifuge filters (Millipore) at 7–10 k × g, with up to four washes with 0.1 × or 1 × TE buffer (pH 7–8.5) to provide final desalted concentrates of 25–100 μL.
Quantitative PCR Screens
It has been previously shown that a short single-locus quantitative PCR assay can be used with some accuracy to predict on-target ancient DNA high-throughput sequencing read counts both before and after targeted enrichment (Enk et al., 2013). With this in mind we screened the extracts in duplicate for a short 49 bp portion of the mammoth mitochondrial 12S gene, using the quantitative PCR protocol in Supplemental Table 2A and employing 1 μL of 0.1X concentration of the extracts diluted with 0.1 × or 1 × Tween-TE (buffer TE with 0.05% Tween-20). Successful amplification was strongly biased toward specimens from northern latitudes and eastern longitudes, with no specimens from Oklahoma, Texas, New Mexico, Nevada, South Carolina or Florida yielding amplifiable DNA. Only three of 74 specimens from California showed consistent amplification of the 49 bp locus, with an increase in successful amplification rates within the whole North American dataset as we moved eastward. Specimens from deposits just south of or adjacent to the former extent of the Laurentide ice showed good rates of amplification, consistent with the notion that the thermostability of their depositional contexts played a role in long-term survival of DNA, despite relatively warm Holocene conditions.
Library Preparation
For further treatment, in addition to Mylodon control extractions, we chose extracts that either exhibited consistent duplicate amplification or, alternatively, failed to amplify consistently but were geographically or taxonomically interesting. We purified these with MinElute columns (QIAGEN) to 20–40 μL EBT and converted them to double-stranded, UDG-treated Illumina sequencing libraries (Meyer and Kircher, 2010; Kircher et al., 2012) according to the protocols in Supplemental Table 2B. Some of these resulting libraries were then double-indexed with P5 and P7 indexing primers (Kircher et al., 2012) and purified again with MinElute to 13 μL EBT. For most samples we screened their indexed libraries again with the 49 bp locus; metrics on these as well as extract qPCR values are presented in Supplemental Table 3. The majority of extracts that screened positive for the 49 bp locus were again consistently positive following indexing and purification; the target did not amplify in any Mylodon controls.
Targeted Enrichment
We designed a set of 100 bp baits tiled every 5 bases across six mitochondrial genome sequences, including one representative of each mammoth haplogroup known at the time (GenBank Accession #NC015529, EU153447, EU153453, EU153456, and a mitogenome that we generated early in this project from the specimen known as Lyuba) as well as the mitogenome of the American mastodon, Mammut americanum (NC009547). The variable tandem repeat section (VNTR) of the D-loop was masked with 10 Ns prior to bait design, as it is too long to resolve with short read sequencing. In light of evidence that bait coverage across targets can result in coverage biases in target read coverage (Mokry et al., 2010; Enk et al., 2013), we chose not to collapse baits of identical sequence prior to manufacture. Baits were then synthesized by MYcroarray (Ann Arbor, MI, USA) as part of several MYbaits targeted enrichment kits.
We used 10 μL of each indexed library in 36–38 h hybridization reactions at 48°C following the MYbaits targeted enrichment protocol, replacing some kit constituents with higher concentration versions to accommodate the extra library input volume. Phosphate-group end-blocked oligonucleotides matching one strand of the regions flanking the 7 bp indexes of the library adapters were included. We used 50 ng of baits per reaction, which is at least double what we expected to be sufficient for very sensitive capture of a target region of this size from short ancient DNAs (Enk et al., 2013). Following hybridization, the reactions were cleaned according to the kit protocol except with 200 μL rather than 500 μL volumes of wash buffers for each wash step to accommodate 96-well plate-format manipulation. Hot washes were performed at 48°C. These enriched libraries were eluted and then purified with MinElute to 13 μL EBT, which we then re-amplified according to the protocol in Supplemental Table 2A and again purified to 13 μL EBT.
Illumina Sequencing
Enriched libraries were pooled and sequenced on an Illumina HiSeq® 1500 platform using a 70 bp (“SE”-prefix libraries), 80 (“VE”- and “SVE”-prefix libraries), or 85 bp (“EE”-prefix libraries) paired-end double-index protocol. Both cBot cluster generation and sequencing employed the v3 chemistry and a dual 7 bp indexing protocol, using the alternative primer mixes from the TruSeq Dual Index Sequencing Primer Kit (Paired End). We included a dedicated control lane with the PhiX control kit v3 and a 1% PhiX spike in each lane. Raw data were processed with HCS version 1.5.15.1 and RTA version 1.13.48.0. File conversion and demultiplexing using each 7 bp reverse index (requiring a 100% match) was performed with CASAVA version 1.8.2.
Libraries with Prefix “EID”
Some of the mitogenomes analyzed in this study were generated simultaneously with those described elsewhere (Enk et al., 2013) and are indicated with an “EID” prefix in Supplemental Table 3. Major differences between those experiments and the ones described here are that those libraries were prepared without UDG treatment, index-amplified for varying numbers of cycles, and enriched once at 45°C with a duplicate bait-collapsed proboscidean mitogenome bait set.
Shotgun Sequencing
Two libraries included here (Oimyakon and Lyuba/SID04-11 and SID36-10) were prepared and indexed at the McMaster Ancient DNA Centre and then sent to Harvard Medical School for further processing. There, the libraries were size-selected for inserts longer than 40 bp with gel electrophoresis, purified with the QiaQuick Gel Purification kit (QIAGEN) and reamplified. These libraries were then sequenced on an Illumina MiSeq® platform using a paired-end 75 bp single-index protocol, with the read data post-processed using the default settings in the MiSeq® Control Software. For another specimen (2005/915), four libraries generated from different extract fractions were sequenced on an Illumina HiSeq 1500 platform using a 64 bp paired-end double-index protocol and post-processed as with the other HiSeq data. Data from these four 2005/915 libraries were combined, and all shotgun read sets were then carried through pipeline analysis of the enriched library read sets, described below.
Data Curation
Read 1 and Read 2 sequence files were trimmed of adapter sequence, simultaneously merged, and filtered of short reads with SeqPrep (https://github.com/jstjohn/SeqPrep), keeping only reads 24 bp and above (-L 24), requiring an 11 bp overlap between paired reads (-o 11) and searching for the 13 bp universal linker on both the P5 and P7 adapters (-A AGATCGGAAGAGC). Merged reads were then combined with the non-mergeable adapter-trimmed Read 1 reads for a final read dataset used for alignment. This inclusion of unmerged reads is expected to simultaneously inflate and deflate unique read counts, with a bias toward deflation due to inserts of variable length potentially mapping to identical 5′–3′ coordinates but having been only partially sequenced by the cycle protocol employed.
Alignment and Consensus Calling
We used BWA version 0.6.1-r104 (Li and Durbin, 2009) to align reads to a M. columbi mitochondrial genome sequence (GenBank Accession #NC015529) using the parameters described in Schubert et al. (2012). We then collapsed reads with identical 5′ and 3′ coordinates and strand, keeping reads with the highest mapping quality scores, to generate final unique read alignments. Alignments were then inspected in Geneious Pro version R6.1.6 (Kearse et al., 2012), and consensuses were generated for positions covered by at least 3 unique reads, while positions with fewer than 3 unique reads coverage were called as N. We repeated this process for the 3′–5′ junction of the mitochondrial genome as well as the regions flanking the VNTR to resolve as many positions as possible. Strict consensuses were called requiring more than 50% of reads for each base to match. Consensus sequences were combined with a number of other complete mammoth mitogenome sequences previously published (Supplemental Table 1B), then aligned to an Elephas maximus mitogenome sequence (GenBank Accession #EF588275) in Geneious and manually adjusted at apparently misaligned regions, referring back to the original read alignments to confirm the proper configuration. The final to-Elephas alignment served as input for phylogenetic analysis.
Second-Round Enrichment and Sequencing
Mitogenomes were considered “complete” if at least 90% of bases were covered by at least 3 unique reads. Several libraries did not provide this after the first round of enrichment and sequencing, and so for these we reconstructed complexity curves to gauge whether all unique mitochondrial molecules had been characterized in the first round. To do this we first converted the pre-collapsed alignments to BED files with BEDOPS version 2.2.0 (Neph et al., 2012) and then randomly sampled these in 1% increments and collapsed to unique reads. In cases where the complexity curves had reached plateau, we calculated whether the mitogenome could be obtained by enriching and sequencing the second half of the original libraries, or whether residual extract itself would have to be re-prepped, enriched and sequenced. In cases where the complexity curves had not reached plateau but were non-linear, we used preseq version 0.0.3 (Daley and Smith, 2013) to predict the unique read yield with deeper sequencing. In cases where sufficient numbers of unique molecules could be obtained with an economical amount of additional sequencing, we sequenced these libraries further in a second Illumina run (“SSE”-prefix) or indexed more of the original library and enriched them once (“SSEP/D####” format). In cases where very deep sequencing would be required for resolving the mitogenome to sufficient depth, we enriched these libraries again using a protocol identical to that of the first round. These doubly-enriched libraries were then sequenced again (“SVEP/D##” name format), with mapping rates after this second round in Supplemental Table 3. Reads from the same specimen were then combined, and the read alignment, collapse, consensus generation, and final alignment were repeated.
AMS Radiocarbon Dating
Specimens yielding complete or near-complete mitogenome sequences that had not been previously AMS 14C-dated were further subsampled. Collagen from these specimens was then extracted and purified at the University of Western Ontario and AMS radiocarbon-dated at University of California, Irvine (Beaumont et al., 2010). Radiocarbon ages are included in Supplemental Table 1A (used for temporal analyses). Some specimens (ISM01, UCMP04, UCMP17, UNSM08, UNSM42, and UW20579) yielded atomic carbon:nitrogen ratios >3.5, which may be indicative of carbon contamination, but for the purposes of this study we treat the estimated ages of these samples as appropriate estimates of their geological ages. To calibrate radiocarbon dates to calendar years we used OxCal 4.2 (Ramsey and Lee, 2013) with the IntCal13 (Reimer et al., 2013) calibration curve, reporting the median calendar date estimates in Supplemental Table 1A even in cases where they were beyond the range of calibration.
Maximum Likelihood Tree Estimation
We used jModelTest 2 (Darriba et al., 2012) to choose the nucleotide substitution model (with 5 gamma-rate categories) that best fit our mitogenome alignment according to the corrected Akaike Information Criterion (AICc, Hurvich and Tsai, 1989) for the final alignment of our 67 new complete mitochondrial genome sequences and 21 previously-published elephantid mitogenome sequences. We then used IQ-TREE version 0.9.6 (Minh et al., 2013) on the full dataset to estimate a maximum likelihood (ML) tree, using the jModelTest-estimated AICc best model (GTR+I+G5) gamma distribution (-a 0.568) and proportion of invariant sites (-i 0.579). One hundred bootstrap iterations were performed (-b 100). We then estimated the Bayesian posterior probability support for the nodes in the ML consensus tree using BEAST version 1.8 (Drummond et al., 2012) forcing monophyly within Mammuthus, a calibration-free strict clock (and a strict clock) and a general time-reversible model with a proportion of invariant sites and a gamma distribution on the substitution rates (GTR+I+G) with 5 gamma categories, and broad uniform priors on both kappa parameters and the alpha parameter (0–1000 and 0–10, respectively). We ran this for 10 M generations sampling every 1 k generations, and following a 10% burn-in the posterior distribution of the tree likelihood securely converged with an effective sample size of 2310. Priors and posteriors for these analyses are in Supplemental Table 4. We then annotated the BEAST-estimated trees to the ML tree using treeannotator. The ML tree with nodal bootstrap and posterior probability support is depicted in Figure 2. We repeated this process with an alignment that included the partial mitochondrial genome consensuses called requiring a minimum of either 3 × or 2 × unique depth, depicted in Supplemental Figure 1.
Mutation Rate and tMRCA Estimation
To evaluate the temporal signal in our data we performed several 10 M-generation date randomization tests (Ho et al., 2008) in BEAST on an alignment including only those specimens with finite AMS 14C dates, the best model for which was again chosen according to the AICc in jModelTest 2 [Tamura-Nei (Tamura and Nei, 1993)+ I + G]. These analyses used only the median calibrated ages of the samples as single-point calibration points (“tips-only” calibration scheme). Each of the 95% highest posterior densities (HPDs) of the estimated mutation rates using shuffled tip dates fell outside of the HPD of that rate when using the actual tip dates, suggesting strong temporal signal in the data (Supplemental Figure 2).
To estimate the times to most recent common ancestry (tMRCAs) as represented by the various nodes in the reconstructed phylogeny, we performed a series of BEAST analyses under a tips-only scheme as well as two other calibration schemes that used internal nodal calibrations gleaned from fossil record chronology. In one, we used the age of the estimated Elephas-Mammuthus split for temporal calibration (“root only”), based on the value estimated by Rohland et al. (2007) as a normal prior distribution centering on 6.7 Ma with a standard deviation of 0.5 Ma. In a third scheme, both this root prior and individual tip priors were used (“root + tip”). In all cases the TN+I+G model was employed with an uncorrelated lognormal clock and constant population size prior. Prior distributions, the numbers of generations used, mean posterior values, 95% highest posterior density bounds (HPDs), and posterior effective sample sizes on all relevant parameters are indicated in Supplemental Table 4.
We performed another series of temporal analyses using a single additional sample, CMNH40031, a tooth found in situ at an Old Crow River (Yukon) locality below a prominent volcanic ash. This horizon is estimated to be at least MIS7 (~200 kya) in age and likely even older, but on the basis of its paleomagnetism, younger than 780 kya (Westgate et al., 2013). Therefore, we assigned a conservative tip date to this specimen of 200 kya to gauge its effect on the tMRCA estimates.
Bayesian Skygrid Analyses
In order to explore potential population size dynamics recovered from the mitogenome phylogeny, we performed a series of Bayesian Skygrid (Gill et al., 2013) analyses using the mammoth sequences alone. For temporal calibration we employed two separate calibration schemes. In one, tip dates alone were used. In another, internal nodal dates estimated from the tMRCA analyses with Elephas included (above section) were used as nodal temporal priors in addition to tip dates. All other priors were identical to those used for tMRCA estimations (where in common). In addition to using the alignment with all finite-dated mammoth specimens, we also performed individual analyses to compare trajectories between each member of three separate paired groups: (1) specimens from northern (Alaska, Yukon, and Siberia) vs. southern localities (2) periglacial (northern and Great Lakes specimens) vs. temperate localities, and (3) Old World vs. New World localities. Analyses used the substitution model identified in jModelTest for each individual partition and were run for a sufficient number of generations for convergence of all group size posteriors, with final ESS values of 200 or above. The results of these analyses are tabulated in Supplemental Table 5 and depicted in Figure 3.
Results and Discussion
Final Data Set
We extracted DNA from 234 Mammuthus specimens from sites broadly representing the mid-latitudes of North America (west coast, mountain west, Great Plains, Great Lakes, and east coast). The specimen set included nominally identified M. primigenius and several members of the Columbian complex of taxa: M. columbi (Columbian mammoth), M. exilis (Channel Islands pygmy mammoth) and M. jeffersonii (Jeffersonian mammoth) (Figure 1). All extracts were screened with a 49 bp proboscidean mitochondrion-specific quantitative PCR assay. Specimens that exhibited consistent amplification or were of particular geographic interest were then converted to Illumina sequencing libraries, enriched once or twice, and sequenced. Of the 276 DNA extracts we screened (including multiple extracts from some individuals), 78 lower-latitude samples (33%) amplified, whereas 37 (88%) of the northern specimens amplified. From this set we generated 67 complete or nearly complete mitogenome sequences (defined as >90% of the genome, covered to at least 3 × unique read depth) as well as more than a dozen partial mitogenomes (defined as 10–90%, covered to at least 3 × unique depth). Of these, 57 are from mammoths found at sites south of 51 degrees north latitude, which is slightly north of the existing USA-Canada border. We combined these with previously-published complete mammoth mitogenomes (Krause et al., 2006; Rogaev et al., 2006; Gilbert et al., 2007, 2008; Enk et al., 2011) for a final dataset of 87 complete mammoth mitogenome sequences, 68 of which have finite direct AMS radiocarbon dates. Localities represented by this combined dataset are depicted in Figure 1, with other sample information and experimental results available in Supplemental Tables 1, 3.
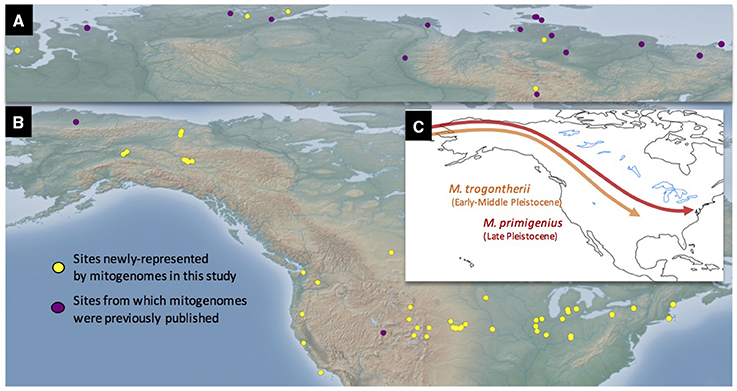
Figure 1. Site locations represented in this study and schematic models of Mammuthus immigrations into North America. Sites in both the Old (A) and New (B) Worlds are depicted. Conventionally, two mammoth species have long been recognized in the Late Pleistocene fossil record of North America, the Columbian mammoth Mammuthus columbi and the woolly mammoth M. primigenius. Some authors support the hypothesis that these species developed from different ancestral taxa within Mammuthus, the southern mammoth M. meridionalis giving rise to the Columbian mammoth, and the steppe mammoth M. trogontherii to the woolly mammoth. In contrast to this dual-source model, the single-source model posits that both M. columbi and M. primigenius descended from M. trogontherii, but at different times and from different geographical populations of the latter species (see text) (C). The mitogenomic evidence explored in this paper is more consistent with the single-source hypothesis.
Mitogenome Phylogeography
Using the full set of complete mitochondrial genomes and an Asian elephant (E. maximus) mitogenome sequence as an outgroup, we generated a maximum likelihood tree with 100 bootstrap iterations, and further estimated its Bayesian posterior probability support. The resulting phylogeny is depicted in Figure 2, with the morphology-based nominal taxonomic designations of each specimen indicated along with their geographic origin.
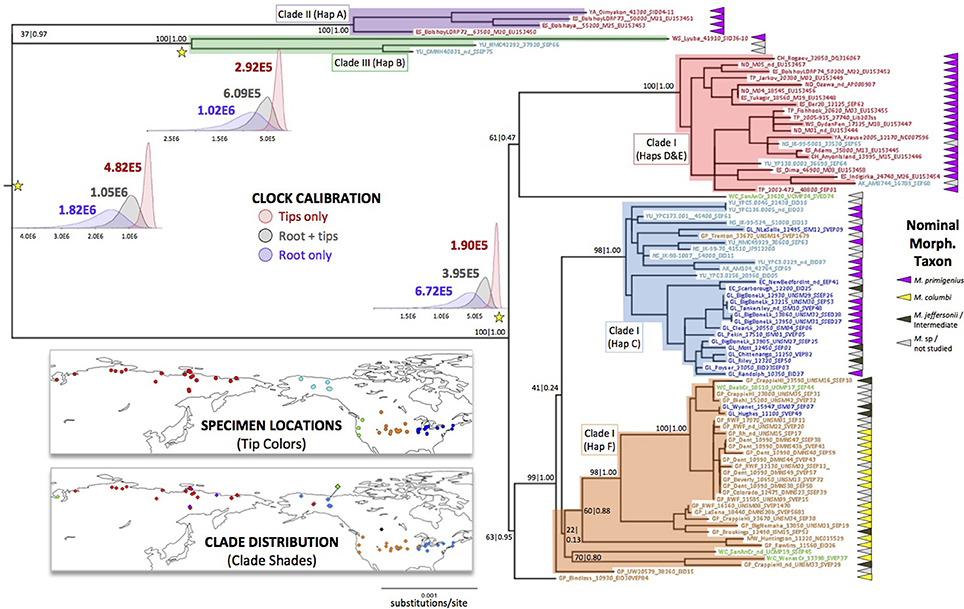
Figure 2. Maximum Likelihood tree with spatial distribution of samples and clades, and posterior distributions of estimated times to most recent common ancestry for three nodes. Tree generated with a 100-bootstrap analysis in IQ-TREE using the nucleotide substitution model, alpha, and invariant site proportion parameters chosen by the corrected Akaike Information Criterion (AICc) in jModelTest. A mitogenome sequence of Elephas maximus (Asian elephant) was used as an outgroup, but is removed from this depiction. Nodal support was further assessed with a Bayesian coalescent approach in BEAST. Bootstrap and posterior probability support are depicted as (bootstrap)|(posterior). Tip names follow those in Supplemental Table 1A and are color-coded by location, as depicted on the upper map. Clades discussed in the text are shaded by color, and their distribution is depicted on the lower map. Posterior distributions of times to most recent common ancestry (tMRCA) estimated under three different temporal calibration schemes are depicted near the nodes marked with yellow stars. Mean tMRCA estimates label each distribution.
The woolly mammoth portion of the revealed matriline topology is largely consistent with previous estimations using both short cytochrome b-HVR sequences (Barnes et al., 2007; Debruyne et al., 2008; Palkopoulou et al., 2013) and complete mitochondrial genomes (Gilbert et al., 2008; Enk et al., 2011), indicating at least three highly divergent matrilines (Clades I, II, and III). The mitogenomes of all non-woolly mammoths sampled here fall within Clade I, with most sharing a most recent common ancestor with the majority of attributed woolly mammoth samples from North America. For ease of discussion, we name a new haplogroup (F) that comprises the majority of the mitogenomes within this predominantly southern group, excluding only the Columbian and indeterminate mammoth specimens from Bindloss, Alberta and San Antonio Creek, California, which stem from a more basal position in the Clade I phylogeny. When we generated a ML tree using several additional partial mitochondrial genomes that we reconstructed, including those of a pygmy mammoth (M. exilis) and an unallocated specimen from the coast of Washington, we found that the basal root of the Californian lineage is not likely to be spurious (Supplemental Figure 1). This feature and the high overall diversity of North American lineages is consistent with the “Out of America” model (Debruyne et al., 2008), which suggests that the extremely widespread and last-surviving Old World woolly mammoth matrilines, haplogroups D and E, descended from a North American female ancestor. More genetic data are necessary from both the Old and New World to further test this hypothesis.
Among the exclusively North American constituents of Clade I, there is a clear geographic and morphological structure underlying the degree of mitogenome relatedness. Haplogroup C, previously identified within Beringian woolly mammoths, extends well into southern latitudes but is largely restricted to regions that were periglacial during the Pleistocene (Great Lakes and northeast coast, where woolly mammoths are the most abundant taxon identified paleontologically, Fisher, 2009). In turn, haplogroup F is essentially limited to the Great Plains, mountain west and west coast, consistent with the paleontological predominance of Columbian mammoths in these regions. However, mitogenomic relatedness and region of occurrence do not always correspond. For instance, the Hughes and Wyanet mammoths were found in periglacial regions but have mitogenomes more typical of Great Plains groups. Interestingly, both of these have been taxonomically identified as Jefferson's mammoths on the basis of dental and/or cranial traits that are essentially morphologically intermediate between M. primigenius and M. columbi (Skeels, 1962; Saunders et al., 2010). These, together with the occurrence of several other morphologically intermediate animals in haplogroups C and F, are consistent with the notion that extensive gene flow occurred between the two dominant morphs, probably at savanna-steppe ecotones.
Chronology and Mammoth Biogeography
Estimated times of most recent common ancestry (tMRCAs) in mammoth phylogeny have been used to infer the chronology of population processes. Early studies used only the paleontologically-estimated split between Elephas and Mammuthus or even deeper paleontological divergences to calibrate the mammoth molecular clock (Ozawa et al., 1997; Rogaev et al., 2006; Rohland et al., 2007). More recent studies use Bayesian coalescent-based approaches that take into account the absolute ages of the samples themselves (“tip dates”) (Barnes et al., 2007; Debruyne et al., 2008; Gilbert et al., 2008; Palkopoulou et al., 2013). However, different investigators have used tip dates in different ways, based in part on the assumed taxonomic identity of the reconstructed nodes. In some studies, only tip dates have been used to estimate the age of nodes deeper in the mammoth tree (Barnes et al., 2007; Palkopoulou et al., 2013); in others, both the age of the Elephas–Mammuthus split and the tip dates have been combined to calibrate the molecular clock (Debruyne et al., 2008; Gilbert et al., 2008). Each approach returns very different chronologies of cladogenesis, and consequently suggests very different timing and taxonomic contexts of corresponding population processes.
To illustrate the impact that each calibration method has on the inferred cladogenic chronology, we used BEAST to estimate the ages of various nodes using all three calibration schemes, restricting the analysis to specimens with finite radiocarbon ages. In Figure 2 we include the marginal posterior densities of the estimated dates for three key nodes in the phylogeny. Our estimates are similar to those of other studies with similar calibration schemes. Which approach is ‘correct’, however, is not immediately clear. The apparent time-dependency of molecular rates (Ho et al., 2005, 2007) is potentially influenced not only by actual biological and demographic processes (such as purifying selection and variation in generation times, though see Woodhams, 2006), but also by the sampling schemes utilized, both in terms of the number of samples and information content of the DNA sequences analyzed (Emerson, 2007; Bandelt, 2008; Debruyne and Poinar, 2009). Our date randomization tests using tip dates alone (Supplemental Figure 2) suggest a strong temporal signal in our data. However, estimations of deeper tMRCAs using tip dates alone are very sensitive to the distribution of the tips in time. Importantly, when we include the mitogenome of a mammoth that is stratigraphically estimated to be minimally 200 thousand years old (CMNH40031, from the Old Crow River) (Sher et al., 2005) in a tips-only analysis, it increases the mean nodal date estimates in Figure 2 by up to 34% (+~28 thousand years for tMRCA of Clade I; 99 ky for Clade III, and 107 ky for all mammoths). We suspect that additional deep temporal sampling would push these dates back even further were tip dates alone used for mutation rate calibration. By the same token, this suggests that older samples and additional data (e.g., nuclear genomic sequences) may be necessary to firmly date these divergences.
As noted in the Introduction, one of the primary goals of this study was to determine whether the apparently close mitogenomic affinity of Columbian mammoths to North American woolly mammoths was typical rather than exceptional (Enk et al., 2011). Here we present good evidence that it is the former, which we suggest impacts both the taxonomic and chronological interpretation of mammoth mitochondrial phylogeny as reconstructed to date.
Assuming that Columbian mammoths descended from an early Irvingtonian immigrant to North America (Agenbroad, 2005; Lister and Bahn, 2007), putatively M. trogontherii according to the single-source hypothesis (Lister and Sher, 2015), and that the pattern of diversity points to a North American origin of Clade I, we find that the most parsimonious reconciliation of the genetic evidence with the paleontological record requires the conclusion that the mitochondrial tMRCA is much more ancient than a tips-only calibration scheme would estimate. As depicted in Figure 3A, we suspect that the initial divergence of early Clade I from Clades II+III occurred at approximately the time that M. trogontherii is inferred to have entered North America, with the independent trajectories of Clade I and Clades II+III ultimately leading to the appearance of the morphs conventionally named M. primigenius and M. columbi. This necessarily implies that the morphological identity of Clade I mammoths as M. primigenius is the consequence of an introgression event (or events) that introduced woolly mammoth morphology into North America, but left little matrilineal evidence. It is possible that this morphology was carried into North America by Clade III mammoths, which were nearly as widespread as last-surviving haplogroups D and E of Clade I.
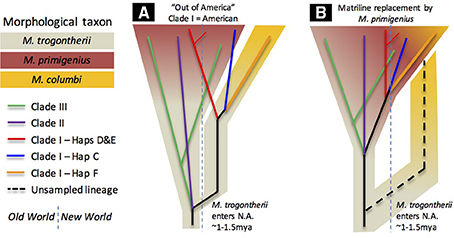
Figure 3. Species/morphological tree schematics. Schematic versions of the estimated mitochondrial phylogeny are overlain on hypothetical species/morphological trees. One version (A) is consistent with the chronology estimated with a root+tip calibration scheme and a paleontological model where observed M. columbi lineages descend independently from North American M. trogontherii. The other (B) is more consistent with a tips-only calibration scheme; it assumes that the common ancestors of lineages reconstructed to date are taxonomically M. primigenius, and that some of them replaced an unobserved but once extant matriline of Columbian mammoths (dashed line). Both models assume nuclear gene interchange between divergent lineages that resulted in morphological similarity; convergence is not entertained.
Despite the clear influence of preferred sampling scheme on tips-only dating, we cannot completely rule out the more recent chronologies suggested by that calibration scheme. Thus, it is possible that the close mitogenomic affinity of woolly mammoths to the Columbian mammoths we sampled here is the consequence of a massive replacement event (Figure 3B). In this scheme, which was emphasized in a previous investigation (Enk et al., 2011), the ancestral Columbian mammoth matriline remains unsampled by our dataset, but Columbian mammoth morphology was retained as a result of invading woolly mammoths interbreeding with resident descendants of M. trogontherii. A more thorough sampling of older mammoths from areas further from the Laurentide ice margin may yet uncover such a matriline. However, if it existed at all, its estimated antiquity would itself become an interpretive problem: would such a matriline have diverged within the timeframe usually accepted for the entry of M. trogontherii into North America, or would it be too “early” (i.e., > 1.5 Ma), thus requiring yet another inference that it descended from a still earlier—and apparently morphologically unidentifiable—immigrant.
Population Size Dynamics
In previous investigations, reconstructed population size trajectories of subarctic woolly mammoths indicated that they experienced relatively constant population sizes throughout the Late Pleistocene on both sides of the Bering Strait (Debruyne et al., 2008). In reconstructions that include Holocene sequences from Wrangel Island, trajectories unsurprisingly indicate a decline in population size shortly before continental mammoths go extinct (Nystrom et al., 2010; Palkopoulou et al., 2013). To explore how adding our mitogenomes affects population size reconstructions, we performed Bayesian Skygrid analyses (Gill et al., 2013), first using the complete dataset of mammoth mitogenomes and then dividing the dataset according to three geographical or ecological partitions. We used two calibration schemes for temporal estimation: tips-only (Figure 4) and nodes + tips (Supplemental Figure 3).
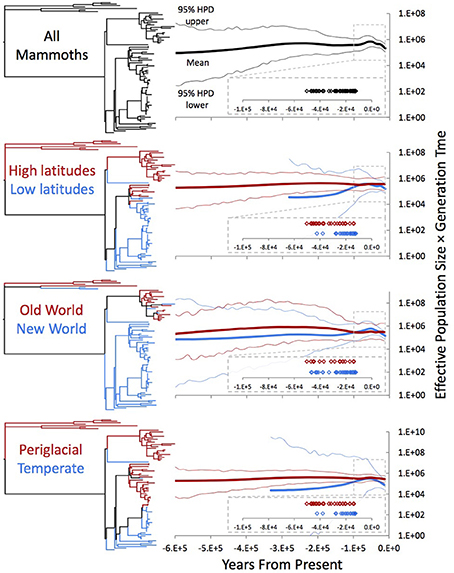
Figure 4. Bayesian Skygrid analyses of the whole dataset and under three partition schemes. Each projection was estimated in BEAST using the partition-specific best model indicated by the AICc in jModelTest. Trees adjacent to each Skygrid are color-coded by which specimens were included in the individual projections. “High”-latitude samples are those from the Old World and Alaska and the Yukon, while “low”-latitude samples are those from the Great Lakes, east coast, Great Plains, mountain west, and west coast. “Periglacial” samples are those in high latitudes as well as the Great Lakes and east coast, contexts near the Laurentide ice sheet during the Late Pleistocene, while “temperate” specimens are the rest. All Skygrid population sizes are associated with posterior effective sample sizes >200.
While the HPDs are exceptionally broad in our reconstructed trajectories (Figure 4), there is some indication that mammoth population size increased prior to the end-Pleistocene decline. Comparing regional/ecological partitions shows that the New World samples drove this increase, while the Old World and periglacial groups remained relatively constant in size. Interestingly, in this reconstruction the population increase south of the ice roughly coincided with a slight (and potentially illusory) decline in northern populations, possibly suggesting complex responses on the part of mammoth populations to the same global climate background. In most temporal calibration and partitioning schemes, this coincident increase in southern populations and decrease in northern populations apparently correlates with the Last interglacial (MIS 5 sensu lato; in Eurasia, the Eemian), which was followed by the Wisconsinan glacial stage in North America. The southern partitions also apparently drove the detected decline following this increase, which is consistent with the inferred extinction chronology in Beringia vs. continental North America (Stuart et al., 2002; Agenbroad, 2005).
However, in addition to having broad HPDs, we find that both the shape and chronology of the reconstructed trajectories are likely biased by a number of variables, and thus should be interpreted with caution. Not only do the Skygrid projections reflect the nodal topology of the tree (i.e., a long branch descending from the root to Clade I, followed by widespread cladogenesis), but potentially they could also follow the distribution of radiocarbon dates in this study, at least qualitatively, although recent data may suggest otherwise. Where the sampling distribution and estimated population sizes do not correspond, samples come from the same location and appear mitogenomically closely related (e.g., Dent, Colorado, and Big Bone Lick, Kentucky). More thorough sampling across both time and space may uncover less (or more) distinct population histories in the populations sampled here. In addition, and as alluded to previously, in some cases the partitioning scheme has a substantial impact on the chronology of the trajectories (Supplemental Figure 3, trajectories from high vs. low-latitude or periglacial vs. temperate schemes).
Conclusions
The patterns of cladogenesis and mitogenomic diversity documented here point to a complex genetic history of mammoths in North America, one likely characterized by bouts of limited local divergence followed by introgression and appearance of hybrid morphologies. By confirming that Columbian mammoths most likely descended from the same matrilines that were previously observed in woolly mammoths, we provide evidence supporting an ancient chronology for both this and our previous concept of mammoth mitogenomic phylogeny. This concept is broadly consistent with the revised paleontological view of mammoth evolution in the New World (Lister and Sher, 2015), which regards all nominal North American taxa as derived from populations of M. trogontherii, despite marked differences in terminal taxa in traditionally emphasized aspects of molar morphology. What this means for mammoth systematics is still unclear. Are columbi and primigenius still to be regarded as “good” species if they were capable of introgressing despite a possible million-year difference in their divergence times from trogontherii ancestors? Or is this lengthy difference illusory? The now well-established finding that mammoths on both sides of the Bering Strait underwent dynamic population histories — including various periods of immigration, introgression, and replacement — throws into question traditional species designations (Debruyne et al., 2008; Gilbert et al., 2008; Palkopoulou et al., 2013). This point also applies to making assumptions about unidirectional change in morphological attributes, a highly unlikely proposition now that hybridization between supposedly long-separate lineages of North American mammoths has been adequately demonstrated. Although geographically broader and temporally deeper sampling of mitogenomes might help clarify the exact biogeographic processes underlying mammoth evolution in North America, it is obvious that we need nuclear sequence data to directly test specific introgression scenarios, and perhaps improve estimates of the timing of various divergence and introgression events. Fortunately, extraction and library preparation of very degraded DNA (Dabney et al., 2013; Orlando et al., 2013; Meyer et al., 2014), targeted DNA capture (Briggs et al., 2009; Burbano et al., 2010; Ávila-Arcos et al., 2011; Carpenter et al., 2013; Wagner et al., 2014), and ancient DNA bioinformatic analysis (Schubert et al., 2012) have experienced tremendous improvement in recent years. As these technologies continue to improve, we can expect to see genetic data from more mammoth specimens preserved in less DNA-friendly taphonomic contexts like the ones analyzed here, thereby helping to more thoroughly document mammoth population responses to, and effects on, the now-extinct Pleistocene environment.
Data Accessibility
Consensus sequences for all complete and/or partial mitochondrial genomes in this manuscript have been uploaded to NCBI with the following GenBank accession #s KX027489-KX027568.
Author Contributions
JE and HP conceived of and designed the study. JE and AD performed laboratory work. PS and JS performed AMS radiocarbon dating. CW, JS, and DCF provided samples and performed morphological taxon identifications. JE, HP, BS, and GG analyzed the data. CW, JS, JR, GZ, DF, RM, HP, BS, GG, and DCF assisted in data interpretation. JE wrote the manuscript with assistance from all authors.
Funding
This work was supported by generous contributions from MYcroarray, and an NSERC Discovery, Accelerator Grant and CRC to HP.
Conflict of Interest Statement
MYcroarray (the current employer of JE, AD and JR) generously provided materials for this study as part of an on-going research collaboration.
The other authors declare that the research was conducted in the absence of any commercial or financial relationships that could be construed as a potential conflict of interest.
Acknowledgments
Thanks especially to sample providers, including Jim Mead of East Tennessee State, Bernard Buigues of the International Mammoth Committee, Dale Guthrie of the University of Alaska, Fairbanks and Dick Harington of the Canadian Museum of Nature, Ross Secord and George Corner of the University of Nebraska State Museum, Richard Stucky and Steve Holen of the Denver Museum of Nature and Science, Pat Holroyd and Kaitlin McGuire of the University of California Museum of Paleontology, Paul Collins of the Santa Barbara Museum of Natural History, Pat Lubinski of Central Washington University, Mark Clementz of the University of Wyoming, Norton Miller and Rob Feranec of the New York State Museum, Kathy Kavanagh of the University of Massachusetts at Dartmouth, and Donald Benson of New Bedford, Massachusetts. Special thanks to Nadin Rohland and David Reich of the Harvard Medical School for assistance in sequencing specimens Oimyakon and Lyuba. Thanks to Christine King, Leanne Blanchard and Lilie De Sousa of the Farncombe Metagenomics Facility at McMaster Children's Hospital for assistance in library quality control and sequencing. Thanks to Regis Debruyne for assistance with early conceptual design and laboratory work, and Carsten Schwartz, Hariharan Manogaralingam and Jocelyn Ip for assistance with laboratory work. This work was supported by generous contributions from MYcroarray, and an NSERC Discovery, Accelerator Grant and CRC to HP.
Supplementary Material
The Supplementary Material for this article can be found online at: https://www.frontiersin.org/article/10.3389/fevo.2016.00042
References
Agenbroad, L. D. (2005). North American proboscideans: mammoths: the state of knowledge, 2003. Quat. Int. 126–128, 73–92. doi: 10.1016/j.quaint.2004.04.016
Ávila-Arcos, M. C., Cappellini, E., Romero-Navarro, J. A., Wales, N., Moreno-Mayar, J. V., Rasmussen, M., et al. (2011). Application and comparison of large-scale solution-based DNA capture-enrichment methods on ancient DNA. Sci. Rep. 1:74. doi: 10.1038/srep00074
Bandelt, H. J. (2008). Clock debate: when times are a-changin': time dependency of molecular rate estimates: tempest in a teacup. Heredity (Edinb.) 100, 1–2. doi: 10.1038/sj.hdy.6801054
Barnes, I., Shapiro, B., Lister, A., Kuznetsova, T., Sher, A., Guthrie, D., et al. (2007). Genetic structure and extinction of the woolly mammoth, Mammuthus primigenius. Curr. Biol. 17, 1072–1075. doi: 10.1016/j.cub.2007.05.035
Beaumont, W., Beverly, R., Southon, J., and Taylor, R. (2010). Bone preparation at the KCCAMS laboratory. Nucl. Instrum. Methods Phys. Res. B 268, 906–909. doi: 10.1016/j.nimb.2009.10.061
Bos, K. I., Schuenemann, V. J., Golding, G. B., Burbano, H. A., Waglechner, N., Coombes, B. K., et al. (2011). A draft genome of Yersinia pestis from victims of the Black Death. Nature 478, 506–510. doi: 10.1038/nature10549
Briggs, A. W., Good, J. M., Green, R. E., Krause, J., Maricic, T., Stenzel, U., et al. (2009). Primer extension capture: targeted sequence retrieval from heavily degraded DNA sources. J. Vis. Exp. 31:e1573. doi: 10.3791/1573
Burbano, H. A., Hodges, E., Green, R. E., Briggs, A. W., Krause, J., Meyer, M., et al. (2010). Targeted investigation of the Neandertal genome by array-based sequence capture. Science 328, 723–725. doi: 10.1126/science.1188046
Carpenter, M. L., Buenrostro, J. D., Valdiosera, C., Schroeder, H., Allentoft, M. E., Sikora, M., et al. (2013). Pulling out the 1%: whole-genome capture for the targeted enrichment of ancient DNA sequencing libraries. Am. J. Hum. Genet. 93, 852–864. doi: 10.1016/j.ajhg.2013.10.002
Dabney, J., Knapp, M., Glocke, I., Gansauge, M. T., Weihmann, A., Nickel, B., et al. (2013). Complete mitochondrial genome sequence of a Middle Pleistocene cave bear reconstructed from ultrashort DNA fragments. Proc. Natl. Acad. Sci. U.S.A. 110, 15758–15763. doi: 10.1073/pnas.1314445110
Daley, T., and Smith, A. D. (2013). Predicting the molecular complexity of sequencing libraries. Nat. Methods 10, 325–327. doi: 10.1038/nmeth.2375
Darriba, D., Taboada, G. L., Doallo, R., and Posada, D. (2012). jModelTest 2: more models, new heuristics and parallel computing. Nat. Methods 9, 772. doi: 10.1038/nmeth.2109
Debruyne, R., Chu, G., King, C. E., Bos, K., Kuch, M., Schwarz, C., et al. (2008). Out of America: Ancient DNA evidence for a new world origin of late quaternary woolly mammoths. Curr. Biol. 18, 1320–1326. doi: 10.1016/j.cub.2008.07.061
Debruyne, R., and Poinar, H. N. (2009). Time dependency of molecular rates in ancient DNA data sets, a sampling artifact? Syst. Biol. 58, 348–359. doi: 10.1093/sysbio/syp028
Drummond, A. J., Suchard, M. A., Xie, D., and Rambaut, A. (2012). Bayesian phylogenetics with BEAUti and the BEAST 1.7. Mol. Biol. Evol. 29, 1969–1973. doi: 10.1093/molbev/mss075
Emerson, B. C. (2007). Alarm bells for the molecular clock? No support for Ho et al.'s model of time-dependent molecular rate estimates. Syst. Biol. 56, 337–345. doi: 10.1080/10635150701258795
Enk, J., Devault, A., Debruyne, R., King, C. E., Treangen, T., O'Rourke, D., et al. (2011). Complete Columbian mammoth mitogenome suggests interbreeding with woolly mammoths. Genome Biol. 12:R51. doi: 10.1186/gb-2011-12-5-r51
Enk, J., Rouillard, J. M., and Poinar, H. (2013). Quantitative PCR as a predictor of aligned ancient DNA read counts following targeted enrichment. Biotechniques 55, 300–309. doi: 10.2144/000114114
Fisher, D. C. (2009). “Paleobiology and extinction of proboscideans in the Great Lakes region of North America,” in American Megafaunal Extinctions at the End of the Pleistocene, ed G. Haynes (Dordrecht: Springer Netherlands), 55–75. doi: 10.1007/978-1-4020-8793-6_4
Gilbert, M. T., Drautz, D. I., Lesk, A. M., Ho, S. Y. Qi, J., Ratan, A., et al. (2008). Intraspecific phylogenetic analysis of Siberian woolly mammoths using complete mitochondrial genomes. Proc. Natl. Acad. Sci. U.S.A. 105, 8327–8332. doi: 10.1073/pnas.0802315105
Gilbert, M. T., Tomsho, L. P., Rendulic, S., Packard, M., Drautz, D. I., Sher, A., et al. (2007). Whole-genome shotgun sequencing of mitochondria from ancient hair shafts. Science 317, 1927–1930. doi: 10.1126/science.1146971
Gill, M. S., Lemey, P., Faria, N. R., Rambaut, A., Shapiro, B., and Suchard, M. A. (2013). Improving Bayesian population dynamics inference: a coalescent-based model for multiple loci. Mol. Biol. Evol. 30, 713–724. doi: 10.1093/molbev/mss265
Hagelberg, E., Thomas, M. G., Cook, C. E., Sher, A. V., Baryshnikov, G. F., and Lister, A. M. (1994). DNA from ancient mammoth bones. Nature 370, 333–334.
Haile, J., Froese, D. G., MacPhee, R. D., Roberts, R. G., Arnold, L. J., Reyes, A. V., et al. (2009). Ancient DNA reveals late survival of mammoth and horse in interior Alaska. Proc. Natl. Acad. Sci. U.S.A. 106, 22352–22357. doi: 10.1073/pnas.0912510106
Harington, C. (1984). Mammoths, bison and time in North America. Dev. Palaeontol. Stratigr. 7 299–309. doi: 10.1016/S0920-5446(08)70078-5
Ho, S. Y., Phillips, M. J., Cooper, A., and Drummond, A. J. (2005). Time dependency of molecular rate estimates and systematic overestimation of recent divergence times. Mol. Biol. Evol. 22, 1561–1568. doi: 10.1093/molbev/msi145
Ho, S. Y., Saarma, U., Barnett, R., Haile, J., and Shapiro, B. (2008). The effect of inappropriate calibration: three case studies in molecular ecology. PLoS ONE 3:e1615. doi: 10.1371/journal.pone.0001615
Ho, S. Y., Shapiro, B., Phillips, M. J., Cooper, A., and Drummond, A. J. (2007). Evidence for time dependency of molecular rate estimates. Syst. Biol. 56, 515–522. doi: 10.1080/10635150701435401
Hoyle, B. G., Fisher, D. C., Borns, H. W. Jr., Churchill-Dickson, L. L., Dorion, C. C., and Weddle, T. K. (2004). Late Pleistocene mammoth remains from Coastal Maine, USA. Quat. Res. 61, 277–288. doi: 10.1016/j.yqres.2004.02.006
Hurvich, C. M., and Tsai, C. L. (1989). Regression and time-series model selection in small samples. Biometrika 76, 297–307.
Kearse, M., Moir, R., Wilson, A., Stones-Havas, S., Cheung, M., Sturrock, S., et al. (2012). Geneious Basic: an integrated and extendable desktop software platform for the organization and analysis of sequence data. Bioinformatics 28, 1647–1649. doi: 10.1093/bioinformatics/bts199
Kircher, M. (2012). Analysis of high-throughput ancient DNA sequencing data. Methods Mol. Biol. 840, 197–228. doi: 10.1007/978-1-61779-516-9_23
Kircher, M., Sawyer, S., and Meyer, M. (2012). Double indexing overcomes inaccuracies in multiplex sequencing on the Illumina platform. Nucleic Acids Res. 40, e3. doi: 10.1093/nar/gkr771
Krause, J., Dear, P. H., Pollack, J. L., Slatkin, M., Spriggs, H., Barnes, I., et al. (2006). Multiplex amplification of the mammoth mitochondrial genome and the evolution of Elephantidae. Nature 439, 724–727. doi: 10.1038/nature04432
Li, H., and Durbin, R. (2009). Fast and accurate short read alignment with Burrows-Wheeler transform. Bioinformatics 25, 1754–1760. doi: 10.1093/bioinformatics/btp324
Lister, A., and Bahn, P. G. (2007). Mammoths: Giants of the Ice Age. Berkeley, CA: University of California Press.
Lister, A. M. (1996). “Evolution and taxonomy of Eurasian mammoths,” in The Proboscidea: Evolution and Palaeoecology of Elephants and Their Relatives, eds J. Shoshani and P. Tassy (New York, NY: Oxford University Press), 203–213.
Lister, A. M., and Sher, A. V. (2001). The origin and evolution of the woolly mammoth. Science 294, 1094–1097. doi: 10.1126/science.1056370
Lister, A. M., and Sher, A. V. (2015). Evolution and dispersal of mammoths across the Northern Hemisphere. Science 350, 805–809. doi: 10.1126/science.aac5660
Maglio, V. J. (1973). “Origin and evolution of the Elephantidae,” in Transactions of the American Philosophical Society held at Philadelphia for Promoting Useful Knowledge, Vol. 63 (Philadelphia, PA: The American Philosophical Society), 1–149. doi: 10.2307/1006229
Meyer, M., Fu, Q. M., Aximu-Petri, A., Glocke, I., Nickel, B., Arsuaga, J. L., et al. (2014). A mitochondrial genome sequence of a hominin from Sima de los Huesos. Nature 505, 403–406. doi: 10.1038/nature12788
Meyer, M., and Kircher, M. (2010). Illumina sequencing library preparation for highly multiplexed target capture and sequencing. Cold Spring Harb. Protoc. 2010:pdb prot5448. doi: 10.1101/pdb.prot5448
Minh, B. Q., Nguyen, M. A., and von Haeseler, A. (2013). Ultrafast approximation for phylogenetic bootstrap. Mol. Biol. Evol. 30 1188–1195. doi: 10.1093/molbev/mst024
Mitchell, D., Willerslev, E., and Hansen, A. (2005). Damage and repair of ancient DNA. Mutat. Res. 571, 265–276. doi: 10.1016/j.mrfmmm.2004.06.060
Mokry, M., Feitsma, H., Nijman, I. J., de Bruijn, E., van der Zaag, P. J., Guryev, V., et al. (2010). Accurate SNP and mutation detection by targeted custom microarray-based genomic enrichment of short-fragment sequencing libraries. Nucleic Acids Res. 38, e116. doi: 10.1093/nar/gkq072
Neph, S., Kuehn, M. S., Reynolds, A. P., Haugen, E., Thurman, R. E., Johnson, A. K., et al. (2012). BEDOPS: high-performance genomic feature operations. Bioinformatics 28, 1919–1920. doi: 10.1093/bioinformatics/bts277
Nystrom, V., Dalen, L., Vartanyan, S., Liden, K., Ryman, N., and Angerbjorn, A. (2010). Temporal genetic change in the last remaining population of woolly mammoth. Proc. R. Soc. B Biol. Sci. 277, 2331–2337. doi: 10.1098/rspb.2010.0301
Orlando, L., Ginolhac, A., Zhang, G. J., Froese, D., Albrechtsen, A., Stiller, M., et al. (2013). Recalibrating Equus evolution using the genome sequence of an early Middle Pleistocene horse. Nature 499, 74–78. doi: 10.1038/nature12323
Ozawa, T., Hayashi, S., and Mikhelson, V. M. (1997). Phylogenetic position of Mammoth and Steller's sea cow within Tethytheria demonstrated by mitochondrial DNA sequences. J. Mol. Evol. 44, 406–413.
Palkopoulou, E., Dalen, L., Lister, A. M., Vartanyan, S., Sablin, M., Sher, A., et al. (2013). Holarctic genetic structure and range dynamics in the woolly mammoth. Proc. Biol. Sci. 280:20131910. doi: 10.1098/rspb.2013.1910
Ramsey, C. B., and Lee, S. (2013). Recent and planned developments of the program oxcal. Radiocarbon 55, 720–730. doi: 10.2458/azu_js_rc.55.16215
Reimer, P. J., Bard, E., Bayliss, A., Beck, J. W., Blackwell, P. G., Ramsey, C. B., et al. (2013). Intcal13 and Marine13 radiocarbon age calibration curves 0-50,000 Years Cal Bp. Radiocarbon 55, 1869–1887. doi: 10.2458/azu_js_rc.55.16947
Roca, A. L., Georgiadis, N., and O'Brien, S. J. (2005). Cytonuclear genomic dissociation in African elephant species. Nat. Genet. 37, 96–100. doi: 10.1038/ng1485
Rogaev, E. I., Moliaka, Y. K., Malyarchuk, B. A., Kondrashov, F. A., Derenko, M. V., Chumakov, I., et al. (2006). Complete mitochondrial genome and phylogeny of Pleistocene mammoth Mammuthus primigenius. PLoS Biol. 4:e73. doi: 10.1371/journal.pbio.0040073
Rohland, N., Malaspinas, A. S., Pollack, J. L., Slatkin, M., Matheus, P., and Hofreiter, M. (2007). Proboscidean mitogenomics: Chronology and mode of elephant evolution using mastodon as outgroup. PLoS Biol. 5:e207. doi: 10.1371/journal.pbio.0050207
Saunders, J. J., Grimm, E. C., Widga, C. C., Campbell, G. D., Curry, B. B., Grimley, D. A., et al. (2010). Paradigms and proboscideans in the southern Great Lakes region, USA. Quat. Int. 217, 175–187. doi: 10.1016/j.quaint.2009.07.031
Schubert, M., Ginolhac, A., Lindgreen, S., Thompson, J. F., Al-Rasheid, K. A., Willerslev, E., et al. (2012). Improving ancient DNA read mapping against modern reference genomes. BMC Genomics 13:178. doi: 10.1186/1471-2164-13-178
Sher, A. V., Lister, A. M., and Morlan, R. E. (2005). “Early Siberian mammoths in Northern Yukon,” in The World of Elephants: 2nd International Congress, eds L. D. Agenbroad and R. L. Symington (North Dakota: The Mammoth Site of Hot Springs), 154–157.
Skeels, M. A. (1962). The mastodons and mammoths of Michigan. Mich. Acad. Sci. Arts. Lett. 47, 101–133.
Smith, C. I., Chamberlain, A. T., Riley, M. S., Stringer, C., and Collins, M. J. (2003). The thermal history of human fossils and the likelihood of successful DNA amplification. J. Hum. Evol. 45, 203–217. doi: 10.1016/S0047-2484(03)00106-4
Stuart, A. J., Sulerzhitsky, L. D., Orlova, L. A., Kuzmin, Y. V., and Lister, A. M. (2002). The latest woolly mammoths (Mammuthus primigenius Blumenbach) in Europe and Asia: a review of the current evidence. Quat. Sci. Rev. 21, 1559–1569. doi: 10.1016/S0277-3791(02)00026-4
Tamura, K., and Nei, M. (1993). Estimation of the Number of Nucleotide Substitutions in the Control Region of Mitochondrial-DNA in Humans and Chimpanzees. Mol. Biol. Evol. 10, 512–526.
Todd, N. E., and Roth, V. L. (1996). “Origin and radiation of the Elephantidae,” in The Proboscidea: Evolution and Palaeoecology of Elephants and Their Relatives, eds J. Shoshani and P. Tassy (New York, NY: Oxford University Press), 193–202.
Wagner, D. M., Klunk, J., Harbeck, M., Devault, A., Waglechner, N., Sahl, J. W., et al. (2014). Yersinia pestis and the Plague of Justinian 541–543 AD: a genomic analysis. Lancet Infect. Dis. 14, 319–326. doi: 10.1016/S1473-3099(13)70323-2
Westgate, J. A., Pearce, G. W., Preece, S. J., Schweger, C. E., Morlan, R. E., Pearce, N. J., et al. (2013). Tephrochronology, magnetostratigraphy and mammalian faunas of middle and early pleistocene sediments at two sites on the Old Crow River, Northern Yukon Territory, Canada. Quat. Res. 79, 75–85. doi: 10.1016/j.yqres.2012.09.003
Keywords: mammoths, phylogenetics, phylogeography, Pleistocene, North America, ancient DNA, targeted enrichment
Citation: Enk J, Devault A, Widga C, Saunders J, Szpak P, Southon J, Rouillard J-M, Shapiro B, Golding GB, Zazula G, Froese D, Fisher DC, MacPhee RDE and Poinar H (2016) Mammuthus Population Dynamics in Late Pleistocene North America: Divergence, Phylogeography, and Introgression. Front. Ecol. Evol. 4:42. doi: 10.3389/fevo.2016.00042
Received: 18 January 2016; Accepted: 06 April 2016;
Published: 26 April 2016.
Edited by:
K. Christopher Beard, University of Kansas, USAReviewed by:
Joseph A. Cook, University of New Mexico, USAGeorge Lyras, University of Athens, Greece
Copyright © 2016 Enk, Devault, Widga, Saunders, Szpak, Southon, Rouillard, Shapiro, Golding, Zazula, Froese, Fisher, MacPhee and Poinar. This is an open-access article distributed under the terms of the Creative Commons Attribution License (CC BY). The use, distribution or reproduction in other forums is permitted, provided the original author(s) or licensor are credited and that the original publication in this journal is cited, in accordance with accepted academic practice. No use, distribution or reproduction is permitted which does not comply with these terms.
*Correspondence: Jacob Enk, enk@mycroarray.com;
Ross D. E. MacPhee, macphee@amnh.org;
Hendrik Poinar, poinarh@mcmaster.ca