Effect of Interactions between Harvester Ants on Forager Decisions
 Jacob D. Davidson
 Roxana P. Arauco-Aliaga
 Sam Crow3
  Deborah M. Gordon
 Mark S. Goldman
- 1Center for Neuroscience, University of California, Davis, Davis, CA, USA
- 2Department of Biology, Stanford University, Palo Alto, CA, USA
- 3Department of Computer Science and Engineering, University of Washington, Seattle, WA, USA
- 4Department of Neurobiology, Physiology, and Behavior, University of California, Davis, Davis, CA, USA
- 5Department of Ophthalmology and Vision Science, University of California, Davis, Davis, CA, USA
Harvester ant colonies adjust their foraging activity to day-to-day changes in food availability and hour-to-hour changes in environmental conditions. This collective behavior is regulated through interactions, in the form of brief antennal contacts, between outgoing foragers and returning foragers with food. Here we consider how an ant, waiting in the entrance chamber just inside the nest entrance, uses its accumulated experience of interactions to decide whether to leave the nest to forage. Using videos of field observations, we tracked the interactions and foraging decisions of ants in the entrance chamber. Outgoing foragers tended to interact with returning foragers at higher rates than ants that returned to the deeper nest and did not forage. To provide a mechanistic framework for interpreting these results, we develop a decision model in which ants make decisions based upon a noisy accumulation of individual contacts with returning foragers. The model can reproduce core trends and realistic distributions for individual ant interaction statistics, and suggests possible mechanisms by which foraging activity may be regulated at an individual ant level.
Introduction
A fundamental question about social behavior is how the collective actions of a group emerge from, and are regulated by, the local decisions of individuals (Torney et al., 2009; Sumpter, 2010). Relatively simple interactions at an individual level can underlie complex system behavior. To build an understanding of how such interactions lead to group behavior, a key step is to characterize how individual members of a group make decisions.
Here we examine the regulation of the foraging activity of the desert seed-eating red harvester ant Pogonomyrmex barbatus. Colonies regulate foraging activity in response to day-to-day changes in food availability and hour-to-hour changes in environmental conditions such as temperature and humidity (Gordon et al., 2013; Pinter-Wollman et al., 2013). Ants use brief olfactory interactions in the form of antennal contacts; these are a form of chemical communication during which one ant detects the cuticular hydrocarbon profile of another (Greene and Gordon, 2003). Whether a potential forager inside the nest leaves on its next trip depends on its experience of interactions with returning foragers (Greene et al., 2013; Pinter-Wollman et al., 2013). Once a forager leaves the nest, it joins one of the large streams of ants that extend from the nest in several directions on a given day and change from day to day (Gordon, 1991, 1995; Greene et al., 2007). Each forager then leaves the trail to search individually for seeds. A forager returns to the same place to search on successive trips (Beverly et al., 2009). This species lays pheromone trails only in response to experimentally placed baits (Gordon, 1983; Hölldobler et al., 2001). Like other ant species that forage for scattered resources (Detrain and Deneubourg, 2008), P. barbatus does not typically use recruitment trails to food. Instead individual ants retrieve scattered seeds that do not occur in patches (Gordon, 1993).
Each forager searches until it finds a seed (Beverly et al., 2009), so the round-trip foraging time is shorter when more food is available. The rate at which foragers leave the nest is closely tied to the rate at which successful foragers return with food (Gordon et al., 2011; Prabhakar et al., 2012; Greene et al., 2013; Pinter-Wollman et al., 2013). This enables colonies to adjust foraging activity to changes in food availability and foraging conditions. A colony adjusts its foraging activity on multiple time scales, ranging from the scale of minutes (Schafer et al., 2006; Gordon et al., 2008; Pinter-Wollman et al., 2013), to hours (Gordon, 1991, 2002), to days (Gordon, 1986, 1991; Gordon and Kulig, 1996). The supply of available seeds can vary strongly from day to day (Gordon, 1993).
While previous work shows that foragers use interaction rate inside the nest to decide whether to leave (Gordon et al., 2011; Pinter-Wollman et al., 2013; Pless et al., 2015), it is not known exactly how a forager assesses interaction rate to make its decision. Here we provide a modeling framework to describe how ants use evidence from interactions with returning foragers to decide whether to leave the nest to forage.
Previous models of this system have characterized how the overall rate of colony foraging relates to the overall rate of returning foragers (Prabhakar et al., 2012). Here we consider foraging decisions at the level of individual ants, asking how each potential forager ant's rate of interactions predicts the probability it will leave the nest. Potential forager ants come into the nest entrance chamber and choose between two alternative actions (Pless et al., 2015): (1) leave the nest to forage, or (2) return to the deeper nest and not forage. We first present data from field observations and apply a regression model to analyze how an individual ant's rate of interaction, number of interactions, and time interval over which these interactions occur are correlated with the ant's foraging decision. We then develop a stochastic accumulation-of-evidence model of ant decision-making to provide a mechanistic framework for interpreting these data and guiding future experiments.
Stochastic accumulation-of-evidence models are commonly used in psychology and neuroscience to explain how decision-makers, faced with two competing choices, sample and accumulate evidence to make decisions (Ratcliff and Smith, 2004; Bogacz et al., 2006). In such models, noisy evidence is sequentially sampled and accumulated over time until the evidence favoring one choice exceeds a decision boundary and triggers a particular action. The fundamental observation underlying our decision model is that harvester ants appear to undergo a mechanistically similar process in making foraging decisions. Potential forager ants in the entrance chamber engage in a series of antennal contacts with returning forager ants. When the rate of such contacts is large, ants are more likely to leave the nest to forage, as if the contacts have been accumulated stochastically and a decision-threshold has been crossed. This process thus provides a mechanism by which ant colonies can regulate their foraging rate in response to returning foragers whose return provides evidence of food availability.
In the following, we show how a simple sequential sampling decision model can reproduce the distributions of interaction statistics for observations of four different colonies. Although foraging decisions are highly stochastic, the probability of leaving the nest to forage increases with the rate of interaction with returning foragers. We show that the model can capture both this trend and the randomness in foraging decision-making. We discuss several possible biological sources that could underlie the variability in interaction statistics and foraging decisions. Finally, we use the decision model to suggest possible mechanisms by which colonies adjust their activity to changing environmental conditions.
Results
Population Analysis of Individual Forager Ant Trajectories
We tracked the interactions and foraging decisions of approximately 1200 foragers using videos of four actively foraging colonies in the field (see Section Methods). Interactions of potential foragers with returning foragers take place in an entrance chamber just inside the nest entrance, and tunnels lead from this chamber to the deeper nest (Figure 1). Trajectories were classified according to the location from which an ant entered the entrance chamber and the location to which it departed. Ants could enter the chamber either from outside the nest or through a tunnel from the deeper nest. Similarly, ants departing the nest either left the nest to forage or descended to the deeper nest. This led to four main categories of tracked ants (Figure 2):
1. From a tunnel, left the nest to forage
2. From a tunnel, returned to the deeper nest
3. From outside, left the nest to forage
4. From outside, returned to the deeper nest.
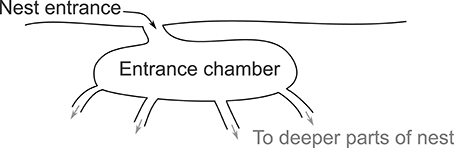
Figure 1. Structure of a typical entrance chamber. Schematic shows a cross-sectional view of an entrance chamber. Potential forager ants interact in the entrance chamber before deciding whether to leave the nest to forage or return to a tunnel leading to a deeper part of the nest. A typical entrance chamber is 5–10 cm wide.
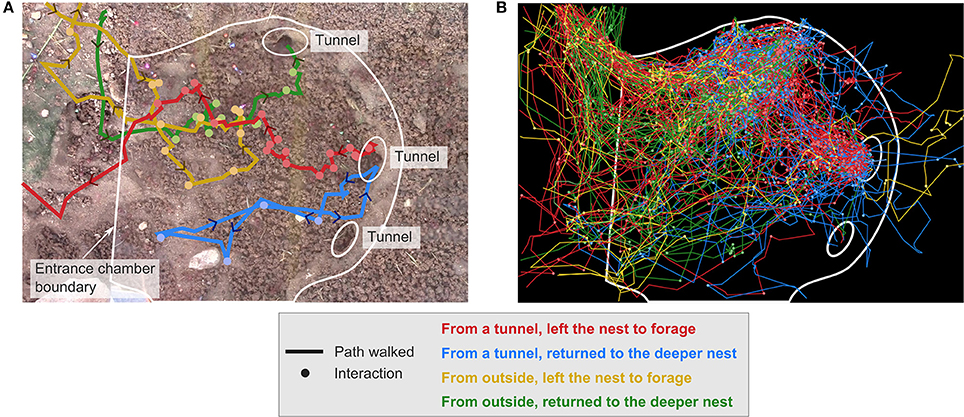
Figure 2. Trajectories of returning and potential foragers, grouped by start location and end action. A potential forager comes from a tunnel into the entrance chamber and either leaves the nest to forage (red) or returns to the deeper nest (blue). A returning forager comes into the entrance chamber from outside the nest and either leaves the nest to forage (yellow) or returns to the deeper nest (green). This example from colony 1 shows: (A) One ant in each category, and (B) All tracked ants in each category.
Each observation had a focus tracking period of 60–180 s in which all interactions were tracked. For the interaction statistics presented in the next section, we considered only data from ants that completed their trajectories during this period. Table 1 shows the number of ants tracked during the focus period in categories 1 and 2 for each of the four observations. In addition, we further tracked other ants that appeared but did not complete a trajectory during the focus period to identify their start location and end action. A complete list of categories of trajectories, with the total number of ants tracked in each is shown in Table S1.
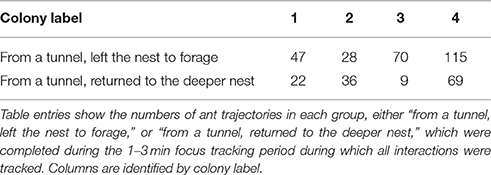
Table 1. Number of focus period trajectories of ants from a tunnel, grouped by end action.
Colonies differ consistently in foraging activity from year to year (Gordon et al., 2011, 2013; Gordon, 2013) and day to day (Gordon et al., 2008). In our observations, each made on a different day, colony 2 had the lowest foraging rate, whereas colony 4, which was provided with additional seeds scattered in an area of about 15 cm perpendicular to the direction of the foraging trail, had the highest. Foraging in this species does not involve pheromone trails, except when piles of seeds are made available to patrollers early in the morning (Gordon, 1983). Here the seeds were scattered, not placed in a pile, when the patrollers were no longer active, and the foragers did not follow a discrete trail to the seeds. Colonies 1, 2, and 4 were observed during a period when the rates of returning and outgoing foragers were similar. Colony 3 was observed when foraging activity was increasing; far more ants were leaving the nest than returning.
Interaction Statistics of Potential Foragers
To examine what evidence an ant uses to decide to leave the nest to forage, we focused on the transitions most easily identified in the data, listed as (1) and (2) above, of ants that came from a tunnel from the deeper nest and subsequently either left the nest to forage or returned to the deeper nest. We chose to focus on the decision-making process of ants that just came out of a tunnel from the deeper nest because their trajectories all start with the same condition of just having arrived from the deeper nest. We did not consider the decision-making process of a returning forager that then decides whether to leave the nest again on another foraging trip, because we could not identify the time at which it had finished returning and began its decision-making process. For the ants appearing in the entrance chamber from the deeper nest, we considered only the trajectories of ants that either left the nest to forage or returned to the deeper nest, during the 1–3 min period in which all interactions were tracked (Table 1).
We compared the total number of interactions, time in the entrance chamber, and average rate of interaction of potential foragers that came from a tunnel and left the nest to forage, versus potential foragers that came from a tunnel and returned to the deeper nest (Figure 3). Previous studies together indicate that interactions with successful foragers returning from trips outside the nest are most relevant for a potential forager's decision whether to leave the nest to forage, and that ants that leave the nest to forage tend to interact at a higher rate than ants that return to the deeper nest (Schafer et al., 2006; Greene et al., 2013; Pinter-Wollman et al., 2013; Pless et al., 2015). Here, building on previous results, we count only the interactions of potential foragers with foragers returning from trips outside the nest. We present the distributions of the interaction statistics obtained from field observations of different colonies, and use these data to construct and parameterize the decision model in the following section.
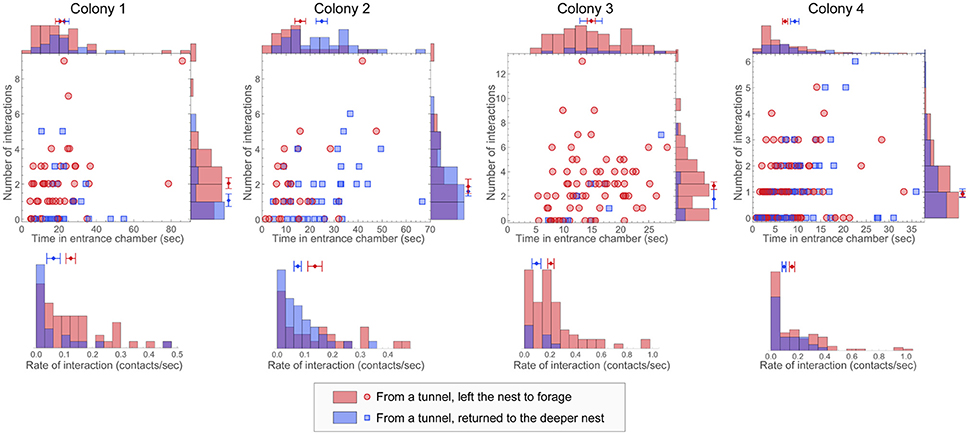
Figure 3. Number of interactions, time in the entrance chamber, and rate of interaction of potential foragers. For each of the observations of a colony (columns), plots show the number of interactions and time spent in the entrance chamber for potential foragers from a tunnel that left the nest to forage (red points) or returned to the deeper nest (blue points). Histograms show the corresponding distributions for number of interactions, time in the entrance chamber, and rate of interaction. The per-ant mean and standard error of the mean for each quantity are displayed on each histogram.
For 3 out of the 4 observations, the per-ant average rate of interaction experienced by potential foragers that left the nest to forage was significantly different from the per-ant average rate of interaction experienced by potential foragers that returned to the deeper nest (one-tailed permutation tests with 0.025 level for significance: colony 1, p = 0.016; colony 2, p = 0.014; colony 3, p = 0.034; colony 4, p = 0.012). For all observations, the difference in per-ant average rate of interactions between ants in the two groups was in the same direction: ants that left the nest to forage had a higher interaction rate. The observed distributions of both the number and rate of interaction for both groups were peaked near zero (Figure 3). This result parallels the right-skewed distributions found for the total number of interactions, aggregated across all types of ants, observed in the entrance chamber of laboratory-housed colonies of the same species (Pinter-Wollman et al., 2011).
Observations of the colonies differed from each other in the mean interaction rate of the observed ants. Other aspects of the observed distributions differed as well. For example, ants that left the nest to forage in the observation of colony 2 tended to spend less time in the entrance chamber than ants that returned to the deeper nest. Compared to the other colonies, the distribution of time in the entrance chamber for the potential foragers in colony 3 appears shifted along the x-axis (Figure 3). In this observation, the fastest outgoing forager spent a relatively large time in the entrance chamber when compared to the average time an ant spent in the entrance chamber. This may be due to the relatively long distance to the entrance chamber exit in this colony's nest (Figure S1). In the observation of colony 4, in comparison to other colonies, a larger fraction of the ants made decisions without engaging in any interactions with returning foragers.
Regression Fit to Individual Foraging Decisions
To examine trends in individual ant interaction rates and foraging decisions, we fit the data using logistic regression. This is a generalized linear model that uses a sigmoidal function, f, to map a linear combination of inputs onto the probability of leaving the nest to forage. We focus on a simple model that uses only rate of interaction to fit the probability that an ant leaves the nest to forage:
where βr and βc are parameters, r is the interaction rate, and f(x) = 1/(1 + e−x) is the logistic function. The β parameters were determined by a maximum-likelihood fit, and parameter confidence intervals as well as the standard deviation of Pforage were estimated using a bootstrapping procedure (Efron, 1982).
For all colonies, the regression fit associated higher interaction rates with decisions to leave the nest to forage. Figure 4 shows this trend by binning the fraction that leave the nest to forage as a function of individual ant interaction rate. The best fit and corresponding standard deviation of the fit for Pforage is shown for each colony observation. The observations of the different colonies differed in their fit parameters (Table 2) and resulting trends for Pforage. We note that although the confidence intervals for the individual parameters are very large, the trends for Pforage are more tightly constrained due to correlations in the fitted values of βr and βc.
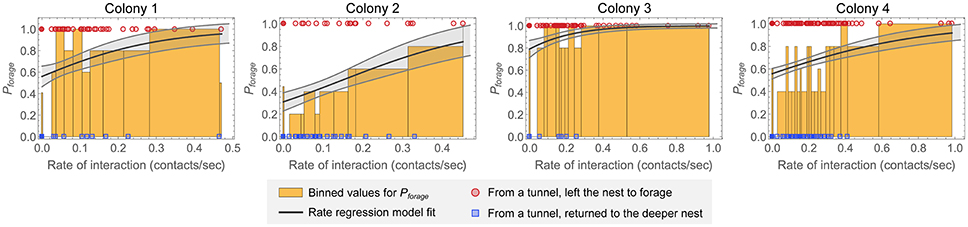
Figure 4. Rate regression fit for fraction that leave the nest to forage as a function of interaction rate. Results are shown for each observation of a colony. Red points show interaction rates of ants that left the nest to forage, and blue points show interaction rates of ants that returned to the deeper nest. The bins for Pforage are determined by sorting the nonzero interaction rates, forming bins with a fixed number of points per bin (5 points per bin was used), and calculating the fraction of points in each bin that represent ants that left the nest to forage. A separate bin was used for ants with zero interactions; this bin is shown as the separate line at zero. The solid line is a fit of the rate regression model (Equation 1). The fit standard deviation for this model was estimated using bootstrapping; the shaded area around the best fit indicates the standard deviation of the fits for Pforage for each value of the rate of interaction.
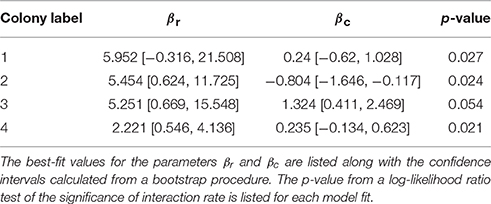
Table 2. Rate regression model fit parameters and evaluation.
We evaluated the significance of the contribution of interaction rate to the rate regression model fit for each colony observation by using a likelihood ratio test. The likelihood value of each fit was compared to the likelihood of a null model with only a single parameter (i.e., Pforage = const) to obtain a p-value for each fit (see Section Methods), and these values are listed in Table 2. The p-values suggest that it is unlikely that the difference in interaction rates observed in the different groups of ants could have been observed by chance, if ants were making foraging decisions at random with respect to interaction rate. We then asked if the regression fits could be improved if, in addition to rate, the values of either N or T were included in fits. A likelihood ratio test was used to obtain a p-value for this nested model comparison. The results suggest that including T in addition to rate improves the fit to the observations of colonies 2 and 4, but not 1 and 3 (colony 1, p = 0.927; colony 2, p = 0.021; colony 3, p = 0.950; colony 4, p = 0.052). Including N in addition to rate only significantly improved the fit for the observation of colony 4 (colony 1, p = 0.473; colony 2, p = 0.276; colony 3, p = 0.315; colony 4, p = 0.008).
Decision Model
Model Description
Motivated by our data and previous work showing that the rate of outgoing foragers increases with the rate of returning foragers (Gordon et al., 2008, 2011; Prabhakar et al., 2012; Pinter-Wollman et al., 2013), we developed a two-choice decision model to provide a mechanistic framework for interpreting the observed foraging decisions and interaction statistics. Previous work, supported by the regression fits in Figure 4, suggests that interactions with returning foragers provide evidence to leave the nest to forage: ants that leave the nest to forage tend to interact at a higher rate than ants that return to the deeper nest (Pinter-Wollman et al., 2013; Pless et al., 2015), and the overall rate of outgoing foragers depends on the rate of incoming foragers (Gordon et al., 2008, 2011; Prabhakar et al., 2012; Pinter-Wollman et al., 2013; Pless et al., 2015). Below, we examine how these key results could arise from a decision-making process in which potential foragers sequentially sample interactions with returning foragers and use a stochastic accumulation process to make foraging decisions. We show that a simple decision model can produce distributions that resemble Figures 3, 4 from the data.
The model represents each ant as a biased, noisy integrator of its interactions with returning foragers. Each ant's decision making process is characterized by an internal decision state s. Decisions to leave the nest to forage occur when s crosses an upper decision threshold, and decisions to return to the deeper nest occur when s crosses a lower decision threshold (Figure 5). Each interaction acts as positive evidence toward a decision to leave the nest to forage by increasing the decision state by a finite amount k. Between interactions, the decision state drifts at a constant bias rate γ, which can bias decisions toward either choice. If the bias rate is negative, elapsed time serves as evidence toward making a decision to return to the deeper nest. If the bias rate is positive, ants have a tendency to forage even in the absence of interactions. Finally, the accumulation of noise over time leads to randomness in decisions, by causing the decision variable to perform a random walk in the absence of other input.
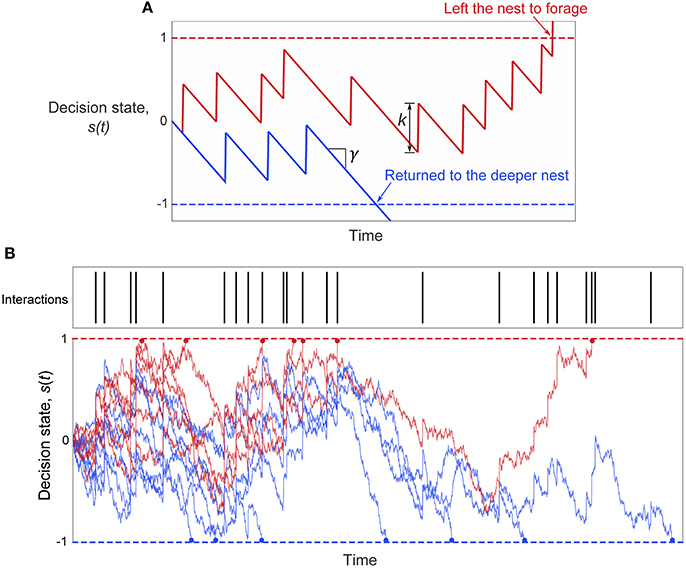
Figure 5. The two-choice model of ant foraging decisions. (A) Illustration of the decision model parameters. Noise is omitted to better illustrate the roles of the parameters γ and k (see Equation 2) in determining the ant's decision in response to interactions. The bias rate γ sets the mean rate of change of the decision state in the absence of interactions, and k sets the increase in the decision state with each interaction. The initial decision state is set by the parameter s0, and is set to zero for this example. (B) Example trajectories of the decision state with noise for the set of interaction times shown. Red lines: decision state s(t) of simulated ants that left the nest to forage. Blue lines: decision state s(t) of simulated ants that returned to the deeper nest. The decision time is shown by the dot at the end of each simulated decision path.
Mathematically, the dynamics of the decision state s are described by the equation
where γ represents the constant bias rate of the decision state in the absence of interactions, k represents the increase in decision state with each interaction, {tj} is the set of times when interactions occurred, σ is the noise amplitude, η(t) is a Wiener noise process, and δ() denotes the Dirac delta function. Times of interactions {tj} were generated for each simulated ant by a Poisson process of rate rin, because the distribution of intervals between interactions of potential foragers is approximately exponential (Figure S2). Without loss of generality, the thresholds for deciding to leave the nest to forage or return to the deeper nest were set to 1 and −1, respectively. At the start of each simulation, an ant's initial decision state, s0, was set to a value between the two thresholds (i.e., −1 < s0 < 1). Figure 5 illustrates the model and example decision state trajectories.
Simulated Distributions
Figure 6 illustrates core properties of the model and its underlying parameters, and relates these to prominent features observed in the data. Parameters for this example were chosen so that the simulated distributions of N, T, and r, and the values of Pforage as a function of rate of interaction showed similar trends to those in the observation of colony 2. The trend across all four colony observations is that ants that left the nest to forage tended to interact at a higher rate than ants that returned to the deeper nest. This behavior occurs naturally in the decision model since interactions act as positive evidence for decisions.
Figure 6. Representative simulated distributions and model parameter dependence. (A) Simulated distributions of N, T, and r, and rate regression model fit of Pforage to the simulated data. Plots were generated in the same manner as for the data of Figures 3, 4. Parameters for this example were chosen so that the simulations resemble the observation of colony 2: k = 0.14, γ = −0.038, s0 = 0.39, and σ = 0.21. The mean input interaction rate, rin = 0.083, was calculated from the data for this observation (see Figure S2). The 2D plot and corresponding N, T, and r distributions display data for 400 simulated ants. The plot of Pforage (bottom right) shows rates as points for 200 simulated ants. (B,C) Effects of changing parameters around the values used in this example. (B) Dependence of the fraction of simulated ants leaving the nest to forage on the interaction sensitivity k and bias rate γ. Parameter values for s0, σ, and rin were the same as in (A). The point shows the result from (A), the dashed line shows the “constant decision fraction” line for k = −γ/rin, and the solid lines show evenly spaced contours at and around the line k = −γ/rin. (C) Model dependence on the initial decision state s0. (top) Fraction that leave the nest to forage. (bottom) Difference in average decision time between groups of ants, 〈Tforage〉 − 〈Treturn〉, where 〈Tforage〉 is the average decision time for ants that left the nest to forage and 〈Treturn〉 is the average decision time for ants that returned to the deeper nest. The point on each plot shows the result from (A). Parameter values for k, γ, σ, and rin were the same as in (A).
Despite this overall trend, the interaction rate distributions are not clearly separated between groups of ants that left the nest to forage vs. returned to the deeper nest (Figure 6A), and this illustrates the role of noise and randomness in the model. In all of the colony observations (Figure 3), the interaction rate distributions are maximal at zero interaction rate even for the population of ants that left the nest to forage, and the primary reason the mean interaction rate is larger for ants that left to forage is due to the slower falloff (longer tail) of the interaction rate distribution for such ants. Similarly, in the model simulation in Figure 6A, a large number of simulated ants made a decision without any interactions. In the model simulations, these features heavily reflect the presence of strong noise (a large value of σ). When this noise is reduced, the (N,T) distributions and the maxima of the corresponding interaction rate distributions become more clearly separated (see, for example, Figures 8A,B). The presence of strong noise also decreases the mean time and reduces the mean number of interactions required to cross a decision boundary. In the absence of noise, the fastest possible time of return to the deeper nest for the example of Figure 6 would have been over 36 s.
The fraction of simulated ants that left to forage depends systematically on the incoming rate of interactions rin, which was not fit by the decision model but rather set to a value directly based upon the data (Figure S2), as well as the bias rate γ, the interaction sensitivity k, and the initial decision state s0. Increasing any of these parameters leads to an increase in the fraction of simulated ants that leave the nest to forage by either starting the decision state closer to the leave-to-forage boundary or increasing the rate of change toward this boundary (Figures 6B,C). Conversely, changes in these parameter values can offset each other to yield simulations in which the fraction of simulated ants that leave the nest to forage remains constant. For example, decreasing the bias γ and increasing the interaction sensitivity k can lead to a constant fraction that leave the nest to forage (Figure 6B). To gain an understanding of this relation quantitatively, note from Equation (2) that the average change of the decision state is approximately constant whenever γ + krin = constant. This defines contours with slope of −1/rin in (γ, k) parameter space that approximately correspond to a constant foraging fraction. If γ + krin = 0 and s0 = 0, this “contour of constant fraction that leave to forage” yields 50% of simulated ants that leave to forage. For nonzero initial condition s0, the contours are shifted away from 50% because each simulated ant starts closer to one of the decision boundaries. In general, but especially for γ + krin ≠ 0, the contours of constant fraction that leave to forage become slightly curved, in particular for larger values of k for which the discreteness of the interactions becomes most pronounced (Figure 6B).
Although the same overall fraction of ants that leave the nest to forage can be achieved by multiple parameter combinations, other features of the distributions depend on particular parameter values. Changing the initial condition s0 has a strong effect on the average decision time for ants in each group. Increasing s0 decreases the average decision time for simulated ants that leave the nest to forage and increases the average decision time for simulated ants that return to the deeper nest (Figure 6C). In the observation of colony 2, two important features of the distributions are that ants that left the nest to forage tended to spend less time in the entrance chamber than ants that returned to the deeper nest, and the overall fraction that left the nest to forage was less than 50%. These features were produced in Figure 6A by choosing a positive value of s0 to generate the shorter decision times for the ants that left to forage, and a value of γ sufficiently negative that fewer than 50% of ants left the nest to forage. Switching the signs of either γ and s0 from these choices could produce results that matched one, but not both, of these two features of the distributions.
Figure 7 shows additional model simulations with parameters chosen to resemble the distributions of N, T, and r, and of Pforage as a function of rate of interaction, for observations of colonies 1 (Figure 7A), 3 (Figure 7B), and 4 (Figure 7C). In Figure 7B, we added a post-decision time of 5 s. with no interactions, to approximately represent the minimum time in the entrance chamber for a potential forager in observation 3. As noted above, for this observation, the proportionally large minimum time to leave the nest to forage as a fraction of the average time a potential forager spent in the entrance chamber may be due to the shape of the entrance chamber. Core features of the distributions, and their relationship to the underlying parameters, can be understood with reference to Figure 6 above. For example, the observation of colony 3 had a notably higher fraction that left the nest to forage than the observations of the other colonies, but the average time in the entrance chamber was similar for the ants that took both actions. This was simulated in Figure 7B by using a positive value of the bias rate γ and an initial condition s0 near zero. In the observation of colony 4, the rate distributions were particularly strongly overlapping and the times to decide were relatively short for both groups of ants. This was simulated using a large value of the noise parameter. These results show that the decision model can produce results that resemble the observations, and how different parameter choices can be used to reproduce core features of the different distributions.
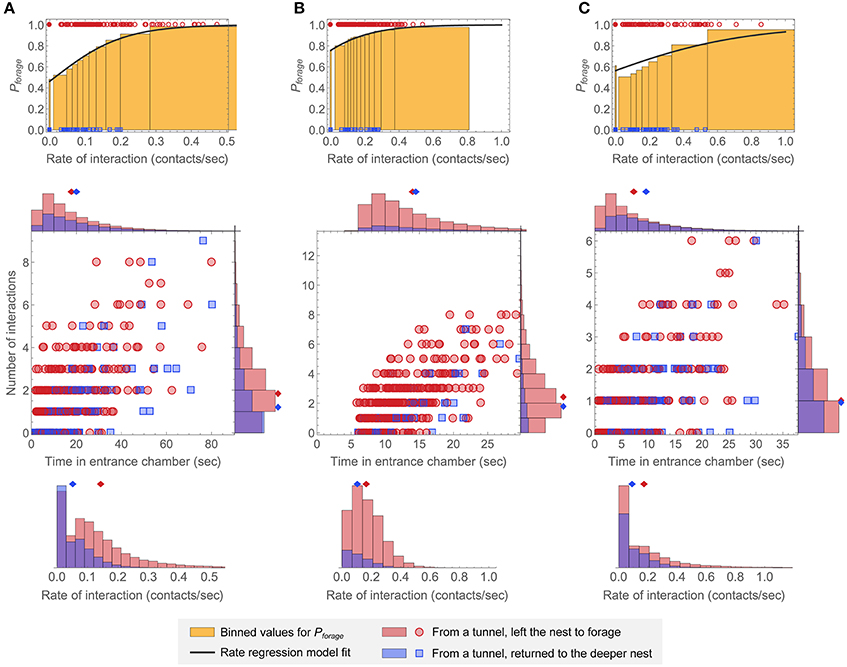
Figure 7. Simulated model distributions representative of other colony observations. The parameters in (A–C) were chosen so that the simulated distributions resemble the observations of colonies 1, 3, and 4, respectively. The top row shows binned plots for Pforage as a function of interaction rate in the same manner as Figure 4. The solid lines are fits of the rate regression model to each set of simulated data, and 200 points are shown on each plot for illustration. The bottom row shows 2D plots and corresponding N, T, and r distributions for 400 simulated ants as in Figure 3. (A) k = 0.26, γ = −0.007, s0 = 0.06, and σ = 0.22, with rin = 0.083 taken from the data for the observation of colony 1 (Figure S2). (B) k = 0.15, γ = 0.044, s0 = 0.02, and σ = 0.30. To produce results resembling the time distributions for the observation of colony 3 (Figure 3), a constant post-decision time without interactions of 5 s. was added to each simulated ant. A value of rin = 0.25 was used to match the overall input rate of interaction for this observation when the added post-decision time is included. (C) k = 0.17, γ = −0.012, s0 = 0.21, and σ = 0.35, with rin = 0.117 taken from the data for the observation of colony 4 (Figure S2).
Modeling Biological Sources of Variability
The simulations described above used a single Gaussian noise term as the primary means to account for the large overlap between the distributions of ants that left the nest to forage vs. returned to the deeper nest. The Poisson nature of interactions provided a smaller source of variability. The Gaussian noise term likely accounts for many different sources of variability. Here we analyze the following sources of variability and how they influence the simulated distributions of the model: (1) Noise in the ants' internal decision-making process, as modeled through the Gaussian noise term. (2) Variation across ants in the input rate of interaction, rin, which could occur due to differences among ants and the heterogeneous spatial distribution of ants in the entrance chamber (Figure S1, Pinter-Wollman et al., 2013). (3) Variation across ants in interaction sensitivity and bias rate. (4) Variation across ants in initial decision state, which could occur for example if some ants experienced interactions before they appeared in the entrance chamber. (5) A variable period of post-decision time in the entrance chamber during which the ants continue to engage in interactions, which could occur for example because ants take time to walk from the location at which a decision was made to one of the exits from the entrance chamber.
We note that similar sources of variability have been considered in other studies of decision-making. For example, previous studies have performed model-fitting separately to each individual, identified specific outlier trials, modeled variability in evidence accumulation rate and/or initial decision state, and modeled “contaminant time” taken up during the task by processes not related to the decision (Ratcliff and Tuerlinckx, 2002).
We demonstrate how the different sources of variability affect the simulated interaction statistics and foraging decisions by making perturbations to an example case chosen for illustrative purposes (Figure 8A). Increasing the level of internal noise σ from σ = 0.2 to σ = 0.3 (Figure 8B) reduced the average number of interactions and time in the entrance chamber, and strongly increased the overlap of the simulated distributions of ants that left the nest to forage and ants that returned to the deeper nest. Increasing the variability of the mean input interaction rate for individual ants by drawing rin values from a uniform distribution from 0 to did not affect the overlap between the distributions of the two groups of ants taking either action, but decreased the correlation between the values of N and T (Figure 8C). Adding heterogeneity in the bias rate γ and interaction sensitivity k led to results for N and T that remained highly correlated, but had increased overlap of the distributions for ants taking either action (Figure 8D). Including a distribution of initial conditions increased the number of ants that made decisions quickly or after zero interactions (Figure 8E). This also increased the number of ants that left to forage very quickly after a single interaction, which increased the skewness and therefore the mean of the interaction rate distribution for ants that left the nest to forage. Including post-decision walking time drawn from a uniform distribution increased the overlap between distributions for the two groups of ants and increased the average time and number of interactions (Figure 8F). Since the post-decision walking time was drawn from a non-skewed distribution, this reduced the overall skewness of the distributions of both N and T. Combining these different sources of variability can produce a more realistic simulation with distributions of N, T, and r that resemble the observed data (Figure 8G).
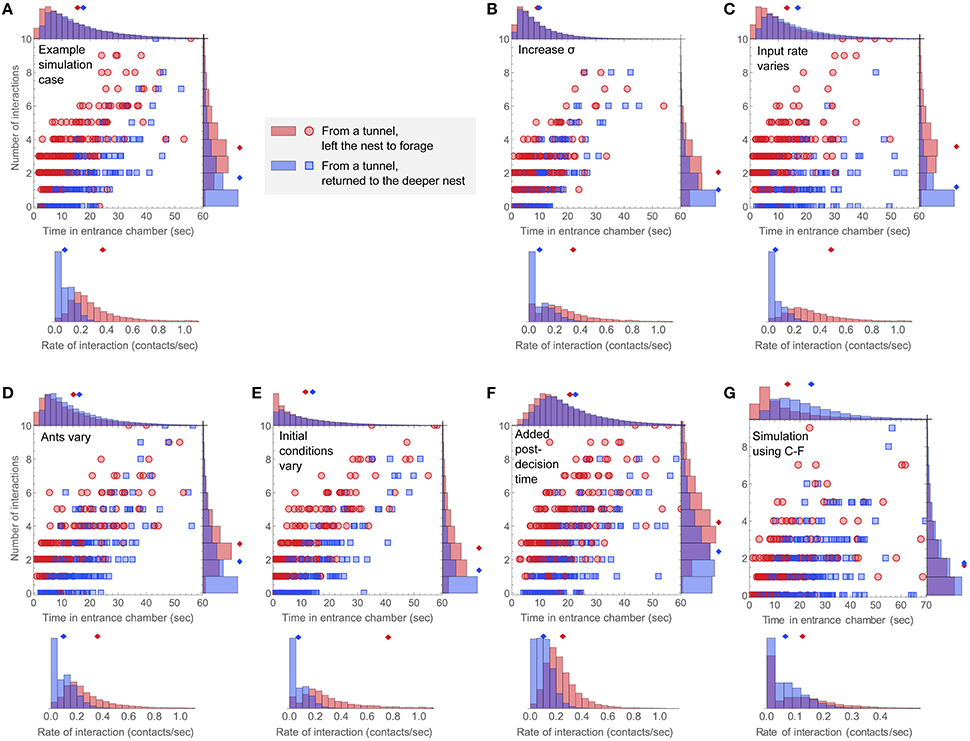
Figure 8. Simulating sources of variability. For each case, the number of interactions vs. time in the entrance chamber is plotted for 400 simulated ants, and histograms for the distributions of number of interactions, time in the entrance chamber, and rate of interaction are shown for simulated ants in each group. (A) An example simulation using parameters k = 0.4, γ = −0.06, s0 = 0, σ = 0.2, and rin = 0.15. (B–F) show perturbations to this case. (B) Increased noise in the decision variable, from σ = 0.2 to σ = 0.3. (C) The input Poisson interaction rate rin was drawn from a uniform distribution from 0 to for each simulated ant. (D) The interaction sensitivity k and bias rate γ were drawn from normal distributions with mean values the same as in panel A, and standard deviations of 50% of the mean. (E) The initial decision state, s0, was drawn from a uniform distribution from −0.75 to 0.75. (F) Simulated ants have an added post-decision time drawn from a uniform distribution of 0–10 s., during which they continue to engage in interactions at the Poisson rate of rin = 0.15. (G) An example simulation including all of the added simulation mechanisms shown in (C–F), with parameters chosen to resemble the observation of colony 2. The noise level is σ = 0.21, the input rate of interaction was drawn from a uniform distribution from 0 to , the interaction sensitivity and bias rate were drawn from normal distributions defined by k = 0.14±50% and γ = −0.038±50%, the initial decision state was drawn from a uniform distribution from −0.2 to 0.8, and each simulated ant has an added post-decision time drawn from a uniform distribution from 0 to 5 s, during which it continues to make interactions at a Poisson rate drawn from a uniform distribution from 0 to .
Colony Foraging Activity
Up to this point we have examined the distributions of number of interactions, time in the entrance chamber, and rate of interaction for simulated individual ants that either leave the nest to forage or return to the deeper nest. We demonstrated that the decision model associates a higher probability of leaving to forage with a higher interaction rate and can produce distributions that resemble the data, and showed an example of how the fraction out to forage depends on the bias rate γ and the interaction sensitivity k. We now consider how simulations of the interactions and foraging decisions of individual ants are related to overall colony foraging activity.
Several studies have demonstrated that the overall rate of outgoing foragers varies positively with the rate of successful returning foragers (Prabhakar et al., 2012; Pinter-Wollman et al., 2013; Pless et al., 2015). To examine how the average rate of returning foragers from outside influences colony foraging patterns, we varied the Poisson input rate in the basic 4-parameter (γ, k, s0, and σ) model and observed the effect on the fraction of ants that left the nest to forage. Figure 9 shows results for the example cases from Figures 6A, 7. We refer to these results as parameter sets 1–4, to correspond to the observations of colonies 1–4, respectively. In all cases, the fraction of ants that leave the nest to forage increases with mean input interaction rate, and a nonzero baseline fraction leaves the nest to forage when the mean input interaction rate is zero. The sensitivity of changes with respect to rin depends on the parameter values, with high noise levels (e.g., parameter set 4) leading to a low sensitivity to changes in rin.
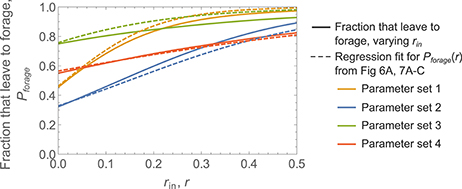
Figure 9. Changes in the fraction of ants that leave the nest to forage with mean input interaction rate. Shown are simulation results for the fraction of ants that leave the nest to forage as a function of the mean input interaction rate rin (solid lines). These were obtained by performing multiple simulations with different values of rin, while other parameters remained the same. Rate regression fits for Pforage(r), reproduced from Figures 6A, 7, are shown for comparison; note that these simulations had fixed rin values and the different values of r shown here result from Poisson variability across ants in the experienced rate of interactions (number of contacts per second). Parameter sets 1, 2, 3, and 4 were taken from Figures 6A, 7A–C, to resemble the observations for colonies 1, 2, 3, and 4, respectively. Note that much of the difference between the curves for parameter set 3 is due to the added 5 s post-decision time in the simulations of Figure 7B, which was not included when generating the fraction that leave to forage as a function of rin.
Figure 9 also compares the fraction of the colony that leaves the nest to forage as a function of average Poisson input rate rin, to the rate regression fits of Pforage(r) from Figures 6A, 7, which were obtained by fitting to a single simulated dataset with fixed rin. These results represent two different measurements, first changing the average input rate and measuring the fraction that leave the nest to forage, and second, fitting a regression model to the decisions of ants in an observation of a single colony. This suggests that a rate regression fit to a single observation of ant decisions (e.g., Figure 4) could be used to predict the fraction that leave the nest to forage in response to a particular incoming forager rate. Such a prediction could be made precise with an estimate of how changes in rin affect individual ant interaction rates.
Discussion
We constructed a model of the decision-making process of individual forager ants to examine how colonies use interactions to regulate foraging activity. Based on data from field observations of the interactions of potential forager ants with returning foragers, we first developed a regression model that showed that ants that left the nest to forage tended to have experienced a higher rate of interaction than those that returned to the deeper nest. We then developed a decision model to provide a simple description of how potential foragers could use interactions with returning foragers to inform their foraging decisions. This model suggests that a simple decision-making mechanism in which ants stochastically accumulate contacts over time could explain core features of our data set and previous work (Prabhakar et al., 2012; Pinter-Wollman et al., 2013). More generally, the model provides a framework to characterize how individual ants use interactions to make decisions that contribute to the collective regulation of foraging of a colony (Gordon, 2010).
The regression model associated an increased probability of leaving the nest to forage with higher interaction rates. However, the overall predictive ability was relatively low (see Figure 4). This may seem to be inconsistent with previous empirical work showing a strong correlation between returning and outgoing foraging rates, especially at high overall foraging rates (Prabhakar et al., 2012). However, we predicted the fraction of ants that decide to leave the nest to forage after entering the entrance chamber from the deeper nest, while previous work analyzed the total number of ants that leave the nest to forage. These yield different results for two reasons. First, after returning foragers come back to the entrance chamber, they may choose to leave again on another foraging trip (Figure 2), which may lead to a correlation between returning and outgoing foraging rates. In our analysis, we considered only potential forager ants that emerged from a tunnel, and did not consider how a returning forager decides to leave once again on a subsequent foraging trip. Second, the total number of potential foragers coming up from the deeper nest may change with returning forager rate because returning foragers may recruit new potential foragers to come into the entrance chamber from the deeper nest or may themselves go to the deeper nest and then re-emerge as potential foragers (Pinter-Wollman et al., 2013; Pless et al., 2015). Further work is needed to learn how the number of available potential foragers responds to changes in returning forager rate.
Colonies vary in many aspects of their behavior (Jandt and Gordon, 2016). In harvester ants, colonies vary in the regulation of foraging activity (Gordon, 1991; Gordon et al., 2011). The regression and decision models presented here may provide the basis for developing a method to identify how individuals differ in foraging decisions from one colony to another. Variation among colonies in how individual ants make decisions leads to ecologically crucial differences among colonies in foraging activity (Gordon, 2013). Colonies live for 20–30 years (Ingram et al., 2013), with a new cohort of ants produced every year by the single founding queen whose survival determines the lifetime of the colony. Variation among colonies in the regulation of foraging activity persists from year to year and appears to be heritable (Gordon, 2013). This allows natural selection to shape how colonies adjust foraging activity to environmental conditions (Gordon, 2013). The daily temporal pattern of foraging (Gordon et al., 2013) suggests that changing temperature and humidity conditions influence the rate of interaction required for an ant to leave the nest to forage. Our model suggests that changes in foraging rate during the day may reflect shifts in individual ants' interaction sensitivity (k) or bias rate (γ). Early in the day, when foraging rates are increasing, ants may have high interaction sensitivity or have a bias toward leaving the nest to forage, with the result that a higher fraction of potential foragers leave the nest to forage (Figure 10, left). Late in the day, when foraging rates are decreasing, ants may have a low interaction sensitivity or have a strong bias toward returning to the deeper nest, with the result that a lower fraction leave the nest to forage (Figure 10, right).
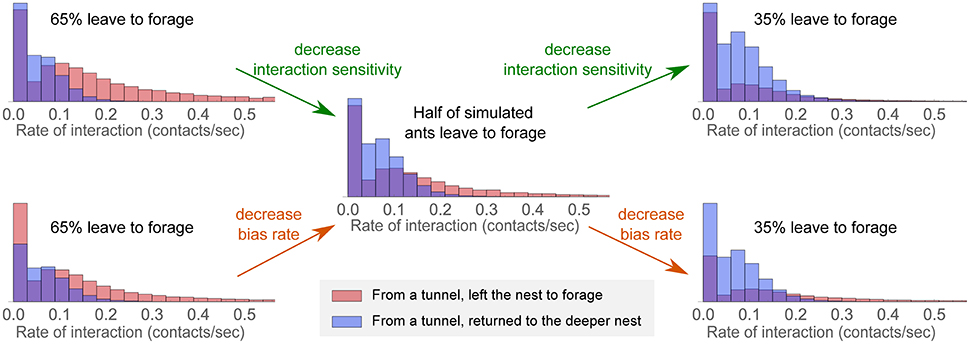
Figure 10. Possible mechanisms underlying regulation of foraging rate. The fraction that leave the nest to forage f (shown decreasing progressively from the left column to the right column) depends on the interaction sensitivity k and constant bias rate γ. Individual panels show the interaction rate distributions for simulated ants that left the nest to forage vs. those that returned to the deeper nest. Parameter values of s0, σ, and rin were used from Figure 6A, and the evidence parameters k and γ were given the following values: (left-top) k = 0.36, γ = −0.038, (left-bottom) k = 0.22, γ = −0.023, (middle) k = 0.22, γ = −0.038, (right-top) k = 0.026, γ = −0.038, (right-bottom) k = 0.22, γ = −0.056.
Although our simple decision model could reasonably reproduce the shapes of the observed distributions of interaction statistics, there are important challenges in constraining the parameters and the functional form of the model by the data (see for example Ditterich, 2006; Kacelnik et al., 2011). It is possible that a different decision model, for example including leak or separate accumulator variables (Smith and Ratcliff, 2004), may provide an as good or better match to the data presented here. Additionally, unlike laboratory studies in which a single animal is presented with many repeated trials (Mazurek, 2003; Ditterich, 2006; Hanks et al., 2006; Raposo et al., 2012; Brunton et al., 2013; Sheppard et al., 2013), here each ant is observed only once and the different ants may vary in their decision-making parameters. Given this and the large number of potential sources of variability, it is difficult to accurately infer decision parameters, as multiple parameter combinations could lead to any particular (N,T) pair. For example, the effects of inter-ant and other sources of variability may not only affect the estimated effective noise σ, as suggested by the discussion surrounding Figure 8, but also may affect the fit values of other decision model parameters. The sources of biological variability examined in Figure 8 also likely have some effect on the regression model fit parameters. Furthermore, spatial effects may be critical in accurately modeling both the rate and impact of interactions. The probability that one ant encounters another depends on nest architecture (Burd et al., 2010; Waters and Fewell, 2012) and an ant's location (Pinter-Wollman et al., 2011; Mersch et al., 2013; Pless et al., 2015), and walking speed may influence interaction rate and an ant's decision whether to forage (Razin et al., 2013). We found that ants that left the nest to forage walked near the exit of the entrance chamber, but ants that returned to the deeper nest did not (Figure S1). This suggests that where ants walk may influence their foraging decision, or that ants may have decided to leave the nest before they reached the exit. Post-decision walking time could shift the (N,T) distributions rightward and reduce their skew (Figure 8F). Future work will analyze the spatial and temporal organization of interaction patterns. In addition, forager behavior may be influenced by the excavation of the nest for filming, and the increased nest maintenance work this stimulates. Some of the interactions relevant to a forager's decision may be made in deeper chambers we could not observe. If so, then some ants may have experienced some of the interactions leading to their decisions prior to the time of our observations. In the decision model, this would alter the value of the initial decision state variable s0 at the point our observations began, possibly leading some ants to decide to leave the nest to forage before coming into the entrance chamber. Further work is needed to learn how all of these factors affect the regulation of foraging.
In our simulations, we generated input sequences of interactions as a Poisson process and compared the resulting simulated distributions of N, T, and r to the data. This is an “aggregated” comparison at the group level, and does not yield predictions for the decisions of individual ants. Although more challenging, it may be possible to adapt the decision model to use an ant's observed experience in the entrance chamber to make such predictions. This would enable a test of the model at both the individual and group levels (see Mann et al., 2013).
Our model illustrates how a basic sequential sampling model can capture core aspects of our data and that of previous studies, and describe how an individual ant may assess interaction rate to make a foraging decision. Other work has considered sequential sampling models (e.g., Ratcliff, 1978; Busemeyer and Townsend, 1993; Usher and McClelland, 2001; Wang, 2002; Ditterich et al., 2003) to examine how decision-makers sample and accumulate evidence to make choices (Ratcliff and Smith, 2004; Bogacz et al., 2006) and how evidence accumulation underlying decision-making is carried out in the brain (Smith and Ratcliff, 2004; Gold and Shadlen, 2007; Purcell et al., 2010). Sequential sampling models can capture trends for both response time and accuracy in two-choice decision tasks (Ratcliff and Rouder, 1998; Ratcliff and Smith, 2004; Bogacz et al., 2006). Sequential sampling models also can be related to optimal decision making strategies (e.g., Bogacz et al., 2006; Marshall et al., 2009; Brunton et al., 2013; Holmes and Cohen, 2014). Here we do not attempt to define an “optimal” response at the single-ant level. Rather, our choice of a sequential sampling model was motivated by the empirical observation that harvester ants engage in sequential interactions with returning foragers that provide evidence about food availability, and use these interactions to decide whether to forage. More generally, the single-ant binary decision behavior we modeled is only an intermediate component in the regulation of the (approximately) analog-valued colony foraging rate. It is not clear what an “optimal” response would be in this context. This differs from previous studies of social insect behavior, in which sequential sampling models have been used to model colony-wide collective decisions between a small number of discrete choices, such as how a honey-bee (Passino et al., 2008; Seeley et al., 2012; Pais et al., 2013) or ant colony (Marshall et al., 2009) chooses a new nest site. Sequential sampling models also have been applied to individual insect decisions in laboratory settings, but again in the context of discrete decisions with a correct answer (Clemens et al., 2014; DasGupta et al., 2014). Given that the colony-wide foraging level is modulated in an approximately analog manner, it may be that strong inter-ant or other sources of variability serves to avoid a situation in which small changes in incoming forager rate lead to a switch from a situation in which all ants leave the nest to forage to one in which all ants return to the deeper nest. If so, this would provide an example of how noise can be beneficial rather than deleterious to signal processing.
This work contributes to the study of a fundamental problem in behavior, how individual decisions are made based on noisy evidence (Smith and Ratcliff, 2004; Bogacz et al., 2006; Holmes and Cohen, 2014). Many decisions are made by accumulating evidence to a threshold. In neural systems, individual neurons have been shown to exhibit an accumulation of evidence (e.g., Gold and Shadlen, 2007) as part of a larger group of neurons that collectively regulates behavior. In ant colonies, the decisions of individuals combine to regulate the collective behavior of the entire system (Passino et al., 2008; Couzin, 2009; Marshall et al., 2009; Reid et al., 2015). This is accomplished through a simple process by which individual ants accumulate evidence through antennal contacts. In the aggregate, the feedback created by these individual decisions allows colonies to adjust to changing conditions and food availability. The two-choice decision modeling framework presented here describes how individual decisions may operate in the context of collective colony behavior.
Methods
Field Experiments and Video Tracking of Ants
Field experiments were performed with colonies of the red harvester ant Pogonomyrmex barbatus at the site of a long term study near Rodeo, NM, USA, monitoring a population of about 300 colonies for which the ages of all colonies are known (Gordon and Kulig, 1996). Observations were made in August 2013 and August 2014. Colonies build nests about 2 m deep in the hard calichi soil of the desert. Interactions between returning and outgoing foragers take place inside the nest entrance chamber, a chamber about 5 cm long, and 2–3 cm below the surface, which connects directly to the nest entrance by a small tunnel (Figure 1). We removed the top layer of soil above the entrance chamber in order to be able to view inside it, extending the methods of Pinter-Wollman et al. (2013) to reveal the entire entrance chamber. Once the entrance chamber was exposed, we placed a transparent piece of glass over it to maintain the high humidity found inside the nest.
Videos were made during the morning foraging activity period. In 2013, we recorded the activity of ants inside the entrance chamber in 3 colonies, colonies 1 (age 3 years), 2 (age 11 years), and 3 (age 16 years). These videos were made 1–3 days after excavation. In 2014, we recorded the activity of ants inside the nest chamber in one colony, 4, from outside the site (estimated age 5 years or older), within about an hour of excavation. For the 2014 video of colony 4, we scattered millet seeds across foraging trails in use that day, about 1.5 m from the nest, to make the returning foragers with food more visible in the video. Each observation was made on a different day. Day-to-day differences in foraging activity arise from variation in temperature, humidity and other conditions (Gordon et al., 2008, 2013). Videos were made in standard HD with a resolution of 1920 × 1080 pixels. Dates and times of filming and the duration of the focus period for tracking interactions between ants for each colony-observation are provided in Table S2.
We tracked the interactions and locations of all ants, excluding interactions with nest maintenance workers or any ants carrying dirt or debris out of the nest, in 1–3 min of each video using a Java program we developed. We did not include interactions with ants that left the nest with dirt or rocks, as these are nest maintenance workers, not foragers (Gordon, 1989). Previous work suggests that potential foragers are stimulated to forage by interactions with returning foragers carrying food (Gordon et al., 2011; Greene et al., 2013; Pinter-Wollman et al., 2013). We could not always distinguish returning foragers with food from other ants, since the seeds they carry are small, and sometimes held beneath the head. However, returning foragers typically do not return to the nest until they find food (Beverly et al., 2009). Thus, we counted all interactions that potential foragers made with returning foragers.
An interaction was considered to occur when the tracked ant's head came within one head width of another ant. The location of an ant was marked with a tracking point when it significantly moved positions or changed the course of its trajectory in a subsequent video frame; this allowed an approximate reconstruction of the ant's entire trajectory by linearly interpolating between tracking points. All ants visible in the entrance chamber were tracked during the selected focus period in the video. Ants that were in the entrance chamber when the focus period began were followed back in time to establish if they were returning foragers or had come from a tunnel. All ants visible long enough to establish four or more tracking points were classified according to their activity. If the ant carried dirt or debris out of the nest, it was considered to be a nest maintenance worker. For colony 1, if the ant appeared in the upper right area of the video frame it also was considered to be a nest maintenance worker since the colony was engaged in maintenance work in this area. If the ant left the nest without carrying anything, in the direction of a foraging trail, it was considered to be an outgoing forager. This classification of activities has been used in previous work which shows that nest maintenance work and foraging are performed by different ants on a given day (Gordon, 1989). The exit time for an outgoing forager was when the ant crossed a line that we defined as the outer edge of the entrance chamber (Figure S1). The time when an ant went down to the deeper nest was defined as when the ant was no longer visible. Some ants appeared to come up, hover around the tunnel entrance, and then go down again. Such ants were not considered to be potential foragers if they never left the entrance of a tunnel to the deeper nest, or if their total time in the entrance chamber was less than the shortest time that it took an outgoing forager to exit from a tunnel (Table S1). Inclusion of the latter set of ants did not change the results on statistical significance for the average difference of rate of interaction between the two groups of ants taking either action.
The behavior of each potential forager was classified according to the start and end locations of its trajectory (Figure 2). Our analysis focused on potential forager ants that appeared in the entrance chamber from a tunnel. The vast majority of ants that came from a tunnel during the focus tracking period either left the nest to forage or returned to the deeper nest during tracking or shortly thereafter. Figure S1 shows all trajectories of potential foragers for each observation, and Table S1 contains an exhaustive categorization of tracked ants with the total number of ants in each category.
Because it does not require an assumption of a Gaussian distribution of the sampling means, a permutation test was used to test for significance of the hypothesis that the mean interaction rate of ants that come up from a tunnel and leave the nest to forage is higher than that of ants that come up from a tunnel and return to the deeper nest. Ants were randomly assigned decisions of either leave the nest to forage or return to the deeper nest in the same proportion as observed. The difference in mean interaction rates was then calculated for these ants. This procedure was repeated many times (107 iterations) in order to obtain a distribution of the differences in mean interaction rate if decisions were made at random. We denote this distribution Pm (v), where v is the difference, after shuffling the data, of the mean interaction rate of ants that come up from a tunnel and leave the nest to forage minus the mean interaction rate of ants that come up from a tunnel and return to the deeper nest. Let the observed difference in mean interaction rates be v*. The p-value corresponding to the above hypothesis was calculated by integrating under the distribution curve in the tail area to the right of v*, which yields the probability that a difference in mean interaction rates as great or greater could have been observed if the ants made decisions randomly with respect to interactions:
Results for significance with the one-tailed tests (using significance at the 0.025 level) did not change if instead a two-tailed test with significance at the 0.05 level was used (two-sided permutation test, colony 1: p = 0.040, colony 2: p = 0.025, colony 3: p = 0.10, colony 4: p = 0.027).
Logistic Regression Model
A logistic regression model was used to relate the probability of foraging to the rate of interaction (r), number of interactions (N), the time in the entrance chamber (T), or combinations of these variables. The probability of foraging for all of the input configurations can be expressed efficiently in the form
where is a vector of weight values and the data vector contains input quantities and a constant. The right-hand side is the logistic function. Since f is the probability of leaving the nest to forage, 1 − f represents the probability of returning to the deeper nest.
To fit the β parameters of the model, we used the log-likelihood function
where ln L is the log-likelihood, nf is the number of ants which came from a tunnel and left the nest to forage, and nr is the number of ants that came from a tunnel and returned to the deeper nest. Maximum likelihood fits were performed in Mathematica using GeneralizedLinearModelFit.
The goodness of fit of the rate regression model was evaluated by using a likelihood ratio test (Myers et al., 2012). To perform this test, we calculated the likelihood ratio by comparing the rate regression model fit to a null model with only a single parameter, i.e., a fit of the model Pforage = const, to obtain the test statistic. A chi-square distribution with 1 degree of freedom was then used to calculate a p-value for each fit. This same procedure was used in the nested model comparison to obtain p-values for the improvement in fit of obtained by the (r,T) and (r,N) regression models compared to the rate regression model. The log-likelihood values for fits of these models to each colony observation are listed in Table S3.
A bootstrap procedure of random sampling with replacement was used to calculate distributions of the regression parameters (Efron, 1982). For a dataset with M points, a total of M samples was taken, but repetition was permitted so that the cases differ due to repetition of certain sampled points. A given classifier model was fit to the sampled data and the procedure was repeated 5000 times to obtain a distribution of fit parameter values. The confidence interval for each parameter was then calculated as follows. Let Q(β) represent the probability distribution for parameter β, and β* represent the median of the distribution dataset. A 95% confidence interval was expressed as , with the q1 and q2 values obtained by solving
We used this procedure, which allows for confidence intervals that are asymmetric about the best fit value, because we noticed that the parameter distributions were sometimes highly skewed.
The standard deviation of the regression model fit for Pforage (Figure 4) was calculated by first using each set of bootstrapped parameter values to calculate a prediction. Then, for a given value of r, the standard deviation of the bootstrapped predictions for Pforage(r) was calculated.
Decision Model
Decision model simulations used Equation (2), plus a threshold-crossing rule that specifies the values of the decision state variable s at which each ant decides to leave the nest to forage or return to the deeper nest (see “Model description” in the Results). The input sequence of interactions for each ant was generated by a Poisson process with a specified average rate rin.
The parameters γ and k in the model represent the bias rate and interaction sensitivity, respectively. We can calculate a simple, approximate relationship between these parameters that yields a constant fraction of simulated ants that leave the nest to forage. Consider an ensemble average of Equation (2):
The ensemble average yields < ∑jδ(t − tj) >= rin for the input interactions and <dη(t)/dt> = 0 for the noise term. When the average change in the decision state is constant, the fraction that leave the nest to forage will be approximately constant. This yields the condition:
When Equation (8) is satisfied, we refer to this as a line of constant fraction that leave to forage in (γ, k) parameter space. Along such a line, for a given value of the initial condition s0, the fraction of simulated ants that leave the nest to forage is approximately constant. When and s0 = 0, Equation (8) yields a condition for which approximately 50% of the simulated ants leave the nest to forage. This was used to set the parameter values for the illustrative example in Figure 8.
For the simulation shown in Figure 6A, we noted that if the same parameters were used with a noise level of zero, the fastest time for a simulated ant that returns to the deeper nest would be over 36 s. To see why this is the case, consider a simulated ant that makes no interactions and has a noise parameter of zero. Integrating Equation (2) from 0 to T yields s = γT + s0. This ant will return to the deeper nest when s = −1, which yields T = −(1 + s0)/γ = 36.6 s, using the values of γ and s0 from Figure 6A.
To choose parameters for Figures 6, 7 that produced distributions and trends for Pforage that resembled the observed distributions, we used hand-tuning of parameters followed by a refinement using a least-squares fit to the distributions. In decision-making tasks that yield response time and accuracy distributions, a common method to fit distributions to data uses weighted least squares to minimize the differences between quantiles of the model and observed distributions, with weights chosen to approximate the estimated uncertainty in each quantile (Ratcliff and Tuerlinckx, 2002). To aid in choosing the representative parameter values used in Figure 8, we used a modified, unweighted version of this procedure with the following cost function:
where Q(q) represents a cumulative distribution function evaluated at quantile q, the sum over μ goes over both groups of ants, i.e., left the nest to forage and returned to the deeper nest, the sum over M includes quantities of rate (r), number of interactions (N), and time in the entrance chamber (T), and each cumulative distribution function was summed from q = 0.1 to 0.9 in increments of 0.2. In this notation, Mμ represents the quantity M for group μ [e.g., M = r and μ = (left the nest to forage)]. The unweighted quantile fit was used for simplicity. The second term matches the fraction that leave the nest to forage in the model (fmodel) with the fraction that leave the nest to forage observed in the data (fdata), and this term was weighted by a factor of λ = 100. After hand-tuning to obtain reasonable distributions, a simulated annealing algorithm was used to find values of k, γ, s0, and σ with small values of ϵ. The value of rin was set from the observations (see Figure S2). To produce results resembling the time distributions for the observation of colony 3, we added a constant post-decision time of 5 s. without interactions (Figure 7B). For this simulation, a value of rin = 0.25 was calculated to match the overall rate of interaction for this observation when the added post-decision time of 5 s. was included.
For the example simulation with multiple sources of variability shown in Figure 8G, we began with parameters values of k, γ, s0, and σ from Figure 6A, and used to keep approximately the same overall average input rate of interaction. Using a standard deviation of 50% of the mean to set the evidence parameters k and γ, a uniform distribution of width 1 to set s0, and an added post-decision time of 5 s. with continued interactions, we then adjusted the mean values of k, γ, and s0 in order to obtain a result that resembled the observation of colony 2.
For the fits of k, γ, s0, and σ, we could not ensure that the parameters used corresponded to global minima in ϵ. We note that the fitting method was used only to aid in choosing representative parameters to demonstrate the capability of the model in producing realistic distributions for N, T, r, and Pforage, and the resulting parameter values do not form a reliable absolute comparison between colonies. This is because, as noted in the Discussion, other possible factors need to be considered to accurately compare results across colonies, and multiple parameter values may provide reasonable fits.
For each result showing a distribution or average of a given quantity, a sufficient number of ants were simulated so that the result converged. The number of simulated ants needed to obtain convergence ranged from approximately 25,000 for the average fraction that left the nest to forage to over 200,000 for the distributions of N, T, and r.
Author Contributions
Conceived and designed the experiments: DG. Performed the experiments: JD, RA, SC, and DG. Contributed to the writing of the manuscript: JD, DG, and MG. Performed image analysis of the data: RA, SC, and DG. Analyzed the data statistically: JD, RA, DG, and MG. Designed the software used in tracking ants: DG, SC. Developed the models and simulations: JD, MG, and DG. Performed simulations: JD.
Conflict of Interest Statement
The authors declare that the research was conducted in the absence of any commercial or financial relationships that could be construed as a potential conflict of interest.
Acknowledgments
We thank Tim Hanks for helpful comments on the manuscript. We are grateful to Cameron Backes, Naseem Bahet, Ezzie Brachman, Carolyn Hickman, Konrad Miziolek, Jovel Quierolo, Stefan Popp, Jack Rasiel, Brett Slaazar, and Daniel Washington for their help with field work and with the analysis of video data, and to Trevor Hastie, Uri Eden, Jochen Ditterich, and Kelsey Allen for helpful discussions. We thank the staff at the Southwestern Research Station for their help with field work. This work was supported by NIH R01 GM105024.
Supplementary Material
The Supplementary Material for this article can be found online at: https://www.frontiersin.org/article/10.3389/fevo.2016.00115
References
Beverly, B. D., McLendon, H., Nacu, S., Holmes, S., and Gordon, D. M. (2009). How site fidelity leads to individual differences in the foraging activity of harvester ants. Behav. Ecol. 20, 633–638. doi: 10.1093/beheco/arp041
Bogacz, R., Brown, E., Moehlis, J., Holmes, P., and Cohen, J. D. (2006). The physics of optimal decision making: a formal analysis of models of performance in two-alternative forced-choice tasks. Psychol. Rev. 113, 700–765. doi: 10.1037/0033-295X.113.4.700
Brunton, B. W., Botvinick, M. M., and Brody, C. D. (2013). Rats and humans can optimally accumulate evidence for decision-making. Science 340, 95–98. doi: 10.1126/science.1233912
Burd, M., Shiwakoti, N., Sarvi, M., and Rose, G. (2010). Nest architecture and traffic flow: large potential effects from small structural features. Ecol. Entomol. 35, 464–468. doi: 10.1111/j.1365-2311.2010.01202.x
Busemeyer, J. R., and Townsend, J. T. (1993). Decision field theory: a dynamic-cognitive approach to decision making in an uncertain environment. Psychol. Rev. 100, 432–459. doi: 10.1037/0033-295X.100.3.432
Clemens, J., Krämer, S., and Ronacher, B. (2014). Asymmetrical integration of sensory information during mating decisions in grasshoppers. Proc. Natl. Acad. Sci. U.S.A. 111, 16562–16567. doi: 10.1073/pnas.1412741111
Couzin, I. D. (2009). Collective cognition in animal groups. Trends Cogn. Sci. 13, 36–43. doi: 10.1016/j.tics.2008.10.002
DasGupta, S., Ferreira, C. H., and Miesenböck, G. (2014). FoxP influences the speed and accuracy of a perceptual decision in Drosophila. Science 344, 901–904. doi: 10.1126/science.1252114
Detrain, C., and Deneubourg, J.-L. (2008). “Collective decision-making and foraging patterns in ants and honeybees,” in Advances in Insect Physiology, ed S. J. Simpson (Amsterdam: Academic Press), 123–173.
Ditterich, J. (2006). Stochastic models of decisions about motion direction: behavior and physiology. Neural Netw. 19, 981–1012. doi: 10.1016/j.neunet.2006.05.042
Ditterich, J., Mazurek, M. E., and Shadlen, M. N. (2003). Microstimulation of visual cortex affects the speed of perceptual decisions. Nat. Neurosci. 6, 891–898. doi: 10.1038/nn1094
Gold, J. I., and Shadlen, M. N. (2007). The neural basis of decision making. Annu. Rev. Neurosci. 30, 535–574. doi: 10.1146/annurev.neuro.29.051605.113038
Gordon, D. M. (1983). The relation of recruitment rate to activity rhythms in the harvester ant, Pogonomyrmex barbatus (F. Smith) (Hymenoptera: Formicidae). J. Kans. Entomol. Soc. 56, 277–285.
Gordon, D. M. (1986). The dynamics of the daily round of the harvester ant colony (Pogonomyrmex barbatus). Anim. Behav. 34, 1402–1419. doi: 10.1016/S0003-3472(86)80211-1
Gordon, D. M. (1989). Dynamics of task switching in harvester ants. Anim. Behav. 38, 194–204. doi: 10.1016/S0003-3472(89)80082-X
Gordon, D. M. (1991). Behavioral Flexibility and the Foraging Ecology of Seed-Eating Ants. Am. Nat. 138, 379–411.
Gordon, D. M. (1993). The spatial scale of seed collection by harvester ants. Oecologia 95, 479–487.
Gordon, D. M. (1995). The development of an ant colony's foraging range. Anim. Behav. 49, 649–659. doi: 10.1016/0003-3472(95)80198-7
Gordon, D. M. (2002). The regulation of foraging activity in red harvester ant colonies. Am. Nat. 159, 509–518. doi: 10.1086/339461
Gordon, D. M. (2010). Ant Encounters: Interaction Networks and Colony Behavior: Interaction Networks and Colony Behavior. Princeton, NJ: Princeton University Press.
Gordon, D. M. (2013). The rewards of restraint in the collective regulation of foraging by harvester ant colonies. Nature 498, 91–93. doi: 10.1038/nature12137
Gordon, D. M., Dektar, K. N., and Pinter-Wollman, N. (2013). Harvester ant colony variation in foraging activity and response to humidity. PLoS ONE 8:e63363. doi: 10.1371/journal.pone.0063363
Gordon, D. M., Guetz, A., Greene, M. J., and Holmes, S. (2011). Colony variation in the collective regulation of foraging by harvester ants. Behav. Ecol. 22, 429–435. doi: 10.1093/beheco/arq218
Gordon, D. M., Holmes, S., and Nacu, S. (2008). The short-term regulation of foraging in harvester ants. Behav. Ecol. 19, 217–222. doi: 10.1093/beheco/arm125
Gordon, D. M., and Kulig, A. W. (1996). Founding, foraging, and fighting: colony size and the spatial distribution of harvester ant nests. Ecology 77, 2393–2409. doi: 10.2307/2265741
Greene, M. J., and Gordon, D. M. (2003). Social insects: cuticular hydrocarbons inform task decisions. Nature 423, 32–32. doi: 10.1038/423032a
Greene, M. J., Gordon, D. M., and Wilbur, N. H. E. H. M. (2007). How patrollers set foraging direction in harvester ants. Am. Nat. 170, 943–948. doi: 10.1086/522843
Greene, M. J., Pinter-Wollman, N., and Gordon, D. M. (2013). Interactions with combined chemical cues inform harvester ant foragers' decisions to leave the nest in search of food. PLoS ONE 8:e52219. doi: 10.1371/journal.pone.0052219
Hanks, T. D., Ditterich, J., and Shadlen, M. N. (2006). Microstimulation of macaque area LIP affects decision-making in a motion discrimination task. Nat. Neurosci. 9, 682–689. doi: 10.1038/nn1683
Hölldobler, B., Morgan, E. D., Oldham, N. J., and Liebig, J. (2001). Recruitment pheromone in the harvester ant genus Pogonomyrmex. J. Insect Physiol. 47, 369–374. doi: 10.1016/S0022-1910(00)00143-8
Holmes, P., and Cohen, J. D. (2014). Optimality and some of its discontents: successes and shortcomings of existing models for binary decisions. Top. Cogn. Sci. 6, 258–278. doi: 10.1111/tops.12084
Ingram, K. K., Pilko, A., Heer, J., and Gordon, D. M. (2013). Colony life history and lifetime reproductive success of red harvester ant colonies. J. Anim. Ecol. 82, 540–550. doi: 10.1111/1365-2656.12036
Jandt, J., and Gordon, D. (2016). The behavioral ecology of variation in social insects. Curr. Opin. Insect. Sci. 15, 40–44. doi: 10.1016/j.cois.2016.02.012
Kacelnik, A., Vasconcelos, M., Monteiro, T., and Aw, J. (2011). Darwin's “tug-of-war” vs. starlings' “horse-racing”: how adaptations for sequential encounters drive simultaneous choice. Behav. Ecol. Sociobiol. 65, 547–558. doi: 10.1007/s00265-010-1101-2
Mann, R. P., Perna, A., Strömbom, D., Garnett, R., Herbert-Read, J. E., Sumpter, D. J. T., et al. (2013). Multi-scale Inference of Interaction Rules in Animal Groups Using Bayesian Model Selection. PLoS Comput. Biol. 9:e1002961. doi: 10.1371/journal.pcbi.1002961
Marshall, J. A. R., Bogacz, R., Dornhaus, A., Planqué, R., Kovacs, T., and Franks, N. R. (2009). On optimal decision-making in brains and social insect colonies. J. R. Soc. Interface. 6, 1065–1074. doi: 10.1098/rsif.2008.0511
Mazurek, M. E. (2003). A role for neural integrators in perceptual decision making. Cereb. Cortex 13, 1257–1269. doi: 10.1093/cercor/bhg097
Mersch, D. P., Crespi, A., and Keller, L. (2013). Tracking individuals shows spatial fidelity is a key regulator of ant social organization. Science 340, 1090–1093. doi: 10.1126/science.1234316
Myers, R. H., Montgomery, D. C., Vining, G. G., and Robinson, T. J. (2012). Generalized Linear Models: with Applications in Engineering and the Sciences. Hoboken, NJ: John Wiley & Sons.
Pais, D., Hogan, P. M., Schlegel, T., Franks, N. R., Leonard, N. E., and Marshall, J. A. R. (2013). A mechanism for value-sensitive decision-making. PLoS ONE 8:e73216. doi: 10.1371/journal.pone.0073216
Passino, K. M., Seeley, T. D., and Visscher, P. K. (2008). Swarm cognition in honey bees. Behav. Ecol. Sociobiol. 62, 401–414. doi: 10.1007/s00265-007-0468-1
Pinter-Wollman, N., Bala, A., Merrell, A., Queirolo, J., Stumpe, M. C., Holmes, S., et al. (2013). Harvester ants use interactions to regulate forager activation and availability. Anim. Behav. 86, 197–207. doi: 10.1016/j.anbehav.2013.05.012
Pinter-Wollman, N., Wollman, R., Guetz, A., Holmes, S., and Gordon, D. M. (2011). The effect of individual variation on the structure and function of interaction networks in harvester ants. J. R. Soc. Interface 8, 1562–1573. doi: 10.1098/rsif.2011.0059
Pless, E., Queirolo, J., Pinter-Wollman, N., Crow, S., Allen, K., Mathur, M. B., et al. (2015). Interactions increase forager availability and activity in harvester ants. PLoS ONE 10:e0141971. doi: 10.1371/journal.pone.0141971
Prabhakar, B., Dektar, K. N., and Gordon, D. M. (2012). The regulation of ant colony foraging activity without spatial information. PLoS Comput. Biol. 8:e1002670. doi: 10.1371/journal.pcbi.1002670
Purcell, B. A., Heitz, R. P., Cohen, J. Y., Schall, J. D., Logan, G. D., and Palmeri, T. J. (2010). Neurally constrained modeling of perceptual decision making. Psychol. Rev. 117, 1113–1143. doi: 10.1037/a0020311
Raposo, D., Sheppard, J. P., Schrater, P. R., and Churchland, A. K. (2012). Multisensory decision-making in Rats and Humans. J. Neurosci. 32, 3726–3735. doi: 10.1523/JNEUROSCI.4998-11.2012
Ratcliff, R., and Rouder, J. N. (1998). Modeling response times for two-choice decisions. Psychol. Sci. 9, 347–356.
Ratcliff, R., and Smith, P. L. (2004). A comparison of sequential sampling models for two-choice reaction time. Psychol. Rev. 111, 333. doi: 10.1037/0033-295X.111.2.333
Ratcliff, R., and Tuerlinckx, F. (2002). Estimating parameters of the diffusion model: approaches to dealing with contaminant reaction times and parameter variability. Psychon. Bull. Rev. 9, 438–481. doi: 10.3758/BF03196302
Razin, N., Eckmann, J.-P., and Feinerman, O. (2013). Desert ants achieve reliable recruitment across noisy interactions. J. R. Soc. Interface 10, 20130079. doi: 10.1098/rsif.2013.0079
Reid, C. R., Garnier, S., Beekman, M., and Latty, T. (2015). Information integration and multiattribute decision making in non-neuronal organisms. Anim. Behav. 100, 44–50. doi: 10.1016/j.anbehav.2014.11.010
Schafer, R. J., Holmes, S., and Gordon, D. M. (2006). Forager activation and food availability in harvester ants. Anim. Behav. 71, 815–822. doi: 10.1016/j.anbehav.2005.05.024
Seeley, T. D., Visscher, P. K., Schlegel, T., Hogan, P. M., Franks, N. R., and Marshall, J. A. R. (2012). Stop signals provide cross inhibition in collective decision-making by honeybee swarms. Science 335, 108–111. doi: 10.1126/science.1210361
Sheppard, J. P., Raposo, D., and Churchland, A. K. (2013). Dynamic weighting of multisensory stimuli shapes decision-making in rats and humans. J. Vis. 13, 4. doi: 10.1167/13.6.4
Smith, P. L., and Ratcliff, R. (2004). Psychology and neurobiology of simple decisions. Trends Neurosci. 27, 161–168. doi: 10.1016/j.tins.2004.01.006
Torney, C., Neufeld, Z., and Couzin, I. D. (2009). Context-dependent interaction leads to emergent search behavior in social aggregates. Proc. Natl. Acad. Sci. 106, 22055–22060. doi: 10.1073/pnas.0907929106
Usher, M., and McClelland, J. L. (2001). The time course of perceptual choice: the leaky, competing accumulator model. Psychol. Rev. 108, 550–592. doi: 10.1037/0033-295X.108.3.550
Wang, X.-J. (2002). Probabilistic decision making by slow reverberation in cortical circuits. Neuron 36, 955–968. doi: 10.1016/S0896-6273(02)01092-9
Keywords: stochastic accumulator, integrator, sequential sampling model, collective behavior, decision-making
Citation: Davidson JD, Arauco-Aliaga RP, Crow S, Gordon DM and Goldman MS (2016) Effect of Interactions between Harvester Ants on Forager Decisions. Front. Ecol. Evol. 4:115. doi: 10.3389/fevo.2016.00115
Received: 02 April 2016; Accepted: 15 September 2016;
Published: 05 October 2016.
Edited by:
James A. R. Marshall, University of Sheffield, UKCopyright © 2016 Davidson, Arauco-Aliaga, Crow, Gordon and Goldman. This is an open-access article distributed under the terms of the Creative Commons Attribution License (CC BY). The use, distribution or reproduction in other forums is permitted, provided the original author(s) or licensor are credited and that the original publication in this journal is cited, in accordance with accepted academic practice. No use, distribution or reproduction is permitted which does not comply with these terms.
*Correspondence: Deborah M. Gordon, dmgordon@stanford.edu
Mark S. Goldman, msgoldman@ucdavis.edu