Using Whole-Genome Sequence Information to Foster Conservation Efforts for the European Dark Honey Bee, Apis mellifera mellifera
 Melanie Parejo1,2*
  David Wragg3,4 Laurent Gauthier1
  Alain Vignal3
  Peter Neumann1,2,5
  Markus Neuditschko1*
- 1Swiss Bee Research Center, Agroscope, Bern, Switzerland
- 2Vetsuisse Faculty, Institute of Bee Health, University of Bern, Bern, Switzerland
- 3GenPhySE, INRA, INPT, INP-ENVT, Université de Toulouse, Castanet Tolosan, France
- 4The Roslin Institute and Royal (Dick) School of Veterinary Studies, University of Edinburgh, Edinburgh, UK
- 5Bee Protection Laboratory, Department of Biology, Faculty of Science, Chiang Mai University, Chiang Mai, Thailand
Pollination is a key ecosystem service for agricultural systems and Western honey bees, Apis mellifera, are the most important managed pollinators. Major losses of managed honey bee colonies reinforced the need to take advantage of locally adapted subspecies and ecotypes to buffer populations against various stressors. However, introductions of non-native honey bees from distant lineages are likely to undermine respective conservation efforts unless reliable and cost effective tools can be used to identify hybridization. The purpose of this study is to characterize current population structure and genetic diversity, and to assess the degree of admixture between native and introduced honey bees. Moreover, we aim to select a reduced number of genetic markers to improve conservation management strategies. We take advantage of recent developments in next-generation sequencing and network-based clustering to investigate conservation efforts for the native European Dark honey bee, A. m. mellifera, which is threatened by introgression in most of its range. We collected whole-genome sequence information from haploid drones of A. m. mellifera, A. m. carnica, and Buckfast sampled throughout Switzerland (N = 81), as well as from four Swiss A. m. mellifera conservation areas (N = 39) and from one conservatory in the French Alps (N = 31). Population structure analyses based upon 3.375 M genome-wide SNPs discerned samples by subspecies and geographic origin (Switzerland or France). Ancestry inference indicated admixed individuals in all of the protected areas, calling for improved management efforts. After testing different subsets of ancestry informative SNPs using three different selection strategies (FST, PCA-based or at random), as few as 50 SNPs are found to be sufficient to differentiate native from introduced honey bees. Therefore, our data suggests that a low-density SNP panel can be a precise and cost-effective tool to support conservation management efforts for managed pollinators.
Introduction
Pollination is a key ecosystem service for agricultural systems (Klein et al., 2007) with the current annual market value of pollinator-dependent crops estimated to USD $235–$577 billion (IPBES, 2016). Global pollinator declines can have severe impacts on crop production and food security and calls for conservation of wild and managed pollinators (Potts et al., 2010; IPBES, 2016). The Western honey bee, Apis mellifera, is the most economically valuable pollinator (Klein et al., 2007; Gallai et al., 2009). Major losses of managed honey bee colonies across the Northern Hemisphere reinforced the need to take advantage of locally adapted subspecies and ecotypes to buffer populations against various stressors (Neumann and Carreck, 2010). The protection of honey bee biodiversity is therefore an imperative (De La Rúa et al., 2009), since current genetic diversity harbors the evolutionary potential of a species to adapt by natural selection in the future (Frankham et al., 2002; Allendorf et al., 2013). Once genetic variants are lost, they cannot be recovered and thus local adaptations to specific environments deserve conservation. In the case of the Western honey bee more than 27 subspecies have been reported, characterized by differences in morphology, physiology and behavior (Ruttner, 1988; Hepburn and Radloff, 1998; Sheppard and Meixner, 2003; Meixner et al., 2013; Chen et al., 2016, amongst others). These subspecies can be differentiated into four main evolutionary lineages: M (Western and Northern Europe), C (Eastern Europe), O (Near East and Central Asia), and A (Africa) (Ruttner, 1988; Garnery et al., 1992; Franck et al., 2000b; Whitfield et al., 2006; Han et al., 2012), whose geographic distribution encompasses a diversity of environmental conditions. The introduction of exotic subspecies from distant evolutionary lineages, typically by commercial beekeepers, poses a risk on the genetic integrity of locally adapted ecotypes (De La Rúa et al., 2009; Meixner et al., 2010; Pinto et al., 2014). It is thus essential to conserve the underlying genetic diversity, which may contribute to the long-term sustainability of populations (Vanengelsdorp and Meixner, 2010).
In Northern and Central Europe, the native dark honey bee, A. m. mellifera, has been widely replaced for beekeeping by subspecies mainly from the C-lineage such as A. m. carnica and A. m. ligustica (Ruttner, 1988; Moritz, 1991; Kauhausen-Keller and Keller, 1994; Jensen et al., 2005a), which have been more intensively managed for production and display more likely traits desired by beekeepers, such as high honey yield and docility (Bouga et al., 2011). The large mating distances of drones and queens (Ruttner and Ruttner, 1972; Böttcher, 1975; Jensen et al., 2005b), as well as the highly polyandrous mating system (Woyke, 1964; Adams et al., 1977; Neumann et al., 1999b) impose practical difficulties to conserve honey bee subspecies or to maintain breeding lines (Neumann et al., 1999a). This is further confounded by the ease at which different subspecies hybridize with one another (Franck et al., 2000a; Soland-Reckeweg et al., 2009).
In the last decade, there has been an increased awareness of the importance of preserving local honey bee subspecies (Muñoz and De La Rúa, 2012; Muñoz et al., 2014a,b; Uzunov et al., 2014b; Bertrand et al., 2015). A recent pan-European experiment testing different subspecies and local hybrids across a variety of environments revealed that locally adapted bees were not only the most long-lived (Büchler et al., 2014), but in many cases also received better scores for docility and productivity (Uzunov et al., 2014a). Conservation efforts have been employed in many countries across Europe (De La Rúa et al., 2009) and typically focus on selective breeding or restricting the bees kept by apiculturists to those native to a specified area. Islands or remote mountain valleys in particular offer excellent opportunities to limit the impact of non-native honey bees. Conservation measures usually include that introduced honey bees and hybrids are replaced by native bees after being identified by discrimination of wing morphology (Ruttner, 1988; Kauhausen-Keller and Keller, 1994) or genetic analyses using microsatellite markers (Neumann et al., 1999a; Scharpenberg et al., 2006; Soland-Reckeweg et al., 2009; Oleksa et al., 2011; Péntek-Zakar et al., 2015).
In Switzerland, the native honey bee subspecies are A. m. mellifera, and to a lesser extent in Ticino, South of the Alps, A. m. ligustica (Ruttner, 1988). Since the middle of the last century, foreign honey bee queens have been increasingly imported such that nowadays two other subspecies or breeds are commonly found, namely A. m. carnica and the Buckfast bee (a highly selected hybrid breed). The persistence of A. m. ligustica in the region of Ticino is not clear. Many foreign queens have been introduced to this region and there are no ongoing efforts to maintain this local subspecies. In contrast, considerable effort has been invested to protect A. m. mellifera in Switzerland. To date, four conservation areas for A. m. mellifera have been established; conservatory Glarus (CGL) (~1000 colonies, 680 km2), Val Mustair (CVM) (~300 colonies, 199 km2), Diemtigtal (CDI) (~300 colonies, 135 km2) and Melchtal (CME) (~50 colonies, 150 km2). These areas are typically part of a nature reserve, and bee keeping of A. m. mellifera is either legally enforced or mutually agreed upon by the beekeeping community in that area. A national project to maintain and support these conservatories has recently been approved by the Swiss ministry of agriculture. However, for the effectiveness and long-term success of these conservation areas an accurate assessment of the admixture levels and genetic diversity of the current breeding populations is required.
In the French Alps, the center for technical bee keeping studies (CETA) was established in Savoie in 1997 to manage and select for the locally-adapted A. m. mellifera. At CETA de Savoie selection is based on biometric and morphometric analyses in collaboration with the French National Center for Scientific Research (CNRS) and Natural History Museum in Paris. The center shares the same objectives as the dark bee conservatories in Switzerland, and the region has comparable topography and climate. Analysis of bees from the different programs provides some information on the effectiveness of conservation management in the different regions.
The release and subsequent upgrade of the honey bee genome (Weinstock et al., 2006; Elsik et al., 2014) and rapid innovations in high-throughput technologies drastically reduced the costs of next-generation sequencing (NGS). Hence, it has now become both technically and economically feasible to assess genome-wide genetic diversity and admixture levels of honey bees (e.g., Harpur et al., 2014; Pinto et al., 2014; Wallberg et al., 2014). However, despite the reduced costs of NGS it is still not cost-effective to routinely sequence hundreds or thousands of bees to monitor conservation management. Instead, a few but highly informative single nucleotide polymorphisms (SNPs), so-called ancestry informative markers (AIMs) can be selected in order to infer population structure (Shriver et al., 2003; Enoch et al., 2006; Kosoy et al., 2009). The identification of AIMs allows to estimate individual origin and admixture levels inexpensively and with great accuracy. For instance, Muñoz et al. (2015) have selected different AIM panels out of 1183 genotyped SNPs to examine levels of admixture between native A. m. mellifera and introduced honey bees in Europe. With such ultra-low density SNP-chips, thousands of individuals can be cost-effectively genotyped for conservation management or for sustainable bee breeding purposes. Moreover, SNP chips are potentially more accurate than the currently employed microsatellites or morphometric analyses for discriminating honey bees of different origin. Indeed, empirical comparisons for other species have shown SNPs to be more precise than microsatellites for population assignment and admixture estimation (Liu et al., 2005; Hauser et al., 2011; Gärke et al., 2012).
The purpose of this study was (1) to characterize the current population structure and genetic diversity of the honey bees sampled in Switzerland and the French Alps, (2) to assess the degree of admixture form introduced honey bees in the conservation areas of A. m. mellifera and (3) to select a reduced number of informative SNPs to improve conservation management strategies. To this end, we sequenced 151 whole-genomes of haploid drones sampled throughout Switzerland and the French Alps which included A. m. mellifera samples from five conservation areas. Using model- and network-based clustering approaches, we detected fine-scale population structure with high genetic diversity in all sampled subpopulations. Furthermore, we observed admixed A. m. mellifera individuals in all five conservation areas. To cost-effectively identify such hybrids within A. m. mellifera, we selected ancestry informative SNPs and show that as few as 50 SNPs are accurate to quantify levels of genetic admixture and relatedness between honey bees.
Materials and Methods
Sampling, DNA Extraction and Sequencing
In summer 2014, sealed drone brood was sampled from 120 honey bee colonies at 87 apiaries throughout Switzerland (Figure 1). The beekeepers involved specified these samples to consist of 72 A. m. mellifera, 34 A. m. carnica, and 14 Buckfast. A. m. mellifera samples from Switzerland included 39 from four conservation areas: CDI (N = 6), CGL (N = 17), CME (N = 6), CVM (N = 10) (Figure 1). Drones were sampled because they are haploid allowing to confidently identify SNPs with less coverage than in diploid individuals (Wragg et al., 2016). Furthermore, the collection of drone brood allows excluding sampling errors due to drifting from neighboring colonies (Neumann et al., 2000).
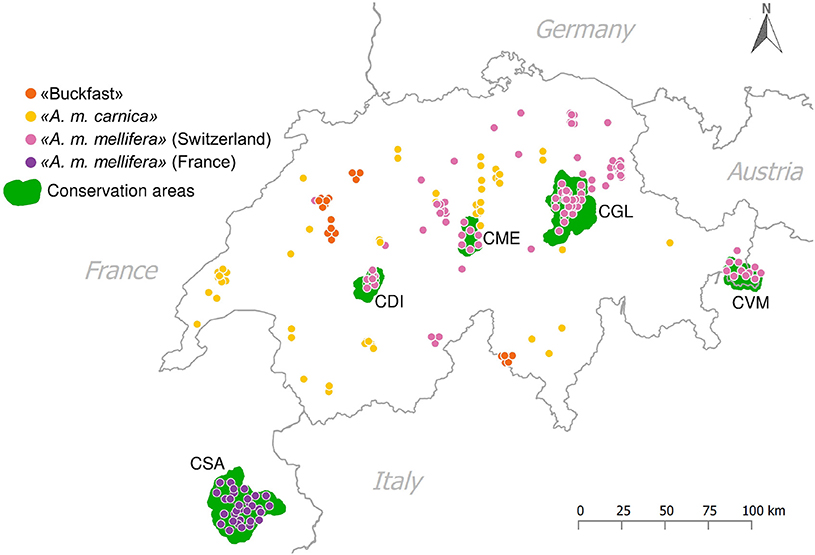
Figure 1. Sampling sites. Putative subspecies assignment according to the labeling of beekeepers from which the samples were collected: ≪A. m. mellifera≫ (N = 72) from Switzerland, including N = 39 from the Swiss conservatories, ≪A. m. mellifera≫ (N = 31) from the French conservatory in Savoy, ≪A. m. carnica≫ (N = 34) and ≪Buckfast≫ bees (N = 14). The green areas are the five currently established conservatories in that area to protect the native A. m. mellifera: CDI, CME, CGL, CVM, and CSA.
In order to ensure high quality DNA for whole-genome sequencing, a two-step procedure was applied for DNA extraction. First, high molecular weight DNA was extracted with phenol-chloroform-isoamyl alcohol (25:24:1) (Ausubel, 1988) from one entire honey bee drone per colony at the larval or pupal stage. DNA was then purified using the QIAGEN's EZ1® DNA Tissue Kit (QIAGEN Redwood City, www.qiagen.com). Pair-end (2 × 125 bp) libraries were prepared following the manufacturer's protocol (TruSeq Nano Kit v4) and whole-genome sequencing at an aimed sequencing depth of 10X coverage was performed on an Illumina HiSeq2500 with 24 samples per lane.
Complementary A. m. mellifera were sampled from a conservation area in the Savoie region in the French Alps (CSA: N = 31). These samples have been sequenced as part of a larger project, SeqApiPop, to characterize French honey bee populations. DNA extraction, library preparation and sequencing of these samples were performed as described in Wragg et al. (2016).
Mapping, Variant Calling, and Quality Control
Sequencing reads were mapped to the reference genome (Amel4.5) using bwa mem 0.7.10 (Li and Durbin, 2009) and duplicates marked using PICARD 1.80 (http://picard.sourceforge.net). Reads around indels were realigned with RealignerTargetCreator and IndelRealigner from the Genome Analysis Toolkit 3.3.0 (GATK) (McKenna et al., 2010; Van der Auwera et al., 2013). The base quality scores were recalibrated with GATK's BaseRecalibrator, using SNPs called with GATK's UnifiedGenotyper as covariates creating binary alignment/map (BAM) files for each sample (N = 151).
SNP calling was performed using a two-step process as described in Wragg et al. (2016). In brief, SNP variants were first identified in the Swiss bee sequence data (N = 120) applying three different variant calling tools: GATK's UnifiedGenotyper (Van der Auwera et al., 2013), SAMtools' mpileup 1.1 (Li et al., 2009) and PLATYPUS 0.8.1 (Rimmer et al., 2014). After variant calling SNPs were filtered according to base quality (BQ) score ≥ 20 and mapping quality (MQ) ≥ 30. Calls from UnifiedGenotyper were additionally filtered for maximum number of alternate alleles = 2, genotype quality (GQ) ≥ 30, quality by depth (QD) ≥ 2, and Fisher strand (FS) ≤ 60. After quality control, identified variants were combined using BAYSIC (Cantarel et al., 2014) which performs Bayesian latent class analysis to estimate false positive and false negative error rates. The resulting single-sample variant calling files (VCFs) were then merged together using bcftools (Li, 2011) and filtered on depth of coverage (DP) to generate a set of master sites mapped to chromosomes 1 to 16 with 9 ≤ DP ≤ 3x mean DP. All individuals were re-genotyped with UnifiedGenotyper (BQ ≥ 20) at these master sites resulting in a multi-sample VCF comprising all samples.
Finally, variants were filtered using PLINK 1.9 (Chang et al., 2015) to exclude SNPs with minor allele frequency (MAF) <0.01 and genotyping call rate <0.9, resulting in 3.375 M SNPs for subsequent analysis. Missing genotypes were imputed with ShapeIT v2 (O'connell et al., 2014). DP was calculated with GATK's DepthOfCoverage tool, mapping and alignment metrics with PICARD's CollectAlignmentSummaryMetrics and SAMtools' flagstat, and variant calling statistics with VCFtools vcf-stats (Danecek et al., 2011).
Population Structure Analyses
Principal Component Analysis (PCA)
We performed principal component analysis (PCA) to assess the population structure of the sampled honey bees. PCA is a classical non-parametric linear reduction technique used to reveal population structure by arranging all principal components (PCs) according to the explained variance without resorting to a model (Menozzi et al., 1978; Price et al., 2006; Gao and Starmer, 2008). Here, we applied PCA on a genetic relationship matrix (n × n) with pairwise identities by state (IBS) between all individuals (N = 151) as provided by PLINK 1.9 (Chang et al., 2015). To infer the number of significant PCs and to determine significant differences between subpopulations, we used Horn's parallel analysis (PA; Horn, 1965; Dinno, 2009) as implemented in the R package paran (Dinno, 2012). After initial assessment of the population structure with PCA, we further explored the hierarchical structure using a network-based clustering approach and investigated individual admixture proportions using a model-based approach.
Hierarchical Population Structure
To determine the uppermost hierarchical population structure, we applied an unsupervised network-based clustering algorithm called super paramagnetic clustering (SPC, Blatt et al., 1996; Tetko et al., 2005). The input to SPC is a dissimilarity matrix D (n × n) with pairwise genetic distances between all individuals calculated using allele sharing distance (ASD; one minus IBS). Given D, each individual gets associated with a Pott spin variable (q). Once q have been assigned, the clustering is performed along a range of temperature (ΔT) limiting the interactions to a given number of k nearest neighbors (k-NN). We applied the algorithm using the following settings: k-NN = 15, q = 20 and (ΔT) = 0.01. For the visualization of hierarchical population structure and cluster solution, we used the R software package phytools (Revell, 2012).
Admixture
To estimate the admixture proportion of each individual, we performed model-based cluster analyses as implemented in the program ADMIXTURE (Alexander et al., 2009). The program was run unsupervised with 10,000 iterations and a pre-specified number of clusters K (K = 1–6). Convergence between independent runs at the same K was monitored by comparing the resulting log-likelihood scores (LLS) following 10,000 iterations, and was inferred from stabilized LLS with less than 1 LL unit of variation between runs. Cross validation (CV) error estimation for each cluster was performed with ADMIXTURE (Alexander et al., 2009) and used to determine the optimal number of K clusters.
To investigate the differences in introgression from introduced honey bees into the native A. m. mellifera gene pool, we compared admixture proportions from individuals originating from different sampling locations. For that reason, we calculated median and interquartile range (IQR) of the admixture proportions calculated at K = 2 from the samples in each of the conservation areas (CDI, CGL, CME, CVM, and CSA), as well as for the A. m. mellifera samples originating from unprotected regions in Switzerland (MEL). To evaluate the differences among these groups, a Kruskal-Wallis (Kruskal and Wallis, 1952) and post-hoc pairwise comparisons using Dunn's test (Dunn, 1964) with Holm correction (Holm, 1979) were conducted.
High-Resolution Population Networks
Model-based admixture analyses and network-based clustering were combined into high-resolution population networks in order to illustrate individual relationships and fine-scale population structure. We investigated high-resolution population networks using the open graph visualization platform Cytoscape (Shannon et al., 2003) and the plugin MultiColoredNodes (Warsow et al., 2010). In the final network visualization, the uppermost hierarchical population structure as inferred from SPC is presented in terms of node size, number of edges between nodes and width of edges. Here, we have associated the node size of each honey bee with the number of k-nearest neighbors (k-NN; number of edges), while the color of each honey bee represents the pre-determined level of admixture at K = 2 and K = 4, respectively. In order to express the strength of relationship between two individuals, the line width of an edge is proportional to the genetic relatedness between them (IBS). This approach is described in Neuditschko et al. (2012) and a recent implementation of this workflow is now available as R package (Steinig et al., 2015) posted at https://github.com/esteinig/netview.
In network theory, so-called communities, which are more densely and strongly connected within a group than outside a group, can be detected. Based on the high-resolution population network at K = 4 (see Result section), we selected a subset (communities) of core bees (gray dashed circles in Figure 4B) for each subpopulation which were clustering together and showed no or low levels of admixture (<0.1; except for Buckfast which was a more heterogeneous group). This subset consisted of a total of 95 core bees representing the four sampled subpopulations; 13 Buckfast bees, 26 A. m. carnica, 39 A. m. mellifera from Switzerland and 17 A. m. mellifera from France. These were used in subsequent population genetic analyses. The 56 remaining bees, which clustered outside the four identified communities, were designated to the subsample of test bees (N = 56) (Supplementary Table 1).
Population Differentiation and Genetic Diversity
To investigate average genome-wide divergence between the above defined subpopulations, we estimated mean pairwise population differentiation FST (Weir and Cockerham, 1984) in window sizes of 5 kb and 1 kb overlap using VCFtools (Danecek et al., 2011). We further estimated FST between native honey bees (A. m. mellifera from Switzerland and France) from the evolutionary M-lineage and introduced honey bees (A. m. carnica and Buckfast) with mainly C-lineage ancestry. In addition, we estimated nucleotide diversity π in each subpopulation as defined by the average pairwise sequence difference per nucleotide site (Nei, 1982). We used VCFtools (Danecek et al., 2011) to calculate π in window sizes of 5 kb with 1 kb increment and estimated confidence intervals of the mean. It was not possible to calculate π for core bees originating from each of the Swiss conservation areas separately due to the limited sample size (<5) in CME, CDI, and CVM, thus π could only be calculated for CGL (N = 15).
Informative SNP Panels
SNP Thinning and Selection of Informative SNP Panels
The systemic homozygosity in haploid sequence data results in strong linkage disequilibrium (LD) between SNPs (see Supplementary Figure 1), and consequently a large number of uninformative or “redundant” SNPs (Weale et al., 2003; Nicolas et al., 2006; Paschou et al., 2008). To reduce SNP density and redundancy without adversely affecting LD-associated fine-structure, the dataset was randomly down-sampled to 10,000 SNPs using PLINK 1.9 (Chang et al., 2015). To ensure that there was no loss of information after the stringent thinning step, we computed and compared ASD-based distance matrices and PCA results between the entire (3.375 M SNPs) and thinned (10 K SNPs) datasets. First, to verify whether the genetic relationships between individuals are reflected in the thinned dataset, we tested the concordance between the ASD distance matrix with all bees (N = 151) inferred from the whole-genome (3.375 M SNPs) and the pairwise distances inferred from the thinned (10 K SNPs) dataset using Mantel R (Mantel, 1967). Mantel R is a permutation test to estimate the correlation between two matrices and was calculated using the package vegan in R (Oksanen et al., 2016). Second, to visualize whether the thinned dataset is able to capture the population structure revealed by all SNPs, we computed PCA for each dataset and plotted the core bees (N = 95) on the first and second PCs.
To distinguish introduced from native honey bees for conservation or breeding purposes, ancestry informative SNPs for subspecies discrimination were identified. Out of the thinned dataset, we generated panels with different number of SNPs (1000, 500, 100, and 50 SNPs) employing three different selection methods:
(1) FST (Weir and Cockerham, 1984) between native and introduced honey bees. FST per site was calculated between core bees of A. m. mellifera from Switzerland and France (N = 56) and core bees of A. m. carnica and Buckfast bees (N = 39) using VCFtools (Danecek et al., 2011). Four SNP panels with the highest FST per SNP were defined as: FST-1000, FST-500, FST-100 and FST-50. In addition, we selected a fifth panel correcting for any remaining redundancy in the SNP informativeness by computing a sorted QR-decomposition to effectively remove correlated markers (Paschou et al., 2008). The input for QR-decomposition is a genotype matrix with dimensions n × m (samples × SNPs), where each SNP is encoded with either −1 for homozygous reference or 1 for homozygous alternate allele. Applying this approach with a custom script in GNU octave (Eaton et al., 2014), we extracted the most uncorrelated SNPs out of the FST-100 panel resulting in the fifth SNP panel: UncorrFST-50.
(2) PCA-derived, whereby a subset PCA-correlated SNPs were selected to reproduce the structure found by PCA without use of prior ancestry information (Paschou et al., 2007). This approach measures the correlation between a SNP and the significant principal components giving each SNP a PCA-score (Paschou et al., 2007). The input is a genotype matrix (samples × SNPs) encoded as above (1,−1) and PCA-scores were calculated using a custom script in R. Finally, we defined four informative SNP panels with the highest PCA-scores: PCA-1000, PCA-500, PCA-100, and PCA-50. Additionally, we generated a fifth panel applying the same approach as for the UncorrFST-50 (see above). We thus selected the 50 most uncorrelated out of the PCA-100 SNPs resulting in the panel: UncorrPCA-50.
(3) Randomly chosen SNPs, selected using the sample-function in R to generate panels with 1000, 500, 100, and 50 SNPs, respectively. Since the variation when using randomly selected SNPs is expected to be high, we run the sample-function five times each to produce a total of 20 SNP panels: 5x Random-1000, 5x Random-500, 5x Random-100, and 5x Random-50.
After generating the SNP panels, we tested their accuracy in estimating admixture proportions and genetic relationships between individuals by reference the earlier results from the complete SNP dataset. The random panel replicates were tested independently and the averaged statistic and variation are reported.
Performance of Informative SNP Panels
To compare the performance of the SNP panels on the accuracy to estimate admixture proportions, we ran ADMIXTURE (Alexander et al., 2009) at K = 2 using all bees (N = 151) and each of the selected SNP panels. The admixture proportions of the test bees (N = 56), which were not used for selection of the ancestry informative SNPs, were retrieved to test the accuracy of the SNP panels to predict admixture proportions. We therefore estimated the correlation coefficient r (Pearson, 1895) between the admixture proportions calculated based on all 3.375 M SNPs and the admixture proportions estimated with each of the selected SNP panels. Moreover, mean standard error (SE) of the inferred admixture proportions of all bees was calculated for each of the SNP panel, in order to examine whether lower numbers of SNPs increase SE.
To investigate the precision of the selected panels to predict the genetic relatedness between individuals, we computed pairwise distances (ASD) between all samples (N = 151) with each of the selected SNP panels. To estimate the concordance between the resulting distance matrices and the ASD matrix inferred from the entire data set (3.375 M SNPs), we performed pairwise Mantel tests (Mantel, 1967).
Finally, in order to visualize the population differentiation, we also computed PCA with the best performing panel and plotted the first two PCs. All statistics, if not otherwise stated, were calculated and plotted in R (R Core Team, 2016).
Results
Mapping and Variant Calling
On average 19,549,894 paired-end reads were generated per bee of which 96.3% mapped in pairs to the reference genome Amel4.5 (Elsik et al., 2014). Approximately 2.2% of the mapped reads were marked as duplicates that aligned with the identical start and end positions onto the reference genome. Sequencing depth per sample ranged from 3.3 to 20.7X with mean 9.9X resulting in 97.2% of the genome being covered on average. Individual mapping and alignment statistics are presented in Supplementary Table 2.
Individual variant calling statistics for each drone genome in the Swiss dataset, comparing the three different applied variant calling tools, can be found in Supplementary Table 3. Once filtered on depth of coverage, the master variant file identified by combining single sample VCF files resulted in 4.986 M raw SNPs, which were used to genotype both the Swiss and French datasets. Post quality control filtering, 3,374,686 high-quality genome-wide SNPs were retained for analysis.
Population Structure Analyses
Principal Component Analysis (PCA)
The result of PCA shows that the first PC clearly separates the samples into two major clusters according to the two evolutionary lineages M and C, while further substructures within these lineages are revealed on the second PC (Supplementary Figure 2). The general diversity pattern is thus characterized by four populations: A. m. carnica and the diverse Buckfast group within the C-lineage cluster and two subpopulations of A. m. mellifera within the M-lineage cluster originating from Switzerland and France, respectively. Horn's PA resulted in the retention of one significant PC accounting for 95.1% of the variance. This demonstrates a significant separation of the samples according to the evolutionary lineages, while the substructures disclosed on the second PC are not significant.
Hierarchical Population Structure
The network-based cluster-tree recapitulates the findings of PCA by dividing the three honey bee subspecies (A. m. mellifera, A. m. carnica, and Buckfast) into two distinct population clusters, while two honey bees were assigned into an additional single cluster (Figure 2A). Moving up the cluster tree, A. m. carnica and Buckfast were assigned into respective population clusters and honey bees with mixed genetic origin were separated from the main A. m. mellifera population. At the additional levels of the tree, A. m. mellifera was further sub-structured, whereas the identified sub-structures do not reflect the different geographic origin of samples. On the top level of the tree, especially A. m. mellifera sampled from the four Swiss conservation areas were clustered together along with two samples from France. The final topology of the network-based cluster tree shows that honey bees are characterized by a high level of hierarchical structure.
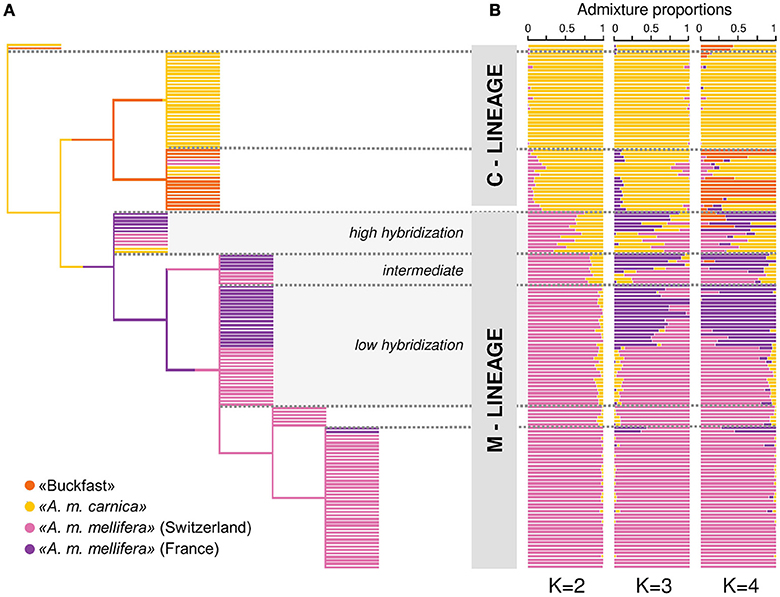
Figure 2. Hierarchical population structure and admixture. (A) Genetic relationships between the 151 drones illustrated by the network-based hierarchical cluster tree. Samples are colored according to their putative subspecies assignment based on the labeling information of beekeepers: ≪A. m. mellifera≫ (N = 72) from Switzerland, ≪A. m. mellifera≫ (N = 31) from Savoie (France), ≪A. m. carnica≫ (N = 34) and ≪Buckfast≫ bees (N = 14). Honey bees which clustered together with members of other subpopulations indicate labeling errors of beekeepers or admixed individuals. (B) Membership proportion calculated with ADMIXTURE for K = 2 to 4 hypothetical ancestral populations. The program uses a model-based algorithm to infer ancestry. Each individual is represented by a horizontal bar and samples are sorted according to the hierarchical clustering tree. Each color represents one of K clusters and individuals are colored according to the proportion of the genome that was derived from each cluster. Optimal number of clusters as inferred by the cross-validation error estimation is K = 2.
Admixture
Following the CV error estimation (Supplementary Figure 3), ADMIXTURE (Alexander et al., 2009) suggested an optimal number of clusters K = 2. Given K = 2, individuals are separated into two major clusters which correspond to the two distant evolutionary lineages M and C (Figure 2B). The samples, which are sorted according to the hierarchical clustering tree, appear arranged in groups depending on their degree of admixture (Figure 2B). Hence, the admixture levels at K = 2 identified by ADMIXTURE (Alexander et al., 2009), which uses a model-based approach, reflect the hierarchical structure found by the network-based clustering tree (Figure 2A). At increasing values of K, further substructures become evident which are in concordance with the sampled subpopulations or their geographic origin. At K = 3, the M-lineage cluster is separated into A. m. mellifera bees with Swiss and French ancestry, respectively. Increasing K to 4, subdivides the C-lineage cluster into honey bees with A. m. carnica ancestry and Buckfast ancestry.
If samples are ordered according to sampling locations, admixed individuals are found in all of the five sampled conservation areas (Supplementary Figure 4). The lowest median admixture levels were found in the CGL conservatory (Mdn = 0.000, IQR = 0.000–0.007), followed by CME (Mdn = 0.059, IQR = 0.013–0.077), CVM (Mdn = 0.071, IQR = 0.032–0.314) and the French conservatory CSA (Mdn = 0.072, IQR = 0.034–0.178) (Figure 3). The highest median admixture levels were found in CDI (Mdn = 0.073, IQR = 0.063–0.083). Excepting for a few highly admixed samples, A. m. mellifera originating from unprotected areas were generally little admixed (Mdn = 0.030, IQR = 0.014–0.091). The mean ranks of admixture proportions among these six sampling locations were significantly different (Kruskal-Wallis: H = 22.95, df = 5. P = 0.0003). Follow-up tests indicated a significant difference between CGL and CVM (Dunn's z = −3.59, p = 0.002), CGL and CSA (Dunn's z = −4.41, p < 0.001), and CGL and the samples from unprotected areas (MEL) (Dunn's z = −3.02, p = 0.017) (Figure 3).
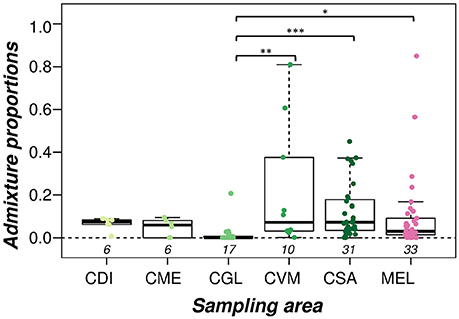
Figure 3. Admixture proportions of A. m. mellifera sampled outside (MEL) and within each of the conservation areas (CDI, CGL, CME, CVM, and CSA). The box denotes the upper and lower quartiles, and the median is represented by a solid black line within the box. There is a significant difference between the mean ranks of the admixture proportions among the different sampling areas (Kruskal-Wallis: H = 22.95, df = 5. P = 0.0003). The conservation area CGL has significantly lower admixture levels than the CVM and CSA conservatories, as well as compared to A. m. mellifera sampled outside conservation areas (MEL) (pairwise multiple comparisons using Dunn's test and Holm correction, significance levels marked as: p < 0.05*, p > 0.01**, p > 0.001***). Numbers below boxplots designate sample size in each group.
High-Resolution Population Networks
The high resolution population networks illustrate individual relationships and fine-scale population structure (Figure 4). The network at optimal K = 2 reveals a gradual arrangement of individuals according to their degree of M- and C-lineage ancestry, respectively (Figure 4A). Yet, substructuring is clearly evident when nodes are colored according to admixture proportions at K = 4 (Figure 4B). Here, the Buckfast cluster separates from the A. m. carnica cluster and, in addition, within the M-lineage cluster there is substructuring of the A. m. mellifera bees originating from France (Figure 4B).
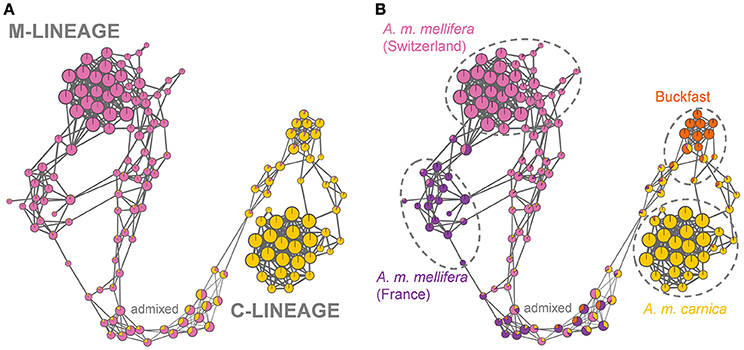
Figure 4. High-resolution population networks with admixture proportions at K = 2 (A) and K = 4 (B). Each individual is represented by a node and colored according to its membership proportion inferred by ADMIXTURE. Node size reflects centrality of the individual and is proportional to the number of nearest neighbors (k-NN). Line width of edges (= connecting lines) is proportional to the genetic relatedness between individuals (IBS). (A) At K = 2 the samples are separated into C- and M-lineage ancestry with admixed individuals placed in-between depending on the degree of admixture. (B) At K = 4, the honey bees are clustered into four substructures (A. m. mellifera from Switzerland, A. m. mellifera from France, Buckfast bees and A. m. carnica), while highly admixed individuals fall outside of the population clusters (test bees). The samples within dashed circles are defined as the subpopulations of the core bees.
The densely packed A. m. mellifera cluster from Switzerland, as well as the A. m. carnica cluster, reveal a high genetic relatedness of individuals within these populations. This is also reflected in the greater edge widths (= pairwise IBS) and node sizes (= number of nearest neighbors) within these clusters. Whereas, highly admixed individuals are clustered together based on their degree of admixture and not because of higher genetic relationship, as shown by the thinner edges between nodes. The high resolution visualization allows further to identify outliers, one in the Swiss A. m. mellifera cluster and two in the French A. m. mellifera cluster, which are connected to one other individual only. These honey bees are not closely related to the rest of the cluster and represent rare genetic variation.
Population Differentiation and Genetic Diversity
Overall, average genome-wide population differentiation between each of the core bee subpopulations (as defined in Material and Methods; Supplementary Table 1) is characterized by high divergence between and low divergence within the evolutionary lineages M and C. The lowest level of population differentiation was found between the Swiss and French A. m. mellifera (FST = 0.023), while the highest difference was observed between the Swiss A. m. mellifera and the A. m. carnica (FST = 0.359) (Table 1). Introduced honey bees (A. m. carnica and Buckfast, mainly from the C-lineage) are strongly differentiated from the native A. m. mellifera populations (M-lineage) (FST = 0.317).
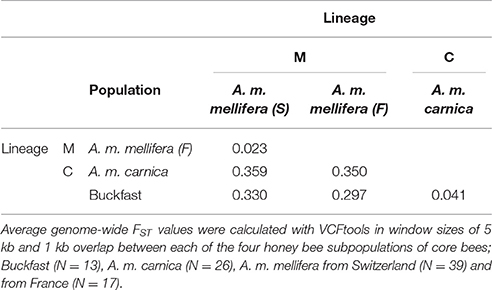
Table 1. Mean pairwise population differentiation (FST) based on 3.375 M SNPs.
Genetic diversity was highest in the Buckfast bee population [π = 0.00392, 95% CI (0.00391, 0.00393)], followed by the A. m. mellifera populations from the French conservatory [π = 0.00354, 95% CI (0.00353, 0.00355)] and Switzerland [π = 0.00331, 95% CI (0.00330, 0.00332)]. The lowest level of genetic diversity was found in the A. m. carnica population [π = 0.00309, 95% CI (0.00308, 0.00310)]. Nucleotide diversity of the Swiss conservatory CGL [π = 0.00319, 95% CI (0.00318, 0.00320)] was significantly lower compared to the French conservation area CSA (Welch's t = −53.6, df = 398900, p < 0.001).
Informative SNP Panels
SNP Thinning
The pairwise genetic distance matrices calculated using the total (3.375 M SNPs) and the thinned (10 K SNPs) datasets are highly concordant [Mantel R = 0.999, 95% CI (0.998, 0.999), p < 0.001]. Moreover, when visualized the PCA scatter plot generated with the thinned dataset (10 K SNPs) reflects the same pattern found using all SNPs, yet with a less clear distinction between Swiss and French A. m. mellifera (Figures 5A,B). Hence, the population structure and genetic relationships observed using all SNPs is conserved well with the 10 K SNPs dataset, with only minimal loss of information despite the stringent thinning step applied and could thus be used to select ancestry informative SNPs.
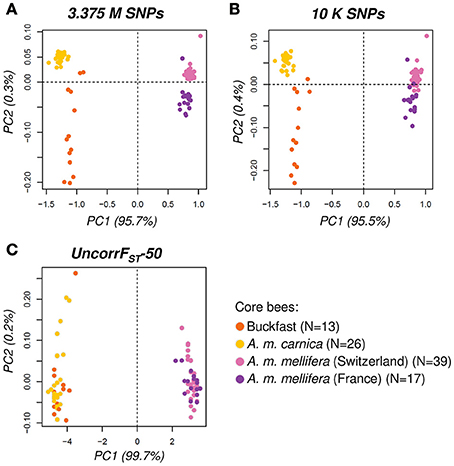
Figure 5. Principal Component Analysis (PCA) with core bees (N = 95). PCA-scatter plots of first and second principal component performed with (A) all SNPs (3.375 M), (B) thinned SNPs (10 K) and (C) the UncorrFST-50 SNP panel. The variation explained by each PC is indicated in parenthesis next to the axis label. The general diversity pattern found by all SNPs is also reflected with the thinned dataset. The UncorrFST-50 SNP panel captured well the high divergence between introduced (mainly C-lineage ancestry) and native honey bees (M-lineage) as represented by PC1.
Performance of Informative SNP Panels
Irrespective of the selection method, there was a strong positive correlation between the admixture proportions calculated using all SNPs (3.375 M) and the admixture proportions calculated with each of the reduced SNP panels (Pearson's r > 0.90, p > 0.001 for all panels; Figure 6A). The correlation decreases with decreasing number of SNPs and there is no difference between the three tested selection methods (FST, PCA and Random) (Figure 6A; left panel). However, there is a significant difference when the UncorrFST-50 panel, which is additionally corrected for any remaining redundancy in SNP informativeness, is compared to the other SNP panels with only 50 SNPs. The UncorrFST-50 panel significantly better predicts admixture proportions than the Uncorr50-PCA panel [Fisher's z = 2.96, p = 0.003; 95% CI for the difference between correlations (0.02–0.10)], and better than 50 randomly selected SNPs [Fisher's z = 2.76, p = 0.006; 95% CI for the difference between correlations (0.02–0.09)]. Moreover, the standard errors of the mean admixture proportions increase with decreasing number of SNPs and with 50 SNPs only, the UncorrFST-50 had significantly lower mean SE [x̄ = 0.043, 95% CI (0.046, 0.039)] than the other selection methods (Supplementary Table 5).
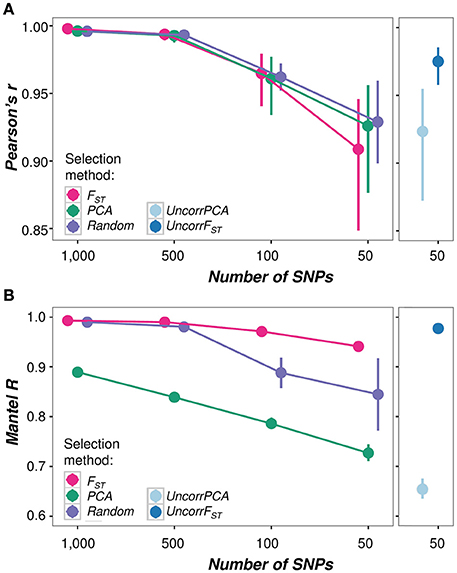
Figure 6. Performance comparisons of SNP panels in estimating (A) admixture proportions and (B) genetic relationships. (A) Correlation between admixture estimates at K = 2 calculated using all SNPs (3.375 M) and each of the SNP panels (1000, 500, 100, and 50 SNPs) with the different selection methods (FST, PCA, Random, UncorrFST, and UncorrPCA) calculated as Pearson's product-moment correlation coefficient r with the 95% confidence intervals. P-values for all pairwise comparisons: p < 0.001, df = 54. Correlations were calculated from admixture estimates of the test bees only (N = 56). Admixture estimates of all panels are highly correlated (>0.9) with admixture proportions calculated with the entire dataset (3.375 M SNPs) and there is no difference between the selection methods FST, PCA and Random. Yet, with only 50 SNPs the UncorrFST-50 panel significantly better predicts admixture than the other 50-SNP panels. (B) Concordance between pairwise genetic distance matrices computed using all SNPs (3.375 M) and each of the SNP panels (1000, 500, 100, and 50 SNPs) with the different selection methods (FST, PCA, Random, UncorrFST, and UncorrPCA). Mantel R with 95% CI was estimated on the distance matrices using all individuals (N = 151) with 999 permutations. P-values for all pairwise comparisons p < 0.001. PCA-selected SNP panels performed worst in estimating genetic relationships, while FST-selected panels were the most accurate, irrespective of SNP number.
SNP panels generated based on the PCA informativeness consistently performed poorest when assessing their accuracy for inferring genetic relationships between individuals, while SNP panels generated based on FST performed best, as indicated by the non-overlapping confidence intervals in Figure 6B. Considering only 50-SNPs, the UncorrFST-50 significantly better reflects the genetic relationships between individuals than the 50-SNP panels based on the other selection methods.
In conclusion, with only 50 SNPs the UncorrFST-50 panel clearly outperformed the other selection methods (SNP positions in Supplementary Table 4). Admixture proportions computed with the UncorrFST-50 panel were very highly correlated with admixture proportions using the whole-genome (3.375 M SNPs) dataset [Pearson's r = 0.975, 95% CI (0.958, 0.985), p < 0.001] while accounting for the lowest error [SE = 0.043, 95% CI (0.039, 0.046)]. Additionally, the genetic relationships inferred from the UncorrFST-50 panel were also highly correlated with all 3.375 M SNPs [Mantel R = 0.977, 95% CI (0.976, 0.980), p < 0.001]. The PCA scatter plot (Figure 5C) visually clearly highlights the ability of the UncorrFST-50 SNP panel to reveal the significant difference and to separate introduced from native honey bees, as shown by the first PC explaining 99.7% of the variance.
Discussion
Network-based clustering was used for the first time in honey bees enabling effective identification of fine-scale population structure and distinct separation of introduced and native honey bees corresponding to highly divergent lineages. Moreover, substructures within A. m. mellifera were identified according to origin (Switzerland or France). Finally, despite current ongoing conservation efforts, admixed individuals were still found in all conservation areas thereby calling for improved management practices. Our results show that 50 highly informative SNPs could be a cost-effective tool to enhance conservation efforts as they are sufficient to accurately detect C-lineage introgression in the sampled native honey bee populations.
Population Structure
To analyze population structure, we employed a set of different cluster approaches which all revealed a significant and clear separation between the well-known evolutionary M- and C-lineage (Ruttner, 1988; Garnery et al., 1992). But, as indicated by the final topology of the network-based clustering tree (Figure 2A), honey bees are further characterized by a high level of hierarchical structure. By integrating the model-based admixture results in the final network visualization, we can thus see that the admixture proportions are related to the genetic relationship between individuals. It is well known, but not often discussed, that model-based approaches, such as those implemented in ADMIXTURE, are highly dependent on the reference sampling populations and rely on prior assumptions (Pritchard et al., 2000; Greenbaum et al., 2016). For instance, highly related individuals can form an artificial substructure showing no or very little admixture, and as a consequence more distantly related individuals show increased levels of admixture (Pritchard et al., 2000). This emphasizes the importance to be cautious when interpreting admixture levels and when possible to choose diverse and unrelated individuals. In our case, due to the sampling bias of many more Swiss than French A. m. mellifera samples, admixture levels in the latter could thus be slightly overestimated. Ideally, to overcome the sampling bias, an optimized approach would be to combine network clustering with model-based analyses and classical PCA, as these complement each other and thus give a more robust and detailed picture (Neuditschko et al., 2012; Greenbaum et al., 2016). This is the advantage of our combined network visualization; it illustrates both the genetic relationships between individuals and admixture levels, which is crucial for the interpretation of the observed population structures (Neuditschko et al., 2012). Therefore, the network clustering is highly suitable to identify community structures corresponding to the four subpopulations in this dataset (A. m. carnica, Buckfast, A. m. mellifera from Switzerland and France). Furthermore, admixed individuals can be easily spotted.
The substructure between Swiss and French A. m. mellifera is surprising, given the large mating distances of honey bee drones from their colony of origin (Neumann et al., 1999c). Here, we found already some population differentiation on a short distance of ~40 km between the conservatory in the French Alps and Swiss A. m. mellifera. The reasons for this finding can be manifold including genetic drift, differential beekeeping practices or even local adaptations. Isolation-by-distance could be explained with the Alps acting as natural barriers against gene flow between North (Switzerland) and South (France). However, within Switzerland no such effect could be detected even though massive mountain ranges separate native bees in different valleys. As honey bee queens are bought and sold throughout the country one could expect less or no substructures within Switzerland due to human-mediated gene-flow. Alternatively, there might be locally adapted ecotypes within A. m. mellifera. Given the large native range of A. m. mellifera (from France over Central Europe, the British Isles and Southern Scandinavia to the Ural Mountains, Ruttner, 1988), it does not seem surprising that there are substructures or ecotypes within this subspecies. For instance, ecotypes of A. m. mellifera with particular brood cycles adapted to the local flora have already been described in France (Louveaux et al., 1966; Strange et al., 2007, 2008). More importantly, with regard to honey bee health, locally adapted honey bee populations may have evolved their own specific resistance mechanisms matching the prevailing pathosphere they are located in (genotype-environment interactions) (Meixner et al., 2015). In order to protect and promote native honey bees it is therefore essential to identify substructures and locally adapted ecotypes.
Genetic Diversity
All identified populations, including both native French and Swiss honey bees exhibit high genetic variation, which is comparable to other tested populations from C- and M-lineage or mixed background, respectively (Wallberg et al., 2014; Wragg et al., 2016). This genetic diversity is important to preserve as it harbors the adaptive potential for future needs (Frankham et al., 2002) and enhances productivity and fitness (Mattila and Seeley, 2007). On the other hand, genetic admixture through the importation and hybridization with distant subspecies can disrupt the locally adapted genetic variation (De La Rúa et al., 2009). The lowest genetic diversity was found in the A. m. carnica population, which was introduced into Switzerland in the 1960's, becoming very popular for apiculture and as a consequence was increasingly managed. The higher artificial selection pressure on this subspecies could therefore explain the lower genetic diversity. Similarly, populations of the C-lineage from other published studies (e.g., Wallberg et al., 2014; Wragg et al., 2016) exhibited lower genetic diversity and were sampled from selective breeding populations. An alternative explanation, however, could be a lower effective population size through a founder effect when introducing A. m. carnica to Switzerland in the first place. The highest genetic diversity was found in the hybrid Buckfast, which is in line with previous work that showed that high genetic diversity can be promoted through admixture by human management in mixed domestic bee populations (Harpur et al., 2012; Wallberg et al., 2014).
Admixture in the Conservation Areas
Despite the high genetic diversity found in native populations, we also identified some highly admixed individuals in the conservation areas, which is a concern and indicates that the management practices may need some adjustment. A previous analysis of 12 microsatellites in the Swiss A. m. mellifera breeding population sampled in 2003 showed similar levels of admixture (Soland-Reckeweg et al., 2009). More recently, in 2013, an analysis of 1381 SNPs in A. m. mellifera populations sampled throughout Europe also found admixed individuals in Switzerland (Pinto et al., 2014). While it is not possible to directly compare these studies because of the different sampling strategies and methodologies employed, all studies including the present one show that despite ongoing conservation efforts in Switzerland considerable C-lineage introgression in the A. m. mellifera population remains. Therefore, protection of the native population should be reinforced.
Yet, there are some differences in admixture levels between the five sampled conservation areas, which could be attributed to varying management practices. Alternatively, such differences might be linked to the time since the establishment of the conservatories. The Glarus conservatory (CGL) is the oldest (established in 1977) and largest conservation area in Switzerland, and shows the lowest level of C-lineage introgression. On the other hand, the Val Mustair conservatory (CVM), a remote region in southeastern Switzerland with a long native bee keeping tradition, but officially established in 2006 only, suffers from increased admixture. After inquiring with the management of this particular conservatory the increased level of admixture is the result of an A. m. carnica-beekeeper, who recently moved to the area. Thus, our data demonstrates that the genetic consequences are immediately measurable. Moreover, there is a need for an increased legal protection of conservation areas, as evidenced by the drastic effects of this single migratory beekeeper on conservation efforts. The French conservatory in Savoie (CSA) also displays admixed individuals. In this breeding program identification has been mainly based on morphometrics, which can have less resolution than genetic markers (Francis et al., 2014). In addition, France has a long history of foreign queen importation with many large-scale commercial apiarists keeping C-lineage bees (Franck et al., 1998; Garnery et al., 1998; Wragg et al., 2016). This increases the chance of introgression in the native gene pool.
Surprisingly, we found little admixture in native bees sampled from outside conservation areas. Our sampling scheme did not include randomly sampled bees from all of Switzerland, but depended on the willingness of beekeepers to participate. Thus, we would expect that there might be different levels of admixture under a totally random and unbiased sampling scheme. Yet, our results indicate that the keeping of pure native bees even outside a protected area is possible. To do so, motivated beekeepers involved in the maintenance and conservation of A. m. mellifera bring their virgins queens to controlled mating stations or buy queens from certified breeders. Our results suggest that this approach seems successful in Switzerland.
In contrast, maintaining freely-mating populations with minimal risk of introgression will require considerable monitoring efforts given the relatively small size of Swiss conservation areas. Consequently, in the longer term there is a need for the implementation of an enhanced international conservation strategy to preserve the native subspecies A. m. mellifera in apiculture. To this end, it is important to consistently and repeatedly test all colonies in the conservation areas for C-lineage introgression because of the natural movement of honey bees. Traditionally, morphometric analyses and more recently, microsatellite markers have been employed to detect and replace hybrid colonies (Soland-Reckeweg et al., 2009). An even more accurate tool would be a set of diagnostic SNPs to control mating stations and conservation areas as shown in this study (Hauser et al., 2011; Francis et al., 2014).
Informative SNP Panels
The high differentiation between introduced bees (A. m. carnica and Buckfast) belonging mainly to the evolutionary C-lineage and the native A. m. mellifera from the M-lineage, allowed to straightforwardly identify ancestry informative or even fixed SNPs. This high differentiation between the M- and C-lineages is also the reason why even randomly selected SNPs performed relatively well compared to other selection methods. Yet, the results clearly show that as few as 50 most informative SNPs are sufficient to distinguish native from introduced honey bees. The UncorrFST-50 panel outperformed the other 50-SNP panels in both the ability to predict admixture as well as genetic relationships, thereby suggesting their potential for a successful application in sustainable bee breeding programs. Such low density SNP panels have been developed successfully for breeding and breed assignment for a number of different livestock species (Boichard et al., 2012; Wellmann et al., 2013; Henshall et al., 2014). For honey bees, Muñoz et al. (2015) have previously generated sets of ancestry informative markers (AIMs) based on different selection methods to infer admixture between A. m. mellifera and C-lineage (A. m. carnica and A. m. ligustica). However, due to the hybrid origin of Buckfast bees, it might pose more difficulties to detect admixture with Buckfast than with pure C-lineage bees. Moreover, the full dataset of Muñoz et al. (2015) consisted of 1183 pre-selected SNPs from a previous study, while here we selected the most informative SNPs from whole-genome sequence information.
The application of only 50 SNPs might seem quite low for geneticists working with other livestock animals. However, given the fact that the beekeeping industry in Switzerland, and in most parts of Europe is based on leisure apiculturists (Chauzat et al., 2013), there is a general need for an economic approach to foster participation in conservation efforts. However, there is a trade-off between resolution and economics which poses a minor risk of failing to detect very low levels of admixture. A brief inquiry on current genotyping costs (August 2016) revealed the price per SNP as little as 0.50 €, which is expected to decrease even further thereby enabling the cost-effective testing of thousands of bees for a continental conservation strategy across Europe. Due to the low number of SNPs required for admixture analyses, it would also be possible to enhance stakeholder acceptance by including additional SNPs linked to traits of commercial interest, as is already implemented in custom SNP panels for other livestock species (Schwenger et al., 1993; Pannier et al., 2010). For honey bees, one such example could be to incorporate SNPs linked to resistance against Varroa destructor (Haddad et al., 2016; Spötter et al., 2016), given that this ectoparasitic mite is a significant contributor to global honey bee colony losses (Guzmán-Novoa et al., 2010; Dainat et al., 2012).
Conclusion
In this study, we demonstrated that the combination of model-based and network-based clustering allows us to identify high-resolution population structures between subspecies, which can be especially useful to identify locally adapted honey bee populations for conservation purposes and management decisions optimizing genetic diversity. For honey bees high genetic diversity, as we found in all identified populations, is particularly important for colony health (Tarpy, 2003) and entails the potential to adapt to new environmental conditions such as climate change or novel diseases.
As observed by this and other studies, hybrid colonies can be found throughout the native range of A. m. mellifera (Jensen et al., 2005a; Soland-Reckeweg et al., 2009; Pinto et al., 2014). It is clear that in such a diverse situation it is not possible to entirely prevent the natural movement of these hybrids and of foreign honey bees into conservatories. As a result, despite current ongoing conservation efforts, admixed individuals were still found in all conservation areas albeit with varying degrees of introgression thereby calling for improved management practices.
The use of ancestry informative SNPs for subspecies discrimination and estimation of admixture can thereby prove to be a very useful tool for enhancing conservation management efforts. We demonstrated that the selected ultra-low density SNP panel is accurate to estimate admixture and genetic relationships between the sampled honey bees. We therefore hope to contribute to the conservation efforts in order to ensure the valuable pollination services provided by our honey bees in the future.
Data Access
Swiss bee sequence data is deposited at the European Nucleotide Archive (ENA: http://www.ebi.ac.uk/ena) under study accession number: PRJEB16533. The sequence data of the bees from Savoie are available through the SeqApiPop programme on the Sequence Read Archive (SRA: https://www.ncbi.nlm.nih.gov/sra) with accession: SRP069814.
Author Contributions
Conceived and designed the study: MP, LG, PN, MN. Collected data: MP, LG. Analysed and interpret the data: MP, DW, AV, PN, MN. Wrote and approved final manuscript: MP, DW, LG, AV, PN, MN.
Funding
This work was funded by the Swiss Federal Office for Agriculture FOAG and the Fondation Sur-la-Croix, Basel. Data for the Savoie samples was provided by the SeqApiPop programme, funded by the FranceAgriMer grant 14-21-AT. The GeT platform, Toulouse (France), is a partner of the National Infrastructure France Génomique, thanks to support by the Commissariat aux Grands Invetissements (ANR-10-INBS-0009).
Conflict of Interest Statement
The authors declare that the research was conducted in the absence of any commercial or financial relationships that could be construed as a potential conflict of interest.
Acknowledgments
Sequencing was performed at the GeT PlaGe platform in Toulouse, France. Bioinformatic analyses were performed on UBELIX (http://www.id.unibe.ch/hpc), the HPC cluster at the University of Bern. Switzerland. We thank the beekeeping associations VSMB, SAR, SCIV, BIVS, VDRB, and CETA de Savoie and all beekeepers for providing the samples.
Supplementary Material
The Supplementary Material for this article can be found online at: https://www.frontiersin.org/article/10.3389/fevo.2016.00140/full#supplementary-material
References
Adams, J., Rothman, E. D., Kerr, W. E., and Paulino, Z. L. (1977). Estimation of the number of sex alleles and queen matings from diploid male frequencies in a population of Apis mellifera. Genetics 86, 583–596.
Alexander, D. H., Novembre, J., and Lange, K. (2009). Fast model-based estimation of ancestry in unrelated individuals. Genome Res. 19, 1655–1664. doi: 10.1101/gr.094052.109
Allendorf, F. W., Luikart, G., and Aitken, S. N. (2013). Conservation and the Genetics of Populations, 2nd Edn. Hoboken, NJ: Wiley-Blackwell.
Ausubel, F. (1988). “Current protocols in molecular biology,” in Updated Quarterly, eds M. Ausubel, R. Brent, R. E. Kingston, D. D. Moore, J. G. Seidman, J. A. Smith, and K. Struhl (New York, NY: Greene Pub. Associates; Wiley-Interscience), 1600. doi: 10.1002/mrd.1080010210
Bertrand, B., Alburaki, M., Legout, H., Moulin, S., Mougel, F., and Garnery, L. (2015). MtDNA COI-COII marker and drone congregation area: an efficient method to establish and monitor honeybee (Apis mellifera L.) conservation centres. Mol. Ecol. Resour. 15, 673–683. doi: 10.1111/1755-0998.12339
Blatt, M., Wiseman, S., and Domany, E. (1996). Superparamagnetic clustering of data. Phys. Rev. Lett. 76:3251. doi: 10.1103/PhysRevLett.76.3251
Boichard, D., Chung, H., Dassonneville, R., David, X., Eggen, A., Fritz, S., et al. (2012). Design of a bovine low-density SNP array optimized for imputation. PLoS ONE 7:e34130. doi: 10.1371/journal.pone.0034130
Böttcher, F. K. (1975). Beiträge zur Kenntnis des Paarungsfluges der Honigbiene. Apidologie 6, 233–281. doi: 10.1051/apido:19750304
Bouga, M., Alaux, C., Bienkowska, M., Büchler, R., Carreck, N. L., Cauia, E., et al. (2011). A review of methods for discrimination of honey bee populations as applied to European beekeeping. J. Apic. Res. 50, 51–84. doi: 10.3896/IBRA.1.50.1.06
Büchler, R., Costa, C., Hatjina, F., Andonov, S., Meixner, M. D., Le Conte, Y., et al. (2014). The influence of genetic origin and its interaction with environmental effects on the survival of Apis mellifera L. Colonies in Europe. J. Apic. Res. 53, 205–214. doi: 10.3896/IBRA.1.53.2.03
Cantarel, B. L., Weaver, D., McNeill, N., Zhang, J., Mackey, A. J., and Reese, J. (2014). BAYSIC: a bayesian method for combining sets of genome variants with improved specificity and sensitivity. BMC Bioinformatics 15:104. doi: 10.1186/1471-2105-15-104
Chang, C. C., Chow, C. C., Tellier, L. C. A. M., Vattikuti, S., Purcell, S. M., and Lee, J. J. (2015). Second-generation PLINK: rising to the challenge of larger and richer datasets. GigaScience 4:7. doi: 10.1186/s13742-015-0047-8
Chauzat, M. P., Cauquil, L., Roy, L., Franco, S., Hendrikx, P., and Ribière-Chabert, M. (2013). Demographics of the European apicultural industry. PLoS ONE 8:e79018. doi: 10.1371/journal.pone.0079018
Chen, C., Liu, Z., Pan, Q., Chen, X., Wang, H., Guo, H., et al. (2016). Genomic analyses reveal demographic history and temperate adaptation of the newly discovered honey bee subspecies Apis mellifera sinisxinyuan n. ssp. Mol. Biol. Evol. 33, 1337–1348. doi: 10.1093/molbev/msw017
Dainat, B., Evans, J. D., Chen, Y. P., Gauthier, L., and Neumann, P. (2012). Predictive markers of honey bee colony collapse. PLoS ONE 7:e32151. doi: 10.1371/journal.pone.0032151
Danecek, P., Auton, A., Abecasis, G., Albers, C. A., Banks, E., DePristo, M. A., et al. (2011). The variant call format and VCFtools. Bioinformatics 27, 2156–2158. doi: 10.1093/bioinformatics/btr330
De La Rúa, P., Jaffé, R., Dall'olio, R., Mu-oz, I., and Serrano, J. (2009). Biodiversity, conservation and current threats to European honeybees. Apidologie 40, 263–284. doi: 10.1051/apido/2009027
Dinno, A. (2009). Exploring the sensitivity of horn's parallel analysis to the distributional form of random data. Multivariate Behav. Res. 44, 362–388. doi: 10.1080/00273170902938969
Dunn, O. J. (1964). Multiple comparisons using rank sums. Technometrics 6, 241–252. doi: 10.1080/00401706.1964.10490181
Eaton, J. W., Bateman, D., Hauberg, S., and Wehbring, R. (2014). GNU Octave Version 3.8.1 Manual: A High-Level Interactive Language for Numerical Computations. CreateSpace Independent Publishing Platform. Available online at: http://www.gnu.org/software/octave/doc/interpreter/
Elsik, C. G., Worley, K. C., Bennett, A. K., Beye, M., Camara, F., Childers, C. P., et al. (2014). Finding the missing honey bee genes: lessons learned from a genome upgrade. BMC Genomics 15:86. doi: 10.1186/1471-2164-15-86
Enoch, M. A., Shen, P. H., Xu, K., Hodgkinson, C., and Goldman, D. (2006). Using ancestry-informative markers to define populations and detect population stratification. J. Psychopharmacol. 20, 19–26. doi: 10.1177/1359786806066041
Francis, R. M., Kryger, P., Meixner, M., Bouga, M., Ivanova, E., Andonov, S., et al. (2014). The genetic origin of honey bee colonies used in the coloss genotype-environment interactions experiment: a comparison of methods. J. Apic. Res. 53, 188–204. doi: 10.3896/IBRA.1.53.2.02
Franck, P., Garnery, L., Celebrano, G., Solignac, M., and Cornuet, J. M. (2000a). Hybrid origins of honeybees from Italy (Apis mellifera ligustica) and Sicily (A. m. sicula). Mol. Ecol. 9, 907–921. doi: 10.1046/j.1365-294x.2000.00945.x
Franck, P., Garnery, L., Solignac, M., and Cornuet, J. M. (1998). The origin of west European subspecies of honeybees (Apis mellifera): new insights from microsatellite and mitochondrial data. Evolution 52, 1119–1134. doi: 10.2307/2411242
Franck, P., Garnery, L., Solignac, M., and Cornuet, J. M. (2000b). Molecular confirmation of a fourth lineage in honeybees from the Near East. Apidologie 31, 167–180. doi: 10.1051/apido:2000114
Frankham, R., Ballou, J. D., and Briscoe, D. A. (2002). Introduction to Conservation Genetics. Cambridge: Cambridge University Press.
Gallai, N., Salles, J.-M., Settele, J., and Vaissière, B. E. (2009). Economic valuation of the vulnerability of world agriculture confronted with pollinator decline. Ecol. Econ. 68, 810–821. doi: 10.1016/j.ecolecon.2008.06.014
Gao, X., and Starmer, J. D. (2008). AWclust: point-and-click software for non-parametric population structure analysis. BMC Bioinformatics 9:77. doi: 10.1186/1471-2105-9-77
Gärke, C., Ytournel, F., Bed'hom, B., Gut, I., Lathrop, M., Weigend, S., et al. (2012). Comparison of SNPs and microsatellites for assessing the genetic structure of chicken populations. Anim. Genet. 43, 419–428. doi: 10.1111/j.1365-2052.2011.02284.x
Garnery, L., Cornuet, J. M., and Solignac, M. (1992). Evolutionary history of the honey bee Apis mellifera inferred from mitochondrial DNA analysis. Mol. Ecol. 1, 145–154. doi: 10.1111/j.1365-294X.1992.tb00170.x
Garnery, L., Franck, P., Baudry, E., Vautrin, D., Cornuet, J. M., and Solignac, M. (1998). Genetic diversity of the west European honey bee (Apis mellifera mellifera and A. m. iberica). II. Microsatellite loci. Genet. Sel. Evol. 30, S49–S74. doi: 10.1186/1297-9686-30-S1-S49
Greenbaum, G., Templeton, A. R., and Bar-David, S. (2016). Inference and analysis of population structure using genetic data and network theory. Genetics 202, 1299–1312. doi: 10.1534/genetics.115.182626
Guzmán-Novoa, E., Eccles, L., Calvete, Y., McGowan, J., Kelly, P. G., and Correa-Benítez, A. (2010). Varroa destructor is the main culprit for the death and reduced populations of overwintered honey bee (Apis mellifera) colonies in Ontario, Canada*. Apidologie 41, 443–450. doi: 10.1051/apido/2009076
Haddad, N., Mahmud Batainh, A., Suleiman Migdadi, O., Saini, D., Krishnamurthy, V., Parameswaran, S., et al. (2016). Next generation sequencing of Apis mellifera syriaca identifies genes for Varroa resistance and beneficial bee keeping traits. Insect Sci. 23, 579–590. doi: 10.1111/1744-7917.12205
Han, F., Wallberg, A., and Webster, M. T. (2012). From where did the Western honeybee (Apis mellifera) originate? Ecol. Evol. 2, 1949–1957. doi: 10.1002/ece3.312
Harpur, B. A., Kent, C. F., Molodtsova, D., Lebon, J. M., Alqarni, A. S., Owayss, A. A., et al. (2014). Population genomics of the honey bee reveals strong signatures of positive selection on worker traits. Proc. Natl. Acad. Sci. U.S.A. 111, 2614–2619. doi: 10.1073/pnas.1315506111
Harpur, B. A., Minaei, S., Kent, C. F., and Zayed, A. (2012). Management increases genetic diversity of honey bees via admixture. Mol. Ecol. 21, 4414–4421. doi: 10.1111/j.1365-294X.2012.05614.x
Hauser, L., Baird, M., Hilborn, R., Seeb, L. W., and Seeb, J. E. (2011). An empirical comparison of SNPs and microsatellites for parentage and kinship assignment in a wild sockeye salmon (Oncorhynchus nerka) population. Mol. Ecol. Resour. 11, 150–161. doi: 10.1111/j.1755-0998.2010.02961.x
Henshall, J. M., Dierens, L., and Sellars, M. J. (2014). Quantitative analysis of low-density SNP data for parentage assignment and estimation of family contributions to pooled samples. Genet. Sel. Evol. 46, 1–17. doi: 10.1186/s12711-014-0051-y
Horn, J. L. (1965). A rationale and test for the number of factors in factor analysis. Psychometrika 30, 179–185. doi: 10.1007/BF02289447
IPBES (2016). Summary for Policymakers of the Assessment Report of the Intergovernmental Science-Policy Platform on Biodiversity and Ecosystem Services on Pollinators, Pollination and Food Production. Bonn: Secretariat of the Intergovernmental Science-Policy Platform on Biodiversity and Ecosystem Services.
Jensen, A. B., Palmer, K. A., Boomsma, J. J., and Pedersen, B. V. (2005a). Varying degrees of Apis mellifera ligustica introgression in protected populations of the black honeybee, Apis mellifera mellifera, in northwest Europe. Mol. Ecol. 14, 93–106. doi: 10.1111/j.1365-294X.2004.02399.x
Jensen, A. B., Palmer, K. A., Chaline, N., Raine, N. E., Tofilski, A., Martin, S. J., et al. (2005b). Quantifying honey bee mating range and isolation in semi-isolated valleys by DNA microsatellite paternity analysis. Conserv. Genet. 6, 527–537. doi: 10.1007/s10592-005-9007-7
Kauhausen-Keller, D., and Keller, R. (1994). Morphometrical control of pure race breeding in the honey bee (Apis mellifera L.). Apidologie 25, 133–143. doi: 10.1051/apido:19940202
Klein, A. M., Vaissière, B. E., Cane, J. H., Steffan-Dewenter, I., Cunningham, S. A., Kremen, C., et al. (2007). Importance of pollinators in changing landscapes for world crops. Proc. R. Soc. Lond. B Biol. Sci. 274, 303–313. doi: 10.1098/rspb.2006.3721
Kosoy, R., Nassir, R., Tian, C., White, P. A., Butler, L. M., Silva, G., et al. (2009). Ancestry informative marker sets for determining continental origin and admixture proportions in common populations in America. Hum. Mutat. 30, 69–78. doi: 10.1002/humu.20822
Kruskal, W. H., and Wallis, W. A. (1952). Use of ranks in one-criterion variance analysis. J. Am. Stat. Assoc. 47, 583–621. doi: 10.1080/01621459.1952.10483441
Li, H. (2011). A statistical framework for SNP calling, mutation discovery, association mapping and population genetical parameter estimation from sequencing data. Bioinformatics 27, 2987–2993. doi: 10.1093/bioinformatics/btr509
Li, H., and Durbin, R. (2009). Fast and accurate short read alignment with burrows-wheeler transform. Bioinformatics 25, 1754–1760. doi: 10.1093/bioinformatics/btp324
Li, H., Handsaker, B., Wysoker, A., Fennell, T., Ruan, J., Homer, N., et al. (2009). The sequence alignment/map format and SAMtools. Bioinformatics 25, 2078–2079. doi: 10.1093/bioinformatics/btp352
Liu, N., Chen, L., Wang, S., Oh, C., and Zhao, H. (2005). Comparison of single-nucleotide polymorphisms and microsatellites in inference of population structure. BMC Genet. 6:S26. doi: 10.1186/1471-2156-6-S1-S26
Louveaux, J., Albisetti, M., Delangue, M., and Theurkauff, M. (1966). Les Modalités De L'adaptation Des Abeilles (Apis Mellifica L.) au Milieu Naturel. Ann. Abeille 9, 323–350. doi: 10.1051/apido:19660402
Mantel, N. (1967). The detection of disease clustering and a generalized regression approach. Cancer Res. 27, 209–220.
Mattila, H. R., and Seeley, T. D. (2007). Genetic diversity in honey bee colonies enhances productivity and fitness. Science 317, 362–364. doi: 10.1126/science.1143046
McKenna, A., Hanna, M., Banks, E., Sivachenko, A., Cibulskis, K., Kernytsky, A., et al. (2010). The Genome Analysis Toolkit: a MapReduce framework for analyzing next-generation DNA sequencing data. Genome Res. 20, 1297–1303. doi: 10.1101/gr.107524.110
Meixner, M. D., Costa, C., Kryger, P., Hatjina, F., Bouga, M., Ivanova, E., et al. (2010). Conserving diversity and vitality for honey bee breeding. J. Apic. Res. 49, 85–92. doi: 10.3896/IBRA.1.49.1.12
Meixner, M. D., Kryger, P., and Costa, C. (2015). Effects of genotype, environment, and their interactions on honey bee health in Europe. Curr.Opin. Insect Sci. 10, 177–184. doi: 10.1016/j.cois.2015.05.010
Meixner, M. D., Pinto, M. A., Bouga, M., Kryger, P., Ivanova, E., and Fuchs, S. (2013). Standard methods for characterising subspecies and ecotypes of Apis mellifera. J. Apic. Res. 52, 1–28. doi: 10.3896/IBRA.1.52.4.05
Menozzi, P., Piazza, A., and Cavalli-Sforza, L. (1978). Synthetic maps of human gene frequencies in Europeans. Science 201, 786–792. doi: 10.1126/science.356262
Moritz, R. F. A. (1991). The limitations of biometric control on pure race breeding in Apis mellifera. J. Apic. Res. 30, 54–59. doi: 10.1080/00218839.1991.11101234
Muñoz, I., Dall′Olio, R., Lodesani, M., and De La Rúa, P. (2014a). Estimating introgression in Apis mellifera siciliana populations: are the conservation islands really effective? Insect Conserv. Divers. 7, 563–571. doi: 10.1111/icad.12092
Muñoz, I., and De La Rúa, P. (2012). Temporal analysis of the genetic diversity in a honey bee mating area of an island population (La Palma, Canary Islands, Spain). J. Apic. Sci. 56, 41–49. doi: 10.2478/v10289-012-0005-y
Muñoz, I., Henriques, D., Johnston, J. S., Chávez-Galarza, J., Kryger, P., and Pinto, M. A. (2015). Reduced SNP panels for genetic identification and introgression analysis in the dark honey bee (Apis mellifera mellifera). PLoS ONE 10:e0124365. doi: 10.1371/journal.pone.0124365
Muñoz, I., Pinto, M. A., and De La Rúa, P. (2014b). Effects of queen importation on the genetic diversity of Macaronesian island honey bee populations (Apis mellifera Linneaus 1758). J. Apic. Res. 53, 296–302. doi: 10.3896/IBRA.1.53.2.11
Nei, M. (1982). Evolution of human races at the gene level. Prog. Clin. Biol. Res. 103(Pt A), 167–181.
Neuditschko, M., Khatkar, M. S., and Raadsma, H. W. (2012). NETVIEW: a high-definition network-visualization approach to detect fine-scale population structures from genome-wide patterns of variation. PLoS ONE 7:e48375. doi: 10.1371/journal.pone.0048375
Neumann, P., and Carreck, N. L. (2010). Honey bee colony losses. J. Apic. Res. 49, 1–6. doi: 10.3896/IBRA.1.49.1.01
Neumann, P., Moritz, R. F. A., and Mautz, D. (1999a). Using DNA microsatellites for maternity testing in honeybees (Apis mellifera L.). Apidologie 30, 505–512. doi: 10.1051/apido:19990605
Neumann, P., Moritz, R. F. A., and Mautz, D. (2000). Colony evaluation is not affected by drifting of drone and worker honeybees (Apis mellifera L.) at a performance testing apiary. Apidologie 31, 67–79. doi: 10.1051/apido:2000107
Neumann, P., Moritz, R. F. A., and Van Praagh, J. (1999b). Queen mating frequency in different types of honey bee mating apiaries. J. Apic. Res. 38, 11–18. doi: 10.1080/00218839.1999.11100990
Neumann, P., Van Praagh, J. P., Moritz, R. F. A., and Dustmann, J. H. (1999c). Testing reliability of a potential island mating apiary using DNA microsatellites. Apidologie 30, 257–276. doi: 10.1051/apido:19990402
Nicolas, P., Sun, F., and Li, L. M. (2006). A model-based approach to selection of tag SNPs. BMC Bioinformatics 7:303. doi: 10.1186/1471-2105-7-303
O'connell, J., Gurdasani, D., Delaneau, O., Pirastu, N., Ulivi, S., Cocca, M., et al. (2014). A general approach for haplotype phasing across the full spectrum of relatedness. PLoS Genet. 10:e1004234. doi: 10.1371/journal.pgen.1004234
Oksanen, J., Blanchet, G., Kindt, R., Legendre, P., Minchin, P., Ohara, R., et al. (2016). vegan: Community Ecology Package
Oleksa, A., Chybicki, I., Tofilski, A., and Burczyk, J. (2011). Nuclear and mitochondrial patterns of introgression into native dark bees (Apis mellifera mellifera) in Poland. J. Apic. Res. 50, 116–129. doi: 10.3896/IBRA.1.50.2.03
Pannier, L., Mullen, A. M., Hamill, R. M., Stapleton, P. C., and Sweeney, T. (2010). Association analysis of single nucleotide polymorphisms in DGAT1, TG and FABP4 genes and intramuscular fat in crossbred Bos taurus cattle. Meat Sci. 85, 515–518. doi: 10.1016/j.meatsci.2010.02.025
Paschou, P., Drineas, P., Lewis, J., Nievergelt, C. M., Nickerson, D. A., Smith, J. D., et al. (2008). Tracing Sub-Structure in the European American Population with PCA-Informative Markers. PLoS Genet. 4:e1000114. doi: 10.1371/journal.pgen.1000114
Paschou, P., Ziv, E., Burchard, E. G., Choudhry, S., Rodriguez-Cintron, W., Mahoney, M. W., et al. (2007). PCA-correlated SNPs for structure identification in worldwide human populations. PLoS Genet. 3:e30160. doi: 10.1371/journal.pgen.0030160
Pearson, K. (1895). Notes on regression and inheritance in the case of two parents. Proc. R Soc. Lond. 58, 240–242. doi: 10.1098/rspl.1895.0041
Péntek-Zakar, E., Oleksa, A., Borowik, T., and Kusza, S. (2015). Population structure of honey bees in the Carpathian Basin (Hungary) confirms introgression from surrounding subspecies. Ecol. Evol. 5, 5456–5467. doi: 10.1002/ece3.1781
Pinto, M. A., Henriques, D., Chávez-Galarza, J., Kryger, P., Garnery, L., Van Der Zee, R., et al. (2014). Genetic integrity of the Dark European honey bee (Apis mellifera mellifera) from protected populations: a genome-wide assessment using SNPs and mtDNA sequence data. J. Apic. Res. 53, 269–278. doi: 10.3896/IBRA.1.53.2.08
Potts, S. G., Biesmeijer, J. C., Kremen, C., Neumann, P., Schweiger, O., and Kunin, W. E. (2010). Global pollinator declines: trends, impacts and drivers. Trends Ecol. Evol. (Amst). 25, 345–353. doi: 10.1016/j.tree.2010.01.007
Price, A. L., Patterson, N. J., Plenge, R. M., Weinblatt, M. E., Shadick, N. A., and Reich, D. (2006). Principal components analysis corrects for stratification in genome-wide association Studies. Nat. Genet. 38, 904–909. doi: 10.1038/ng1847
Pritchard, J. K., Stephens, M., and Donnelly, P. (2000). Inference of population structure using multilocus genotype data. Genetics 155, 945–959.
R Core Team (2016). R. Language and Environment for Statistical Computing. Vienna: R Foundation for Statistical Computing.
Revell, L. J. (2012). phytools: an R package for phylogenetic comparative biology (and other things). Methods Ecol. Evol. 3, 217–223. doi: 10.1111/j.2041-210X.2011.00169.x
Rimmer, A., Phan, H., Mathieson, I., Iqbal, Z., Twigg, S. R., Wilkie, A. O., et al. (2014). Integrating mapping-, assembly- and haplotype-based approaches for calling variants in clinical sequencing applications. Nat. Genet. 46, 912–918. doi: 10.1038/ng.3036
Ruttner, H., and Ruttner, F. (1972). Untersuchungen über die Flugaktivität und das Paarungsverhalten der Drohnen. Apidologie (Celle) 3, 203–232. doi: 10.1051/apido:19720301
Scharpenberg, H., Neumann, P., Van Praagh, J. P., and Moritz, R. F. A. (2006). Reliability of an island mating apiary under routine management. J. Apic. Res. 45, 153–154. doi: 10.1080/00218839.2006.11101334
Schwenger, B., Schöber, S., and Simon, D. (1993). DUMPS cattle carry a point mutation in the uridine monophosphate synthase gene. Genomics 16, 241–244. doi: 10.1006/geno.1993.1165
Shannon, P., Markiel, A., Ozier, O., Baliga, N. S., Wang, J. T., Ramage, D., et al. (2003). Cytoscape: a software environment for integrated models of biomolecular interaction networks. Genome Res. 13, 2498–2504. doi: 10.1101/gr.1239303
Sheppard, W. S., and Meixner, M. D. (2003). Apis mellifera pomonella, a new honey bee subspecies from Central Asia. Apidologie (Celle) 34, 367–375. doi: 10.1051/apido:2003037
Shriver, M. D., Parra, E. J., Dios, S., Bonilla, C., Norton, H., Jovel, C., et al. (2003). Skin pigmentation, biogeographical ancestry and admixture mapping. Hum. Genet. 112, 387–399. doi: 10.1007/s00439-002-0896-y
Soland-Reckeweg, G., Heckel, G., Neumann, P., Fluri, P., and Excoffier, L. (2009). Gene flow in admixed populations and implications for the conservation of the Western honeybee, Apis mellifera. J. Insect Conserv. 13, 317–328. doi: 10.1007/s10841-008-9175-0
Spötter, A., Gupta, P., Mayer, M., Reinsch, N., and Bienefeld, K. (2016). Genome-wide association study of a varroa-specific defense behavior in honeybees (Apis mellifera). J. Hered. 107, 220–227. doi: 10.1093/jhered/esw005
Steinig, E. J., Neuditschko, M., Khatkar, M. S., Raadsma, H. W., and Zenger, K. R. (2015). NETVIEW P: a network visualization tool to unravel complex population structure using genome-wide SNPs. Mol. Ecol. Resour. 16, 216–227. doi: 10.1111/1755-0998.12442
Strange, J. P., Garnery, L., and Sheppard, W. S. (2007). Persistence of the Landes ecotype of Apis mellifera mellifera in southwest France: confirmation of a locally adaptive annual brood cycle trait. Apidologie 38, 259–267. doi: 10.1051/apido:2007012
Strange, J. P., Garnery, L., and Sheppard, W. S. (2008). Morphological and molecular characterization of the Landes honey bee (Apis mellifera L.) ecotype for genetic conservation. J. Insect Conserv. 12, 527–537. doi: 10.1007/s10841-007-9093-6
Tarpy, D. R. (2003). Genetic diversity within honeybee colonies prevents severe infections and promotes colony growth. Proc. R. Soc. Lond. B Biol. Sci. 270, 99–103. doi: 10.1098/rspb.2002.2199
Tetko, I. V., Facius, A., Ruepp, A., and Mewes, H. W. (2005). Super paramagnetic clustering of protein sequences. BMC Bioinformatics 6:82. doi: 10.1186/1471-2105-6-82
Uzunov, A., Costa, C., Panasiuk, B., Meixner, M., Kryger, P., Hatjina, F., et al. (2014a). Swarming, defensive and hygienic behaviour in honey bee colonies of different genetic origin in a pan-European experiment. J. Apic. Res. 53, 248–260. doi: 10.3896/IBRA.1.53.2.06
Uzunov, A., Meixner, M. D., Kiprijanovska, H., Andonov, S., Gregorc, A., Ivanova, E., et al. (2014b). Genetic structure of Apis mellifera macedonica in the balkan peninsula based on microsatellite DNA polymorphism. J. Apic. Res. 53, 288–295. doi: 10.3896/IBRA.1.53.2.10
Van der Auwera, G. A., Carneiro, M. O., Hartl, C., Poplin, R., del Angel, G., Levy-Moonshine, A., et al. (2013). From FastQ data to high-confidence variant calls: the Genome Analysis Toolkit best practices pipeline. Curr. Protoc. Bioinformatics 43, 11.10.1–11.10.33. doi: 10.1002/0471250953.bi1110s43
Vanengelsdorp, D., and Meixner, M. D. (2010). A historical review of managed honey bee populations in Europe and the United States and the factors that may affect them. J. Invertebr. Pathol. 103, S80–S95. doi: 10.1016/j.jip.2009.06.011
Wallberg, A., Han, F., Wellhagen, G., Dahle, B., Kawata, M., Haddad, N., et al. (2014). A worldwide survey of genome sequence variation provides insight into the evolutionary history of the honeybee Apis mellifera. Nat. Genet. 46, 1081–1088. doi: 10.1038/ng.3077
Warsow, G., Greber, B., Falk, S. S., Harder, C., Siatkowski, M., Schordan, S., et al. (2010). ExprEssence - Revealing the essence of differential experimental data in the context of an interaction/regulation net-work. BMC Syst. Biol. 4:164. doi: 10.1186/1752-0509-4-164
Weale, M. E., Depondt, C., Macdonald, S. J., Smith, A., Lai, P. S., Shorvon, S. D., et al. (2003). Selection and evaluation of tagging snps in the neuronal-sodium-channel gene SCN1A: implications for linkage-disequilibrium gene mapping. Am. J. Hum. Genet. 73, 551–565. doi: 10.1086/378098
Weinstock, G. M., Robinson, G. E., Gibbs, R. A., Worley, K. C., Evans, J. D., Maleszka, R., et al. (2006). Insights into social insects from the genome of the honeybee Apis mellifera. Nature 443, 931–949. doi: 10.1038/nature05260
Weir, B. S., and Cockerham, C. C. (1984). Estimating F-statistics for the analysis of population structure. Evolution 38, 1358–1370. doi: 10.2307/2408641
Wellmann, R., Preuß, S., Tholen, E., Heinkel, J., Wimmers, K., and Bennewitz, J. (2013). Genomic selection using low density marker panels with application to a sire line in pigs. Genet. Select. Evol. 45, 1–11. doi: 10.1186/1297-9686-45-28
Whitfield, C. W., Behura, S. K., Berlocher, S. H., Clark, A. G., Johnston, J. S., Sheppard, W. S., et al. (2006). Thrice out of Africa: ancient and recent expansions of the honey bee, Apis mellifera. Science 314, 642–645. doi: 10.1126/science.1132772
Woyke, J. (1964). Causes of repeated mating flights by queen honeybees. J. Apicult. Res. 3, 17–23. doi: 10.1080/00218839.1964.11100077
Keywords: Apis mellifera mellifera, honey bee, conservation genomics, whole-genome sequencing, network clustering, admixture, ancestry informative SNPs
Citation: Parejo M, Wragg D, Gauthier L, Vignal A, Neumann P and Neuditschko M (2016) Using Whole-Genome Sequence Information to Foster Conservation Efforts for the European Dark Honey Bee, Apis mellifera mellifera. Front. Ecol. Evol. 4:140. doi: 10.3389/fevo.2016.00140
Received: 30 September 2016; Accepted: 05 December 2016;
Published: 21 December 2016.
Edited by:
Alberto Orgiazzi, European Commission-Joint Research Centre, ItalyReviewed by:
Atanas Ivanov Atanassov, Joint Genomic Center, BulgariaFernando José Cebola Lidon, Faculdade de Ciências e Tecnologia da Universidade Nova de Lisboa, Portugal
Copyright © 2016 Parejo, Wragg, Gauthier, Vignal, Neumann and Neuditschko. This is an open-access article distributed under the terms of the Creative Commons Attribution License (CC BY). The use, distribution or reproduction in other forums is permitted, provided the original author(s) or licensor are credited and that the original publication in this journal is cited, in accordance with accepted academic practice. No use, distribution or reproduction is permitted which does not comply with these terms.
*Correspondence: Melanie Parejo, melanie.parejo@vetsuisse.unibe.ch
Markus Neuditschko, markus.neuditschko@agroscope.admin.ch