Projected Dryland Cropping System Shifts in the Pacific Northwest in Response to Climate Change
 Tina Karimi
 Claudio O. Stöckle
 Stewart S. Higgins
 Roger L. Nelson
 David Huggins
- Department of Biological System Engineering, Washington State University, Pullman, WA, USA
Agriculture in the dryland region of the Inland Pacific Northwest (IPNW, including northern Idaho, eastern Washington and northern Oregon) is typically characterized based on annual rainfall and associated distribution of cropping systems that have evolved in response to biophysical and socio-economic factors. Three agro-ecological classes (AEC) have been proposed for the region: (a) crop/fallow (CF), (b) annual crop/fallow transition (CCF), and (c) continuous cropping (CC). AECs attempt to associate land use into relatively homogeneous areas that result in common production systems. Although there is an interest in sustainable intensification of cropping systems (e.g., reduction of fallow), the question remains whether climate change will preclude intensification or shift the borders of existing AECs toward greater fallow utilization. A simulation study was conducted to address this question, with the aim of classifying 4 × 4 km pixels throughout the region into one of the three AECs for baseline (1979–2010) and future periods (2030s, 2015–2045; 2050s, 2035–2065; 2070s, 2055–2085). Baseline data were derived from traditional rotations and historical climate records. Data for future projections were derived from atmospheric CO2 concentration considering daily weather downloaded from 12 global circulation models and 2 representative concentration pathways (RCP 4.5 and 8.5). Due to the direct effect of atmospheric CO2 on photosynthesis and stomatal conductance, the transpiration use efficiency of crops (TUE; g above-ground biomass kg water−1) showed an increasing trend, with winter wheat TUE changing from 4.76 in the historical period to 6.17 and 7.08 g kg−1 in 2070s, depending on AEC. Compared to the baseline, total grain yield by the 2070s in the region was projected to increase in the range of 18–48% (RCP 4.5) and 30–65% (RCP 8.5), depending on AEC. As a consequence of these changes, compared to the historical baseline period, the future fraction of the area classified as CF decreased from 50% to 39–36%, CC increased from 16% to 24–28%, and CCF decreased slightly (~1%), with the greater change projected for the RCP 8.5 scenario.
Introduction
The dryland agricultural region of the Inland Pacific Northwest (IPNW) includes northern Idaho, eastern Washington and northeastern Oregon. This region has been divided into agro-ecological zones based on climate and soil parameters important for growing winter wheat (Douglas et al., 1992). Recently Huggins et al. (2011, 2014) provided agro-ecological classes (AECs) based on the distribution of major agricultural systems in the region derived from 5-year cropland data layers (2007–2011, resolution of 30 × 30 m) produced by the National Agricultural Statistics Service of the US Department of Agriculture. The proportion of fallow was used to define three dryland farming AECs where crop-fallow (CF) includes areas having 40% or more fallow, annual crop-fallow transition (CCF) having 10–40% fallow, and continuous cropping (CC) comprising areas with less than 10% fallow. A map of AECs, scaled up to 4 × 4 km resolution, which is the size of the grid available for historical and future weather data in the region used in this study (Abatzoglou, 2013), is presented in Figure 1A. The boundaries depicted on this map are subject to yearly changes due to flexible cropping decisions by farmers. Figure 1B approximates AECs based on historical annual precipitation, where CC and CF comprise the area with mean annual precipitation >18″ (457 mm) and <12″ (304 mm), respectively, while CCF occupies the areas with precipitation between these two limits. The maps in Figures 1A,B are quite similar, an indication of the dominant effect of precipitation as a long-term driver of crop yields and cropping systems in the region.
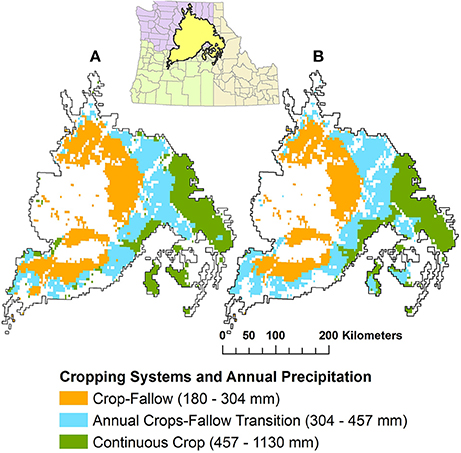
Figure 1. Agroecological classes in the dryland region of the Inland Pacific Northwest based on (A) 5-year aggregated crop data layers, and (B) annual precipitation.
Fallow is commonly used in the low and variable precipitation areas in the IPNW to maximize water storage at sowing for the wheat dominant cropping systems (Schillinger and Papendick, 2008). In the CF area, replacing the uncropped fallow period with crops results in a reduction of biomass production (Aiken et al., 2013). However, fallow can negatively affect the long-term sustainability of drylands by degrading soils through erosion (Schillinger et al., 2010), and replacing summer fallow with a crop can promote the food security of a growing population (Fischer et al., 2014) and increase the opportunity for soil carbon sequestration (Campbell et al., 2005), which can be counted as a mitigation strategy.
By the end of the century, precipitation in the IPNW is projected to increase by 5% under representative concentration pathway (RCP) 4.5 and 8.6% under RCP 8.5, with wetter winters and drier summers. Temperature will increase 3°C under RCP 4.5 and 5°C under RCP 8.5 (Stöckle et al., under review), while atmospheric CO2 could reach 538 ppm under RCP 4.5 (Thomson et al., 2011) and 927 ppm under RCP 8.5 (Riahi et al., 2011). Representative Concentration Pathway RCP 4.5 represents a future of moderate climate mitigation policy, and RCP 8.5 represents a future of no climate policy. Crop productivity is expected to be affected by these changes (Kang et al., 2009; Lobell and Gourdji, 2012; Challinor et al., 2014). Climate changes also have the potential to alter the water balance and water-use efficiency of existing cropping systems (Marshall et al., 2015; Yang et al., 2016).
Historically, the AEC borders have had year-to-year variations based on farmers' planting decisions (weather forecasts, risk aversion considerations by farmers, cash flow, and other factors). The objective of this paper is to evaluate whether future climate and atmospheric CO2 conditions in the IPNW will have a significant impact on the extent of the use of fallow and thus the distribution of AECs. A decrease of fallow implies a relative increase in cropping intensification and vice versa. The potential to reduce the time that land is fallow is a significant management issue in the intermediate and low precipitation areas of the region, where economics and risk related to soil water and precipitation expectation dictate cropping decisions. In this article we do not examine specific management solutions or decision making approaches, but rather we explore the gradually fluctuating biophysical conditions under which farmers will need to make these decisions in the future. For this purpose, we used a cropping system model, CropSyst, and weather downscaled from 12 global climate model (GCM) projections and 2 RCPs to evaluate possible future AEC shifts leading toward more or less intensive cropping systems.
Methods
Crop Yield Simulations
To estimate crop yields, cropping systems representative of each of the three AECs (Table 1) were simulated, one cropping system at a time over the entire study region (3,565 grid cells). These simulations were performed using CropSyst (Stockle et al., 1994; Stöckle et al., 2003), a cropping system model that has been widely used for climate change assessment studies under different climatic conditions around the world (Sommer et al., 2013; Donatelli et al., 2015; Holzkämper et al., 2015; O'Leary et al., 2015). Downscaled gridded daily weather data (4 × 4 km) for the period 1979–2010 (Abatzoglou, 2013) were used for baseline simulations. For future projections, we used downscaled daily weather data from projections by 12 GCMs (Abatzoglou and Brown, 2012) for two RCPs based on radiative forcing at 2,100 of 4.5 and 8.5 W m−2 (RCP 4.5 and RCP 8.5, respectively) (Moss et al., 2010). Although, the 12 GCMs predict similar tendencies regarding future climate, the variability among them is substantial. The weather data sets included daily maximum and minimum temperature, precipitation, solar radiation, maximum and minimum relative humidity, and wind speed. The USDA-NRCS STATGO soil data base was used to extract soil data required by CropSyst for each grid cell. Within each 4 × km grid cell, the predominant soil in the cropped portion of the cell was chosen as input to the model. The results are presented for three future periods: 2030s (2015–2045), 2050s (2035–2065), and 2070s (2055–2085).
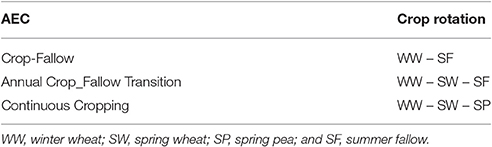
Table 1. Dryland cropping systems used in each agroecological class (AEC) of the Inland Pacific Northwest.
Defining Baseline and Future AECs
AEC classification maps were prepared for historical (baseline) and projected (24 alternative futures) climate scenarios. For each scenario, the first step was to determine the total grain yield production for each 4 × 4 km cell over the entire study region based on one of the cropping systems in Table 1, one cropping system at a time (i.e., each system representative of the three AECs was simulated independently over the region). The second step was to assign an AEC classification to each cell. To avoid extreme and unrealistic classification shifts, we used annual precipitation as the initial criterion, and we avoided assigning classes based on small grain yield advantages. The criteria for assigning cropping systems to each grid cell were as follows:
• Grid cells with mean precipitation <12″ are first assigned to CF
• Grid cells with mean precipitation >18″ are first assigned to CC
• The remainder of grid cells are assigned to CCF
• Grid cells first assigned to CF are reassigned to CCF if the grain production with CCF is 10% higher than that with CF
• Grid cells first assigned to CCF are reassigned to CC if the grain production with CC is 10% higher than that with CCF
• Grid cells first assigned to CC are reassigned to CCF if the grain production with CC is 10% lower than that with CCF.
Yield Probability Distribution
Evaluation of possible AEC shifts based solely on analysis of mean yield within each period would mask the year-to-year variability in grain production within a rotation. One way to assess this source of variation is to consider the yield probability distribution. For this percentile analysis, we used the following approach:
a. For each year, obtain the simulated yield, averaged over the 12 GCMs, for each crop within each rotation.
b. Use the Percentile function in Excel to evaluate the 90, 80, 70, 60, 50, 40, 30, 20, and 10th percentiles for the yields of each crop averaged within each time period and rotation. At the end of this step we have the yield that represents the nth percentile for the n = 9 percentiles for each crop within each rotation, time period, RCP and cell.
c. For each percentile, sum the yields from Step b for all crops within each rotation and time period. At the end of this step, we have for each percentile, a total yield for each rotation within each time period, RCP and cell.
d. Finally, for each percentile, we used the criteria presented in Section Defining baseline and future AECs for assigning cropping systems to each grid cell.
Results and Discussion
Yields and Crop Water Use
Figure 2 presents the probability distribution of total grain production for historical and future periods, including the average of the 12 GCMs (thick dashed lines) and projections by each individual GCM (thin lines). All future periods and RCP scenarios produced more yield than the baseline period, and RCP 8.5 had higher yield gains than RCP 4.5 as a result of higher atmospheric CO2 (Drake et al., 1997) counteracting greater warming. Compared to the historical baseline, the 50% probability total grain yield by the 2070s is projected to increase 23–37% for RCP 4.5 and 35–71% for RCP 8.5 depending on the AEC, with CC showing the greatest absolute increase and CF showing greatest relative increase compare to baseline yields. Based on limited studies in the IPNW, yields of wheat-based systems are projected to benefit from climate change for most of this century, with the degree of benefit depending on RCP (Thomson et al., 2002; Rosenzweig and Tubiello, 2007; Stöckle et al., 2010). Although, the yield response to future temperature changes can be fairly uncertain (Asseng et al., 2015), the moderate current temperatures in the region and earlier crop maturity under future conditions will mitigate deleterious effects of temperature on crop yields. The beneficial effect of increasing atmospheric CO2, however, is more clear. Earlier Free-Air CO2 Enrichment (FACE) experiments demonstrated well-watered wheat yield increases of 7–9% when CO2 was elevated from 350 to 550 ppm (Tubiello et al., 1999). Considering C3 species as a group, a meta-analysis of FACE experiments showed an increase of around 20 and 25% for biomass and yield, respectively, with stomatal conductance decreasing around 20% (CO2 elevated from 350–370 to 550–600 ppm; Long et al., 2004).
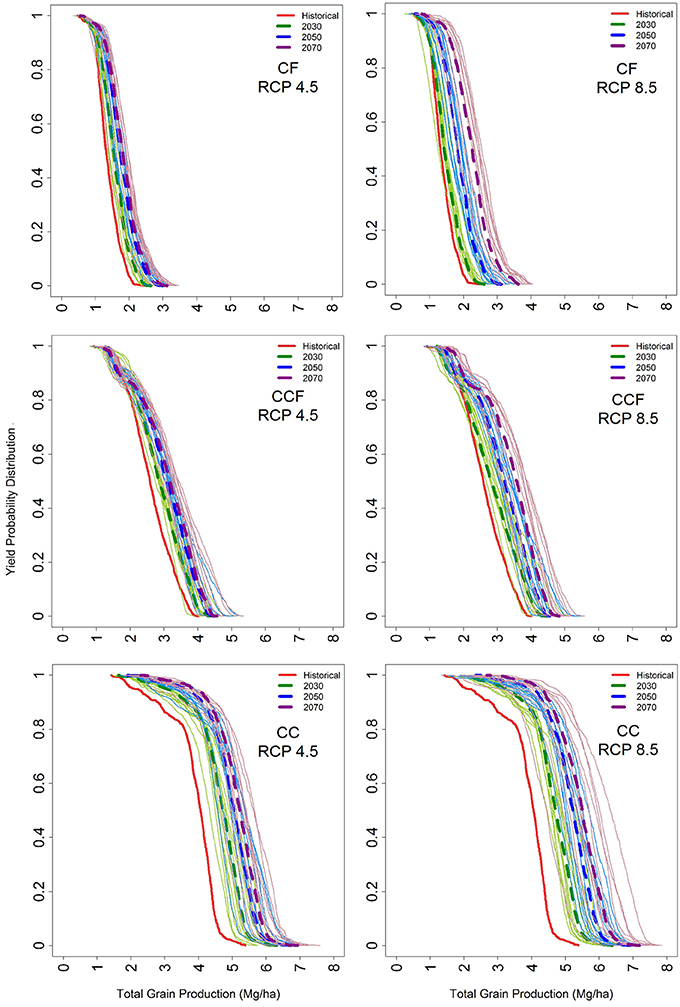
Figure 2. Yield probability distribution for grid cells in crop/fallow (CF), annual crop/fallow transition (CCF) and continuous cropping (CC) agroecological classes of the Inland Pacific Northwest for historical and future periods under 2 representative concentration pathways (RCP), 4.5 and 8.5.
To illustrate the nature of future changes in crop water use, transpiration for winter wheat during baseline and future periods is shown in Table 2. Although, an increase in temperature will contribute to greater atmospheric evaporative demand, projected crop transpiration tended to decline as a result of shorter growing seasons in response to warming and a reduction of stomatal conductance due to elevated atmospheric CO2 (Anisworth and Rogers, 2007). In this study the mean winter wheat actual transpiration showed a decreasing trend from the baseline 292 mm and 261 mm in CC and CCF AECs, respectively, to 289 mm and 245 mm in 2070s under RCP 4.5. The crop transpiration reduction was greater under RCP 8.5 (264 and 221 mm in CC and CCF, respectively). The decrease was small in the CC zone, but more substantial in the CCF zone. With very limited water availability in the CF zone, winter wheat utilized the projected additional winter precipitation (two winter seasons for one crop season) to support increased yields; thus transpiration increased slightly from the baseline value of 146 mm to 150 and 156 mm in 2070s under RCP 4.5 and 8.5, respectively. Decreased evapotranspiration driven by elevated CO2 (and unmodified temperature) has been documented in FACE experiments (e.g., Kimball et al., 1999).
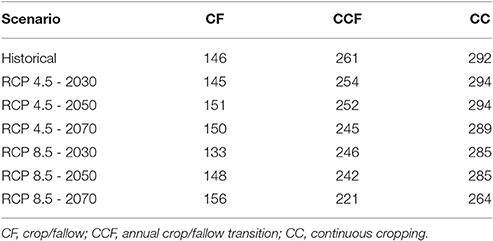
Table 2. Average dryland winter wheat transpiration (mm) in each agroecological class of the Inland Pacific Northwest for the historical and future scenarios under 2 representative concentration pathways (RCP).
To understand crop yield responses to future conditions, it is also of interest to consider the spatial distribution of crop transpiration-use efficiency (TUE = g above-ground biomass produced per kg of water transpired), shown for winter wheat in Figure 3. The relatively homogeneous distribution of TUE during the baseline period was replaced by greater variation and larger efficiencies in the future. These result from the beneficial effect of increasing atmospheric CO2 concentration, which increases photosynthesis (biomass production) and decreases stomatal conductance (crop transpiration). The average TUE in CC and CCF, respectively, increased from 4.76 and 4.85 to 5.95 and 6.14 g kg−1 under RCP 4.5 and even more under RCP 8.5 (6.85 and 7.08 g kg−1). In the CF zone, TUE increased from 4.96 (baseline) to 6.17 and 6.97 g kg−1 under RCP 4.5 and 8.5, respectively, which combined with a slight increase in crop transpiration explain the relatively larger future yield responses in this AEC. Evidence from field CO2 enrichment experiments have shown increased wheat yields, decreased transpiration, and increased TUE with elevated CO2 (Kimball et al., 1999), more so for water stressed than for well-irrigated crops (Chaudhuri et al., 1990; Tubiello et al., 1999; Manderscheid and Weigel, 2007). The latter has also been reported for C4 crops such as maize (Manderscheid et al., 2014) and sorghum (Conley et al., 2001) despite small gains in biomass production, with data suggesting that future high CO2 environments (increased temperature effects not accounted for) will increase dryland productivity (Conley et al., 2001).
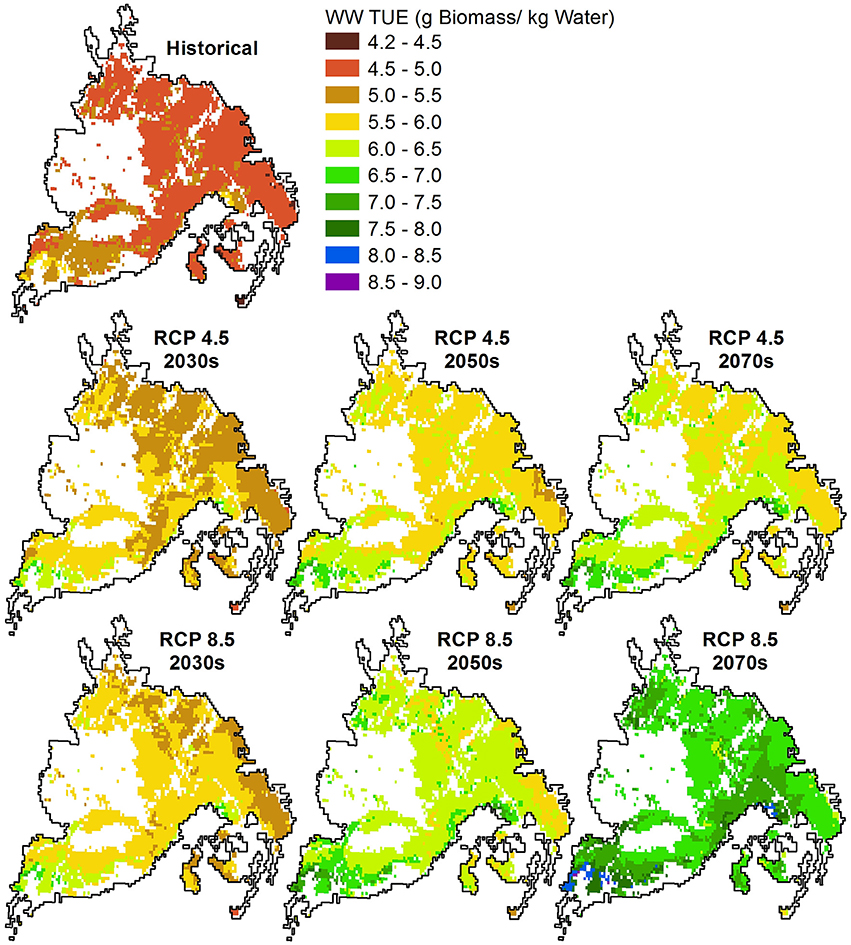
Figure 3. Spatial distribution of winter wheat (WW) transpiration-use efficiency (TUE) in the Inland Pacific Northwest during historical and future periods under 2 representative concentration pathways (RCP), 4.5 and 8.5.
Baseline and Future Distribution of AECs
The simulated baseline AEC classification (Figure 4) is similar to that presented in Figure 1A with some differences. For example, the simulated classification shows fewer CCF cells (blue color in the map) in the lower left side of the region, areas that in the long-term could produce more yield under CF rotation (orange color in the map). In Figure 4 there are 1,437 cells classified as CF, 1,438 cells as CCF and 690 cells classified as CC. In Figure 1A, based on crop data layers for only 5 years and an estimated percent of fallow (Huggins et al., 2014), these numbers are 1,275, 1,383, and 907 for CF, CCF, and CC respectively.
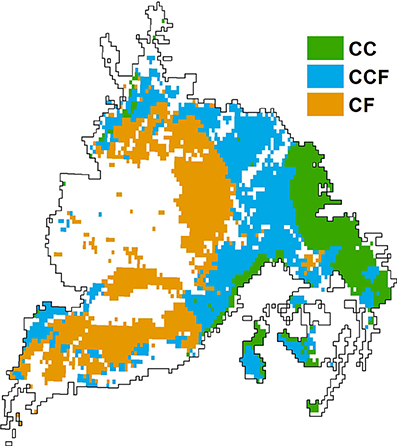
Figure 4. Baseline agroecological classes in the dryland region of the Inland Pacific Northwest (crop/fallow (CF), annual crop/fallow transition (CCF) and continuous cropping (CC)), based on 32-year simulations (1979–2010).
To illustrate the future distribution of AECs, Figure 5 shows projected AECs for the 2070s and both RCPs. Although changes are gradual (some change is already seen for the 2030s), the figure illustrates well the future trend showing that CC areas will tend to increase while CF will decrease compared to the historical baseline (Figure 4). The percentages of cells (area) in each class for baseline and future periods are presented in Figure 6. This figure shows that, for the RCP 4.5 scenario, area under CC will increase by the 2070s compared to the baseline (from 19 to 25%), and area in CF will decrease (from 40 to 36%), while CCF area will decrease slightly (~1%). In the case of the RCP 8.5 scenario, there is a more pronounced increase of the CC area by the 2070s (from 19 to 30%), with decline of both the CCF area (from ~40 to 36%) and the CF area (from ~40 to 34%). These results are based on yields averaged over the ensemble of 12 GCMs included in this study. An analysis based on yields and AEC classification of each individual GCM, and defining AEC classes based on the largest number of individual GCMs assigning a given class to each cell in the study region, produced similar results to those in Figure 6 (data not shown).
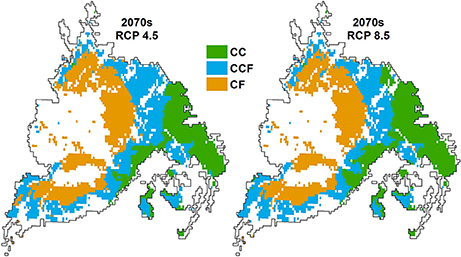
Figure 5. Distribution of agroecological classes in the dryland region of the Inland Pacific Northwest (crop/fallow (CF), annual crop/fallow transition (CCF) and continuous cropping (CC)), projected for the 2070s and based on the average of results from 12 global climate models under 2 representative concentration pathways (RCP), 4.5 and 8.5.
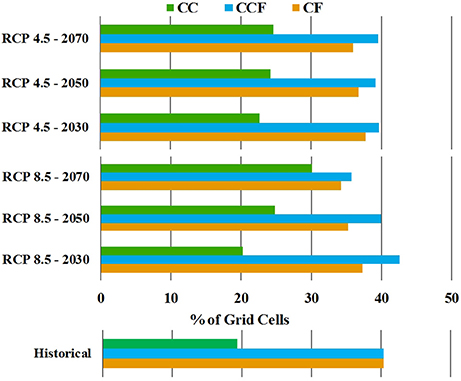
Figure 6. Percent of grid cells in the Inland Pacific Northwest assigned to a given agroecological class (crop/fallow (CF), annual crop/fallow transition (CCF), and continuous cropping (CC)) for baseline (1979-2010) and future periods (2030s, 2050s and 2070s) under representative concentration pathways (RCP) 4.5 and 8.5. Results are the average of 12 global climate models.
AEC Classification Based on Yield Percentiles
Farmers' planting decisions are not based on averages, but rather on probabilities and acceptable risk. Tables 3, 4 present the percentage of grid cells in each AEC based on yields for given probabilities of exceedance (PE = probability of obtaining yields equal to or greater than the yield used for AEC classification). For example, in Table 3, a PE of 70% classifies 50% of the area as CF (lower but more conservative yields), while at PE of 30% only 38% of the area is classified as CF (higher-risk classification). Based on average yields, ~40% is classified as CF (Figure 4). This illustrates that future cropping systems on the ground can be variable as influenced by factors such as economics and risk aversion.
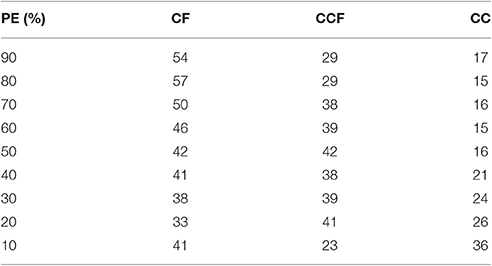
Table 3. Percent of cells in each agroecological class in the dryland region of the Inland Pacific Northwest (crop/fallow (CF), annual crop/fallow transition (CCF) and continuous cropping (CC)) for the historical period (1979–2010) at different probabilities of exceedance (PE).
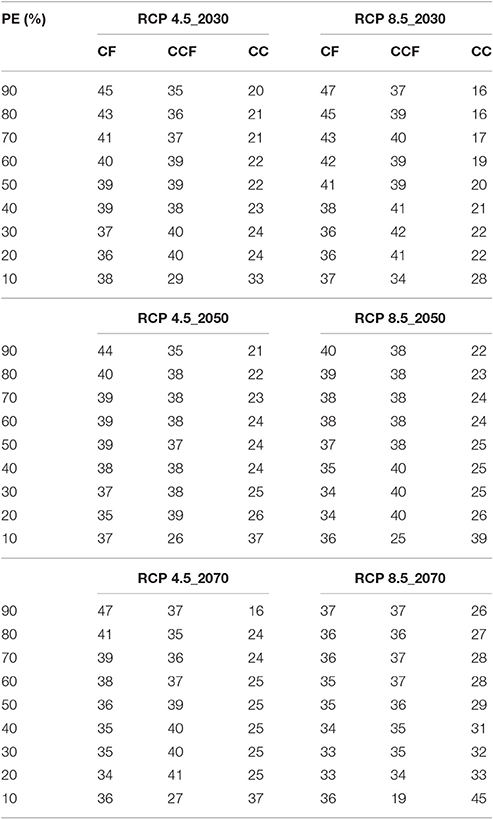
Table 4. Percent of cells in each agroecological class in the dryland region of the Inland Pacific Northwest (crop/fallow (CF), annual crop/fallow transition (CCF) and continuous cropping (CC)) for the future periods under 2 representative concentration pathways (RCP) at different probabilities of exceedance (PE).
Table 4 shows the AEC classification for future periods based on probabilities of yield exceedance. Considering a PE of 70% as a good reference of long-term farmers' decisions, the area classified as CF will decline from 50% (Table 3) to 36% in the 2070s and the RCP 8.5 scenario (Table 4). This can be contrasted with a CF decline from 40 to 34% based on average yields (Figure 6). Similarly, 2070s CC will increase from 16 to 28% for RCP 8.5 (from 19 to 30% for the classification based on average yields), while the change of the fractional area classified as CCF is small regardless of the method used.
The main driver of AEC distribution changes in response to future conditions is the beneficial effect of increasing atmospheric CO2 on TUE (greater biomass production per unit of water transpired), with potentially damaging effects of increasing temperature moderated by the relatively mild current temperatures in the region and future earlier crop maturity providing an escape from increasingly warm summers. Under future conditions, dryland crops will utilize available precipitation with greater efficiency, resulting in a trend to better yields under water-limited conditions, thus explaining the projected relative decrease of fallow in the region. These projections remained unchanged when the variation of downloaded weather from 12 GCMs used in this study was considered or when yields with a probability of exceedance of 70% were used to classify AECs. One weakness of the study is the use of a single crop model for yield projections, although the CropSyst model has been used extensively in wheat studies in the IPNW (Pannkuk et al., 1998; Peralta and Stöckle, 2002; Stöckle et al., 2010; and around the world, Pala et al., 1996; Sommer et al., 2013; Donatelli et al., 2015; Holzkämper et al., 2015; O'Leary et al., 2015). Previous studies conducted with other models have also shown positive impacts of climate change in the region (Thomson et al., 2002; Rosenzweig and Tubiello, 2007). Furthermore, a study of winter wheat production in the IPNW using 5 well-established cropping system models calibrated for the region and downloaded weather from 14 GCMs also reported improved winter wheat yields throughout the century, with CropSyst consistently producing more conservative projections than the mean of the ensemble of the 5 crop models (Ahmed et al., under review).
Conclusions
In this study a method was presented to project possible shifts of current AECs and associated cropping systems under future climate and atmospheric CO2 scenarios in the dryland agriculture region of the IPNW. Compared to the historical baseline period, the fraction of the area classified as CF AEC decreased under the RCP 4.5 future scenario; the CC area increased, while the CCF area slightly decreased. In the case of RCP 8.5, the trends were similar but with a greater degree of change. In both RCP scenarios and all future periods, there will be a trend of increasing total grain yield toward the 2070s, more so for RCP 8.5. Average 2070s total grain yield in CF increases from 1,556 kg ha−1 in the historical period to 1,822 and 2,248 kg ha−1 in RCP 4.5 and 8.5, respectively; from 2,604 in CFF (baseline) to 3,082 (RCP 4.5) and 3,397 (RCP 8.5) kg ha−1; and from 3,873 to 5,125 (RCP 4.5) and 5,412 (RCP 8.5) kg ha−1 in CC. These increases result from improvements in TUE caused by increasing atmospheric CO2, allowing not only gains in yields but also the opportunity for some cropping intensification from shorter fallow periods. When considering possible future AEC shifts, changes based on probabilistic distribution of yields are more informative than those based on average responses. Although, farmers are likely to favor more conservative cropping decisions, the conclusions of the study remained unchanged when the distribution of AECs was based on lower yields that were exceeded 70% of the time. Yield and potential AEC classifications vary if weather projections from individual GCMs are considered. However, these variations did not affect the conclusions of the study when grid cells were assigned an AEC based on the larger number of GCMs projecting such outcome. Results presented here pertain to a high northern latitude region with temperate arid to semi-arid climate. Under these conditions, future warmer winters and springs combined with the effect of CO2 fertilization provide a positive outlook for most of the century. Other high latitude wheat producing regions in Canada and China have similar probabilities of beneficial effects. Hot and dry rainfed areas in the southern US and Australia, already challenged by current climate, are unlikely to see sufficient compensation of increasing warming by increased CO2 during the century.
Author Contributions
TK: Contributed to the design of the work, conducted simulation runs, and contributed to data reduction, analysis, the first drafting of the work, and final approval of the version to be published. CS: Responsible for the conception and design of the work, supervised software development, implementation of simulation runs, evaluated results and data analysis, participated substantially in drafting the work and approved the final version to be published. SH: Contributed to some aspects of work design, assisted with data analysis, contributed to drafting of the work and approval of the final version to be published. RN: Contributed to the design of the work, developed software and implementation of models, assisted with input data, contributed to drafting the work, and provided final approval of the version to be published. DH: Provided substantial contribution to the conception and design of the work. He participated in initial outlining of the article, participated in the discussion of results obtained, and provided final approval of the version to be published.
Conflict of Interest Statement
The handling Editor declared a past collaboration with one of the authors CS and states that the process nevertheless met the standards of a fair and objective review.
The other authors declare that the research was conducted in the absence of any commercial or financial relationships that could be construed as a potential conflict of interest.
Acknowledgments
This research was supported by the United States Department of Agriculture's National Institute of Food and Agriculture, Award #2011-68002-30191 for the project, Regional Approaches to Climate Change for Pacific Northwest Agriculture.
References
Abatzoglou, J. T. (2013). Development of gridded surface meteorological data for ecological applications and modelling. Int. J. Climatol. 33, 121–131. doi: 10.1002/joc.3413
Abatzoglou, J. T., and Brown, T. J. (2012). A comparison of statistical downscaling methods suited for wildfire applications. Int. J. Climatol. 32, 772–780. doi: 10.1002/joc.2312
Aiken, R. M., O'Brien, D. M., Olson, B. L., and Murray, L. (2013). Replacing fallow with continuous cropping reduces crop water productivity of semiarid wheat. Agron. J. 105, 199–207. doi: 10.2134/agronj2012.0165
Anisworth, E. A., and Rogers, A. (2007). The response of photosynthesis and stomatal conductance to rising [CO2]: mechanisms and environmental interactions. Plant Cell Environ. 30, 258–270. doi: 10.1111/j.1365-3040.2007.01641.x
Asseng, S., Ewert, F., Martre, P., Rötter, R. P., Lobell, D. B., Cammarano, D., et al. (2015). Rising temperatures reduce global wheat production. Nat. Clim. Change 5, 143–147. doi: 10.1038/nclimate2470
Campbell, C., Janzen, H., Paustian, K., Gregorich, E., Sherrod, L., Liang, B., et al. (2005). Carbon storage in soils of the North American Great Plains: effect of cropping frequency. Agron. J. 97, 349–363. doi: 10.2134/agronj2005.0349
Challinor, A. J., Watson, J., Lobell, D. B., Howden, S. M., Smith, D. R., and Chhetri, N. (2014). A meta-analysis of crop yield under climate change and adaptation. Nat. Clim. Change 4, 287–291. doi: 10.1038/nclimate2153
Chaudhuri, U. N., Kansas, S. U., Kirkham, M. B., and Kanemasu, E. T. (1990). Carbon dioxide and water level effects on yield and water use of winter wheat. Agron. J. 82, 637–641.
Conley, M. M., Kimball, B. A., Brooks, T. J., Pinter, P. J., Hunsaker, D. J., Wall, G. W., et al. (2001). CO2 enrichment increases water-use efficiency in sorghum. New Phytol. 151, 407–412. doi: 10.1046/j.1469-8137.2001.00184.x
Donatelli, M., Srivastava, A. K., Duveiller, G., Niemeyer, S., and Fumagalli, D. (2015). Climate change impact and potential adaptation strategies under alternate realizations of climate scenarios for three major crops in Europe. Environ. Res. Lett. 10:075005. doi: 10.1088/1748-9326/10/7/075005
Douglas, C. L. J., Rickman, R. W., Klepper, B. L., and Zuzel, J. F. (1992). Agroclimatic zones for Dryland Winter Wheat Producing Areas of Idaho, Washington, and Oregon. Northwest Sci. 66, 26–34.
Drake, B. G., Gonzalez-Meler, M. A., and Long, S. P. (1997). MORE EFFICIENT PLANTS: a consequence of rising atmospheric CO2? Annu. Rev. Plant Physiol. Plant Mol. Biol. 48, 609–639. doi: 10.1146/annurev.arplant.48.1.609
Fischer, R., Byerlee, D., Edmeades, G. O., and Edmeades, G. O. (2014). Crop Yields and Global Food Security: Will Yield Increase Continue to Feed the World? ACIAR Monograph No. 158. Canberra, ACT: Australian Centre for International Agricultural Research.
Holzkämper, A., Calanca, P., Honti, M., and Fuhrer, J. (2015). Projecting climate change impacts on grain maize based on three different crop model approaches. Agric. For. Meteorol. 214–215, 219–230. doi: 10.1016/j.agrformet.2015.08.263
Huggins, D. R., Rupp, R., Gessler, P., Pan, W., Brown, D. J., Machado, S., et al. (2011). “Dynamic Agroecological Zones for the Inland Pacific Northwest, USA,” in AGU Fall Meeting, Abstract B12A-02 (San Francisco, CA).
Huggins, D., Rupp, R., Kaur, H., and Eigenbrode, S. (2014). “Defining agroecological classes for assessing land use dynamics,” in Regional Approaches to Climate Change for Pacific Northwest Agriculture. Annual Report|Year 3.
Kang, Y., Khan, S., and Ma, X. (2009). Climate change impacts on crop yield, crop water productivity and food security – A review. Prog. Nat. Sci. 19, 1665–1674. doi: 10.1016/j.pnsc.2009.08.001
Kimball, B. A., LaMorte, R. L., Pinter, P. J., Wall, G. W., Hunsaker, D. J., Adamsen, F. J., et al. (1999). Free-air CO2 enrichment and soil nitrogen effects on energy balance and evapotranspiration of wheat. Water Resour. Res. 35, 1179–1190. doi: 10.1029/1998WR900115
Lobell, D. B., and Gourdji, S. M. (2012). The influence of climate change on global crop productivity. Plant Physiol. 160, 1686–1697. doi: 10.1104/pp.112.208298
Long, S. P., Ainsworth, E. A., Rogers, A., and Ort, D. R. (2004). Rising atmospheric carbon dioxide: plants FACE the future. Annu. Rev. Plant Biol. 55, 591–628. doi: 10.1146/annurev.arplant.55.031903.141610
Manderscheid, R., Erbs, M., and Weigel, H.-J. (2014). Interactive effects of free-air CO2 enrichment and drought stress on maize growth. Eur. J. Agron. 52, 11–21. doi: 10.1016/j.eja.2011.12.007
Manderscheid, R., and Weigel, H.-J. (2007). Drought stress effects on wheat are mitigated by atmospheric CO2 enrichment. Agron. Sustain. Dev. 27, 79–87. doi: 10.1051/agro:2006035
Marshall, E., Aillery, M., Malcolm, S., and Williams, R. (2015). Agricultural production under climate change: the potential impacts of shifting regional water balances in the United States. Am. J. Agric. Econ. 97, 568–588. doi: 10.1093/ajae/aau122
Moss, R. H., Edmonds, J. A., Hibbard, K. A., Manning, M. R., Rose, S. K., van Vuuren, D. P., et al. (2010). The next generation of scenarios for climate change research and assessment. Nature 463, 747–756. doi: 10.1038/nature08823
O'Leary, G. J., Christy, B., Nuttall, J., Huth, N., Cammarano, D., Stöckle, C., et al. (2015). Response of wheat growth, grain yield and water use to elevated CO2 under a Free-Air CO2 Enrichment (FACE) experiment and modelling in a semi-arid environment. Glob. Change Biol. 21, 2670–2686. doi: 10.1111/gcb.12830
Pala, M., Stockle, C. O., and Harris, H. C. (1996). Simulation of Durum Wheat (Triticum turgidum ssp. Durum) Growth under Different Water and Nitrogen Regimes in a Mediterranean Environment using CropSyst. Agric. Syst. 2, 147–163.
Pannkuk, C., Stöckle, C. O., and Papendick, R. I. (1998). Validation of CropSyst simulation model for direct seeded rice-wheat cropping system (PDF Download Available). Agric. Syst. 57, 121–134.
Peralta, J., and Stöckle, C. O. (2002). Nitrate from an irrigated crop rotation at the Pasco-Quincy area (Washington, USA) available for groundwater contamination: a long-term simulation study. Agric. Ecosyst. Environ. 88, 23–24.
Riahi, K., Rao, S., Krey, V., Cho, C., Chirkov, V., Fischer, G., et al. (2011). RCP 8.5—A scenario of comparatively high greenhouse gas emissions. Clim. Change 109:33. doi: 10.1007/s10584-011-0149-y
Rosenzweig, C., and Tubiello, F. N. (2007). Adaptation and mitigation strategies in agriculture: an analysis of potential synergies. Mitig. Adapt. Strat. Glob. Change 12, 855–873. doi: 10.1007/s11027-007-9103-8
Schillinger, W. F., and Papendick, R. I. (2008). Then and Now: 125 Years of dryland wheat farming in the Inland Pacific Northwest. Agronomy 100, 166–182. doi: 10.2134/agronj2007.0027c
Schillinger, W., Papendick, R., and Mccool, D. (2010). “Soil and water challenges for Pacific Northwest Agriculture,” in Soil and Water Conservation Advances in the United States, eds T. M. Zobeck and W. F. Schillinger (Madison, WI: SSSA Special Publication), 47–79.
Sommer, R., Glazirina, M., Yuldashev, T., Otarov, A., Ibraeva, M., Martynova, L., et al. (2013). Impact of climate change on wheat productivity in Central Asia. Agric. Ecosyst. Environ. 178, 78–99. doi: 10.1016/j.agee.2013.06.011
Stöckle, C. O., Donatelli, M., and Nelson, R. (2003). CropSyst, a cropping systems simulation model. Eur. J. Agron. Model. Crop. Sys. 18, 289–307. doi: 10.1016/S1161-0301(02)00109-0
Stockle, C. O., Martin, S. A., and Campbell, G. S. (1994). CropSyst, a cropping systems simulation model: water/nitrogen budgets and crop yield. Agric. Syst. 46, 335–359. doi: 10.1016/0308-521X(94)90006-2
Stöckle, C. O., Nelson, R. L., Higgins, S., Brunner, J., Grove, G., Boydston, R., et al. (2010). Assessment of climate change impact on Eastern Washington agriculture. Clim. Change 102, 77–102. doi: 10.1007/s10584-010-9851-4
Thomson, A. M., Brown, R. A., Ghan, S. J., Izaurralde, R. C., Rosenberg, N. J., and Leung, L. R. (2002). Elevation dependence of Winter Wheat Production in Eastern Washington State with climate change: a methodological study. Clim. Change 54, 141–164. doi: 10.1023/A:1015743411557
Thomson, A. M., Calvin, K. V., Smith, S. J., Kyle, G. P., Volke, A., Patel, P., et al. (2011). RCP4.5: a pathway for stabilization of radiative forcing by 2100. Clim. Change 109:77. doi: 10.1007/s10584-011-0151-4
Tubiello, F. N., Rosenzweig, C., Kimball, B. A., Pinter, P. J., Wall, G. W., Hunsaker, D. J., et al. (1999). Testing CERES-Wheat with free-air Carbon Dioxide Enrichment (FACE) Experiment Data: CO2 and Water Interactions. Agron. J. 91, 247–255
Yang, Y., Liu, D. L., Anwar, M. R., O'Leary, G., Macadam, I., and Yang, Y. (2016). Water use efficiency and crop water balance of rainfed wheat in a semi-arid environment: sensitivity of future changes to projected climate changes and soil type. Theor. Appl. Climatol. 123, 565–579. doi: 10.1007/s00704-015-1376-3
Keywords: climate change, dryland, agro-ecological classes, wheat, fallow
Citation: Karimi T, Stöckle CO, Higgins SS, Nelson RL and Huggins D (2017) Projected Dryland Cropping System Shifts in the Pacific Northwest in Response to Climate Change. Front. Ecol. Evol. 5:20. doi: 10.3389/fevo.2017.00020
Received: 23 December 2016; Accepted: 13 March 2017;
Published: 27 April 2017.
Edited by:
Peter Thorburn, Commonwealth Scientific and Industrial Research Organisation, AustraliaReviewed by:
Fernando José Cebola Lidon, Universidade Nova de Lisboa, PortugalMukhtar Ahmed, Pir Mehr Ali Shah Arid Agriculture University, Pakistan
Copyright © 2017 Karimi, Stöckle, Higgins, Nelson and Huggins. This is an open-access article distributed under the terms of the Creative Commons Attribution License (CC BY). The use, distribution or reproduction in other forums is permitted, provided the original author(s) or licensor are credited and that the original publication in this journal is cited, in accordance with accepted academic practice. No use, distribution or reproduction is permitted which does not comply with these terms.
*Correspondence: Claudio O. Stöckle, stockle@wsu.edu