Carbon and Water Budgets in Multiple Wheat-Based Cropping Systems in the Inland Pacific Northwest US: Comparison of CropSyst Simulations with Eddy Covariance Measurements
 Jinshu Chi1,2*
  Fidel Maureira3
  Sarah Waldo1† Shelley N. Pressley1
  Claudio O. Stöckle3
  Patrick T. O'Keeffe1
  William L. Pan4
  Erin S. Brooks5
  Dave R. Huggins6 Brian K. Lamb1
- 1Laboratory for Atmospheric Research, Department of Civil and Environmental Engineering, Washington State University, Pullman, WA, United States
- 2Department of Forest Ecology and Management, Swedish University of Agricultural Sciences, Umeå, Sweden
- 3Department of Biological Systems Engineering, Washington State University, Pullman, WA, United States
- 4Department of Crop and Soil Sciences, Washington State University, Pullman, WA, United States
- 5Department of Biological and Agricultural Engineering, University of Idaho, Moscow, ID, United States
- 6Land Management and Water Conservation Research Unit (ARS-USDA), Pullman, WA, United States
Accurate carbon and water flux simulations for croplands are greatly dependent on high quality representation of management practices and meteorological conditions, which are key drivers of the surface-atmosphere exchange processes. Fourteen site-years of carbon and water fluxes were simulated using the CropSyst model over four agricultural sites in the inland Pacific Northwest (iPNW) US from October 1, 2011 to September 30, 2015. Model performance for field-scale net ecosystem exchange of CO2 (NEE) and evapotranspiration (ET) was evaluated by comparing simulations with long-term eddy covariance measurements. The model captured the temporal variations of NEE and ET reasonably well with an overall r of 0.78 and 0.80, and a low RMSE of 1.82 g C m−2 d−1 and 0.84 mm d−1 for NEE and ET, respectively. The model slightly underestimated NEE and ET by 0.51 g C m−2 d−1 and 0.09 mm d−1, respectively. ET simulations showed better agreement with eddy covariance measurements than NEE. The model performed much better for the sites with detailed initial conditions (e.g., SOC content) and management practice information (e.g., tillage type). The CropSyst results showed that the winter wheat fields could be annual net carbon sinks or close to neutral with the net ecosystem carbon balance (NECB) ranging from 92 to −17 g C m−2, while the spring crop fields were net carbon sources or neutral with an annual NECB of −327 to −3 g C m−2. Simulations for the paired tillage sites showed that the no-till site resulted in lower CO2 emissions for the crop rotations of winter wheat-spring garbanzo, but had higher carbon loss into the atmosphere for spring canola compared to the conventional tillage site. Water budgets did not differ significantly between the two tillage systems. Winter wheat in the high-rainfall area had higher crop yields and water use efficiency but emitted larger amounts of CO2 into the atmosphere than in the low-rainfall area. Based on model evaluations in this study, CropSyst appears promising as a tool to simulate field-scale carbon and water budgets and assess the effects of different management practices and local meteorological conditions for the wheat-based cropping systems in this region.
Introduction
Carbon and water cycles are two critical biophysical processes within the biosphere-atmosphere exchanges (Law et al., 2002) and agriculture plays an important role in global carbon and water dynamics (Bondeau et al., 2007; Running, 2012). CO2 is one of the major greenhouse gases in the atmosphere affecting the processes of global warming. CO2 emissions from agricultural soils are estimated to be 13 Pg C per year globally, accounting for 13% of total soil respiration (Bond-Lamberty and Thomson, 2010). Agricultural systems have also been considered as potential net carbon sinks to mitigate CO2 in the atmosphere resulting from photosynthesis. Examining the contribution of carbon budgets by agriculture systems is crucial to understand the global carbon cycle with respect to climate change (Sauerbeck, 2001). Agricultural carbon and water cycles are greatly affected by local meteorological conditions and management practices (Bernacchi et al., 2005; Aubinet et al., 2009; Vuichard et al., 2016). Meteorological variables, such as photosynthetically active radiation (PAR) and air temperature, play vital roles in photosynthesis and respiration processes (Rabinowitch, 1951; Lloyd and Taylor, 1994). In addition, local meteorological conditions also influence farming practices. For example, in dry cropping areas where rainfall is insufficient, crop-fallow is one management practice used to increase productivity (Schillinger, 2001). Farming activities can also alter carbon and water dynamics; for example, tillage practices can change soil structure and aggregation which eventually changes soil bulk density, soil water retention capacity, and hydraulic conductivity of soil, as well as accelerate soil organic carbon (SOC) decomposition (e.g., Ball et al., 1999; West and Post, 2002; Regina and Alakukku, 2010). As a result, there is a critical need to quantify the effects of different climatic conditions and management practices on agricultural carbon and water cycles to better understand how the underlying biophysical processes, and thus carbon and water dynamics, respond to a changing environment.
Cropping system simulation models have been widely used to predict the effects of weather conditions, crop rotations, site characteristics, and management practices on crop growth as well as water and nutrient dynamics in agro-ecosystems (Benli et al., 2007). Through crop simulations under different scenarios, the models can be utilized as a practical tool to help improve the efficacy of decision making for agriculture not only under the current conditions but also for the future changing climate. CropSyst is a cropping system simulation model that is structured in modular systems (Stöckle et al., 1994, 2003). It has been used to provide a better understanding of ecological interactions to help guide relevant areas of research in a wide range of crops (Donatelli et al., 1997; Confalonieri et al., 2009), management practices (Jalota et al., 2012; Marsal and Stockle, 2012), climatic scenarios, (Tubiello et al., 2000; Lehmann et al., 2013), and simulation scales (Stöckle et al., 2014). However, the simulation of real ground conditions is a challenge for cropping system models due to the spatial complexity and variability of factors that are difficult to capture in initial conditions (Holzworth et al., 2015).
On the other hand, methods, such as the eddy covariance technique have been widely used to directly measure agricultural carbon and water budgets over the field-scale but have their own limitations. The eddy covariance method measures net exchanges of water and carbon between the surface and the atmosphere (Baldocchi, 2003), and uses models to partition these net fluxes into different components (Reichstein et al., 2005; Lasslop et al., 2010). Furthermore, the uncertainties due to random measurement errors and data-processing procedures can be large for annual or multi-year cumulative carbon or water budgets determined via eddy covariance. From a practical standpoint, long-term field scale eddy covariance measurements can be expensive and it is not feasible to deploy eddy covariance towers in every ecosystem, while cropping models can provide scenario analysis and field-scale simulations for cropping systems under various conditions. Therefore, it is beneficial to combine both modeling and measurement methods to first evaluate model performance and then apply the model to assess the agricultural carbon and water dynamics under different scenario conditions.
In this study, carbon and water fluxes were simulated using the CropSyst model at four agricultural sites in the inland Pacific Northwest (iPNW) region of the United States. To evaluate the model performance, net ecosystem exchange of CO2 (NEE) and evapotranspiration (ET) were measured using eddy covariance flux towers. The iPNW region is a major wheat production area in the US and covers several agro-ecological classes (AECs) classified by integrating different biophysical (e.g., climate, soils, and terrain) and socioeconomic factors (e.g., commodity prices) (Douglas et al., 1992; Huggins et al., 2011). Traversing from the west to the east of the iPNW region, the AECs include dynamic- and stable- irrigated, crop-fallow, annual crop-fallow transition, and annual crop zones (https://www.reacchpna.org). Thus, the iPNW region is a unique study area to investigate the performance of wheat-based cropping systems under different water regimes and management practices. Consequently, the primary goal for this paper is to apply the CropSyst model to assess carbon and water dynamics at selected sites in the iPNW. Specific objectives are to (1) evaluate the CropSyst model performance with corresponding eddy covariance NEE and ET measurements, (2) determine the seasonal and inter-annual variability of carbon and water budgets in wheat-based cropping systems, and (3) discuss the implications of management practices and local meteorology on carbon and water budgets.
Methods
Site Description
The four study sites are located in the iPNW region across a precipitation gradient of 250–600 mm and a variety of agricultural management practices (Table 1). Briefly, LIND is situated in a low-rainfall, crop-fallow area. Two paired sites are located in the high-rainfall zone (550 mm annually), with the same crop rotation and similar meteorological conditions but different tillage types. One site has been in continuous no-till management (CAF-NT) since 1998 while the other site has been under conventional tillage practice (CAF-CT) over the same period. MMTN is located in a higher rainfall zone (>600 mm annually), 10 km southeast of CAF-NT and CAF-CT.
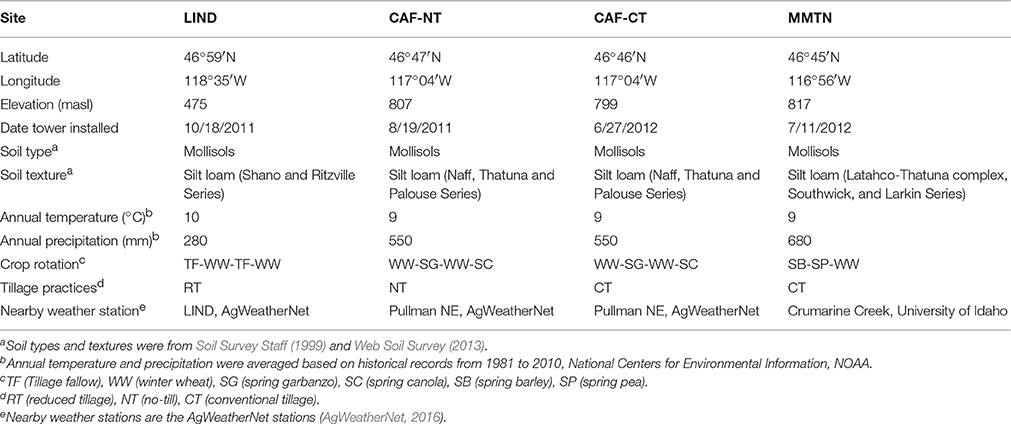
Table 1. Site characteristics, local meteorology, and management practices at each site.
Field Measurements
Each site has identical eddy covariance flux tower set-ups, including a 3D sonic anemometer (CSAT3A, Campbell Scientific, Inc.), an open-path infrared gas analyzer (IRGA, EC 150, Campbell Scientific, Inc.), net radiometer (NR-Lite2, Kipp&Zonen), air temperature and humidity sensor (HMP155A, Vaisala Inc.), PAR sensor (LI190SB, LI-COR Biosciences), wind vane (034B Windset, Met One Instruments), and soil temperature and moisture probes (5TM, Decagon Devices). Crop phenology is monitored using a time-lapse camera (WCT-00122, Wingscapes). Carbon content in the above-ground biomass is determined from the bi-weekly collected biomass samples using a TruSpec Carbon/Nitrogen Determinator (630–100–100, Leco Corporation), based on the method described in Law et al. (2008). The eddy covariance technique directly measures NEE and ET between the atmosphere and the surface. Uncertainties due to random measurement errors and gap-filling in annual sums of NEE and ET are estimated based on the method described in Richardson and Hollinger (2007). Full details of instrumentation, flux computation, quality assurance and quality control, data gap-filling, and uncertainty analysis are presented in Waldo et al. (2016) and Chi et al. (2016). The eddy covariance systems measure exchange over a homogeneous but fluctuating area, typically 1.5–2.5 ha, depending on wind direction and speed as well as atmospheric stability.
Cropsyst Model
At each of the four sites, the CropSyst model simulated carbon and water flux components in daily time step and field-scale spatial resolutions. Similar to the eddy covariance assumption, within the modeling domain (approximately 1.0 ha), it was assumed to have homogeneous soil, crop, meteorological and management conditions at the field-scale, although the “rolling hill” area in the iPNW is heterogeneous at the landscape scale. The CropSyst model simulates potential and actual ET partitioned into transpiration (T) and soil water evaporation (E) components, and based on transpiration-use efficiency determines biomass accumulation, which is partitioned into straw and grain yield (Stöckle et al., 2003). In addition, the model simulates CO2 emissions from SOC oxidation and residue decomposition. Using daily biomass production simulated by CropSyst, crop respiration (Ra), including growth and maintenance components, gross primary productivity (GPP) can be obtained as discussed below, which is the sum of biomass and Ra. Total ecosystem respiration (Reco) is the sum of Ra plus soil and residue respiration (Rh) associated with microbial decomposition activity. NEE is calculated as the difference between GPP and Reco. Based on Chapin et al. (2006), net ecosystem carbon balance (NECB) is determined by combining NEE and the exported harvest biomass carbon content (EXP). In this study, we used the sign convention that positive carbon fluxes indicate carbon loss from the ecosystem, and vice versa.
Model input includes hourly or daily local meteorological data, such as air temperature, precipitation, vapor pressure deficit (VPD), PAR, solar radiation, wind speed, as well as agricultural management information, such as tillage, fertilization and irrigation. Daily meteorological data are from nearby weather stations in the AgweatherNet network which provides access to current and historical weather data measured at 177 automated weather stations (AgWeatherNet, 2016). The weather data are filtered with a range test (Estévez et al., 2011). Gaps in the weather data are filled by averaging data over a period of adjacent 5 days. Parameters used to define each crop species are taken from the CropSyst default values based on Stöckle et al. (2012) (Appendix I in Supplementary Material) and thermal time accumulation is used to determine different crop phenological stages, which are based on observations by time-lapse cameras in the field (Bater et al., 2011). All the simulations are initialized in the fall of 2,000, providing 12 years to make the simulations independent of initial conditions before the period of comparisons with eddy covariance flux measurements. However, the crop history during the 12 years was not available and was assumed similar to the crop rotation during the period of measurements.
Crop Growth and Transpiration
To simulate crop growth, the CropSyst model incorporates crop phenology, canopy development, potential transpiration and biomass production (assuming no stress), factors of stress, and partitioning of the actual biomass (leaves, stems, grain, and roots). Crop phenology is determined by a thermal time scale, which is also adjusted for water stress (Stöckle et al., 2003). The daily potential biomass production is determined under unstressed conditions as the minimum of potential transpiration-dependent and PAR-dependent biomass gain (Monteith, 1977; Sinclair et al., 1984). The actual biomass gain is then determined by the most limiting of two stress factors: water and nitrogen. The reference and potential evapotranspiration is calculated using the Penman-Monteith equation (Monteith, 1965). Potential transpiration is part of the potential evapotranspiration adjusted by the fraction of solar radiation intercepted by the crop canopy. Root biomass and density are simulated by layer, which are used to determine the actual water and nitrogen uptake from soil layers. Partitioning of the tissues (leaves, stems, and root biomass) is determined by dynamic partitioning coefficients (Table 2). Crop yield is a function of the harvest index at maturity stage. Crop growth and transpiration are set to zero during the periods including (1) prior to seeding, (2) post-harvest, and (3) fallow.
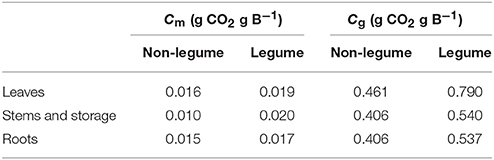
Table 2. Coefficients of maintenance respiration (Cm) and growth respiration (Cg) of vegetative organs at a temperature of 20°C (adapted from Penning de Vries et al., 1989).
Crop Respiration
Crop respiration, or autotrophic respiration (Ra), is the sum of maintenance (Rm) and growth (Rg) respiration (Thornley, 1970; Penning de Vries, 1974; Amthor, 2000; Cannell and Thornley, 2000). Rm is the amount of CO2 released due to maintenance per unit of existing biomass per time and Rg is the amount of CO2 released due to biomass growth per unit time. According to Amthor (2000); Penning de Vries (1974), and van Iersel and Seymour (2000), Rm and Rg (g CO2 m−2) are calculated using the biomass data and respiration coefficients (Table 2), as presented in Equations (1) and (2):
where W is the existing biomass (g B m−2) which is equal to the cumulative biomass by tissue (see Section Crop Growth and Transpiration); and Cm () is the maintenance respiration coefficient, which is determined using a Q10 value of 1.8 for each 10°C increase in tissue temperature (Confalonieri et al., 2009). Daily mean air temperature is used as an approximation of the tissue temperature.
where Cg () is the growth respiration coefficient and Yg () represents the units of carbon appearing in new biomass per unit of glucose carbon utilized for growth (Thornley, 1970).
Soil and Residue Respiration
In order to simulate heterotrophic respiration (Rh), the CropSyst model apportions residue carbon into three fractions (fast- and slow-cycling, and lignified fractions) with distinctive decomposition rates; and SOC into either single (Kemanian and Stöckle, 2010) or multiple (Stöckle et al., 2012) pools. Residue pools are initialized with the estimated contents of surface, root and residues from previous crops, while the SOC pool (single-pool model) is initialized based on the observed soil organic matter (Table 3). The pools are updated each day with a specified potential decomposition rate (d−1), adjusted as a function of soil temperature and moisture in each soil layer. Tillage effects on the decomposition rates are determined based on a soil conditioning index (USDA-NRCS, 2002), which describes the soil disturbance levels. Different soil disturbance levels as a result of tillage practices and clay content are used to determine tillage factors that adjust the SOC oxidation rate in the SOC pool (Kemanian and Stöckle, 2010). Soil and residue respiration is determined as the amount of CO2 released to the atmosphere via SOC oxidation and decomposition of residue carbon pools.
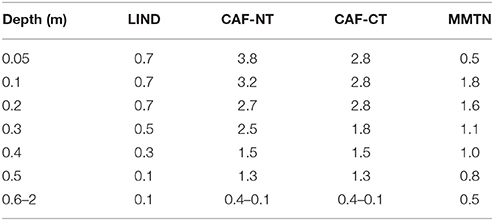
Table 3. Organic matter (%) at different depths used for initial conditions at each site (adapted from Purakayastha et al., 2008).
Model Evaluation
We used the Willmott index of agreement (d) (Willmott, 1982) to evaluate the CropSyt performance for simulating cumulative above-ground biomass, daily NEE and ET by comparing with the field measurements at four sites. As defined in Equation (3), d ranges from 0 to 1 where a value of 1 indicates perfect agreement.
where CSi and ECi are the CropSyst simulations and the field measurements, respectively. N is the total number of data points. In addition, correlation coefficient (r), root mean square error (RMSE), and bias are also calculated to estimate the degree of association and the average differences between simulations and measurements.
The annual period, or one water year, is defined from October 1 to September 30. According to Schmidt et al. (2012), the main growing season (MGS) is defined as the period when the measured NEE is less than the median NEE during each water year, with the remainder of the annual period defined as the off-main growing season (oMGS). The way of defining the MGS in this study, rather than from seeding to harvest, emphasizes the period where photosynthesis is significant and excludes the wintertime where little carbon uptake by winter wheat occurred.
Results
Evaluation of Modeled Above-Ground Biomass
As the core engine for modeling carbon and water budgets heavily relies on biomass simulations in CropSyst, accuracy in the CropSyst biomass results directly affects the model performance. The overall Willmott index of agreement (d) between biomass simulations and measurements was 0.98 for all 12 site-years (not including the two fallow years), indicating good agreement between CropSyst simulations and field measurements. Other statistical evaluation results also suggested good model performance for biomass simulations, illustrated by the relatively low bias and RMSE, as well as correlation coefficient (r) and slope close to 1 (Table 4). CropSyst performed best at CAF-CT, followed by CAF-NT, MMTN, and LIND (Figures 1A–D). The magnitudes of RMSE and bias ranged from 44 to 88 g C m−2 and −40 to 57 g C m−2, respectively, with CAF-CT and LIND having a relatively smaller magnitude compared to CAF-NT and MMTN.
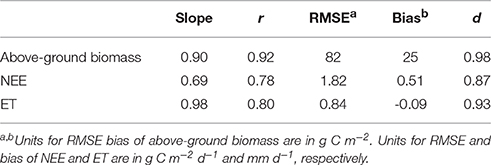
Table 4. Evaluation of modeled cumulative above-ground biomass, daily net ecosystem exchange of CO2 (NEE), and evapotranspiration (ET) for all 14 site-years.
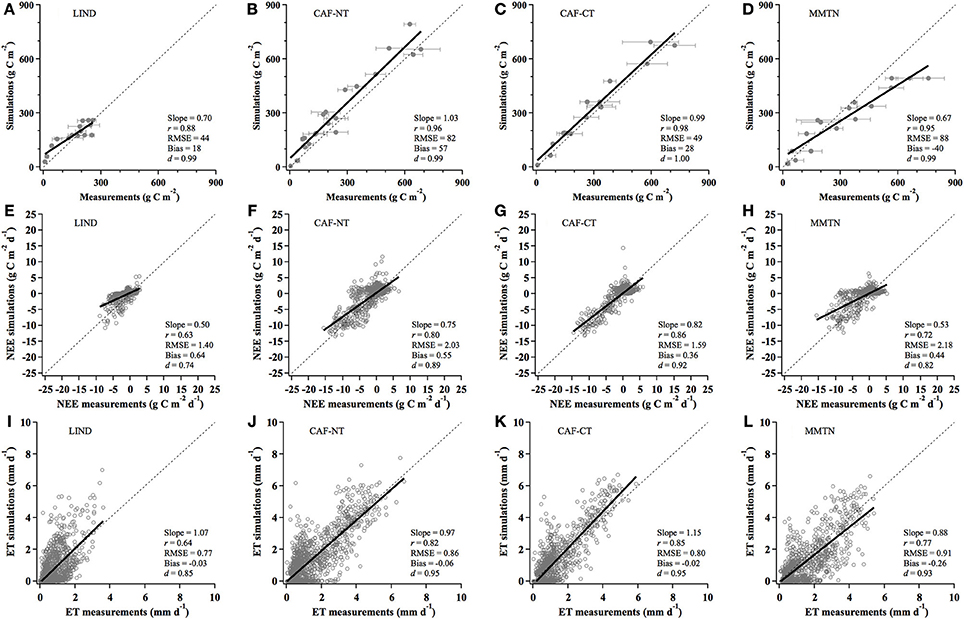
Figure 1. Scatter plots of the simulated and the measured cumulative above-ground biomass (A–D), daily net ecosystem exchange of CO2 (NEE, E–H), and daily evapotranspiration (ET, I–L) at four sites.
For each site-year, the simulated above-ground biomass generally agreed well with the observed biomass data (Figure 2). CropSyst results captured the above-ground biomass accumulation rates reasonably well for all the crop species at both no-till and conventional tillage sites (CAF-NT 2012–2015 and CAF-CT 2013–2015), winter wheat at the low-rainfall site during 2013 (LIND 2013), and the spring barely field (MMTN 2013). At LIND, the model slightly overestimated the above-ground biomass by 50–120 g C m−2 during the early growth stages in 2015 (Figure 2A). While at MMTN, CropSyst overestimated the above-ground biomass of spring pea by 50–80 g C m−2 during the MGS of 2013 and underestimated winter wheat biomass by 10–130 g C m−2 during the MGS of 2015 (Figure 2D).
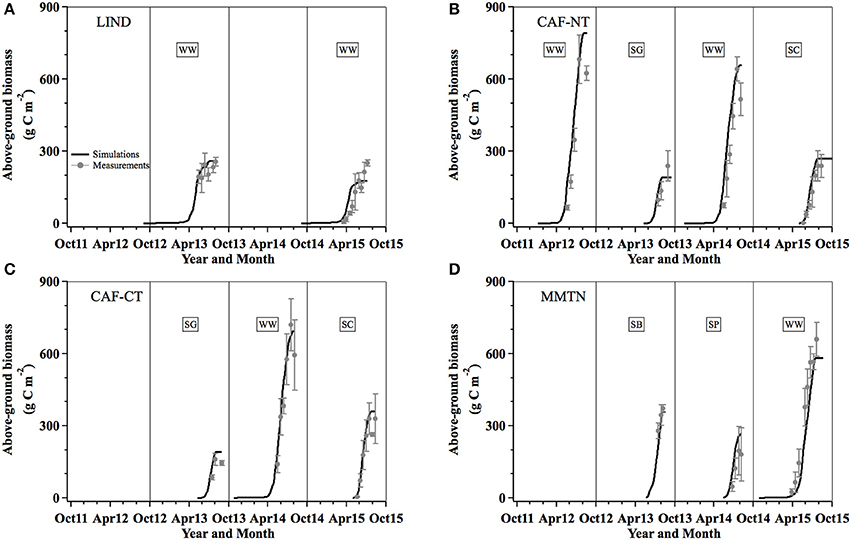
Figure 2. CropSyst modeled and field measured above-ground biomass carbon content at LIND (A), CAF-NT (B), CAF-CT (C), and MMTN (D). WW, winter wheat; SG, spring garbanzo; SC, spring canola; SB, spring barley; SP, spring pea.
Evaluation of Modeled NEE and ET
Overall Accuracy
Compared to the eddy covariance measurements for the four sites, the modeled daily NEE and ET agreed well with a high agreement index of 0.87 and 0.93, respectively, indicating a slightly better performance for ET simulations than NEE (Table 4). Statistical evaluation also showed a high correlation coefficient of 0.78 and 0.80, as well as a low RMSE of 1.82 g C m−2 d−1 and 0.84 mm d−1 for NEE and ET, respectively. Overall, the model resulted in less negative NEE (bias = 0.51 g C m−2 d−1) and slightly underestimated ET (bias = −0.09 mm d−1).
Evaluation of NEE and ET by Site
Focusing on each site individually, the highest agreement index for NEE simulations was found at CAF-CT (d = 0.92), accompanied by a high correlation coefficient (r = 0.86), a small RMSE (1.59 g C m−2 d−1), and a low bias (0.36 g C m−2 d−1) (Figure 1G). At CAF-CT, the modeled NEE captured the NEE peak values during each MGS and showed very good agreement for the growing seasons of winter wheat and spring canola in 2014 and 2015, respectively (Figure 3C). NEE simulations at CAF-NT were also in good agreement with the eddy covariance measurements, followed by MMTN and LIND (Figures 1E–H, 3A,B,D). The largest RMSE (2.18 g C m−2 d−1) was found at MMTN and was primarily attributed to the large discrepancies during each MGS, where the model underestimated the carbon sink strength of spring barley, spring pea, and winter wheat by 100–185 g C m−2 month−1 (Figure 3D). Even though LIND had the lowest RMSE (1.40 g C m−2 d−1), the other evaluation parameters, such as slope and correlation coefficient indicated fair performance (Figure 1E), therefore further in-depth comparisons (e.g., by site-year) are still needed to better evaluate the model performance for determining annual or MGS carbon sink or source for all sites.
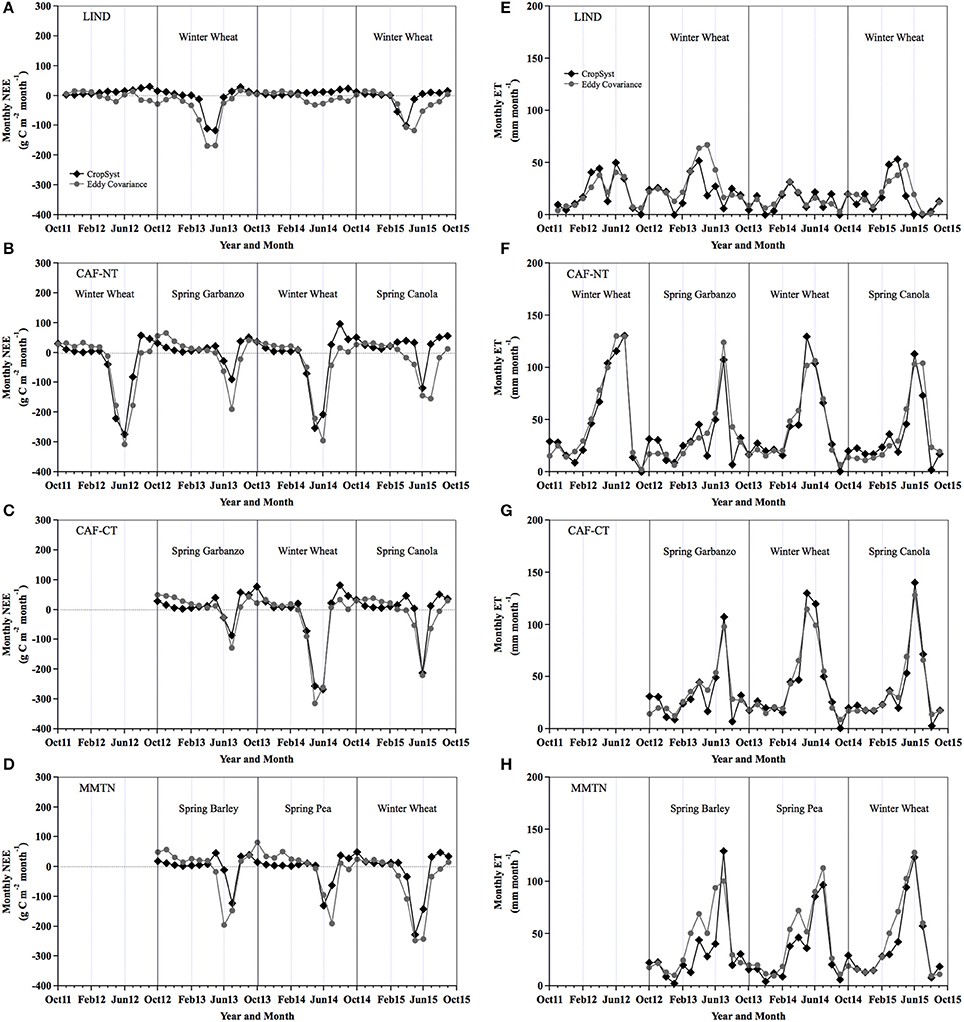
Figure 3. CropSyst and eddy covariance monthly net ecosystem exchange of CO2 (NEE, A–D) and evapotranspiration (ET, E–H) at four sites from October 2011 to September 2015.
For ET simulations, the model had very good agreement with the measured ET at each site, particularly at the three high-rainfall sites (Figures 3E–H), with d > 0.85 and r ranging from 0.64 to 0.85 (Figures 1I–L). The highest agreement index was found at CAF-NT and CAF-CT throughout the entire evaluation period. At MMTN, the model also captured the particular ET seasonal patterns during 2013 and 2014, where two ET peak periods occurred during both early spring and the MGS (Figure 3H). During these two ET peak periods, the simulated ET was slightly lower compared to the measurements for the first peak, but simulated the measurements well for the second peak period. In contrast, at LIND, even though the simulated ET values were comparable to the corresponding measured ET on average, the correlation coefficient (r = 0.64) was still relatively small compared to the three high-rainfall sites (Figure 1I). The lower r at LIND was most likely attributed to the slightly underestimated ET values over the winter wheat field during 2013 (Figure 3E).
Evaluation of Annual and MGS Cumulative NEE and ET by Site-Year
Two site-years (CAF-CT 2013 and MMTN 2014) had very comparable annual NEE magnitudes between simulations and measurements, with differences of only 6 and 38 g C m−2 for CAF-CT and MMTN, respectively. For the remaining 12 site-years, CropSyst underestimated the CO2 sink strength or overestimated the CO2 source amount by an annual difference of 63–461 g C m−2 (Figure 4A). This annual difference range was greater than the uncertainties in the measured annual NEE (6–47 g C m−2 year−1). In terms of determining if a site was a net CO2 sink, source, or neutral over an annual basis, the modeled results were consistent with the measurements for 8 out of 14 site-years. However, CropSyst did a better job on estimating the MGS cumulative NEE than the annual NEE (Figure 4B). The differences in the MGS-cumulative NEE between CropSyst and eddy covariance were 95–303 g C m−2 and the model showed agreement with the measurements for all the growing seasons, where both simulations and measurements indicated these sites were all net CO2 sinks during the MGS (Figure 4B).
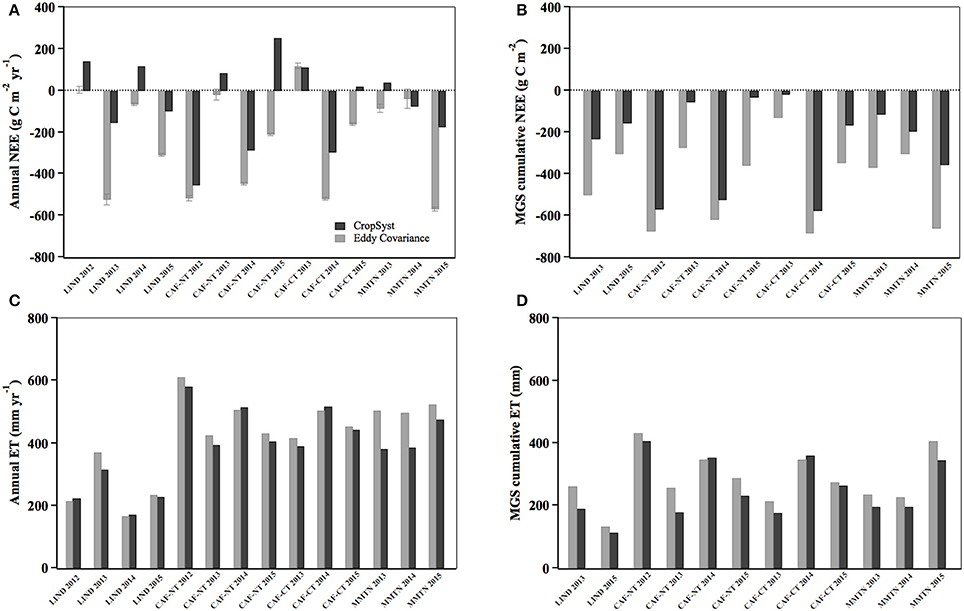
Figure 4. CropSyst and eddy covariance annual (A,C) and main growing season (MGS, B,D) cumulative net ecosystem exchange of CO2 (NEE) and evapotranspiration (ET) for each site-year. Error bars are the uncertainties in the eddy covariance annual NEE (A).
With respect to simulating the annual ET, the model performed well for 10 out of 14 site years with a small difference (2–7%) between the CropSyst simulations and the eddy covariance measurements (Figure 4C). A relatively greater annual ET difference (10–24%) was found at MMTN for all 3 years and at LIND during 2015. Differences in the MGS-cumulative ET between simulations and measurements varied greatly with sites and crops, and ranging between 1% and 31%. Simulations for the MGS-cumulative ET had better agreement (1–6% difference) with the measurements for the winter wheat fields at CAF-NT and CAF-CT, as well as the spring canola field at CAF-CT. While for the remaining 8 site-years, the modeled MGS-cumulative ET was smaller than the measured values by a MGS difference of 13–27%. Uncertainties due to random measurement errors and gap-filling uncertainty in the measured annual ET were around 2 mm year−1, accounting for a very small portion of annual ET (<1%).
Seasonal and Inter-Annual Variabilities of Modeled Carbon and Water Fluxes
CropSyst was also used to simulate other flux components to assess the seasonal and inter-annual variabilities of carbon and water budgets at each site. The simulated carbon (NEE, Reco, and GPP) and water (ET, E, and T) fluxes showed a typical seasonal pattern of larger magnitudes during the MGS and lower fluxes during the oMGS at each site (e.g., Figures 5, 6). As a result of CropSyst stomatal-related flux components (GPP and T) being set to zero prior to seeding, after harvest, and during fallow, NEE and ET were equivalent to the non-stomatal parameters, Reco (or Rh) and E, and all sites were small net CO2 sources and water was lost into the atmosphere directly during these periods. During the MGS, NEE (or ET) was affected by both GPP (or T) and Reco (or E) at all sites with GPP (or T) contributing the most (e.g., Figures 5, 6). By averaging all the non-fallow years, 96% of GPP and 99% of T occurred during the MGS. For Reco and E, the MSG fractions were 67% and 22%, respectively.
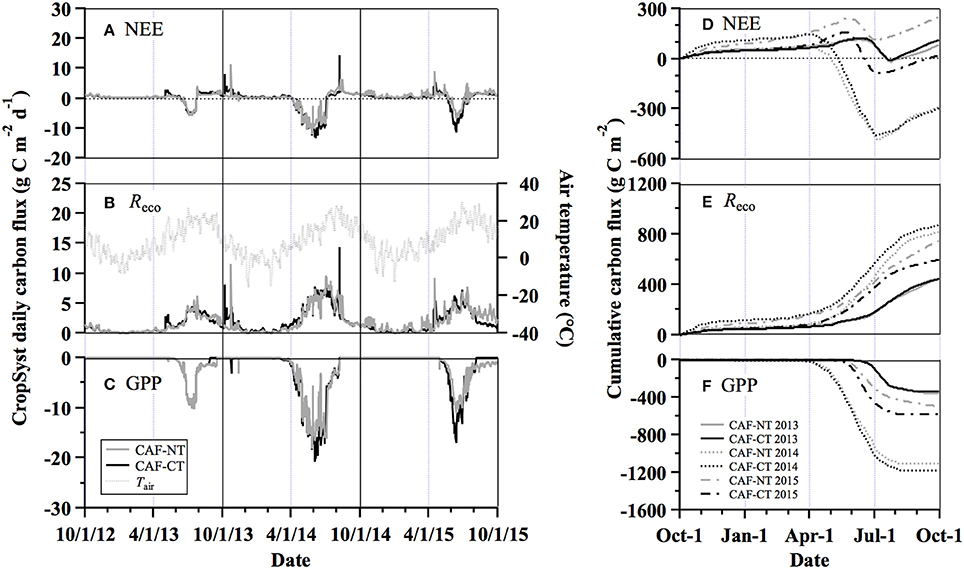
Figure 5. CropSyst daily (A–C) and cumulative (D–F) net ecosystem exchange CO2 (NEE), total ecosystem respiration (Reco), and gross primary productivity (GPP) at the no-till (CAF-NT) and the conventional tillage (CAF-CT) sites from October 1, 2012 to September 30, 2015. Daily mean air temperature (Tair) was only plotted for CAF-NT to represent the general temperature conditions at CAF.
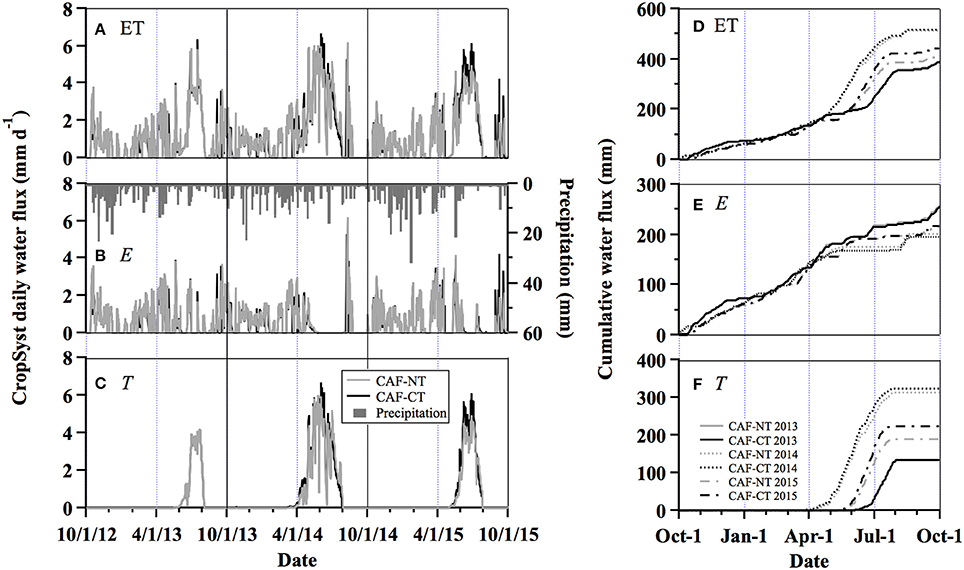
Figure 6. CropSyst daily (A–C) and cumulative (D–F) evapotranspiration (ET), soil water evaporation (E), and crop transpiration (T) at the no-till (CAF-NT) and the conventional tillage (CAF-CT) sites from October 1, 2012 to September 30, 2015. Daily precipitation measurements were only plotted for CAF-NT to represent the general precipitation conditions at CAF.
The inter-annual variabilities of carbon and water fluxes were greatly dependent on crop rotations and water availability at each site. The crops grown at the four sites encompassed typical crop rotations for the iPNW region: winter wheat-spring crops and winter wheat-tillage fallow (Table 1). Winter wheat generally had larger flux magnitudes compared to the spring crops (i.e., canola, garbanzo, barely, and pea; e.g., Figures 5, 6). Due to the different annual rainfall amounts, the high-rainfall sites (CAF-NT, CAF-CT, and MMTN) always had relatively larger magnitudes of carbon and water fluxes compared to the low-rainfall site (LIND), regardless of crop species (e.g., Figures 7, 8).
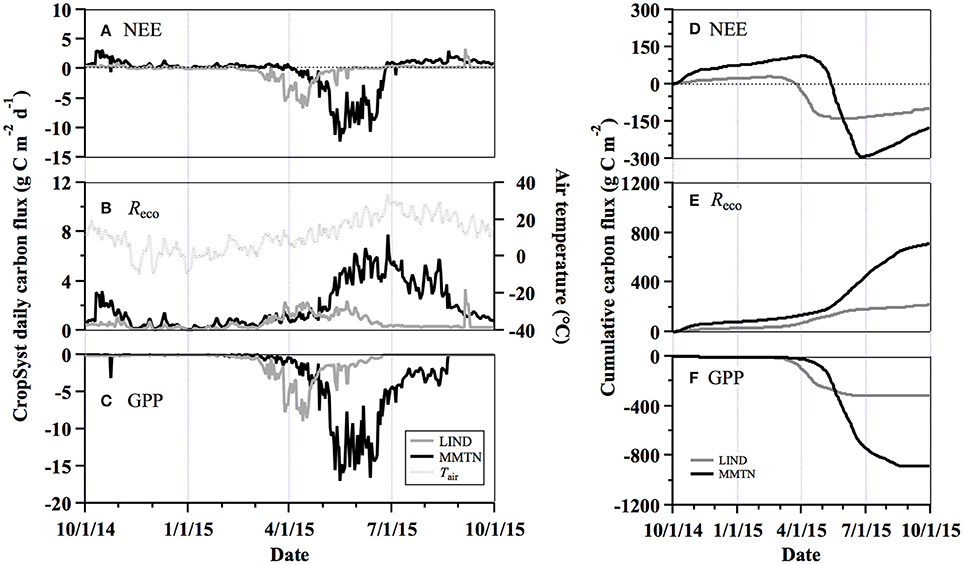
Figure 7. CropSyst daily (A–C) and cumulative (D–F) net ecosystem exchange of CO2 (NEE), total ecosystem respiration (Reco), and gross primary productivity (GPP), at the low-rainfall (LIND) and high-rainfall (MMTN) winter wheat fields during the water year of 2015. Daily air temperature (Tair) was only plotted for LIND.
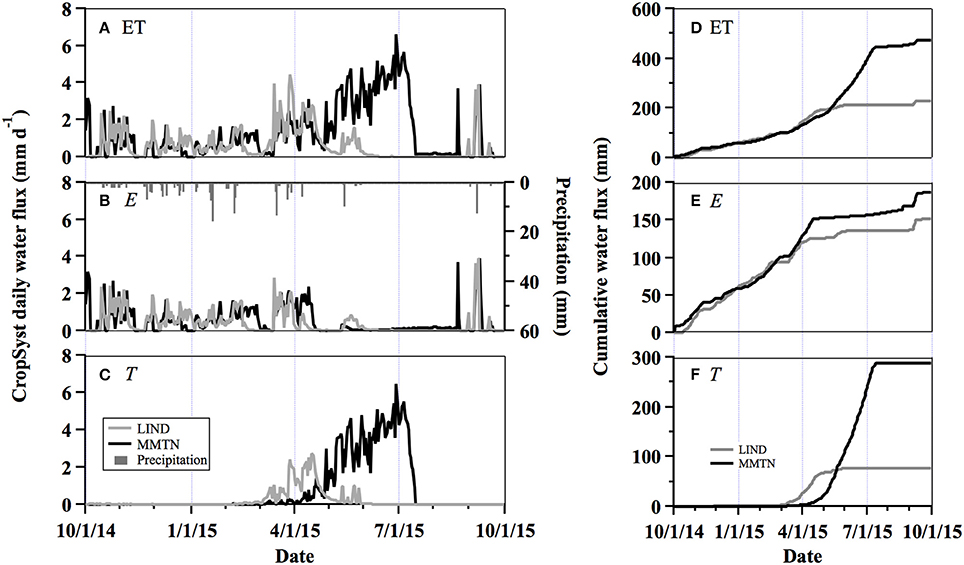
Figure 8. CropSyst daily (A–C) and cumulative (D–F) evapotranspiration (ET), soil water evaporation (E), and crop transpiration (T) at the low-rainfall (LIND) and high-rainfall (MMTN) winter wheat fields during the water year of 2015. Daily precipitation data were only plotted for LIND.
Among the 14 site-years of carbon flux simulations, the CropSyst model showed that all the spring crop fields and the tillage fallow years were net carbon sources or close to carbon neutral over an annual basis, with an annual NECB ranging from −327 to −3 g C m−2 (Table 5). The annual NECB for the winter wheat fields ranged from 92 to −17 g C m−2, suggesting either net carbon sinks or near carbon neutral annually. As the ratio of T/ET is one index indicating the proportion of water utilized for crop growth, the CropSyst water budgets implied that less water was utilized by crops than directly lost into the atmosphere at the high-rainfall spring crop fields and the low-rainfall site, with the annual T/ET less than or close to 0.5. While for the high-rainfall winter wheat fields, their annual T/ET values were >0.6 (Table 5).
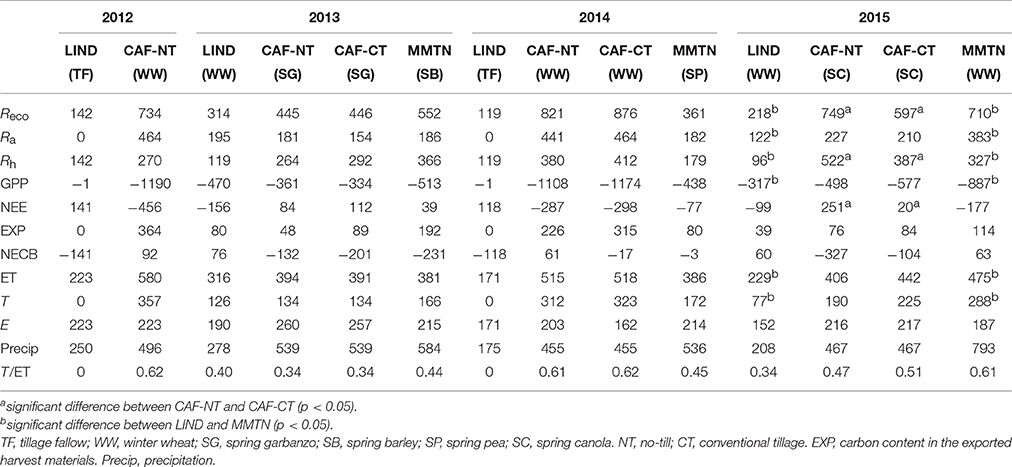
Table 5. CropSyst annual carbon (g C m−2) and water (mm) budgets for 14 site-years.
Carbon and Water Budgets at No-Till and Conventional Tillage Sites
The simulated annual NECB suggested that the no-till site was a slightly smaller net carbon source over the spring garbanzo field (−132 vs. −201 g C m−2) but was a stronger carbon source over the spring canola field (−327 vs. −104 g C m−2), compared to the conventional tillage site (Table 5). For winter wheat field, the no-till site was a net carbon sink (61 g C m−2) while the tilled site was close to carbon neutral (−17 g C m−2). Over the three water years, the average annual NECB differed by 25 g C m−2 between the two sites.
Comparing the carbon simulations between the two sites (CAF-NT and CAF-CT), major differences in their carbon budgets were attributed to the oMGS Reco and the MGS GPP (Figure 5). The CropSyst results showed that the no-till site had comparable annual Reco during the 2013 spring garbanzo year, 55 g C m−2 lower annual Reco during 2014 (winter wheat), and 152 g C m−2 greater annual Reco during 2015 (spring canola), compared to the conventional tillage site (Figure 5E, Table 5). Respiration simulations over the spring garbanzo field showed that the no-till management practice resulted in an increased amount of Ra but a comparable reduced amount of Rh compared to the conventional tillage scenario runs. For winter wheat, the no-till site had both smaller Ra and Rh compared to the conventional tillage site by an annual difference of 23 and 32 g C m−2, respectively (Table 5). While for spring canola, the modeled results suggested that the no-till practice enhanced Reco with larger contributions by Rh rather than Ra. Due to the large Reco difference over the spring canola fields, the mean annual Reco only differed by 32 g C m−2 yr−1 (5%) between CAF-NT and CAF-CT over a 3-year crop rotation of spring garbanzo-winter wheat-spring canola. Based on the paired t-test, Reco and Rh were significantly different (p < 0.05) during 2015 over the spring canola field (Table 5).
Differences in the modeled GPP and EXP varied with crop rotations. During the 2013 spring garbanzo year, the modeled GPP did not differ much between the two sites and CAF-NT had 41 g C m−2 lower EXP compared to CAF-CT. During 2014 and 2015, the conventional tillage site had more negative GPP throughout the two growing seasons and eventually had 66 and 79 g C m−2 more carbon uptake and 89 and 8 g C m−2 greater EXP relative to the no-till site for winter wheat and spring canola, respectively (Figures 5C,F, Table 5). The GPP and EXP differences in winter wheat and spring canola between the two tillage practices were also noticeable in the biomass measurements (Figure 2). During the end of the growing seasons for spring garbanzo and spring canola, CAF-NT was harvested 1-to-2 weeks later than CAF-CT and therefore resulted in a slightly longer growing simulation period compared to CAF-CT (Figure 5C).
The simulated ET, E, and T was not significantly different (p > 0.05) between CAF-NT and CAF-CT over the three water years (Table 5). For spring garbanzo and winter wheat, the modeled annual sums of ET, T, and E were similar at the two sites (Figure 6). While during 2015 (spring canola), CAF-CT had 36 mm greater annual ET than CAF-NT, primarily a result of the higher annual T (Table 5, Figures 6D–E). As a result, CAF-NT and CAF-CT had very similar T/ET ratios for spring garbanzo and winter wheat and CAF-CT had a slightly greater ratio for spring canola. Even though the annual water budgets did not vary much between the two sites, there were some subtle differences in each water flux component illustrated in the daily step simulations (Figure 6). For instance, CAF-CT had greater E compared to CAF-NT during some of the oMGS rainfall events (Figure 6B). Several small differences in T were mostly seen during the winter wheat growing season; for example, T at CAF-CT was higher than CAF-NT during the early growth stages, but slightly lower during the later MGS (Figure 6C). These small differences in T also corresponded with the GPP patterns.
Carbon and Water Budgets at Low- and High-Rainfall Winter Wheat Fields
Winter wheat was grown at both high- and low-rainfall sites (MMTN and LIND) during 2015. All CropSyst carbon and water flux components differed greatly between MMTN and LIND, with Reco, GPP, ET, and T significantly different (p < 0.05) between the two sites (Table 5). Limited by the water availability, the magnitude of Reco was much smaller at LIND compared to MMTN over the entire water year (Figures 7B,E), thus resulting in 492 g C m−2 lower annual Reco relative to MMTN (Table 5). The rainfall influence on the simulated Reco was relatively small during the oMGS, as respiration rates were primarily inhibited by the low air temperature during this period. While during the MGS, the modeled Reco at LIND was <30% of the Reco at MMTN, which was mostly attributed to the different rainfall amounts at the two sites, even though the majority of the rainfall occurred during the oMGS (Figures 7B, 8B). Similar to the Reco patterns at the two sites, MMTN annual GPP (−887 g C m−2) was estimated to be much greater in magnitude compared to LIND (−317 g C m−2). LIND also had a shorter growing season compared to MMTN due to the influence of rainfall (Figure 7C). In CropSyst, winter wheat at LIND began growing earlier and faster than MMTN during March and April, due to the warmer weather conditions and the stored soil water content from the previous fallow year (Figure 7C). Influenced by both Reco and GPP flux components, winter wheat at MMTN had a larger annual NEE magnitude (−177 g C m−2), compared to LIND (−99 g C m−2). In terms of EXP simulations, the high-rainfall site obtained a much higher crop yield (114 g C m−2) compared to the low-rainfall site (39 g C m−2). Combining annual NEE and EXP together, over the water year of 2015, both sites were estimated as net carbon sinks with a similar annual NECB magnitude, 60 and 63 g C m−2 for LIND and MMTN, respectively.
In 2015, the simulated annual ET was 229 and 475 mm at LIND and MMTN, respectively, with an annual T difference contributing the most (Table 5). From October 2014 to March 2015, the cumulative ET did not vary much between the two sites and the slightly higher ET at MMTN was primarily attributed to the relatively higher E flux component (Figures 8D,E). Starting in April 2015, T increased quickly at LIND as a result of earlier crop growth compared to MMTN and therefore resulted in a comparable cumulative ET to MMTN in May 2015 (Figure 8D). However, starting in June, both cumulative T and E started increasing at MMTN, while water fluxes at LIND remained nearly constant due to the dry conditions and the short growing season. The estimated T/ET ratio was 0.34 and 0.61 for LIND and MMTN, respectively, with a higher fraction of water directly evaporating into the atmosphere at LIND.
Discussion
Model Performance and Evaluation
Through model evaluations for all 14 site-years, we found that CropSyst performed well for simulating biomass and water budgets, as well as determining if a site was an annual carbon sink or source. Therefore, CropSyst can provide reliable daily, annual, and long-term simulations for agricultural carbon and water dynamics over a field-scale.
Overall, the model had better performance for CAF-NT and CAF-CT sites, compared to LIND and MMTN. Both CAF-NT and CAF-CT are located at the research site operated by Washington State University (WSU), vs. the LIND and MMTN sites that are managed by local growers cooperating with WSU. As a result, the more detailed site-specific management practices, such as seeding and harvest dates, tillage types and depths, and fertilization types and rates, were available at CAF-NT and CAF-CT compared to the other two sites. These management practices greatly affected the carbon and water budgets, as the inter-annual variability of carbon and water fluxes is mainly driven by these indirect effects (e.g., the altered soil microbial community by tillage), rather than the direct effects from the short-term environmental forcing, such as temperature and moisture (Chu et al., 2016). Additional conditions that may contribute to reduced model performance include site history, which is critical for setting the model initial conditions (e.g., soil organic matter and residue contents). This model input information should ideally be based on specific field measurements, which was partially available at CAF-NT and CAF-CT in this study. Uncertainties in the initial SOC and residue conditions affected the Rh simulations and thus carbon budget simulations in CropSyst.
Because CropSyst does not provide Ra simulations directly, Ra was estimated based on simulated biomass production and coefficients of growth and maintenance respiration per unit of biomass produced. Therefore, Ra simulations are sensitive to the values chosen for the respiration coefficients. Due to the lack of specific crop variety information, crop parameters were set identically for the same crop species at all sites. For example, crop parameters for winter wheat were the same for CAF and MMTN, resulting in earlier simulated maturity of winter wheat at MMTN and insufficient accumulation of biomass at harvest compared to the measurements. Adequate information for crop model parameterization reduces sources of modeling uncertainty (Confalonieri and Bechini, 2004; Singh et al., 2013). One known weakness of this work is the lack of CropSyst simulations of weed growth during the oMGS or the fallow periods at all sites, which contributed to an underestimated carbon sink strength during these periods. Particularly during the fallow years, there was an important amount of carbon uptake by weeds with an annual GPP of −519 ± 21 g C m−2 (Waldo et al., 2016).
Uncertainty related to the input parameters may be even larger for some crops that have not been well studied (e.g., spring garbanzo or canola), but this can be improved by model validation and calibration using more measurement data over multiple cropping systems. On the other hand, uncertainties in the eddy covariance measurements may also affect the model performance evaluation, such as gap-filling uncertainties and uncertainties during stable and calm nighttime conditions.
Tillage Practice Effects on Annual Cropping Area
CropSyst was used to assess the tillage effects on carbon and water budgets in this study. The simulations for the paired till and no-till sites had identical model inputs (e.g., crop species, meteorological variables, and seeding rates) with the exceptions of soil conditioning indices and initial conditions for soil organic matter. The different settings for soil conditions were used to account for the tillage effects within CropSyst (Stöckle et al., 2012). As few monitoring studies have been done to investigate the long-term tillage effects on carbon and water budgets, the CropSyst simulations provide an insight of the feasibility of implementing a certain tillage practice over different crop species. The modeled results showed that the difference in the mean annual NECB between CAF-NT and CAF-CT was relatively small and within the uncertainty range of both model simulations and eddy covariance measurements over agricultural ecosystems. The measurement uncertainty in annual carbon budgets is in the range of 18–50 g C m−2 (e.g., Béziat et al., 2009; Schmidt et al., 2012; Chi et al., 2016; Waldo et al., 2016) and the modeling uncertainty is even larger, 50–110 g C m−2 in annual carbon budget or 10–15% in grain yields (Rotter et al., 2012; Chen et al., 2015). Therefore, differences in the long-term averaged carbon budgets between no-till and conventional tillage practices may become less significant under the crop rotations of winter wheat-spring crops in the long run.
By investigating the tillage effects on each carbon flux component over different crops, CropSyst showed greater crop yields for spring garbanzo, winter wheat, and spring canola associated with the conventional tillage practice, most likely resulting from precipitation interception by the residue cover in no-till practice, decreasing the amount of water reaching the soil. Similar results were also found in other studies (Dalrymple et al., 1993; Rasmussen et al., 1997; Kettler et al., 2000; Lopez-Bellido et al., 2000; Rieger et al., 2008; Ogle et al., 2012).
The no-till benefits of reduced Reco and Rh over the spring garbanzo and the winter wheat fields was primarily due to the fact that no-till practice reduces soil-residue contact, and slows down SOC oxidation and residue decomposition (Kessavalou et al., 1998; Koga et al., 2003; Dong et al., 2008; Li et al., 2010; Chang et al., 2013; Gollany, 2016; Hu et al., 2016; Lu et al., 2016). Comparing CropSyst to the DayCENT model showed that over the winter wheat field, the Rh difference between the two sites in CropSyst is comparable to the DayCENT model simulations as reported by Chang et al. (2013). However, CropSyst results showed that no-till management practice resulted in increased Reco for spring canola and almost identical Reco for spring garbanzo, indicating that crop rotations also affected agricultural CO2 emissions, especially during the growing season (Omonode et al., 2007). As there were very few studies in the literature review related to tillage impacts on CO2 emissions from the spring garbanzo and the spring canola fields, the only available comparison was with Reco modeled based on corresponding eddy covariance NEE and other data. The Reco derived from the measurements showed that the no-till site had a significant lower annual Reco compared to the conventional tillage over the spring garbanzo field (Chi et al., 2016) and the spring canola field. Therefore, more studies on tillage impacts on Reco over spring crops are needed to validate the modeling results. In summary, the modeled results suggested that no-till can either increase or decrease Reco, greatly depending on crop species. As the increased Reco by no-till practice for spring crops offset the reduced Reco over winter wheat field, the model showed the mean annual Reco did not vary much between the two tillage sites over the three water years. A similar finding was also reported in Campos et al. (2011) where they found no significant difference in annual average CO2 emissions between tilled and no-till systems.
Comparing the simulated daily Reco between the two sites over the course of three water years, the Reco at the conventional tillage site reacted more intensely to the rainfall events, which was presumably due to the “Birch Effects”, where rainfall events after a drought period can induce respiration pulses (Birch, 1958). This was also found in other studies, such as Fierer and Schimel (2003), Jarvis et al. (2007), Unger et al. (2010), and Ma et al. (2012). The impact of rainfall events under no-till management is somewhat reduced due to residue interception of rainfall, particularly with infrequent and low amount rainfall events. Higher Reco at the conventional tillage site after each seeding event was attributed to the enhanced Rh under the warmer and tilled soil conditions, which was also observed in other studies (Dwyer et al., 1995, 1996; Ben Moussa-Machraoui et al., 2010; Derpsch et al., 2010; Aziz et al., 2013).
The similar modeled water budgets at the two sites suggested that tillage practices had insignificant effects on ET, which has also been found over different crop fields, such as winter wheat, spring garbanzo, canola, corns, and soybean (Borstlap and Entz, 1994; Tan et al., 2002; Liu et al., 2013; Zhang et al., 2013; Guan et al., 2015; Chi et al., 2016). Daily E differences between the two sites were a good indicator of how the different soil conditions affect the direct water losses from the soil surfaces. Similar to the previous studies, we found that during the oMGS rainfall events, the simulated E was suppressed by the residue cover layer at the no-till site compared to the bare and disturbed soils at the conventional tillage site (Salado-Navarro and Sinclair, 2009; van Donk and Klocke, 2012; Wang et al., 2014). This amount of reduced E at CAF-NT was mostly affected by rainfall frequency rather than rainfall amounts, which was also supported by van Donk et al. (2010) where they found the different magnitude in E between residue-covered and bare soils increased during the infrequent and light rainfall events. One example of this is the September 2015 rain events on the 6, 17, and 18th (10.2, 1.5, and 4.6 mm rainfall, respectively) that resulted in the largest difference in simulated E between CAF-NT and CAF-CT (Figure 6B). The simulated daily T was only influenced by tillage practices during the winter wheat growing season and the difference between CAF-NT and CAF-CT was consistent with the finding in Guan et al. (2015) where they concluded that ET (mostly T during MGS) under tilled conditions was greater than ET under no-till from seeding to flowering stages, but smaller at the ripening stage.
Rainfall Effects on Winter Wheat Fields
In 2015, winter wheat was grown at the low- and high-rainfall sites (LIND and MMTN), and comparing the CropSyst results between these two sites provided a direct comparison of carbon and water budgets between different rainfall zones in the iPNW region during the same year. Through validating the model performance for assessing the rainfall effects, CropSyst can be applied to study the impacts of future climatic conditions on the field-scale carbon and water cycling. As expected, the high-rainfall area had greater winter wheat crop yield and the limited rainfall in the crop-fallow area greatly restricted crop productivity (Musick et al., 1994; Lindwall et al., 1995). Large rainfall amounts and frequent rainfall events increased the simulated Reco by enhancing Rh during the oMGS and Ra during the MGS at MMTN. The frequent rainfall events during the oMGS greatly enhanced soil microbial activity under the disturbed soil conditions at MMTN, which was also observed by Calderon and Jackson (2002); Zhou et al. (2006); Jiang et al. (2013), and Gong et al. (2015). In addition, MMTN had sufficient water for winter wheat growth, therefore Ra was also much higher compared to LIND where both crop growth and crop respiration were limited by the dry summer. On an annual basis, both sites were net carbon sinks with a comparable NECB magnitude. Higher yields at MMTN enhanced GPP, but larger soil (higher SOC content) and crop (higher biomass) respiration offset GPP and resulted in a relative smaller NEE compared to other high-rainfall winter wheat fields. However, the larger amount of residues produced at MMTN maintained a larger SOC stock.
Based on Liu et al. (2002), the average total water consumption for winter wheat is approximately 450 mm assuming no water stress conditions. The amount of water available at LIND during 2015 was only half of this, even though LIND stored some soil water content from the previous fallow year. According to the CropSyst results, winter wheat was growing under water stress conditions at LIND during 2015, therefore resulting in a much smaller annual ET compared to MMTN and the average value (450 mm). Because of sufficient rainfall during 2015, annual ET at MMTN was comparable to the average water consumption of winter wheat. Based on the difference between annual ET and annual precipitation at MMTN, more than 40% of annual rainfall amount was either stored in the soil or lost via surface runoff. According to the field measurements during 2013–2015, the average runoff was typically <10% of the precipitation and the year of 2015 had 71 mm (9%) surface runoff.
Due to the water stress at LIND, T/ET was significantly lower compared to other studies on winter wheat water use efficiency, where annual T typically accounts for 60–75% of annual ET (Gregory et al., 1992; Liu et al., 2002; Sun et al., 2006; Chen et al., 2010; Aouade et al., 2016). More than 60% of ET was estimated to be lost directly into the atmosphere, which was likely due to the less dense crop coverage at LIND compared to MMTN (seen in the biomass measurements and the time-lapse camera), as E typically increases with the winter wheat row spacing (Sun et al., 2006; Chen et al., 2010). T/ET at MMTN was within the average water use efficiency range (0.60–0.75), with the majority of evaporation occurring during the early MGS (March and April). Therefore, the seasonal rainfall distribution also greatly affected the annual water budget and water use efficiency.
Conclusions
Compared to the eddy covariance measurements, the CropSyst model performed well in simulating NEE and ET at all sites with an overall r of 0.78 and 0.80 and a RMSE of 1.82 g C m−2 d−1 and 0.84 mm d−1, respectively. Overall, the model slightly underestimated the carbon sink strength and the total water consumption by 0.51 g C m−2 d−1 and 0.09 mm d−1, respectively. Carbon budget simulations showed that the winter wheat fields in the iPNW region were either net carbon sinks or near carbon neutral (NECB, 92 to −17 g C m−2), while the fallow site and the spring crop fields were net carbon sources or neutral (NECB, −327 to −3 g C m−2) over an annual basis. Annual water budget simulations indicated that water use efficiency (T/ET) was significantly lower over the spring crop fields and the low-rainfall winter wheat field (0.34–0.51), compared to the high-rainfall winter wheat fields (0.61–0.62).
The seasonal and inter-annual variability of carbon and water budgets also agreed well with the eddy covariance measurements. The inter-annual variations of each flux component were greatly affected by crop rotations and meteorological conditions, with winter wheat and high-rainfall sites typically having larger magnitudes of carbon and water fluxes, compared to the spring and the low-rainfall site.
CropSyst output was used to assess the impacts of tillage practices and rainfall on agricultural carbon and water budgets in the iPNW region. The modeled results suggested that no-till practice resulted in lower carbon losses from the winter wheat and spring garbanzo fields but higher CO2 emissions from the spring canola field compared to the conventional tillage. Tillage practices showed varied effects on crop yields, strongly depending on crop species. Therefore, more studies will be needed to further investigate the tillage effects on different crop species. Water budget simulations did not differ significantly between the two tillage systems. Compared to the low-rainfall winter wheat field, the high-rainfall site obtained greater winter wheat crop yield and higher water use efficiency but had higher CO2 emissions.
In summary, the CropSyst model can be used as a practical tool to assess the field-scale carbon and water budgets. Future work associated with improving the model performance for site-specific simulations includes using more detailed management practices as model input, calibrating the model with measurements over various crop species, obtaining adequate model initial conditions for each site-year.
Author Contributions
PO, SW, JC, and EB contributed to the field data collection. JC, SW, SP, and BL contributed to eddy covariance data processing. FM and CS provided the modeling results. JC and FM prepared the figures and tables. JC, FM, SW, SP, CS, BL, WP, DH, and EB conducted the data analysis and interpretation. All authors contributed to the writing of the manuscript.
Conflict of Interest Statement
The authors declare that the research was conducted in the absence of any commercial or financial relationships that could be construed as a potential conflict of interest.
The reviewer BB and handling Editor declared their shared affiliation, and the handling Editor states that the process nevertheless met the standards of a fair and objective review.
Acknowledgments
This research is supported by the Regional Approaches to Climate Change for Pacific Northwest Agriculture (REACCH-PNA) project which is funded through award #2011-68002-30191 from the National Institute of Food and Agriculture. We would like to acknowledge the rest of the REACCH Objective 2 and 3 team members and thank Mike Dymkoski for providing the detailed farming activities at the CAF-NT site.
Supplementary Material
The Supplementary Material for this article can be found online at: https://www.frontiersin.org/article/10.3389/fevo.2017.00050/full#supplementary-material
References
AgWeatherNet (2016). Washington State University's AgWeatherNet Network, (Pullman, WA), Available online at: http://weather.wsu.edu/
Amthor, J. S. (2000). The McCree-de Wit-Penning de Vries-Thornley respiration paradigms: 30 years later. Ann. Bot. 86, 1–20. doi: 10.1006/anbo.2000.1175
Aouade, G., Ezzahar, J., Amenzou, N., Er-Raki, S., Benkaddour, A., Khabba, S., et al. (2016). Combining stable isotopes, eddy covariance system and meteorological measurements for partitioning evapotranspiration, of winter wheat, into soil evaporation and plant transpiration in a semi-arid region. Agric. Water Manage. 177, 181–192. doi: 10.1016/j.agwat.2016.07.021
Aubinet, M., Moureaux, C., Bodson, B., Dufranne, D., Heinesch, B., Suleau, M., et al. (2009). Carbon sequestration by a crop over a 4-year sugar beet/winter wheat/seed potato/winter wheat rotation cycle. Agric. For. Meteorol. 149, 407–418. doi: 10.1016/j.agrformet.2008.09.003
Aziz, I., Mahmood, T., and Islam, K. R. (2013). Effect of long term no-till and conventional tillage practices on soil quality. Soil Tillage Res. 131, 28–35. doi: 10.1016/j.still.2013.03.002
Baldocchi, D. D. (2003). Assessing the eddy covariance technique for evaluating carbon dioxide exchange rates of ecosystems: past, present and future. Global Change Biol. 9, 479–492. doi: 10.1046/j.1365-2486.2003.00629.x
Ball, B. C., Scott, A., and Parker, J. P. (1999). Field N2O, CO2 and CH4 fluxes in relation to tillage, compaction and soil quality in Scotland. Soil Tillage Res. 53, 29–39. doi: 10.1016/S0167-1987(99)00074-4
Bater, C. W., Coops, N. C., Wulder, M. A., Hilker, T., Nielsen, S. E., McDermid, G., et al. (2011). Using digital time-lapse cameras to monitor species-specific understorey and overstorey phenology in support of wildlife habitat assessment. Environ. Monit. Assess. 180, 1–13. doi: 10.1007/s10661-010-1768-x
Benli, B., Pala, M., Stockle, C., and Oweis, T. (2007). Assessment of winter wheat production under early sowing with supplemental irrigation in a cold highland environment using CropSyst simulation model. Agric. Water Manage. 93, 45–53. doi: 10.1016/j.agwat.2007.06.014
Ben Moussa-Machraoui, S., Errouissi, F., Ben-Hammouda, M., and Nouira, S. (2010). Comparative effects of conventional and no-tillage management on some soil properties under Mediterranean semi-arid conditions in northwestern Tunisia. Soil Tillage Res. 106, 247–253. doi: 10.1016/j.still.2009.10.009
Bernacchi, C. J., Hollinger, S. E., and Meyers, T. (2005). The conversion of the corn/soybean ecosystem to no-till agriculture may result in a carbon sink. Global Change Biol. 11, 1867–1872. doi: 10.1111/j.1365-2486.2005.01050.x
Béziat, P., Ceschia, E., and Dedieu, G. (2009). Carbon balance of a three crop succession over two cropland sites in South West France. Agric. For. Meteorol. 149, 1628–1645. doi: 10.1016/j.agrformet.2009.05.004
Birch, H. F. (1958). Pattern of humus decomposition in East African soils. Nature 181, 788–788. doi: 10.1038/181788a0
Bondeau, A., Smith, P. C., Zaehle, S., Schaphoff, S., Lucht, W., Cramer, W., et al. (2007). Modelling the role of agriculture for the 20th century global terrestrial carbon balance. Global Change Biol. 13, 679–706. doi: 10.1111/j.1365-2486.2006.01305.x
Bond-Lamberty, B., and Thomson, A. (2010). Temperature-associated increases in the global soil respiration record. Nature 464, 579–582. doi: 10.1038/nature08930
Borstlap, S., and Entz, M. H. (1994). Zero-tillage influence on canola, field pea and wheat in a dry subhumid region: agronomic and physiological response. Can. J. Plant. Sci. 74, 411–420. doi: 10.4141/cjps94-078
Calderon, F. J., and Jackson, L. E. (2002). Rototillage, disking, and subsequent irrigation: effects on soil nitrogen dynamics, microbial biomass, and carbon dioxide efflux. J. Environ. Qual. 31, 752–758. doi: 10.2134/jeq2002.0752
Campos, B. H. C., Amado, T. J. C., Tornquist, C. G., Nicoloso, R. D., and Fiorin, J. E. (2011). Long-term C-CO2 emissions and carbon crop residue mineralization in an oxisol under different tillage and crop rotation systems. Rev. Bras. Ciênc. Solo 35, 819–832. doi: 10.1590/S0100-06832011000300017
Cannell, M. G. R., and Thornley, J. H. M. (2000). Modelling the components of plant respiration: some guiding principles. Ann. Bot. 85, 45–54. doi: 10.1006/anbo.1999.0996
Chang, K. H., Warland, J., Voroney, P., Bartlett, P., and Wagner-Riddle, C. (2013). Using DayCENT to simulate carbon dynamics in conventional and no-till agriculture. Soil Sci. Soc. Am. J. 77, 941–950. doi: 10.2136/sssaj2012.0354
Chapin, F. S. III., Woodwell, G. M., Randerson, J. T., Rastetter, E. B., Lovett, G. M., Baldocchi, D. D., et al. (2006). Reconciling carbon-cycle concepts, terminology, and methods. Ecosystems 9, 1041–1050. doi: 10.1007/s10021-005-0105-7
Chen, M., Griffis, T. J., Baker, J., Wood, J. D., and Xiao, K. (2015). Simulating crop phenology in the community land model and its impact on energy and carbon fluxes. J. Geophys. Res. Biogeosci. 120, 310–325. doi: 10.1002/2014JG002780
Chen, S. Y., Zhang, X. Y., Sun, H. Y., Ren, T. S., and Wang, Y. M. (2010). Effects of winter wheat row spacing on evapotranpsiration, grain yield and water use efficiency. Agric. Water Manage. 97, 1126–1132. doi: 10.1016/j.agwat.2009.09.005
Chi, J., Waldo, S., Pressley, S., O'Keeffe, P., Huggins, D., Stöckle, C., et al. (2016). Assessing carbon and water dynamics of no-till and conventional tillage cropping systems in the inland Pacific Northwest US using the eddy covariance method. Agric. For. Meteorol. 218–219, 37–49. doi: 10.1016/j.agrformet.2015.11.019
Chu, H., Chen, J., Gottgens, J. F., Desai, A. R., Ouyang, Z., and Qian, S. S. (2016). Response and biophysical regulation of carbon dioxide fluxes to climate variability and anomaly in contrasting ecosystems in northwestern Ohio, USA. Agric. For. Meteorol. 220, 50–68. doi: 10.1016/j.agrformet.2016.01.008
Confalonieri, R., Acutis, M., Bellocchi, G., and Donatelli, M. (2009). Multi-metric evaluation of the models WARM, CropSyst, and WOFOST for rice. Ecol. Modell. 220, 1395–1410. doi: 10.1016/j.ecolmodel.2009.02.017
Confalonieri, R., and Bechini, L. (2004). A preliminary evaluation of the simulation model CropSyst for alfalfa. Eur. J. Agron. 21, 223–237. doi: 10.1016/j.eja.2003.08.003
Dalrymple, A. W., Miller, S. D., and Fornstrom, K. J. (1993). Soil-water conservation and winter-wheat yield in 3 fallow systems. J. Soil Water Conserv. 48, 53–57.
Derpsch, R., Friedrich, T., Kassam, A., and Li, H. (2010). Current status of adoption of no-till farming in the world and some of its main benefits. Int. J. Agric. Biol. Eng. 3, 1–25. doi: 10.3965/j.issn.1934-6344.2010.01.0-0
Donatelli, M., Stöckle, C., Ceotto, E., and Rinaldi, M. (1997). Evaluation of CropSyst for cropping systems at two locations of northern and southern Italy. Eur. J. Agron. 6, 35–45. doi: 10.1016/S1161-0301(96)02029-1
Dong, W., Hu, C., Chen, S., and Zhang, Y. (2008). Tillage and residue management effects on soil carbon and CO2 emission in a wheat-corn double-cropping system. Nutr. Cycling Agroecosyst. 83:27. doi: 10.1007/s10705-008-9195-x
Douglas, C. L., Rickman, R. W., Klepper, B. L., Zuzel, J. F., and Wysocki, D. J. (1992). Agroclimatic zones for dryland winter-wheat producing areas of Idaho, Washington, and Oregon. Northwest Sci. 66, 26–34.
Dwyer, L. M., Ma, B. L., Hayhoe, H. N., and Culley, J. L. B. (1995). Tillage effects on soil temperature, shoot dry matter accumulation and corn grain yield. J. Sustainable Agric. 5, 85–99. doi: 10.1300/J064v05n01_07
Dwyer, L. M., Ma, B. L., Stewart, D. W., Hayhoe, H. N., Balchin, D., Culley, J. L. B., et al. (1996). Root mass distribution under conventional and conservation tillage. Can. J. Soil Sci. 76, 23–28. doi: 10.4141/cjss96-004
Estévez, J., Gavilán, P., and Giráldez, J. V. (2011). Guidelines on validation procedures for meteorological data from automatic weather stations. J. Hydrol. 402, 144–154. doi: 10.1016/j.jhydrol.2011.02.031
Fierer, N., and Schimel, J. P. (2003). A proposed mechanism for the pulse in carbon dioxide production commonly observed following the rapid rewetting of a dry soil. Soil Sci. Soc. Am. J. 67, 798–805. doi: 10.2136/sssaj2003.0798
Gollany, H. (2016). “CQESTR simulation of dryland agroecosystem soil organic carbon changes under climate change Scenarios,” in Synthesis and Modeling of Greenhouse Gas Emissions and Carbon Storage in Agricultural and Forest Systems to Guide Mitigation and Adaptation, eds S. J. DelGrosso, L. R. Ahuja and W. J. Parton (Madison, WI: American Society of Agronomy, Inc.; Crop Science Society of America, Inc.; Fitchburg, WI: Soil Science Society of America, Inc.), 59–87.
Gong, J., Xu, S., Wang, Y., Luo, Q., Liu, M., and Zhang, W. (2015). Effect of irrigation on the soil respiration of constructed grasslands in Inner Mongolia, China. Plant Soil 395, 159–172. doi: 10.1007/s11104-015-2534-1
Gregory, P. J., Tennant, D., and Belford, R. K. (1992). Root and shoot growth, and water and light use efficiency of barley and wheat crops grown on a shallow duplex soil in a Mediterranean-type environment. Aust. J. Agric. Res. 43, 555–573. doi: 10.1071/AR9920555
Guan, D. H., Zhang, Y. S., Al-Kaisi, M. M., Wang, Q. Y., Zhang, M. C., and Li, Z. H. (2015). Tillage practices effect on root distribution and water use efficiency of winter wheat under rain-fed condition in the North China Plain. Soil Tillage Res. 146, 286–295. doi: 10.1016/j.still.2014.09.016
Holzworth, D. P., Snow, V., Janssen, S., Athanasiadis, I. N., Donatelli, M., Hoogenboom, G., et al. (2015). Agricultural production systems modelling and software: current status and future prospects. Environ. Modell. Software 72, 276–286. doi: 10.1016/j.envsoft.2014.12.013
Hu, F. L., Gan, Y. T., Cui, H. Y., Zhao, C., Feng, F. X., Yin, W., et al. (2016). Intercropping maize and wheat with conservation agriculture principles improves water harvesting and reduces carbon emissions in dry areas. Eur. J. Agron. 74, 9–17. doi: 10.1016/j.eja.2015.11.019
Huggins, D., Rupp, R., Gessler, P., Pan, W. L., Brown, D., Machado, S., et al. (2011). “Dynamic agroecological zones for the inland Pacific Northwest, USA,” in Proceedings of American Geophysical Union Fall Meeting (San Francisco, CA).
Jalota, S. K., Kaur, H., Ray, S. S., Tripathi, R., Vashisht, B. B., and Bal, S. K. (2012). Mitigating future climate change effects by shifting planting dates of crops in rice-wheat cropping system. Reg. Environ. Change 12, 913–922. doi: 10.1007/s10113-012-0300-y
Jarvis, P., Rey, A., Petsikos, C., Wingate, L., Rayment, M., Pereira, J., et al. (2007). Drying and wetting of Mediterranean soils stimulates decomposition and carbon dioxide emission: the “Birch effect.” Tree Physiol. 27, 929–940. doi: 10.1093/treephys/27.7.929
Jiang, H., Deng, Q., Zhou, G., Hui, D., Zhang, D., Liu, S., et al. (2013). Responses of soil respiration and its temperature/moisture sensitivity to precipitation in three subtropical forests in southern China. Biogeosciences 10, 3963–3982. doi: 10.5194/bg-10-3963-2013
Kemanian, A. R., and Stöckle, C. O. (2010). C-Farm: a simple model to evaluate the carbon balance of soil profiles. Eur. J. Agron. 32, 22–29. doi: 10.1016/j.eja.2009.08.003
Kessavalou, A., Mosier, A. R., Doran, J. W., Drijber, R. A., Lyon, D. J., and Heinemeyer, O. (1998). Fluxes of carbon dioxide, nitrous oxide, and methane in grass sod and winter wheat-fallow tillage management. J. Environ. Qual. 27, 1094–1104. doi: 10.2134/jeq1998.00472425002700050015x
Kettler, T. A., Lyon, D. J., Doran, J. W., Powers, W. L., and Stroup, W. W. (2000). Soil quality assessment after weed-control tillage in a no-till wheat-fallow cropping system. Soil Sci. Soc. Am. J. 64, 339–346. doi: 10.2136/sssaj2000.641339x
Koga, N., Tsuruta, H., Tsuji, H., and Nakano, H. (2003). Fuel consumption-derived CO2 emissions under conventional and reduced tillage cropping systems in northern Japan. Agric. Ecosyst. Environ. 99, 213–219. doi: 10.1016/S0167-8809(03)00132-4
Lasslop, G., Reichstein, M., Papale, D., Richardson, A. D., Arneth, A., Barr, A., et al. (2010). Separation of net ecosystem exchange into assimilation and respiration using a light response curve approach: critical issues and global evaluation. Global Change Biol. 16, 187–208. doi: 10.1111/j.1365-2486.2009.02041.x
Law, B. E., Arkebauer, T. J., Campbell, J. L., Chen, J., Sun, O., Schwartz, M., et al. (2008). Terrestrial Carbon Observations: Protocols for Vegetation Sampling and Data Submission. Rome, Italy: Global Terrestrial Observing System.
Law, B. E., Falge, E., Gu, L., Baldocchi, D. D., Bakwin, P., Berbigier, P., et al. (2002). Environmental controls over carbon dioxide and water vapor exchange of terrestrial vegetation. Agric. For. Meteorol. 113, 97–120. doi: 10.1016/S0168-1923(02)00104-1
Lehmann, N., Finger, R., Klein, T., Calanca, P., and Walter, A. (2013). Adapting crop management practices to climate change: modeling optimal solutions at the field scale. Agric. Syst. 117, 55–65. doi: 10.1016/j.agsy.2012.12.011
Li, H., Qiu, J., Wang, L., Tang, H., Li, C., and Van Ranst, E. (2010). Modelling impacts of alternative farming management practices on greenhouse gas emissions from a winter wheat-maize rotation system in China. Agric. Ecosyst. Environ. 135, 24–33. doi: 10.1016/j.agee.2009.08.003
Lindwall, C. W., Larney, F. J., and Carefoot, J. M. (1995). Rotation, tillage and seeder effects on winter-wheat performance and soil-moisture regime. Can. J. Soil Sci. 75, 109–116. doi: 10.4141/cjss95-014
Liu, C., Zhang, X., and Zhang, Y. (2002). Determination of daily evaporation and evapotranspiration of winter wheat and maize by large-scale weighing lysimeter and micro-lysimeter. Agric. For. Meteorol. 111, 109–120. doi: 10.1016/S0168-1923(02)00015-1
Liu, S., Zhang, X.-Y., Yang, J., and Drury, C. F. (2013). Effect of conservation and conventional tillage on soil water storage, water use efficiency and productivity of corn and soybean in Northeast China. Acta Agric. Scand. B Soil Plant Sci. 63, 383–394. doi: 10.1080/09064710.2012.762803
Lloyd, J., and Taylor, J. A. (1994). On the temperature dependence of soil respiration. Funct. Ecol. 8, 315–323. doi: 10.2307/2389824
Lopez-Bellido, L., Lopez-Bellido, R. J., Castillo, J. E., and Lopez-Bellido, F. J. (2000). Effects of tillage, crop rotation, and nitrogen fertilization on wheat under rainfed Mediterranean conditions. Agron. J. 92, 1054–1063. doi: 10.2134/agronj2000.9261054x
Lu, X. L., Lu, X. N., and Liao, Y. C. (2016). Soil CO2 emission and its relationship to soil properties under different tillage systems. Arch. Agron. Soil Sci. 62, 1021–1032. doi: 10.1080/03650340.2015.1115838
Ma, S. Y., Baldocchi, D. D., Hatala, J. A., Detto, M., and Yuste, J. C. (2012). Are rain-induced ecosystem respiration pulses enhanced by legacies of antecedent photodegradation in semi-arid environments? Agric. For. Meteorol. 154, 203–213. doi: 10.1016/j.agrformet.2011.11.007
Marsal, J., and Stockle, C. O. (2012). Use of CropSyst as a decision support system for scheduling regulated deficit irrigation in a pear orchard. Irrig. Sci. 30, 139–147. doi: 10.1007/s00271-011-0273-5
Monteith, J. L. (1965). “Evaporation and environment,” in 19th Symposia of the Society for Experimental Biology. (Cambridge: University Press).
Monteith, J. L. (1977). Climate and the efficiency of crop production in Britain. Philos. Trans. R. Soc. Lond. B Biol. Sci. 281, 277–294. doi: 10.1098/rstb.1977.0140
Musick, J. T., Jones, O. R., Stewart, B. A., and Dusek, D. A. (1994). Water-yield relationships for irrigated and dryland wheat in the U.S. Southern Plains. Agron. J. 86, 980–986. doi: 10.2134/agronj1994.00021962008600060010x
Ogle, S. M., Swan, A., and Paustian, K. (2012). No-till management impacts on crop productivity, carbon input and soil carbon sequestration. Agric. Ecosyst. Environ. 149, 37–49. doi: 10.1016/j.agee.2011.12.010
Omonode, R. A., Vyn, T. J., Smith, D. R., Hegymegi, P., and Gál, A. (2007). Soil carbon dioxide and methane fluxes from long-term tillage systems in continuous corn and corn-soybean rotations. Soil Tillage Res. 95, 182–195. doi: 10.1016/j.still.2006.12.004
Penning de Vries, F. W. T. (1974). Substrate utilization and respiration in higher plants. Neth. J. Agric. Sci. 22, 40–44.
Penning de Vries, F. W. T., Jansen, D. M., ten Berge, H. F. M., and Bakema, A. (1989). Simulation of Ecophysiological Processes of Growth in Several Annual Crops. Wageningen: Pudoc.
Purakayastha, T. J., Huggins, D. R., and Smith, J. L. (2008). Carbon sequestration in native prairie, perennial grass, no-till, and cultivated Palouse silt loam. Soil Sci. Soc. Am. J. 72, 534–540. doi: 10.2136/sssaj2005.0369
Rabinowitch, E. (1951). Photosynthesis and Related Processes. New York, NY: Interscience Publishers.
Rasmussen, P. E., Rickman, R. W., and Klepper, B. L. (1997). Residue and fertility effects on yield of no-till wheat. Agron. J. 89, 563–567. doi: 10.2134/agronj1997.00021962008900040005x
Regina, K., and Alakukku, L. (2010). Greenhouse gas fluxes in varying soils types under conventional and no-tillage practices. Soil Tillage Res. 109, 144–152. doi: 10.1016/j.still.2010.05.009
Reichstein, M., Falge, E., Baldocchi, D., Papale, D., Aubinet, M., Berbigier, P., et al. (2005). On the separation of net ecosystem exchange into assimilation and ecosystem respiration: review and improved algorithm. Global Change Biol. 11, 1424–1439. doi: 10.1111/j.1365-2486.2005.001002.x
Richardson, A. D., and Hollinger, D. Y. (2007). A method to estimate the additional uncertainty in gap-filled NEE resulting from long gaps in the CO2 flux record. Agric. For. Meteorol. 147, 199–208. doi: 10.1016/j.agrformet.2007.06.004
Rieger, S., Richner, W., Streit, B., Frossard, E., and Liedgens, M. (2008). Growth, yield, and yield components of winter wheat and the effects of tillage intensity, preceding crops, and N fertilisation. Eur. J. Agron. 28, 405–411. doi: 10.1016/j.eja.2007.11.006
Rotter, R. P., Palosuo, T., Kersebaum, K. C., Angulo, C., Bindi, M., Ewert, F., et al. (2012). Simulation of spring barley yield in different climatic zones of Northern and Central Europe: a comparison of nine crop models. Field Crop. Res. 133, 23–36. doi: 10.1016/j.fcr.2012.03.016
Running, S. W. (2012). A measurable planetary boundary for the biosphere. Science 337, 1458–1459. doi: 10.1126/science.1227620
Salado-Navarro, L. R., and Sinclair, T. R. (2009). Crop rotations in Argentina: analysis of water balance and yield using crop models. Agric. Syst. 102, 11–16. doi: 10.1016/j.agsy.2009.06.004
Sauerbeck, D. R. (2001). CO2 emissions and C sequestration by agriculture-perspectives and limitations. Nutr. Cycling Agroecosyst. 60, 253–266. doi: 10.1023/A:1012617516477
Schillinger, W. F. (2001). Minimum and delayed conservation tillage for wheat-fallow farming. Soil Sci. Soc. Am. J. 65, 1203–1209. doi: 10.2136/sssaj2001.6541203x
Schmidt, M., Reichenau, T. G., Fiener, P., and Schneider, K. (2012). The carbon budget of a winter wheat field: an eddy covariance analysis of seasonal and inter-annual variability. Agric. For. Meteorol. 165, 114–126. doi: 10.1016/j.agrformet.2012.05.012
Sinclair, T. R., Tanner, C. B., and Bennett, J. M. (1984). Water-use efficiency in crop production. Bioscience 34, 36–40. doi: 10.2307/1309424
Singh, A. K., Goyal, V., Mishra, A. K., and Parihar, S. S. (2013). Validation of CropSyst simulation model for direct seeded rice-wheat cropping system. Curr. Sci. 104, 1324–1331. Available online at: http://www.currentscience.ac.in/Volumes/104/10/1324.pdf
Soil Survey Staff (1999). “Soil taxonomy: A basic system of soil classification for making and interpreting soil surveys,” in Natural Resources Conservation Service. U.S. Department of Agriculture Handbook 436. 2nd Edn. (Washington, DC: USDA).
Stöckle, C., Higgins, S., Kemanian, A., Nelson, R., Huggins, D., Marcos, J., et al. (2012). Carbon storage and nitrous oxide emissions of cropping systems in eastern Washington: a simulation study. J. Soil Water Conserv. 67, 365–377. doi: 10.2489/jswc.67.5.365
Stöckle, C. O., Donatelli, M., and Nelson, R. (2003). CropSyst, a cropping systems simulation model. Eur. J. Agron. 18, 289–307. doi: 10.1016/S1161-0301(02)00109-0
Stöckle, C. O., Kemanian, A. R., Nelson, R. L., Adam, J. C., Sommer, R., and Carlson, B. (2014). CropSyst model evolution: from field to regional to global scales and from research to decision support systems. Environ. Modell. Software 62, 361–369. doi: 10.1016/j.envsoft.2014.09.006
Stöckle, C. O., Martin, S. A., and Campbell, G. S. (1994). CropSyst, a cropping systems simulation model: water/nitrogen budgets and crop yield. Agric. Syst. 46, 335–359. doi: 10.1016/0308-521X(94)90006-2
Sun, H. Y., Liu, C. M., Zhang, X. Y., Shen, Y. J., and Zhang, Y. Q. (2006). Effects of irrigation on water balance, yield and WUE of winter wheat in the North China Plain. Agric. Water Manage. 85, 211–218. doi: 10.1016/j.agwat.2006.04.008
Tan, C. S., Drury, C. F., Gaynor, J. D., Welacky, T. W., and Reynolds, W. D. (2002). Effect of tillage and water table control on evapotranspiration, surface runoff, tile drainage and soil water content under maize on a clay loam soil. Agric. Water Manage. 54, 173–188. doi: 10.1016/S0378-3774(01)00178-0
Thornley, J. H. M. (1970). Respiration, growth and maintenance in plants. Nature 227, 304–305. doi: 10.1038/227304b0
Tubiello, F. N., Donatelli, M., Rosenzweig, C., and Stockle, C. O. (2000). Effects of climate change and elevated CO2 on cropping systems: model predictions at two Italian locations. Eur. J. Agron. 13, 179–189. doi: 10.1016/S1161-0301(00)00073-3
Unger, S., Máguas, C., Pereira, J. S., David, T. S., and Werner, C. (2010). The influence of precipitation pulses on soil respiration-Assessing the “Birch effect” by stable carbon isotopes. Soil Biol. Biochem. 42, 1800–1810. doi: 10.1016/j.soilbio.2010.06.019
USDA-NRCS (2002). Guide to Using the Soil Conditioning Index, (Lincoln, NB). Available online at: http://www.nrcs.usda.gov/Internet/FSE_DOCUMENTS/nrcs144p2_025093.pdf
van Donk, S. J., and Klocke, N. L. (2012). “Tillage and crop residue removal effects on evaporation, irrigation requirements, and yield,” in Proceedings of the 24th Annual Central Plains Irrigation Conference. (Colby, KS).
van Donk, S. J., Martin, D. L., Irmak, S., Melvin, S. R., Petersen, J. L., and Davison, D. R. (2010). Crop residue cover effects on evaporation, soil water content, and yield of deficit-irrigated corn in west-Central Nebraska. Trans. ASABE 53, 1787–1797. doi: 10.13031/2013.35805
van Iersel, M. W., and Seymour, L. (2000). Growth respiration, maintenance respiration, and carbon fixation of vinca: a time series analysis. J. Am. Soc. Hortic. Sci. 125, 702–706. Available online at: https://www.ashspublications.org/content/125/6/702.abstract
Vuichard, N., Ciais, P., Viovy, N., Li, L., Ceschia, E., Wattenbach, M., et al. (2016). Simulating the net ecosystem CO2 exchange and its components over winter wheat cultivation sites across a large climate gradient in Europe using the ORCHIDEE-STICS generic model. Agric. Ecosyst. Environ. 226, 1–17. doi: 10.1016/j.agee.2016.04.017
Waldo, S., Chi, J., Pressley, S. N., O'Keeffe, P., Pan, W. L., Brooks, E. S., et al. (2016). Assessing carbon dynamics at high and low rainfall agricultural sites in the inland Pacific Northwest US using the eddy covariance method. Agric. For. Meteorol. 218–219, 25–36. doi: 10.1016/j.agrformet.2015.11.018
Wang, X., Jia, Z., and Liang, L. (2014). Effect of straw incorporation on soil moisture, evapotranspiration, and rainfall-use efficiency of maize under dryland farming. J. Soil Water Conserv. 69, 449–455. doi: 10.2489/jswc.69.5.449
Web Soil Survey (2013). Available online at: http://websoilsurvey.sc.egov.usda.gov/App/HomePage.htm
West, T. O., and Post, W. M. (2002). Soil organic carbon sequestration rates by tillage and crop rotation: a global data analysis. Soil Sci. Soc. Am. J. 66, 1930–1946. doi: 10.2136/sssaj2002.1930
Willmott, C. J. (1982). Some comments on the evaluation of model performance. Bull. Am. Meteorol. Soc. 63, 1309–1313. doi: 10.1175/1520-0477(1982)063<1309:SCOTEO>2.0.CO;2
Zhang, S., Sadras, V., Chen, X., and Zhang, F. (2013). Water use efficiency of dryland wheat in the Loess Plateau in response to soil and crop management. Field Crop. Res. 151, 9–18. doi: 10.1016/j.fcr.2013.07.005
Keywords: CropSyst, eddy covariance, tillage practices, rainfall, fallow, carbon and water budgets
Citation: Chi J, Maureira F, Waldo S, Pressley SN, Stöckle CO, O'Keeffe PT, Pan WL, Brooks ES, Huggins DR and Lamb BK (2017) Carbon and Water Budgets in Multiple Wheat-Based Cropping Systems in the Inland Pacific Northwest US: Comparison of CropSyst Simulations with Eddy Covariance Measurements. Front. Ecol. Evol. 5:50. doi: 10.3389/fevo.2017.00050
Received: 01 March 2017; Accepted: 08 May 2017;
Published: 23 May 2017.
Edited by:
Bernd Lennartz, University of Rostock, GermanyReviewed by:
Bogachan Benli, European Investment Bank, LuxembourgIlias Travlos, Agricultural University of Athens, Greece
Copyright © 2017 Chi, Maureira, Waldo, Pressley, Stöckle, O'Keeffe, Pan, Brooks, Huggins and Lamb. This is an open-access article distributed under the terms of the Creative Commons Attribution License (CC BY). The use, distribution or reproduction in other forums is permitted, provided the original author(s) or licensor are credited and that the original publication in this journal is cited, in accordance with accepted academic practice. No use, distribution or reproduction is permitted which does not comply with these terms.
*Correspondence: Jinshu Chi, jinshu.chi@slu.se
†Present Address: Sarah Waldo, US Environmental Protection Agency, Cincinnati, OH, United States