Rain, Sun, Soil, and Sweat: A Consideration of Population Limits on Rapa Nui (Easter Island) before European Contact
 Cedric O. Puleston1*
  Thegn N. Ladefoged2
  Sonia Haoa3
  Oliver A. Chadwick4
  Peter M. Vitousek5 Christopher M. Stevenson6
- 1Department of Anthropology, University of California, Davis, Davis, CA, United States
- 2Anthropology, University of Auckland, Auckland, New Zealand
- 3Fundación Mata Ki Te Rangi, Rapa Nui, Chile
- 4Department of Geography, University of California, Santa Barbara, Santa Barbara, CA, United States
- 5Department of Biological Sciences, Stanford University, Stanford, CA, United States
- 6Anthropology Program, School of World Studies, Virginia Commonwealth University, Richmond, VA, United States
The incongruity between the small and apparently impoverished Rapa Nui population that early European travelers encountered and the magnificence of its numerous and massive stone statues has fed a deep fascination with the island. Ethnographic and archaeological evidence suggest that the indigenous population was previously greater than the estimated 1,500–3,000 individuals observed by visitors in the eighteenth century. Our goal was to determine the maximum population that might have lived on the island by estimating its agricultural productivity in the time before European contact. To determine the agricultural potential of the island we sampled soils and established six weather stations in diverse contexts and recorded data over a 2-year period. We find that the island is wetter on average than previously believed. We also find that rainfall and temperature respond linearly to elevation, but a spatial model of precipitation requires correction for a rain shadow effect. We adapted to Rapa Nui an island-wide spatial model designed to identify agriculturally viable zones elsewhere in Polynesia. Based on functions relating climate and substrate age to measurements of soil base saturation, we identified 3,134 ha that were suitable for traditional dryland sweet potato cultivation, or about 19% of the 164 km2 island. We used a nutrient-cycling model to estimate yields. Modeled yields are highly sensitive to nitrogen (N) inputs and reliable estimates of these rates are unavailable, requiring us to bracket the rate of N inputs. In the case of low N availability, yields under continuous cultivation were very small, averaging 1.5 t/ha of wet sweet potato tuber. When the N fixation rate was quadrupled sustainable yields increased to 5.1 t/ha. In each N scenario we used a model of food-limited demography to examine the consequences of altering agricultural practices, the labor supply, the ability of the population to control its fertility, and the presence or absence of surplus production to support social inequalities. In the low-N case viable populations average approximately 3,500 individuals across all parameter combinations, vs. 17,500 in the high-N case, although sustainable populations in excess of 25,000 were possible under some assumptions.
Introduction
The incongruity between the small and isolated Rapa Nui (Easter Island, Chile) population that Europeans first encountered and the magnificence of the massive stone figures that dot the island has led to deep fascination with what transpired there. According to most early accounts, the wind-scoured island was barren of trees and it seemed impossible to many of the early European explorers that the small population that lived on the island was capable of crafting and moving these monuments. It is widely believed that the island and its people went through a process of dramatic change between the time of first colonization by approximately 1,200 A.D. (Hunt and Lipo, 2006, 2008; although the timing of colonization remains in dispute, see Cañellas-Boltà et al., 2013; Mulrooney, 2013; Rull et al., 2013) and the arrival of the earliest European explorers in the eighteenth century. The island initially was densely wooded and archaeological evidence suggests that at its pre-contact peak the island's population was much larger (7,000–9,000, Van Tilburg, 1994, summarizing others) than it was when Europeans first arrived (1,500–3,000, Boersema, 2015, from original records). Diamond (1995) proposed that a maximum population of 20,000 seems reasonable for the ecological context, and later writes that 15,000 seems “unsurprising” (Diamond, 2005). Fischer (2005) estimates a peak of 12,000, while Fagan (2008) estimates 15,000. Using a baseline of 150 persons per km2 Rallu (2007, p. 22) estimates 25,650. However, echoing the concerns of other researchers, Anderson (2002) wrote of Rapa Nui: “All estimates of the peak size of the prehistoric population are entirely speculative.”
In contrast to Admiral Jacob Roggeveen's (1903) description of the island as “exceedingly fruitful” when he made the first recorded European contact in 1722, Capt. James Cook in 1774 concluded after a brief survey by members of his crew that the island was impoverished and land that had formerly been cultivated appeared abandoned (Cook, 1777). There remains ethnographic and archaeological evidence of social inequalities in the pre-contact period (Stevenson and Haoa, 2008), in addition to the apparent specialization of labor required to produce and organize the transport of the stone statues. These practices were lost or much diminished by the time outsiders began to make more careful observations (e.g., Routledge, 1919).
It is possible that internal conflict (Heyerdahl and Ferdon, 1961; Bahn, 1993; Flenley and Bahn, 2003, p. 153) reduced the population from its maximum before European contact, and some have argued that human-mediated environmental degradation led to the loss of agricultural productivity (e.g., Mieth and Bork, 2003; Diamond, 2005; Hunt, 2007), further reducing the island's ability to support human life. The picture of what life was like before Europeans arrived is further clouded by the changes that occurred soon after this contact and before any accurate census was made. The island's population was ravaged by both introduced diseases and by slaving raids from South America.
Several attempts have been made to estimate what Rapa Nui's population might have been at its peak before the Nineteenth century, independently from the observations of early visitors. Most of these evaluations fall into two categories: those that rely on (1) population densities taken from other Polynesian islands, or (2) estimates from surveys of residential features. With regard to the former (e.g., Métraux, 1957; Rallu, 2007), Rapa Nui is unusual in that it receives less sunlight and is cooler than most of the otherwise comparable Polynesian islands, as it lies south of the Tropic of Capricorn. Additionally, most inhabited Polynesian islands were incorporated into trade networks with other islands, even those at considerable distance from their nearest neighbors. Rapa Nui, however, was likely unable to sustain trade networks as a result of its relative isolation. These factors suggest that estimates based on other islands are likely to overestimate Rapa Nui's population.
Archaeological evidence in the form of residential features has been used around the globe to estimate population size, and Rapa Nui is no exception (e.g., McCoy, 1976, 1979; Stevenson, 1984; Stevenson and Cristino, 1986; Stevenson and Haoa, 2008). However, this method is subject to several potential errors. First, it can be difficult or impossible to determine the average number of inhabitants a residential feature might have housed. Second, contemporaneity can be difficult to establish. It is also sometimes difficult to identify and characterize more ephemeral structures.
Here we take a third approach, estimating potential population size from potential agricultural yields. The use of agricultural potential to estimate population has a long history in anthropology, but the results of this method are highly sensitive to the assumptions that go into them, and the heterogeneity of the landscape is often given short shrift. The end product of such analyses is usually a single number, with little analysis of what that number might mean in context. Further, such calculations typically do not account for the potentially important roles of hunger, surplus requirements, competition for access to land, or labor availability as a consequence of the demographic characteristics of the population. In the most thorough consideration of agricultural potential on the island, Louwagie et al. (2006) made a careful analysis of several sites based on climate and soil characteristics, but did not consider key nutrients, alternatives to continuous cultivation or extend their findings to population estimates.
To generate estimates of Rapa Nui's agricultural potential, we assemble climate data from several sources to create a high-resolution map of the island in which each 100 m grid cell is described in terms of its seasonal pattern of temperature and rainfall. We exclude zones of the island that do not meet the minimum criteria for agriculture, using climate and soil fertility data. Over the remaining area we applied a nutrient cycling and productivity model to simulate potential yield of sweet potato (Ipomoea batatas), which represents the primary cultigen grown on Rapa Nui. We use these crop yields to derive estimates of maximum population under various assumptions about human behavior using a model of food-limited human demography, in which rates of birth and death at various ages depend on food availability. The estimates of peak population are derived from the resulting population trajectories.
Characterizing Climate
Rainfall
Of the many characteristics that determine agricultural productivity, climate is among the most important. In non-irrigated systems like those of Rapa Nui, the most important component of climate is often rainfall. Rainfall is also the vector of nutrient inputs by atmospheric deposition, and ultimately their loss via leaching. On the high islands of the Pacific, rainfall can vary dramatically over short distances due to the strong relationship between altitude and precipitation. In the simplest cases this orographic process is linear and is quantified as a precipitation lapse rate. To estimate the lapse rate we used data from six weather stations placed at various points on the island and a long independent series from the Mataveri Airport in the southwest, near the town of Hanga Roa. The new climate data were collected by HOBO U30 weather stations, Version 2.0.0, manufactured by Onset Computer Corporation. The airport data came from two sources: a monthly record of the years 1950–2000 published by Genz and Hunt (2003), and online weather data to capture the period 1999–2011.
The six weather stations provide important information about how climate varies across the island, but these series were very short, less than two years, with some gaps. We used the airport data as a reference series and determined the relationship between it and each of the six newly placed weather stations based on daily rainfall for all days in which we had observations at both sites (see Supplemental Materials, Figure S1 for distributions). Rainfall at the six weather stations was well predicted by linear functions of rainfall at the airport, with r2-values that average 0.77, including a 0.57 value from a very short series at one of the stations. We eliminated two data points from the comparison because it appeared the airport data were in error, as all the other stations recorded a downpour and the airport series showed little or no rainfall that day.
We used these relationships to generate a long rainfall series for each of the six new stations from the daily airport rainfall data. This helps to correct for some of the sampling bias expected in relatively short samples of temporally correlated and cyclical sources in the new station records. For example, if the data we collected came from an unusually wet period, we expect that would be reflected in the airport data over the same span. We assume that the linear relationship observed in the synchronous observations is constant and that unexplained variation was noise that could be disregarded. We also assume that the relationships would hold on the coarser monthly timescale, which is required by our models. The result is seven synchronized 62-year records of monthly rainfall at various points around the island.
Working from the predicted annual mean rainfall at each station (see Supplemental Materials, Table S1) we find a strong linear relationship with elevation (r2 = 0.87). It is clear, however, that the airport series is an outlier. When we remove the airport from the analysis (see Supplemental Materials, Figure S2) the temporary weather stations describe a much stronger relationship between elevation and mean annual rainfall (r2 = 0.98). An explanation for the difference between the airport and these six weather stations is presented below.
The function that comes from this analysis is rain (mm/year) = 1240 + 1.749×elevation (m). We used this relationship to generate isohyets purely as a function of elevation (Figure 1). However, the resulting rain map contained evident anomalies. For example, the area to the west of Rana Aroi (the peak of Teravaka in the northern part of the island) is observably quite dry, containing soils with pedogenic carbonates, despite its elevation.
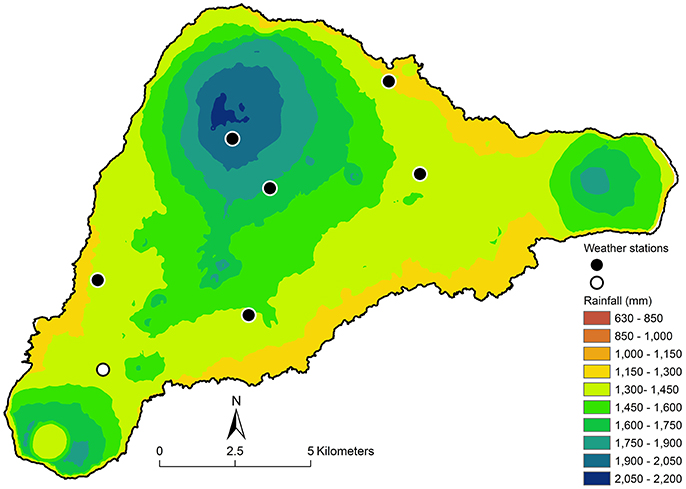
Figure 1. The black dots represent the six new weather stations. The white dot shows the location of Mataveri Airport. The isohyets are derived from the linear relationship Rain (mm/year) = 1240.4 + 1.7487 × elevation (masl).
To address this discrepancy at Rana Aroi we examined data on wind direction from the stations and determined that the speed-weighted origin of the wind was from the east—as expected for the southern hemisphere Trade Winds. Using the relationship between distance from the ridgeline and the decrease in rainfall on the leeward side at the Kohala Peninsula on the Island of Hawai‘i (Giambelluca et al., 2013) as a guide, we derived a function to approximate the rain shadow effect of being on the leeward side of a rise. This function requires a calculation of the “shade fraction” of each point or pixel on the map. We used a hillshade image created with the assumption that the artificial light source was 5° above the horizon and due east of the island (Figure 2). The red indicates pixels that are “shaded” under these conditions. We used this information to calculate the shade fraction (f) of each point on the map by calculating the Euclidean distance to the nearest unshaded point. We then divided by the value of the greatest distance observed on the island, creating a range of shadedness from 0 to 1. The areas of the island deepest in the rain shadow would have f = 1 and any unshaded points have f = 0, most points being somewhere in between. The shade fraction was used to define a unitless local rainfall multiplier that reduced rainfall in a manner similar to that observed at Kohala, Hawai‘i: M = [0.5 + (exp(−4.6×f))/2]. The multiplier M = 1 if the pixel is unshaded and M = 0.505 when f = 1. We then adjusted the expected annual rainfall using the function rain (mm/year) = [1240 + 1.749×elevation (m)]×M. The resulting map (Figure 3) aligns better with observations than the unmodified one, despite the under-constrained parameterization of the rain shadow function. In particular, accounting for the rain shadow helps explain sparse vegetation cover to the leeward of both Rana Aroi and the Poike Peninsula to the east.
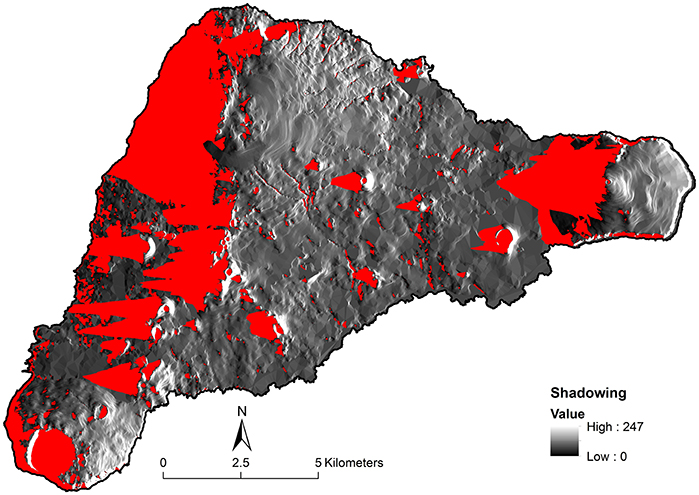
Figure 2. The red areas indicate what parts of the island would be in shade if we imagine an artificial light source coming from due east at 5° above the horizon. We use this information to estimate the effect of the rain shadow caused by topography, given the dominant direction of the wind during rainfall. Areas in red received less rain than the others, according to a formula to estimate the shadow fraction (f).
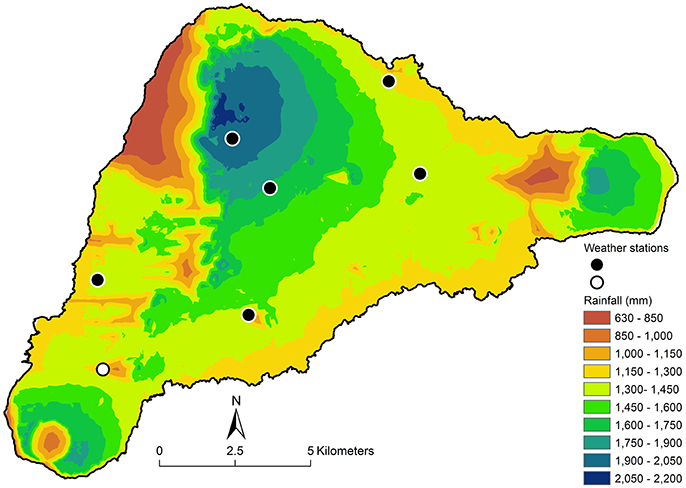
Figure 3. Isohyets after accounting for the rain shadow effect. Note that the area in the NW of the island now appears as quite dry, as does the area immediately west of Poike, the peninsula on the extreme east of the island. Both of these areas are in fact drier than elevation alone predicts. The airport rain gauge (white dot) is also in a moderate rain shadow.
The modified rain map also suggests why the absolute value of annual rainfall at the airport is less than elevation alone predicts. The location, noted by a large white dot in the southwest region of the island (Figure 3), is actually in a moderate rain shadow zone and has an expected rainfall of 1,361 mm based on elevation (69 masl) alone, vs. the 1,097 mm actually observed. This correction and the assumption that rain is more likely to be under-reported by imprecise rain gauges than over-reported may explain the difference between the patterns at the airport and at the new stations. Because the airport has been the only freely available source of rainfall information on Rapa Nui, its status as an outlier has led to the perception that the island is drier than it is (e.g., Genz and Hunt, 2003; Louwagie et al., 2006; Junk and Claussen, 2011, using a function derived by Norero, 1998).
Temperature
Local temperature in Polynesian islands typically changes linearly with elevation, driven by the same orographic process that drives precipitation. Accordingly, we determine the temperature function using similar methods. We appended more recent internet-available airport data to the long series of monthly average temperature calculated from Genz and Hunt (2003). Monthly averages of the daily web data were calculated as the mean of daily averages, which were determined by taking the mean of the daily high and low temperatures. As with rainfall, we determined a function relating the new stations' daily series to the airport data 1999–2011. This function was used to generate a 12-year daily temperature series at each station. We then calculated mean monthly temperatures at each location and used the correlations between the reference airport series and the others to generate monthly mean temperatures over the period 1950–2011. As with precipitation, the assumption is that the relationships observed in the relatively short overlap between the short-term weather stations and the airport series remains constant. We then extrapolate using the airport as a reference series to expand our long-run means over a greater span to include a better sampling of temporal variation, as with the rainfall series (see Supplemental Materials, Table S2).
The monthly series at each location follow a typical sinusoidal pattern through the year, peaking in February and reaching a minimum in August. The annual means are highly linear with respect to elevation, with an r2 of 0.99 using the relationship annual mean temp (°C) = 20.99 − 0.008452×elevation (m). We use this function to calculate monthly mean temperatures across the island.
Analysis of the long-term patterns of climate by Junk and Claussen (2011) support the use of modern data to describe the historical pattern. Although it remains a matter of some debate (e.g., Mann et al., 2008; Stenseth and Voje, 2009) there is no overwhelming evidence for a systematic shift in either rainfall or temperature over the time period we are interested in. In the same vein, while it is possible that the presence of the remnants of the ancient forest had the effect of cooling the island and increasing precipitation during the early phases of the island's occupation, the effect on rainfall in particular should be small on a trade-wind island of Rapa Nui's size.
Other Factors
Plant growth is constrained by solar energy. We found no significant relationship between solar radiation recorded at our six weather stations and elevation. The monthly means were well described by the sinusoidal function Rs = (77.9×cos(π/6×(month-12.25)) + 196.1)×0.0864 in MJ/m2/day, where month is the number of the month from 1 to 12 (r2 = 0.95). Approximately 45% of this light is photosynthetically active radiation (PAR) (Jacovides et al., 2004). We followed Ruimy et al. (1999) to determine the potential productivity of sweet potato and fallow grasses as a function of light availability using their function for the fraction of photosynthetically active light that plants intercept, FPAR = 0.95×(1−exp(−K×LAI)), where LAI is the leaf area index of the plant and K is a constant that modifies LAI based on the morphology of the plant. We used estimates of K for grass (0.35) and crops (0.85) from Monteith and Elston (1983) and maximum values of LAI from various sources, including Ramírez García et al. (2012) for grass (2.5 cm2/cm2) and crops (3.5 cm2/cm2). Finally, we determined potential production—or light-limited carbon assimilation rate per unit area—by multiplying the product PAR×FPAR by light use efficiency (LUE) for grass (0.860 gC/MJ) or crops (1.044 gC/MJ) (Zhao and Running, 2010).
Nitrogen is often the most limiting nutrient in crop productivity. What N is available in Polynesian agricultural systems that lack a symbiotic N fixer comes primarily from two sources: dissolved N in rainfall and from the fixation of nitrogen from the atmosphere by the microbial community as it decomposes sugarcane and other plants (Lincoln and Vitousek, 2016). The deposition rate of dissolved mineral N has been measured in some places and estimated for others across the globe, but the remote Pacific remains under studied in this regard. Based on measurements in remote areas of Hawaii (Heath and Huebert, 1999; Raich et al., 2000), we estimate that deposition of dissolved N could be 0.0014 gN/m2/cm rain. For N fixation by microbes, we evaluate the lower half of the range of N fixation rates in decomposing sugar cane mulches in Polynesian cropping systems reported by Lincoln and Vitousek (2016), 4.8–20 kgN/ha/year.
Estimating Extent of Viable Agricultural Systems
We adapted the model presented by Ladefoged et al. (2009), which was used to identify agriculturally productive areas of the Hawaiian Archipelago, to the situation on Rapa Nui (Figure 4). The model eliminates areas that are too dry, too cool, too high or too poor in soil nutrients. The temperature and rainfall gradients on Rapa Nui were determined from our analysis of weather station data, described above. The non-nitrogen soil nutrient estimates were based on measurements of plant-available P and Ca (exchangeable cations) in soils sampled along transects of the island (Ladefoged et al., 2005, 2010) and concentrated samplings in and near archeological sites (Vitousek et al., 2014; Stevenson et al., 2015). The lower limit of base saturation, a proxy for the availability of cations, in the dryland agricultural zones of Hawai‘i was approximately 30% (Ladefoged et al., 2009). On Rapa Nui this corresponds to areas with rainfall of 1,300 mm/year or less. Applying the criteria of Ladefoged et al. (2009) to the area at or below 1,300 mm rainfall identifies 2,889 hectares (of the total of 16,425 1-ha cells) as suitable for dryland agriculture. This process eliminates most of the Poike area (the eastern peninsula), much of Rano Aroi (in the north) and its dry western slope, and the steep areas around Rano Kau in the southwest. It is possible that some of these areas were cultivated in the past, but the modern climate and soil data suggest that such efforts would be unsustainable. Further, it has been shown that once depleted, volcanic soils like Rapa Nui's do not rejuvenate their fertility themselves over time (Chadwick and Chorover, 2001; Chadwick et al., 2003), suggesting that modern data should be a reliable picture of the past in this case.
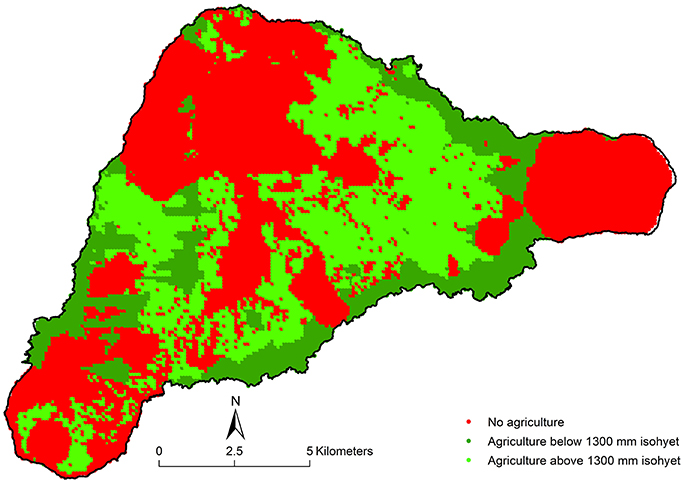
Figure 4. The results of applying the criteria for agricultural viability from Ladefoged et al. (2009) with modifications for Rapa Nui. Soils were generally lower in nutrient availability on Rapa Nui, and we ruled out those areas with more than 1,300 mm rainfall annually unless there was clear evidence of garden activity, according to Ladefoged et al. (2013). The darker green areas are those below 1,300 mm rain that meet the other criteria, totaling 2,889 hectares. Lighter green areas show the 1-ha cells that contain evidence of gardens, although these garden areas are often small and sparse, adding only 245 hectares of agricultural area. The red indicates areas that are ruled out from being agricultural by the model.
In addition, on Rapa Nui it appears that people were farming patchy areas receiving rainfalls greater than 1,300 mm/year, as many of the agricultural features identified in Ladefoged et al. (2013) lie above that isohyet. Ladefoged et al. (2013) mapped the distribution of these cultivated rock garden areas using supervised classification of WorldView 2 satellite data. They specified three alternative classifications (“maximal,” “medial,” and “minimal”), and here we took a conservative approach and used their “minimal” classification of areas of rock gardens throughout the island. Their “minimal” classification identifies rock gardens in 5,548 1-ha cells that fulfill the original criteria of Ladefoged et al. (2009) located above the 1,300 mm rainfall isohyet. Within those 5,549 1-ha cells, a total area of 244.9 ha of gardens are identified in Ladefoged et al.'s (2013) “minimal” classification of the WorldView 2 satellite data. Combining both (1) the area below 1,300 mm annual rainfall identified as agriculturally viable by the Ladefoged et al. (2009) criteria, and (2) the area above the 1,300 mm isohyet that otherwise fulfills the Ladefoged et al. (2009) criteria and contains gardens identified by the “minimal” classification of Ladefoged et al. (2013), we estimate there were 3,134 ha suitable for dryland agriculture on Rapa Nui.
Modeling Productivity
To model agricultural productivity we parameterized a version of the Century nutrient cycling model (Parton et al., 1987) for dryland sweet potato production on Rapa Nui, using parameters from elsewhere in Polynesia when necessary (see Supplemental Materials, Table S3). The model tracks plant production on a monthly timescale as a function of the climate and environmental factors described above. We track the stores of carbon and nitrogen in the plants' above- and below-ground parts, the ratios of which are constrained to biologically realistic ranges (Parton et al., 1987; US Department of Agriculture, Agricultural Research Service, and Nutrient Data Laboratory, 2016). Soil N availability is calculated from N inputs from rainfall, biological fixation and the local recycling of dead plant matter, mostly through microbial action. Small amounts of plant-available N are also lost from the system through volatilization and leaching. For simplicity we assume that all grid cells identified as agriculturally viable are identical in their soil structure and water holding characteristics, with the exception of rainfall and temperature, and the effects these have on the site variables.
We do not model phosphorus explicitly, although we do track the minimum mass of P required to produce the yields of sweet potato the model estimates. The mass of phosphorus removed at harvest is calculated at 1/500 times the mass of carbon removed (US Department of Agriculture, Agricultural Research Service, and Nutrient Data Laboratory, 2016), assuming tubers are 23.5% C by mass.
Earlier versions of the model have been used to examine productivity of Polynesian dryland agriculture (e.g., Lee et al., 2006; Ladefoged et al., 2008; Kirch et al., 2012). In addition to the model changes described in Kirch et al. (2012), we have updated the model to include soil-water dynamics based on the dual crop coefficient method and the FAO Penman-Monteith equation for calculating grass-reference evapotranspiration (Allen et al., 1998). To model the low-productivity environment of Rapa Nui we added a shifting cultivation module that allows us to specify the fallow crop and the length of the fallow and cropping period. The grasses that grow during fallow are burned before planting, resulting in the loss of all above-ground biological carbon and 50% of the above-ground nitrogen and 10% of the phosphorus. The difference remains as ash and is plant-available, representing a simplification of the process described by Ewel et al. (1981) and Palm et al. (1996).
The model runs on a monthly timescale, with the exception of water dynamics, which are tracked on a weekly basis. Rainfall and temperature vary according to the observed seasonal pattern appropriate for the elevation and degree of rain shadow effect. Monthly production in gC/m2 is limited by the amount of available sunlight striking the canopy, which changes according to the plant's stage of growth. It is further reduced by factors representing the effects of water stress and the crop-specific response to temperature. These factors include losses due to plant respiration. If maximum production exceeds that allowed by the crop-specific maximum C:N ratios, then all plant available N is incorporated and the maximum amount of carbon allowed by the C:N ratios is assimilated by the plant. Otherwise climate is at least co-limiting and mineral N may be left over in the soil, depending on the minimum C:N ratios of the plant.
Nitrogen inputs are limited to N dissolved in rain and biological fixation, and losses are limited to volatilization (through burning and as a function of decomposition) and leaching (through deep percolation), in addition to N removed at harvest. Monthly plant-available N is derived as the balance of these fluxes, plus the N released by decomposition.
The scenarios we examine are divided into two environmental classes: one with a low rate of N fixation (4.8 kgN/ha/year) and one with a high rate of N fixation (20 kgN/ha/year). In each of these we consider three agricultural approaches: continuous cultivation, 5 years of fallow with 5 years of cropping, and 15 years of fallow with 3 years of cropping. In the shifting cultivation scenarios we alternated between grassland fallow and sweet potato cultivation until the pattern had stabilized in all cases, and saved results from the last 200 years. In the case of continuous sweet potato cultivation we used the same time scales to calculate mean yields.
There are several human behavioral, or cultural, factors that might influence population densities and we considered three classes of these. The first regards societal expectations with regard to effort in agricultural labor, the second regards expectations with regard to fertility, and the third regards societal expectations with regard to social stratification, surplus production, and specialization of labor.
We used a model of food-limited demography described in Lee and Tuljapurkar (2008) and Puleston and Tuljapurkar (2008) to examine the response of human population size and structure to the productivity of the environment and our behavioral assumptions. The demographic model has been used to examine the linkages between early agricultural populations and their food supply (e.g., Lee et al., 2009; Puleston et al., 2014; Winterhalder et al., 2015) and has been applied to Polynesian contexts in particular (Puleston and Tuljapurkar, 2008; Kirch et al., 2012). The model requires input of a potential yield, which we identified earlier, and calculates per capita food availability based on the amount of arable land, labor supply and the size and structure of the population. It iterates a population forward in annual steps, adjusting birth and death rates in response to food availability. We extend the model's functionality here to examine the consequences of fertility control and the existence of a non-agricultural elite class, discussed below.
Our default expectation of labor effort in dryland sweet potato production in Polynesia is that a typical adult worker will plant and harvest just under 1 ha of land per year (Kamakau, 1976) and we begin with the assumption that 50% of the working-age population is employed full time in agriculture. This could occur in the case that all men, and only men, are fully employed in agriculture, or that men and women both work, but each for only half of a full work day. This default scenario is identified in the summary of results under the heading “workfrac = 0.5.” We also examine the cases where 75% of the working-age population is fully employed in agriculture, in addition to the hypothetical case in which 100% of the working-age population is engaged in farming. These scenarios are labeled “workfrac = 0.75” and “workfrac = 1,” respectively.
The second cultural parameter we examine is the responsiveness of fertility to hunger. The equilibrium state of the demographic model is defined by the level of hunger at which fertility and mortality achieve balance: the number of births and the number of deaths are equal. Both age-specific fertility and survival probability have default values that are in effect when food is plentiful. We follow Puleston and Tuljapurkar (2008) and Kirch et al. (2012) in assuming the default total fertility rate of this Polynesian population is 4.9 children per woman, and the expected lifespan of the population in the absence of hunger is 45 years (see Supplemental Materials, Table S4 for more information on demographic parameters). When a population grows to the extent that it outstrips the ability of the land to provide sufficient food, the rates of fertility and survival begin to drop, even as the population continues to grow at a reduced rate. Eventually births and deaths balance and equilibrium is achieved. This describes the default scenario, although alternatives exist. One we consider here is the scenario of “fertility control,” in which the population's response to the experience of hunger is to immediately reduce fertility rates as much as is required to achieve equilibrium without a substantial increase in either hunger or mortality. This scenario maintains a high quality of life for the entire population at the expense of much reduced probability of childbearing and the difficulty that effecting and enforcing that requirement might entail.
The third cultural feature we consider is social stratification, surplus production, and occupational specialization. The “egalitarian” scenario refers to the case in which the entire population is made up of agricultural workers and their families. In the “hierarchical” scenario we examine the effects of a stratified society that demands some degree of tribute in both food and labor. This includes the resources necessary to feed a non-agriculturally productive class, or classes, including chiefs and their retinues, and would include moai-producing stone carvers if we assume they did not contribute agricultural labor as well. This scenario assumes 10% of all food is taken as tribute and that 25% of agricultural labor is lost in non-agricultural tribute. We also assume that the non-producing class remains at 1% of the overall population.
Results
Average annual yields increase, as expected, as the fallow period increases in shifting cultivation (Table 1). The low-N environment with no fallow yields 1.46 t/ha/year of wet sweet potato tuber, while the 5-year fallow yields an average of 2.38 t/ha/year over 5 years, and the 15-year fallow yields an average 5.61 t/ha/year over 3 years of cultivation. In the high-N environment these values rise to 5.10, 8.00, and 17.60 t/ha/year, respectively. Figure 5 shows the spatial distribution of these yields.
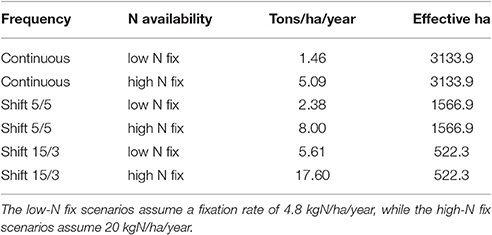
Table 1. Stable sweet potato yields (t/year for each non-fallow ha) and area in cultivation (“effective ha”) under two N-fixation scenarios and three patterns of cultivation: continuous, shifting cultivation of 5 years fallow followed by 5 years of cropping, and shifting between 15 fallow years and 3 cropping years.
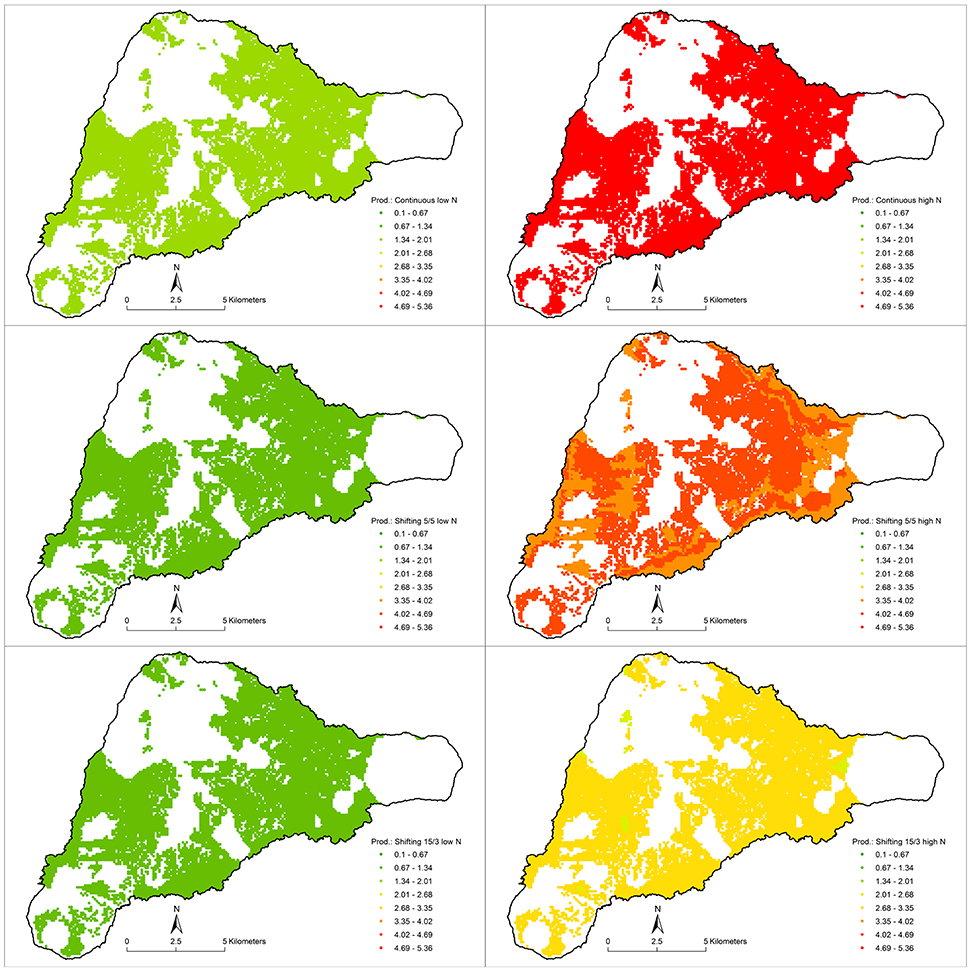
Figure 5. The column of images on the left represent the low-N case and the right column represents the high-N case. The rows represent continuous cultivation, shifting cultivation with 5 years in use and 5 years fallow, and the shifting case with 3 years in use and 15 years fallow, from top to bottom. The legend is the same for each, showing annual yield of sweet potato (t/ha), averaged over fallow and non-fallow years.
Using the conversion of 1 t/year of wet sweet potato = 2,809 kcal/day (based on 100 g wet sweet potato providing 102.5 kcal), the low-N environment provides 4,101 kcal/day/ha under continuous cultivation, and 6,685 kcal/day/ha for land in active cultivation in the short-fallow regime. The long-fallow scenario yields 15,758 kcal/day per ha of cultivated land.
Assuming a C:P ratio of 500:1 for sweet potato tubers, in the low-N environment the continuous production scenario removes 0.91 kgP/ha/year. The short-fallow scenario removes 1.47 kgP/ha/year in cultivated areas, in addition to the 10% of above-ground P lost to the burn at the end of the fallow period. For a sustainable yield this short-fallow scenario requires annual inputs of 0.74 kgP for each of the 3,134 arable ha, including fallow. The long-fallow scenario removes 3.55 kgP/ha/year for the three years of cultivation, in addition to the burn losses. The combined losses require inputs of 0.60 kgP/ha/year to all arable ha for the yield to be sustainable. In the high-N environment the average annual losses are 3.10, 2.47, and 1.86 kgP/ha/year for the continuous cultivation, short fallow and long fallow systems, respectively.
The sweet potato yields, after conversion to food calories, are used as an input to an updated version of the food-limited demographic model (Lee and Tuljapurkar, 2008; Puleston and Tuljapurkar, 2008). We find that in several of the low-N scenarios the population is non-viable, meaning that the agricultural population is unable to grow enough food to avoid extinction. This occurs when yield is too low for a family to feed itself on the amount of land its labor can farm. We predict labor shortages in the majority of parameter combinations under continuous cultivation, but such shortages are less likely when a greater fraction of the population is employed in agriculture (Table 2). The egalitarian populations with 75 and 100% of the working-age population engaged in agriculture manage equilibrium numbers of 4,023 and 6,176, respectively, when there is no concerted attempt to limit fertility. The only hierarchical population to avoid extinction occurs in the case of 100% worker participation (i.e., workfrac = 1) when no attempt is made to control fertility. The population levels out at 2,633 individuals in this scenario.
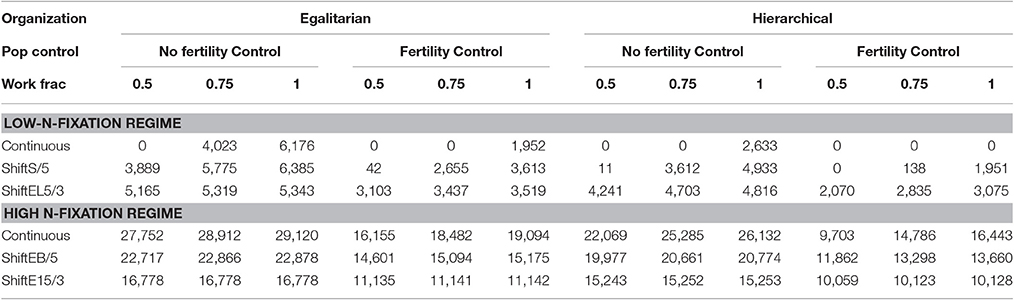
Table 2. Maximum sustainable population sizes in the low-N fixation regime (top) and high-N fixation regime (bottom) under different assumptions.
The low-N scenario is generally associated with low population estimates, the largest numbers occurring in the short-fallow case with an egalitarian social structure and no fertility control. The maximum low-N population is observed in such a situation with 100% worker participation in agriculture, totaling 6,385 individuals. The costs of adding a hierarchy and fertility control are severe in the low-N case. The greatest population size under these assumptions is 3,075 individuals and occurs in the long-fallow case with the assumption of all working-age individuals being employed in agriculture.
Populations are universally higher in the high-N scenarios. The maximum we observe is 29,120 individuals, occurring in an egalitarian population with no fertility control and 100% labor participation using continuous cultivation. The maximum hierarchical population is 26,132 and occurs when there is no fertility control and 100% participation in continuous cultivation. Fertility control reduces the equilibrium population size by shifting the tradeoff between a larger, hungrier population and a smaller, better-fed population. In the hierarchical case with fertility control the maximum of 16,443 occurs under high-N continuous cultivation with 100% worker participation. The lowest population estimate under the high-N fixation scenario totals 10,059 and occurs in the hierarchical population with fertility control and 50% participation.
Discussion
The goals of this study are twofold: to estimate the maximum sustainable population that could have lived on the agricultural resources available to the early settlers of Rapa Nui, and to understand the importance of the ecological and cultural factors that contribute most to that estimate. From our estimates of agricultural productivity, which inform our model of food-limited demography, we find that the range of possible maximum populations runs from approximately 3,000 individuals on the low end to more than 29,000 individuals at the high end. Given our relatively conservative assumptions, we estimate the maximum population of Rapa Nui before European contact would have been closer to 17,500, the approximate average of the high-N scenarios, than the low-N average of 3,500.
The rate at which new nitrogen is added to the system is the most important of the factors we examined. The importance of the other factors we considered depends on whether the N fixation rate was low or relatively high. In the case of lower soil N existence is marginal. The availability of labor is all-important, and the effect of all the factors can be interpreted through their effects on the labor supply. When yields are too low hunger decreases the growth rate and the agricultural population cannot replace itself in the following generation. Even though land is available in such cases, a worker cannot farm enough of it to avoid starvation. In the case of higher N fixation, we find agricultural yields are more typical of long-inhabited Polynesian islands and the maximum population is less dominated by a single factor. In order of importance the controlling factors are: (1) the extent to which lands were left in fallow, (2) the efforts of the population to control fertility, (3) the imposition of tribute to support a non-agricultural elite, and in extreme contrast to the low-N case, (4) labor participation. We examine these factors in turn.
Our assumptions regarding the rate of N-fixation from the decomposition of sugar cane have an outsized effect on our population estimates. The average population size across all parameter combinations is 2,650 individuals in the low-N environment. We find 9 of 36 parameter combinations are non-viable and another three that number fewer than 150 individuals, far too low to be reasonable. Eliminating these 12 scenarios gives an average of 3,534 individuals across the low-N environment. The scenarios in the high-N environment have a mean population of 17,425. The average population increases by a factor of 6.6 entirely as a result of a 4.2-times increase in the N-fixation rate. At this point we do not have evidence that points clearly to one end of the N-fixation spectrum or the other, although we do know that varieties of sugar cane associated with nitrogen fixation during decomposition were cultivated on Rapa Nui, as in Hawai‘i, where the estimates originated (Lincoln and Vitousek, 2016).
The relationship between food supply and labor supply is especially important when the productivity of the land is low, as in our low-N fixation scenarios. Only under the assumption that low-N land was farmed in long-fallow shifting cultivation do we see the effect of increasing labor supply (via the parameter “workfrac”) begin to disappear. Elsewhere throughout the low-N scenarios in Table 2 population numbers respond sharply to the fraction of the population dedicated to agricultural labor. Low-yield environments have unusual characteristics driven by the non-linear relationships between labor and food supply (Puleston et al., 2014). There are thresholds below which the yield per hectare is too small for a family to support itself, due to limitation by how much land a worker can manage. In marginal locations, when a population can provide enough labor to support itself, it may grow very slowly, suffering the hunger-driven depression of growth rate from early in the population trajectory. We find that in the high-N fixation regime increasing the worker fraction has much less of an effect on population numbers, and its effect is greatest where the yield per cultivated hectare is lowest, i.e., the continuous cultivation scenarios.
The effect of agricultural practice on population is driven by the return on investment to labor and the effect of agricultural choices on soil nutrient dynamics. In continuous cultivation we assume workers cultivate as much of the available land as possible, drawing a maximum yield from the ground year after year. Over time nutrient dynamics stabilize and removals in the form of food are defined by the balance of inputs and losses. Shifting cultivation, on the other hand, removes some fraction of the land from cultivation so that part can accumulate nutrients while it lies fallow. When the time comes to plant a fallow area the cover is burned, resulting in losses of nutrients to volatilization and leaching, but the plant-available nutrients that remain generally provide higher initial yields per year than continuous cultivation would have supplied. The result is greater yields per unit of cultivated land, but over a smaller area.
It is typically assumed that small colonizing populations rely more on shifting cultivation early in their growth trajectories due to the relatively high return on labor. However, as population density increases, the population may be forced to employ shorter fallows, and even begin continuous cultivation to avoid hunger (Boserup, 1965). Kirch (2010, pp. 190–201) examined this process in the Polynesian context. The high-N environment conforms closely to the expectation that population densities are greater under continuous cultivation and longer fallow times are associated with lower population densities. The only place we see that generalization violated in our results is in the case of a labor shortage imposed by a fertility-controlled population with a 50% labor fraction in combination with the imposition of labor tribute.
A population using shifting cultivation might exceed the size of one using continuous cultivation where soil fertility is generally poor due to the increased yields in longer fallowed land and the nonlinearities in the relationship between labor and food supply. In the low-N environment, within worker fraction scenarios, population generally increases as yields per cultivated hectare increase at each step from continuous cultivation to short fallow and then long fallow. However, in cases where the labor supply is generally adequate the population responds as Boserup (1965) expected, increasing in size with increasing labor inputs.
It should be noted that our model of agricultural viability of the 1-ha grid cells was based on the assumption of continuous cultivation. It is possible that shifting cultivation was employed to farm more marginal land at higher elevations even if the preference was for continuous cultivation in places that could support it. This would increase the expected population beyond our predictions.
Additionally, there are alternate sources of calories that may have been available to the population that are not included in the model. These include the availability of marine resources, however limited, birds, both wild and domesticated, and less calorie-rich crops that could be grown at higher elevations. It is also possible that the Rapa Nui were more efficient in their use and control of plant resources than we have assumed here. We have not included the practice of transporting mulch from alternate locations to supplement nutrients, or assumed that the Rapa Nui forwent the consumption of sweet potato leaves in favor of the more calorically efficient practice of leaving them in the fields to recycle their nitrogen. Each of these factors would tend to increase population estimates.
Similarly, our decision to limit our scope to sustainable yields likely underestimates productivity in the initial development of agriculture. Founding populations may benefit from a flow of nutrients from the soil organic matter pools left over from when the plant biomass was greater and the nutrient pools larger. These nutrients would be released on decadal and (for P) considerably longer timescales, potentially increasing yields. However, Puleston et al. (2014) estimate that a population like Rapa Nui's would take approximately 400 years to reach its maximum under the assumptions of food-limited demography. Many of the ecological transitions initiated by human occupation of the island would be well under way at that point, including changes to the soil organic matter pools and deforestation. Winterhalder et al. (2015) discuss some of the consequences of a food-limited population's agricultural yield becoming elevated and then returning to a lower level; these consequences include potential famine and social upheaval.
Models of food-limited demography (Lee and Tuljapurkar, 2008; Puleston and Tuljapurkar, 2008; Lee et al., 2009) generally work from the assumption that populations are passive, or at best ineffective, in controlling their own numbers. In the absence of such endogenous control, nature takes its course in Malthusian fashion, driving down rates of fertility and survival as food becomes more and more scarce until the population is driven to zero growth and achieves equilibrium at the maximum level of misery that can be endured. The end result is a relatively large population suffering from significant hunger. Among the alternatives to this fate is fertility control (or high infant mortality). We examine the consequences of perfect fertility control, in which the population reduces births at the first sign of food insufficiency, bringing it to an equilibrium where each person has precisely what they require to feed themselves and mortality is low, and thus life expectancy remains at its maximum.
There is a basic tradeoff between quality and quantity of life at equilibrium. A better-fed, longer-lived population is a smaller population, all else being equal. Our results bear this out. For example, in the high-N environment under continuous cultivation and with 75% worker participation the imposition of fertility control results in a 36.1% decrease in population in the egalitarian scenario and a 41.5% decrease in the hierarchical scenario. We observe similar decreases in the low-N environment, but the comparison is complicated by the non-viability of so many of those populations due to the scarcity of labor. In practice, population control via fertility control or other coordinated approaches may have been difficult to achieve. Also, environmental stochasticity could have played a role in maintaining populations at levels lower than stable equilibria predict, and achieved some of the benefits of fertility control, including average food availability and life expectancy, at the cost of occasional famines (Winterhalder et al., 2015). However, we have limited ourselves in this study to stable seasonal variation, meaning that seasonality is included, but each year is the same as the next. In its effects on productivity and demographic rates the inclusion of environmental stochasticity (i.e., the possibility of periods of drought or above-average rainfall) would be expected to lower population estimates (Lee et al., 2009).
The cost to the agricultural population of maintaining one or more classes of individuals who do not contribute to agricultural production but require feeding and might demand the contribution of labor that would otherwise be spent in farming can be significant. As is the case throughout the indigenous cultures of Polynesia, Rapa Nui's first inhabitants probably arrived with notions of social stratification. The development of the exquisite craftsmanship required to produce the nearly 1,000 moai statues found on the island speaks to a further specialization of labor. Our assumptions in the hierarchical scenario are relatively modest, and the results are similarly modest, except where labor becomes in short supply. The 25% labor tribute has an especially profound effect in the low-N environment. Where four of the 36 parameter combinations are effectively non-viable in the egalitarian scenario, eight of 36 result in populations of less than 150 in the hierarchical scenario. The impact of stratification in the long-fallow cases, where labor is less in demand, becomes similar to the much reduced effect in the high-N regime. The assumption of a more elaborate or demanding social hierarchy should decrease the population estimates.
The importance of labor supply cannot be overstated in a low-yield environment, but in the high-N environment it becomes much less of a factor, even approaching negligibility in the egalitarian shifting cultivation scenarios. In the higher-yield scenarios labor becomes more important as the importance of other factors we modeled is increased. It is not a factor in the egalitarian, non-fertility control, shifting cultivation populations, and becomes more important in the hierarchical, fertility-control, continuous cultivation populations.
Our estimates of population densities center around 21, and 107 persons (p) per km2 in the low- and high-N environments, respectively. However, when we consider only the area we identify as agriculturally viable these become 112 and 558 p/km2. Putting these numbers in context, data from Kirch (2010, Table 4.2) estimates the islands of Hawai‘i and Maui had densities of 262 and 389 persons (p) per km2 of “prime agricultural land,” respectively. These two islands relied heavily on dryland sweet potato to support their populations, but also were able to irrigate 2.5 and 14.8% of their agricultural land, respectively, suggesting that they are probably overestimates of the density that could be supported by dryland agriculture alone. Although the size of pre-contact populations on the Hawaiian Archipelago are also uncertain, these densities per unit of agricultural land on Hawai‘i and Maui projected over 31.3 km2 of agricultural land on Rapa Nui result in population estimates of 8,211 and 12,176, respectively. Without discounting for Hawai‘i’s more favorable climate for sweet potato, this range is consistent with our high-N scenario with a hierarchy, fertility control and 50% of the adult agricultural population in full-time work in any of the cultivation methods.
Conclusions
The purpose of this exercise is to reexamine the relationship between agricultural potential and population on Rapa Nui before the arrival of European explorers. New tools in demography and a better understanding of the limitations on agriculture on the island provide new insight into these complex interactions. We find that maximum population numbers are highly dependent on the rate at which nitrogen accumulates, and that our ability to estimate Rapa Nui's population peak is limited by the relatively poor information we have on N input. However, given rates of nitrogen accumulation that are found in other parts of Polynesia, population sizes of 17,500 and higher were theoretically possible.
Author Contributions
CP did modeling and drafted the manuscript. TL provided data and figures, edited and contributed ideas. SH contributed to parameterization of models, contributed ideas and edited. OC, PV, and CS contributed data, ideas and edited.
Conflict of Interest Statement
The authors declare that the research was conducted in the absence of any commercial or financial relationships that could be construed as a potential conflict of interest.
Acknowledgments
The authors are grateful the Consejo de Monumentos, Rapa Nui, and the Consejo de Monumentos Nacionales de Chile for permission to work on Easter Island and we thank our island collaborators, Ninoska Cuadros, and CONAF, for their assistance and support. The authors also express their gratitude to Marissa Baskett for providing access to Matlab on a UC Davis computing cluster and we thank Pat Kirch for sharing his expertise on Polynesian culture and history. This work was funded by the National Science Foundation award ETBC-1020791 & ETBC-1019640 (OC and PV), and BCS-0911056 (CS).
Supplementary Material
The Supplementary Material for this article can be found online at: https://www.frontiersin.org/article/10.3389/fevo.2017.00069/full#supplementary-material
References
Allen, R. G., Pereira, L. S., Raes, D., and Smith, M. (1998). Crop Evapotranspiration-Guidelines for Computing Crop Water Requirements-FAO Irrigation and Drainage Paper 56, Vol. 300. Rome: FAO.
Anderson, A. (2002). Faunal collapse, landscape change and settlement history in Remote Oceania. World Archaeol. 33, 375–390. doi: 10.1080/00438240120107431
Bahn, P. (1993). “The history of human settlement on Rapanui,” in Easter Island Studies Oxbow Monograph, Vol. 32, ed S. Fisher (Oxford: The Short Run Press), 53–55.
Boersema, J. J. (2015). The Survival of Easter Island: Dwindling Resources and Cultural Resilience. Cambridge: Cambridge University Press.
Boserup, E. (1965). The Condition of Agricultural Growth: The Economics of Agrarian Change Under Population Pressure. London: Allan and Urwin.
Cañellas-Boltà, N., Rull, V., Sáez, A., Margalef, O., Bao, R., Pla-Rabes, S., et al. (2013). Vegetation changes and human settlement of Easter Island during the last millennia: a multiproxy study of the Lake Raraku sediments. Quat. Sci. Rev. 72, 36–48. doi: 10.1016/j.quascirev.2013.04.004
Chadwick, O. A., and Chorover, J. (2001). The chemistry of pedogenic thresholds. Geoderma 100, 321–353. doi: 10.1016/S0016-7061(01)00027-1
Chadwick, O. A., Gavenda, R. T., Kelly, E. F., Ziegler, K., Olson, C. G., Elliott, W. C., et al. (2003). The impact of climate on the biogeochemical functioning of volcanic soils. Chem. Geol. 202, 195–223. doi: 10.1016/j.chemgeo.2002.09.001
Cook, J. (1777). A Voyage Towards the South Pole, and Round the World: Performed in His Majesty's Ships the Resolution and Adventure, in the Years 1772, 1773, 1774, and 1775. Vol. 2, London: W. Strahan and T. Cadell.
Ewel, J., Berish, C., Brown, B., Price, N., and Raich, J. (1981). Slash and burn impacts on a Costa Rican wet forest site. Ecology 62, 816–829. doi: 10.2307/1937748
Fagan, B. (2008). The Great Warming: Climate Change and the Rise and Fall of Civilizations. New York, NY: Bloomsbury.
Fischer, S. R. (2005). Island at the End of the World: The Turbulent History of Easter Island. London: Reaktion Books.
Flenley, J., and Bahn, P. (2003). The Enigmas of Easter Island. New York, NY: Oxford University Press.
Genz, J., and Hunt, T. L. (2003). El Nino/southern oscillation and Rapa Nui prehistory. Rapa Nui J. 17, 7–11.
Giambelluca, T. W., Chen, Q., Frazier, A. G., Price, J. P., Chen, Y. L., Chu, P. S., et al. (2013). Online rainfall atlas of Hawai‘i. Bull. Am. Meteor. Soc. 94, 313–316. doi: 10.1175/BAMS-D-11-00228.1
Heath, J. A., and Huebert, B. J. (1999). Cloudwater deposition as a source of fixed nitrogen in a Hawaiian montane forest. Biogeochemistry 44, 119–134. doi: 10.1007/BF00992974
Heyerdahl, T., and Ferdon, E. N. (eds.). (1961). “Archaeology of easter island,” in Reports of the Norwegian Archaeological Expedition to Easter Island and the East Pacific, Vol. 1 (New York, NY: Rand McNally).
Hunt, T. L. (2007). Rethinking Easter Island's ecological catastrophe. J. Archaeol. Sci. 34, 485–502. doi: 10.1016/j.jas.2006.10.003
Hunt, T., and Lipo, C. P. (2008). Evidence for a shorter chronology on Rapa Nui (Easter Island). J. Island Coast. Archaeol, 3, 140–148. doi: 10.1080/15564890801990797
Hunt, T. L., and Lipo, C. P. (2006). Late colonization of Easter Island. Science 311, 1603–1606. doi: 10.1126/science.1121879
Jacovides, C. P., Timvios, F. S., Papaioannou, G., Asimakopoulos, D. N., and Theofilou, C. M. (2004). Ratio of PAR to broadband solar radiation measured in Cyprus. Agric. Forest Meteorol. 121, 135–140. doi: 10.1016/j.agrformet.2003.10.001
Junk, C., and Claussen, M. (2011). Simulated climate variability in the region of Rapa Nui during the last millennium. Climate Past 7, 579–586. doi: 10.5194/cp-7-579-2011
Kamakau, S. (1976). “The works of the people of old,” in Bishop Museum Special Publication, Vol. 61. ed P. Bernice (Honolulu, HI: Bishop Museum Press).
Kirch, P. V. (2010). How Chiefs Became Kings: Divine Kingship and the Rise of Archaic States in Ancient Hawai‘i. Oakland, CA: University of California Press.
Kirch, P. V., Asner, G., Chadwick, O. A., Field, J., Ladefoged, T., Lee, C., et al. (2012). Building and testing models of long-term agricultural intensification and population dynamics: a case study from the Leeward Kohala Field System, Hawai‘i. Ecol. Modell. 241, 54–64. doi: 10.1016/j.ecolmodel.2012.06.027
Ladefoged, T. N., Flaws, A., and Stevenson, C. M. (2013). The distribution of rock gardens on Rapa Nui (Easter Island) as determined from satellite imagery. J. Archaeol. Sci. 40, 1203–1212. doi: 10.1016/j.jas.2012.09.006
Ladefoged, T. N., Kirch, P. V., Gon, S. M., Chadwick, O. A., Hartshorn, A. S., and Vitousek, P. M. (2009). Opportunities and constraints for intensive agriculture in the Hawaiian archipelago prior to European contact. J. Archaeol. Sci. 36, 2374–2383. doi: 10.1016/j.jas.2009.06.030
Ladefoged, T. N., Lee, C. T., and Graves, M. W. (2008). Modeling life expectancy and surplus production of dynamic pre-contact territories in leeward Kohala, Hawai‘i. J. Anthropol. Archaeol. 27, 93–110. doi: 10.1016/j.jaa.2007.11.001
Ladefoged, T. N., Stevenson, C. M., Haoa, S., Mulrooney, M., Puleston, C., Vitousek, P. M., et al. (2010). Soil nutrient analysis of Rapa Nui gardening. Archaeol. Ocean. 45, 80–85. doi: 10.1002/j.1834-4453.2010.tb00082.x
Ladefoged, T. N., Stevenson, C. M., Vitousek, P., and Chadwick, O. (2005). Soil nutrient depletion and the collapse of Rapa Nui society. Rapa Nui J. 19, 100–105.
Lee, C. T., Puleston, C. O., and Tuljapurkar, S. (2009). Population and prehistory III: food-dependent demography in variable environments. Theor. Popul. Biol. 76, 179–188. doi: 10.1016/j.tpb.2009.06.003
Lee, C. T., and Tuljapurkar, S. (2008). Population and prehistory I: food-dependent population growth in constant environments. Theor. Popul. Biol. 73, 473–482. doi: 10.1016/j.tpb.2008.03.001
Lee, C. T., Tuljapurkar, S., and Vitousek, P. M. (2006). Risky business: temporal and spatial variation in preindustrial dryland agriculture. Hum. Ecol. 34, 739–763. doi: 10.1007/s10745-006-9037-x
Lincoln, N. K., and Vitousek, P. (2016). Nitrogen fixation during decomposition of sugarcane (Saccharum officinarum) is an important contribution to nutrient supply in traditional dryland agricultural systems of Hawai‘i. Int. J. Agric. Sustain. 14, 214–230. doi: 10.1080/14735903.2015.1071547
Louwagie, G., Stevenson, C. M., and Langohr, R. (2006). The impact of moderate to marginal land suitability on prehistoric agricultural production and models of adaptive strategies for Easter Island (Rapa Nui, Chile). J. Anthropol. Archaeol. 25, 290–317. doi: 10.1016/j.jaa.2005.11.008
Mann, D., Edwards, J., Chase, J., Beck, W., Reanier, R., Mass, M., et al. (2008). Drought, vegetation change, and human history on Rapa Nui (Isla de Pascua, Easter Island). Q. Res. 69, 16–28. doi: 10.1016/j.yqres.2007.10.009
McCoy, P. (1976). Easter Island Settlement Patterns in the Late Prehistoric and Proto-historic Periods. Washington D.C.: Easter Island Committee, International Fund for Monuments Inc. Bulletin 5.
McCoy, P. C. (1979). “Easter Island,” in The Prehistory of Polynesia, ed J. D. Jennings (Canberra, ACT: The Australian National University Press), 135–166.
Métraux, A. (1957). Easter Island: A Stone Age Civilization of the Pacific. New York, NY: Oxford University Press.
Mieth, A., and Bork, H.-R. (2003). Diminution and degradation of environmental resources by prehistoric use on poike Peninsula, Easter Island (Rapa Nui). Rapa Nui J. 17, 34–41.
Monteith, J. L., and Elston, J. (1983). “Performance and productivity of foliage in the field,” in Growth and Functioning of Leaves: Proceedings of a Symposium Held Prior to the 13th International Botanical Congress at the University of Sydney, 18–20 August 1981, eds J. E. Dale and F. L. Milthorpe (Cambridge: Cambridge University Press).
Mulrooney, M. A. (2013). An island-wide assessment of the chronology of settlement and land use on Rapa Nui (Easter Island) based on radiocarbon data. J. Archaeol. Sci. 40, 4377–4399. doi: 10.1016/j.jas.2013.06.020
Norero, S. A. (1998). “Aspectos Climáticos y Ecofisiológicos de Isla de Pascua (Capítulo 4),” in Ingeniería Agrícola Limitada: Diagnóstico para el Desarrollo Integral de Isla de Pascua: Proyecto Piloto de riego en Cultivos Hortofrutícolas, V Región, Tomo I, Diagnóstico de Situacion Actual (Santiago: Departamento de Estudios, Comisión Nacional de Riego).
Palm, C. A., Swift, M. J., and Woomer, P. L. (1996). Soil biological dynamics in slash-and-burn agriculture. Agric. Ecosys. Environ. 58, 61–74. doi: 10.1016/0167-8809(95)00653-2
Parton, W. J., Schimel, D. S., Cole, C. V., and Ojima, D. S. (1987). Analysis of factors controlling soil organic matter levels in Great Plains grasslands. Soil Sci. Soc. Am. J. 51, 1173–1179. doi: 10.2136/sssaj1987.03615995005100050015x
Puleston, C. O., and Tuljapurkar, S. (2008). Population and prehistory II: space-limited human populations in constant environments. Theor. Popul. Biol. 74, 147–160. doi: 10.1016/j.tpb.2008.05.007
Puleston, C., Tuljapurkar, S., and Winterhalder, B. (2014). The invisible cliff: abrupt imposition of Malthusian equilibrium in a natural-fertility, agrarian society. PLoS ONE 9:e87541. doi: 10.1371/journal.pone.0087541
Raich, J. W., Parton, W. J., Russell, A. E., Sanford, R. L., and Vitousek, P. M. (2000). Analysis of factors regulating ecosystem development on Mauna Loa using the Century model. Biogeochemistry 51, 161–191. doi: 10.1023/A:1006495408992
Rallu, J.-L. (2007). “Pre-and post-contact population in island Polynesia,” in The Growth and Collapse of Pacific Island Societies, eds P. V. Kirch and J.-L. Rallu (Honolulu, HI: University of Hawai‘i Press), 13–34.
Ramírez García, J., Almendros García, P., and Quemada Saenz-Badillos, M. (2012). Ground cover and leaf area index relationship in a grass, legume and crucifer crop. Plant Soil Environ. 58, 385–390.
Roggeveen, J. (1903). “An extract from the official log of Mynheer Jacob Roggeveen; Relating to his discovery of Easter Island,” in The Voyage of Captain Don Filipe Gonzales to Easter Island, 1770–71, ed B. G. Corney (Cambridge: The Hakluyt Society). 1–26.
Routledge, K. (1919). The mystery of Easter Island. Kempton: adventures unlimited press (Reprinted 1998).
Ruimy, A., Kergoat, L., and Bondeau, A. (1999). Potsdam NPP model intercomparison—Comparing global models of terrestrial net primary productivity (NPP): analysis of differences in light absorption and light-use efficiency. Glob. Chang. Biol. 5, 56–64. doi: 10.1046/j.1365-2486.1999.00007.x
Rull, V., Cañellas-Boltà, N., Sáez, S., Margalef, O., Bao, R., Pla-Rabes, S., et al. (2013). Challenging Easter Island's collapse: the need for interdisciplinary synergies. Front. Ecol. Evol. 1:3. doi: 10.3389/fevo.2013.00003
Stenseth, N. C., and Voje, K. L. (2009). Easter Island: climate change might have contributed to past cultural and societal changes. Clim. Res. 39, 111–114. doi: 10.3354/cr00809
Stevenson, C. M. (1984). Corporate Descent Group Structure in Easter Island Prehistory. Dissertation/Ph.D. thesis, University Park (PA): The Pennsylvania State University.
Stevenson, C. M., and Cristino, C. (1986). The residential settlement history of Easter Island's southern coastal plain. J. New World Archaeol. 7, 29–38.
Stevenson, C. M., and Haoa, S. (2008). Prehistoric Rapa Nui. Los Osos, CA: Easter Island Foundation, Bearsville Press.
Stevenson, C. M., Puleston, C. O., Vitousek, P. M., Chadwick, O. A., Haoa, S., and Ladefoged, T. N. (2015). Variation in Rapa Nui (Easter Island) land use indicates production and population peaks prior to European Contact. Proc. Natl. Acad. Sci. U.S.A. 112, 1025–1030. doi: 10.1073/pnas0.1420712112
US Department of Agriculture, Agricultural Research Service, and Nutrient Data Laboratory (2016). USDA National Nutrient Database for Standard Reference, Release 28. Version Current: September 2015, slightly revised May 2016. Available online at: http://nea/bhnrc/ndl
Van Tilburg, J. (1994). Easter Island: Archaeology, Ecology and Culture. London: British Museum Press.
Vitousek, P. M., Chadwick, O. A., Hotchkiss, S. C., Ladefoged, T. N., and Stevenson, C. (2014). Farming the rock: A biogeochemical perspective on intensive agriculture in Polynesia. J. Polynesian Archaeol. 5, 51–61.
Winterhalder, B., Puleston, C., and Ross, C. (2015). Production risk, inter-annual food storage by households and population-level consequences in seasonal prehistoric agrarian societies. Environ. Archaeol. 20, 337–348. doi: 10.1179/1749631415Y.0000000025
Keywords: agricultural potential, nutrient cycling, population dynamics models, Polynesians, density dependence, climate modeling, sweet potato, food-limited demography
Citation: Puleston CO, Ladefoged TN, Haoa S, Chadwick OA, Vitousek PM and Stevenson CM (2017) Rain, Sun, Soil, and Sweat: A Consideration of Population Limits on Rapa Nui (Easter Island) before European Contact. Front. Ecol. Evol. 5:69. doi: 10.3389/fevo.2017.00069
Received: 05 April 2017; Accepted: 14 June 2017;
Published: 10 July 2017.
Edited by:
Valentí Rull, Institute of Earth Sciences Jaume Almera (ICTJA-CSIC), SpainReviewed by:
Agostino Merico, Leibniz Centre for Tropical Marine Research (LG), GermanyMauricio Lima, Pontificia Universidad Católica de Chile, Chile
Copyright © 2017 Puleston, Ladefoged, Haoa, Chadwick, Vitousek and Stevenson. This is an open-access article distributed under the terms of the Creative Commons Attribution License (CC BY). The use, distribution or reproduction in other forums is permitted, provided the original author(s) or licensor are credited and that the original publication in this journal is cited, in accordance with accepted academic practice. No use, distribution or reproduction is permitted which does not comply with these terms.
*Correspondence: Cedric O. Puleston, puleston@ucdavis.edu