Modeling Plankton Mixotrophy: A Mechanistic Model Consistent with the Shuter-Type Biochemical Approach
 Caroline Ghyoot
 Kevin J. Flynn
 Aditee Mitra
 Christiane Lancelot1
  Nathalie Gypens
- 1Ecologie des Systèmes Aquatiques, Université libre de Bruxelles, Brussels, Belgium
- 2Biosciences, Swansea University, Swansea, United Kingdom
Mixotrophy, i.e., the ability to combine phototrophy and phagotrophy in one organism, is now recognized to be widespread among photic-zone protists and to potentially modify the structure and functioning of planktonic ecosystems. However, few biogeochemical/ecological models explicitly include this mode of nutrition, owing to the large diversity of observed mixotrophic types, the few data allowing the parameterization of physiological processes, and the need to make the addition of mixotrophy into existing ecosystem models as simple as possible. We here propose and discuss a flexible model that depicts the main observed behaviors of mixotrophy in microplankton. A first model version describes constitutive mixotrophy (the organism photosynthesizes by use of its own chloroplasts). This model version offers two possible configurations, allowing the description of constitutive mixotrophs (CMs) that favor either phototrophy or heterotrophy. A second version describes non-constitutive mixotrophy (the organism performs phototrophy by use of chloroplasts acquired from its prey). The model variants were described so as to be consistent with a plankton conceptualization in which the biomass is divided into separate components on the basis of their biochemical function (Shuter-approach; Shuter, 1979). The two model variants of mixotrophy can easily be implemented in ecological models that adopt the Shuter-approach, such as the MIRO model (Lancelot et al., 2005), and address the challenges associated with modeling mixotrophy.
Introduction
Traditionally, planktonic protists are separated into two distinct functional groups: the phototrophic phytoplankton and the phago-heterotrophic microzooplankton. However, many protists assigned to these two groups are recognized as capable of combining phototrophy and phago-heterotrophy (Flynn et al., 2013). These mixotrophic protists have been reported in all planktonic functional groups (with the notable exception of the diatoms) and they include a large diversity of mixotrophic types (Flynn et al., 2013). In some mixotrophs, growth is mainly supported by phototrophy (e.g., Cryptomonas ovata; Tranvik et al., 1989) while in others, growth is mainly supported by phagotrophy (e.g., Poterioochromonas malhamensis; Sanders, 1991). Some mixotrophs are forced to use both trophic modes to grow and survive because some essential metabolites come specifically from one of the two metabolic pathways (e.g., the ciliate Laboea strobila; Stoecker et al., 1988); others are facultative mixotrophs (e.g., the dinoflagellate Fragilidium duplocampanaeforme; Park et al., 2015). Some mixotrophs use their second trophic mode to fulfill carbon requirements (e.g., the haptophyte Chrysochromulina brevifilum; Stoecker, 1998); for others, it is a means to fulfill nutrient requirements (e.g., the dinoglagellate Prorocentrum minimum; Stoecker, 1998); and for others yet, it is a mechanism to get specific metabolites (as phospholipids; Kimura and Ishida, 1989).
Among this large diversity of mixotrophic types, a major distinction can be made between mixotrophs depending on whether they photosynthesize using their own chloroplasts or using chloroplasts acquired from their phototrophic prey (Mitra et al., 2016). Mixotrophs that actively synthesize and maintain their own chloroplasts are called constitutive mixotrophs (CMs). Mixotrophs that do not constitutively synthesize chloroplasts but photosynthesize using chloroplasts acquired from their phototrophic prey are called non-constitutive mixotrophs (NCMs). The acquired chloroplasts in NCMs remain functional for periods ranging from hours to days, depending on the type of NCM (Mitra et al., 2016). Generalist NCMs, i.e., those that acquire chloroplasts from a broad range of phototrophic prey, have a poor ability to maintain functional chloroplasts (Dolan and Pérez, 2000). By contrast, specialist NCMs, i.e., those that need to acquire chloroplasts from specific phototrophic prey, can maintain a photosynthetic activity for long periods (Stoecker et al., 2009; Hansen et al., 2013). Specialist NCMs can further be divided into those that retain the entire photosynthetic prey (endosymbiosis) and those that only retain the chloroplasts (kleptochloroplasty; Mitra et al., 2016). In a functional capacity, the CMs are closer to the strict phototrophs while the NCMs are closer to the strict phago-heterotrophs.
While mixotrophy has been reported for a long time, it is now appreciated as being much more widespread in aquatic ecosystems than initially thought. Previously, the mixotrophic status was only accorded to some dinoflagellates, forams, radiolarian, and acantheria while now, mixotrophy has been acknowledged in all eukaryote planktonic microorganism groups, except diatoms (Sanders and Porter, 1988; Burkholder et al., 2008; Flynn et al., 2013). In addition, these species are not limited to a specific habitat: mixotrophs are observed in both freshwater and marine (Sanders, 1991; Stoecker et al., 2009), oligotrophic and eutrophic systems (Burkholder et al., 2008), and from polar to equatorial regions (Zubkov and Tarran, 2008; Stoecker et al., 2009; Sanders and Gast, 2012). In coastal areas, mixotrophic flagellates can account for some 50% of the pigmented biomass (Havskum and Riemann, 1996) and chloroplast-containing ciliates can account for 40–>60% of the planktonic ciliates in summer (Stoecker et al., 1987; Bernard and Rassoulzadegan, 1994). In oceanic waters, mixotrophs account for 40–95% of the bacterivory in the euphotic layer (Zubkov and Tarran, 2008).
Constitutive mixotrophy is suggested to play an important ecological role when inorganic nutrients are low (e.g., in oligotrophic systems; e.g., Arenovski et al., 1995) or unbalanced (e.g., in eutrophied systems; e.g., Nygaard and Tobiesen, 1993; Burkholder et al., 2008), and when light is limiting (e.g., during the polar night or occasionally in eutrophied systems; e.g., Bird and Kalff, 1986; Roberts and Laybourn-Parry, 1999; Jones et al., 2009). In such systems, prey ingestion provides nutrients and energy. Similarly, non-constitutive mixotrophy may be advantageous in “high light–low prey” ecosystems (e.g., in oligotrophic systems; e.g., Skovgaard, 1998; Hansen et al., 2013) because acquired phototrophy supplies carbon by photosynthesis. Finally, mixotrophy is worthy of interest in an environmental perspective because most marine harmful algae have been reported as mixotrophs (Stoecker et al., 2006; Burkholder et al., 2008; Jeong et al., 2010).
Several models have been developed with the specific aims of exploring planktonic mixotrophy from an ecophysiological or ecological (species competition) perspective. Most interest has been leveled at the potential impact of mixotrophs on the microbial food web structure and functioning, and the conditions under which mixotrophs may likely coexist with strict phototrophs and heterotrophs (Thingstad et al., 1996; Baretta-Bekker et al., 1998; Stickney et al., 2000; Jost et al., 2004; Hammer and Pitchford, 2005; Hood et al., 2006; Flynn and Mitra, 2009; Crane and Grover, 2010; Ward et al., 2011; Våge et al., 2013). By far the greater effort has been applied to CM organisms. The complexity of the model structure varies widely among such studies. The simplest models describe mixotrophy as the ability to combine both phototrophy and heterotrophy without any feedbacks or trade-offs between the two nutritional modes and organisms have a fixed stoichiometry (e.g., Hammer and Pitchford, 2005). At the other extreme, the most complex model explicitly describes the main regulative processes that occur between phototrophy and heterotrophy in the mixotroph and allows for a variation of the cellular stoichiometry (Flynn and Mitra, 2009).
Despite the potential significance of mixotrophy in aquatic systems and the existence of mathematical models describing this trophic mode, few ecological/biogeochemical models consider it explicitly (e.g., Mitra et al., 2014). Those models that do include mixotrophs demonstrate the potential for mixotrophy to significantly impact the flow of energy and nutrients in the system. In particular, primary production can potentially be increased by a factor 2 compared to a system in which mixotrophy is not considered, thanks to a shortened and more effective chain from nutrient regeneration to primary production (Mitra et al., 2014).
Considering mixotrophy in biogeochemical/ecological models is however challenging due to the large diversity of mixotrophic types, the scarcity of data allowing the parameterization of physiological processes, and the need to make the inclusion of mixotrophy into existing ecosystem models as simple as possible. Indeed, the addition of a mixotroph functional type description into ecosystem models will inevitably be tempered by the structure of the extant ecosystem model.
Regarding the diversity of mixotrophic types, this paper proposes a flexible mechanistic model featuring the two main types of mixotrophy: constitutive and non-constitutive. The two mixotrophic types have indeed different ecophysiology and different relation to their prey (the NCM being strictly dependent on the presence of prey); therefore, they affect differently the ecosystem dynamics (Mitra et al., 2016). In addition, the version describing constitutive mixotrophy can be configured to represent either CMs that favor either phototrophy or heterotrophy. Simulations have been performed to compare each mixotrophic type with the strict trophic type it most closely resembles from a functional perspective (the CM with the strict phototroph and the NCM with the strict heterotroph) in order to explore the competitive advantage of mixotrophy over strict forms.
As for the explicit inclusion of mixotrophy into existing biogeochemical/ecological models, we were mainly interested in introducing mixotrophy in a form consistent with the mechanistic structure of the AQUAPHY model (Lancelot et al., 1991); this model has been used to describe primary production via phytoplankton growth physiology within several biogeochemical models (Billen et al., 1994; Lancelot et al., 2000, 2005). A feature of AQUAPHY is that the total cellular carbon is divided into separate classes of components on the basis of their function: these comprise synthetic and structural material (i.e., photosynthetic apparatus, ribosomes, genetic material, membranes, etc.), stored carbon (i.e., carbohydrates, lipids), and carbon monomers (i.e., photosynthetic products and precursors of complex molecules). This mechanistic approach was suggested by Shuter (1979) as a means to successfully describe the observed behavior of a variety of unicellular algal species, qualitatively and quantitatively. The work is thus a first step in the implementation of mixotrophy in the biogeochemical models that adopt a “Shuter mechanistic approach” to describe the phytoplankton physiology.
Methods
Constitutive Mixotrophy
The model of constitutive mixotrophy was constructed on the basis of the following hypotheses, summarizing the main qualitative observations related to CMs : (i) the CM is preferentially phototrophic but it can supplement its nutrient requirements (under inorganic nutrient limitation) or its carbon requirements (under light limitation) by ingesting prey (e.g., in Jones et al., 1995; Carvalho and Granéli, 2010; McKie-Krisberg et al., 2015); (ii) the maximum mixotrophic growth is not allowed to exceed the maximum phototrophic growth; (iii) the phototrophic growth has to account for at least 10% of the mixotrophic growth, such that we describe an obligate phototroph (Caron et al., 1993; Brutemark and Granéli, 2011); (iv) the nutrients regenerated by heterotrophic activity (, ) are re-assimilated to sustaining phototrophic growth with any surplus being excreted (Flynn and Mitra, 2009).
The model combines an adaptation of the AQUAPHY model (Lancelot et al., 1991; Ghyoot et al., 2015) for the phototrophic pathway, coupled to a simple zooplankton model (Lancelot et al., 2005) for the phago-heterotrophic path. It is important to note that, in keeping with the formulation of the AQUAPHY model, the description of mixotrophy given here describes biomass growth (i.e., molC m−3 time−1) rather than per capita growth (i.e., C C−1 time−1) as in some other models (e.g., Flynn and Mitra, 2009). Figure 1A shows the schematic representation of the CM growth physiology, linking the phototrophic (dark gray) and heterotrophic (light gray) components. The CM model contains six state variables (Table 1) describing intracellular components on the basis of their function: the functional and structural metabolites (e.g., nucleic acids, proteins) synthesized by phototrophic and heterotrophic activities (Fphot and Fhet, respectively), soluble carbon monomers (i.e., early products of photosynthesis; SC), carbon reserves (i.e., carbohydrates, fatty acids; RC), intracellular soluble phosphate (SP), and intracellular soluble inorganic nitrogen (SN). The total C-cell biomass (mmolC m−3) is given by the sum of Fphot, Fhet, SC, and RC. The Fphot and Fhet pools are assumed to have a fixed C:N:P stoichiometry, based on biochemical constraints (Geider and Laroche, 2002). Variable cellular stoichiometry is enabled by considering the additional C, P, and N accumulated as carbon monomers (SC), carbohydrates and fatty acids (RC), soluble inorganic phosphorus (SP), and soluble inorganic nitrogen (SN). The model of constitutive mixotrophy is linked to three state variables describing external inorganic nutrients—dissolved inorganic nitrogen (DIN = + ) and phosphate ()—and also the prey which in reality expresses a variable C:N:P stoichiometry (though here prey stoichiometry is fixed as the emphasis is on the description of the autecology of the mixotrophs, rather than system ecology).
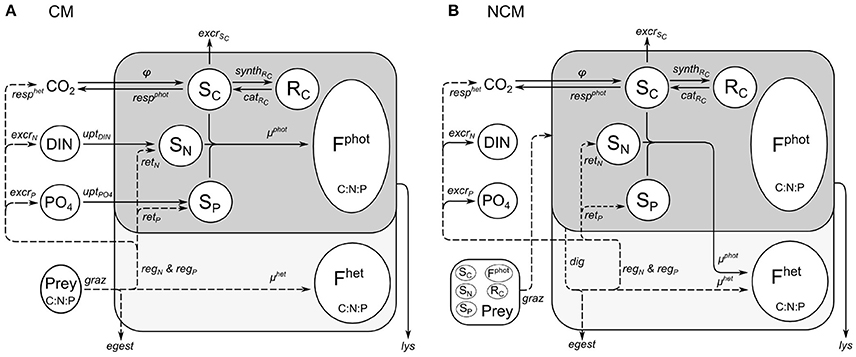
Figure 1. Schematic representation of functioning of constitutive mixotroph (CM; A) and non-constitutive mixotroph (NCM; B). Total mixotroph biomass is divided into six components: structural and functional metabolites related to phototrophic activity (Fphot) and heterotrophic activity (Fhet), carbon monomers (SC), carbon reserves (RC), soluble inorganic nitrogen (SN), and soluble inorganic phosphorus (SP). The “dark gray part/solid lines” is the phototrophic part and the “light gray part/dashed lines” is the heterotrophic part.
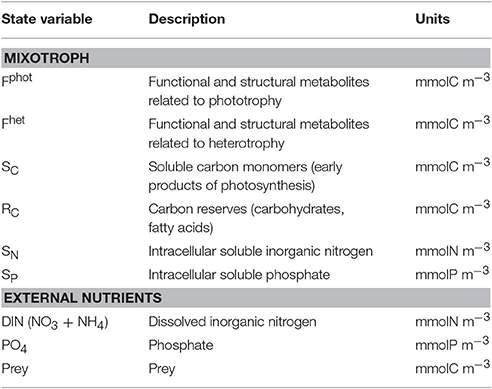
Table 1. Model state variables (all expressed as a concentration in water).
Tables 2, 3 show, respectively, the nine conservation equations related to the state variables and the associated processes. Phototrophic growth (μphot; Equation 17) is controlled by the concentration of the structural and functional metabolites related to phototrophic activity (Fphot), by the limitation in carbon monomers SC—either directly produced by photosynthesis (φ; Equation 20) or indirectly by RC catabolism (catRC; Equation 10)—and by the limitation in internal soluble inorganic nutrients (SN and SP). The SC limitation is formulated by a Michaelis–Menten equation in which the substrate concentration is expressed by XSC−kSC, with and kSC, which is the minimum value for XSC (assumed to be equal to the half-saturation constant for SC assimilation). The inorganic nutrient limitation is formulated by the Liebig's minimum law in which the limitation for each nutrient is expressed by a hyperbolic function depending on XSN,P (the ratio between SN,P and the N,P contained in Fphot). The uptake of inorganic nutrients (uptDIN and uptPO4; Equations 26 and 27) depends on the external nutrient concentration and the status of the internal nutrient reserve. The phototrophic respiration (respphot; Equation 22) includes costs for cellular maintenance and for synthesis of new Fphot.
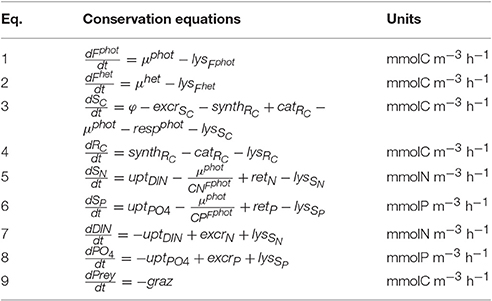
Table 2. Conservation equations for the constitutive mixotroph (CM).
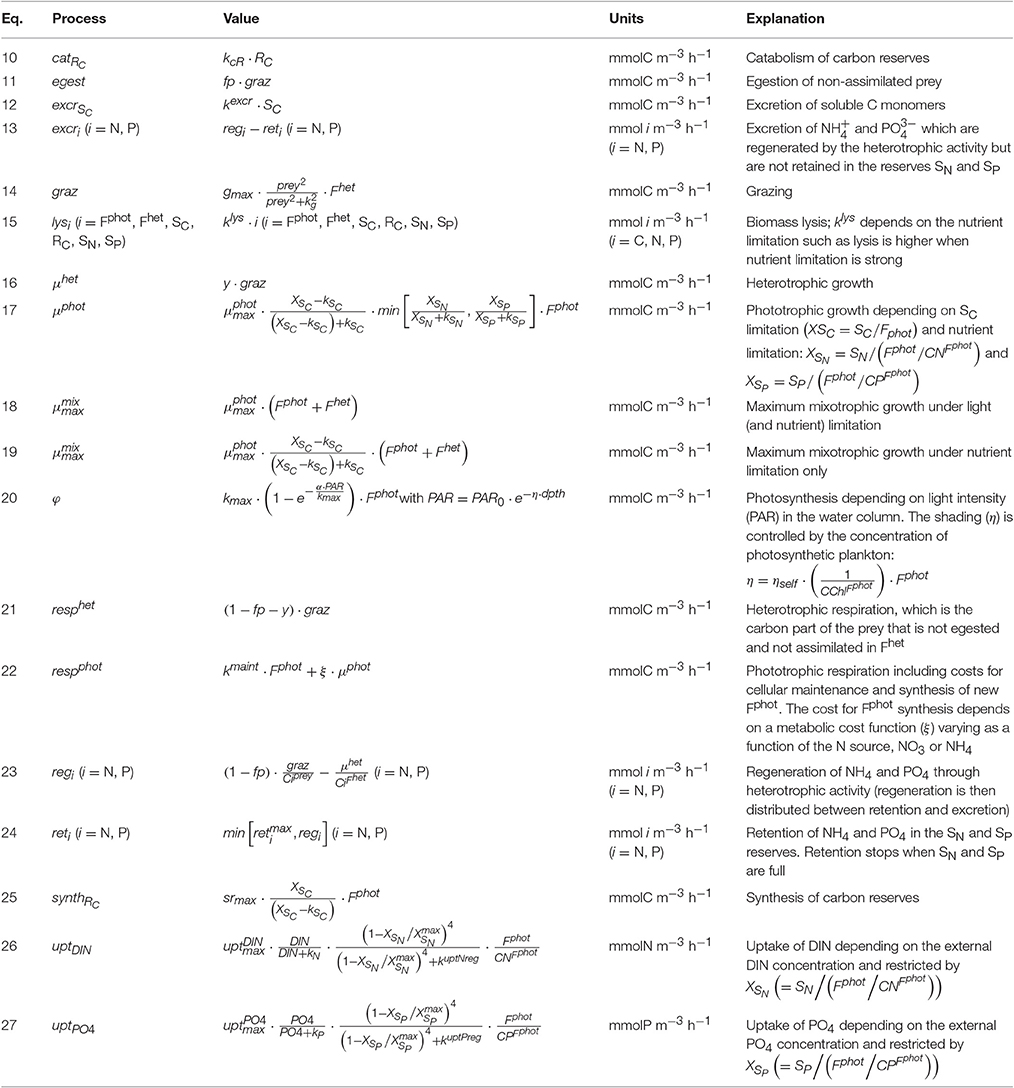
Table 3. Equations that describe the processes occurring in the constitutive mixotroph (CM).
Prey ingestion (graz; Equation 14) is controlled by the concentration of the structural and functional metabolites related to heterotrophic activity (Fhet) and by prey availability; the latter is controlled by a sigmoid (type III) function. From the ingested prey, a non-assimilated fraction is egested (egest; Equation 11) as dissolved and particulate organic matter (loss terms), a fraction is respired to meet the heterotrophic metabolic costs and is released as carbon dioxyde (resphet; Equation 21), and the last fraction is assimilated and contributes directly to the heterotrophic growth (μhet; Equation 16). If the nutrient content of the prey is higher than the nutrient required by Fhet, the surplus is regenerated as and (regi with i = N, P; Equation 23). These regenerated nutrients can be retained up to a maximum level in the inorganic nutrient reserves SN and SP (reti; Equation 24), contributing to the phototrophic growth. If the reserve capacity is full, the surplus is excreted to the environment (excri; Equation 12).
Mixotrophic growth is computed as the sum of the phototrophic and the heterotrophic growth rate, but limited by the maximum mixotrophic growth. The latter is computed differently according to whether phagotrophy is used to offset a lack of carbon or a lack of nutrients. When the 24 h-average SC limitation is below a threshold value () set here as 0.15, we assumed that the mixotroph switches to perform increasing levels of phagotrophy to acquire carbon (in addition to nutrients if also nutrients limited) and, therefore, the maximum mixotrophic growth is equal to the phototrophic growth obtained with no limitation (; Equation 18). When the 24 h-average SC limitation is above this threshold value, we assumed that the CM undertakes phagotrophy to acquire nutrients and, therefore, the maximum mixotrophic growth is equal to the phototrophic growth obtained with no nutrient limitation (; Equation 19). If the sum of the phototrophic and the heterotrophic growth is higher than the maximum mixotrophic growth, either the grazing or the photosynthesis rate is regulated to limit the mixotrophic growth to its maximum. In other terms, the mixotroph can favor either phototrophic or heterotrophic growth. The model offers the possibility to test either of these two configurations: the CM that regulates its grazing rate (i.e., tends to grow phototrophically) hereafter referred to as “Reggraz” and the CM that regulates its photosynthesis (i.e., tends to grow heterotrophically) hereafter referred to as “Regphot.” In either case, we assumed that phototrophic growth has to represent at least 10% of the mixotrophic growth. This implies that phagotrophy cannot sustain growth under prolonged dark conditions because of an obligatory demand for products of photosynthesis.
Parameter values were selected here to describe constitutive mixotrophic nanoflagellates that graze on bacteria to fulfill nutrient or energy requirements (Table 4). Parameters related to phototrophic carbon pathways are those of phototrophic nanoflagellates as used in the MIRO model (the MIRO model being a biogeochemical model that uses AQUAPHY to represent phytoplankton growth and that describes the planktonic ecosystem of the Southern North Sea; Lancelot et al., 2005). Parameters related to phototrophic P-pathways are similar to those presented in Ghyoot et al. (2015). Parameters related to phototrophic N-pathways and parameters related to heterotrophic activity were estimated by implementing the mixotrophy model into the MIRO model and by tuning the model against observations reported in the Belgian coastal zone (Ghyoot et al., submitted). Observations used in that tuning included plankton biomass (bacteria, nanoflagellates, diatoms, Phaeocystis colonies, microzooplankton, and copepods) and nutrient concentrations [, , , and dissolved silica (DSi)].
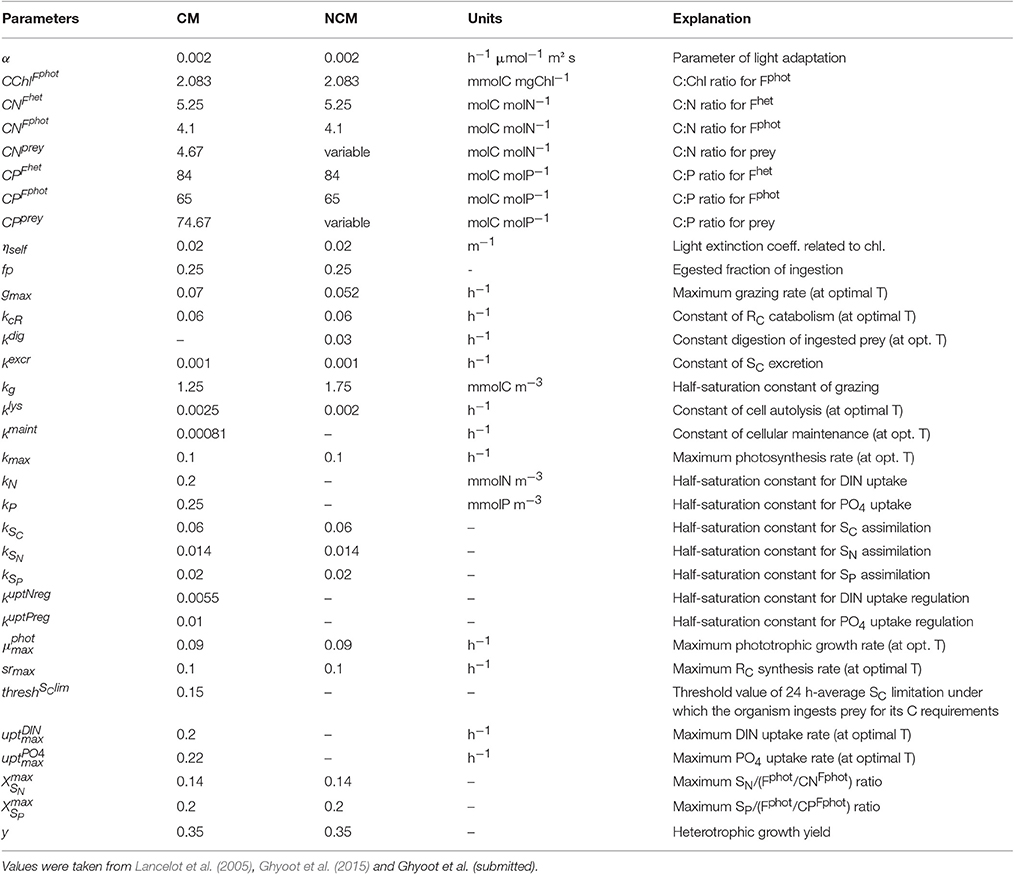
Table 4. Constant parameters used in the constitutive mixotroph (CM) and non-constitutive mixotroph (NCM) models.
Single parameter steady-state model sensitivity to parameters values was studied with the method of Haefner (1996). The model was run under “low DIN–high prey” chemostat-type conditions and a normalized sensitivity index (SI; Equation 28) based on steady-state biomass was calculated for each parameter:
Where Rref is the value of CM biomass reached at steady-state with the reference parameter value pref (Table 4) and R is the value of CM biomass reached at steady-state with p, the reference parameter increased/decreased by 25%. The SI-value is thus a measure of the relative variation of CM biomass compared to the relative variation of the parameter.
Non-constitutive Mixotrophy
We constructed the model of non-constitutive mixotrophy on the basis of available qualitative observations specific to this type of mixotrophy: (i) the photosynthetic capacity of the ingested phototrophic prey is retained for some time in the food vacuole so that it provides carbon to the mixotroph (Skovgaard, 1998); (ii) in the food vacuole, there is no replication of the functional metabolites related to phototrophy; they are only supplied by phagotrophy on phototrophic prey; (iii) the digestion rate of the ingested phototrophic prey is constant; (iv) nutrients regenerated through heterotrophic activity (, ) can be retained for the phototrophic activity while the excess is excreted outside the cell; (v) there is no inorganic nutrient uptake (we assume these NCMs are generalist rather than specialist NCMs; the latter, such as Mesodinium and Dinophysis, are capable of using externally supplied inorganic nutrients; Hansen et al., 2013); (vi) the organism does not require some level of phototrophy to grow, meaning that we describe a facultative mixotroph (but a minimum level of phagotrophy is required for obtaining chloroplasts).
As for the model of constitutive mixotrophy, the model of non-constitutive mixotrophy combines the AQUAPHY model for the phototrophic path and a simple zooplankton model for the heterotrophic path. Figure 1B shows the schematic representation of the NCM growth physiology, showing the heterotrophic (light gray) and phototrophic (dark gray) components. While the model of non-constitutive mixotrophy deploys the same six state variables as the model of constitutive mixotrophy and operates with the same external factors (Table 1), some conservation equations (Table 5) and processes (Table 6) differ. The differences mainly rely on the fact that NCMs acquire their phototrophic capacity by ingesting phototrophic prey and they are not able to permanently maintain this capacity.
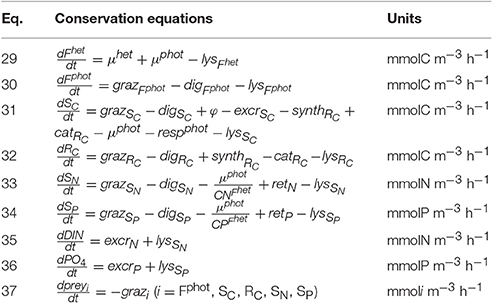
Table 5. Conservation equations for the non-constitutive mixotroph (NCM).
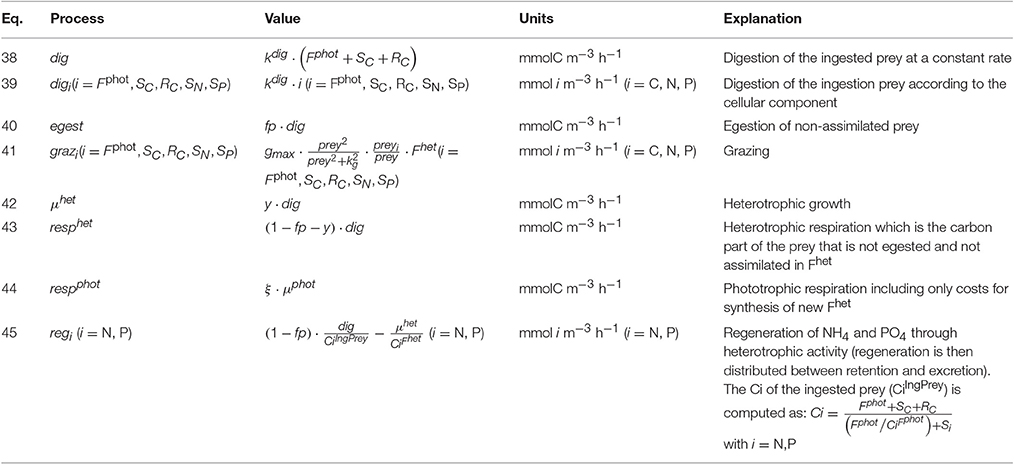
Table 6. Equations that describe the processes occurring in the non-constitutive mixotroph (NCM).
The phototrophic prey biomass (prey) is characterized by the five phototrophic compounds usually used within AQUAPHY: Fphot, SC, RC, SN, and SP (we have therefore: , preySC, preyRC, preySN, and preySP). The grazing on each of these five compounds (grazi with i = Fphot, SC, RC, SN, SP; Equation 41) is computed as the grazing on the total prey biomass () relative to the compound concentration. Once ingested by the NCM, the five compounds are distributed to their corresponding pools. As there is no mechanism for synthesis or maintenance of Fphot in the NCM configuration, Fphot is exclusively supplied via grazing on photrophic (Equation 30). SC, RC, SN, and SP are supplied by the grazing but also by other (phototrophic and heterotrophic) processes (Equations 31–34). Photosynthesis and RC catabolism supply SC in the same way as in the model of constitutive mixotrophy (φ; cf. Equation 20 and catRc; cf. Equation 10). RC synthesis supplies RC, as in the model of constitutive mixotrophy (synthRc; cf. Equation 25), while nutrient retention supplies SN and SP (reti with i = N, P; cf. Equation 24).
The phototrophic components obtained by grazing enables phototrophic growth to be computed as for the model of constitutive mixotrophy (μphot; cf. Equation 17) but now the phototrophic growth supports the production of Fhet instead of Fphot (Equation 29). As there is no synthesis and maintenance of Fphot, phototrophic respiration includes only costs for the synthesis of Fhet (respphot; Equation 44).
The phototrophic components in NCMs (Fphot, SC, RC, SN, SP) are continuously degraded (de facto digested) at a constant rate (digi with i = Fphot, SC, RC, SN, SP; Equation 39). The digested material has three possible fates: the non-assimilated material is egested outside the cell (egest; Equation 40) as dissolved and particulate organic matter, a fraction of the assimilated material is respired (resphet; Equation 43) to meet the heterotrophic metabolic costs, and the remaining fraction is used for heterotrophic growth (μhet; Equation 42). If the C:N:P stoichiometry of the digested prey is higher than the C:N:P stoichiometry of Fhet, , and are regenerated (regi with i = N, P; Equation 45). These nutrients can be retained in SN and SP and contribute to the phototrophic growth (reti with i = N, P calculated as in CM; cf. Equation 24). As we assumed that inorganic nutrient uptake does not occur in NCMs, these retained inorganic nutrients are the only ones that allow phototrophic growth. If the reserves SN and SP are full, the regenerated nutrients are excreted outside the cell (excri with i = N, P calculated as in CMs; cf. Equation 13).
With the selected parameters values (Table 4), the model describes a generalist non-constitutive mixotrophic microzooplankton (ciliate) that feeds on phototrophic nanoflagellates and uses their chloroplasts to photosynthesize. The value of the constant rate of degradation of acquired photosystems is 0.03 h−1, the same as in Flynn and Hansen (2013). The other parameters related to heterotrophic processes were estimated by implementing the mixotrophy models into the MIRO model that describes the planktonic ecosystem of the Southern North Sea and by tuning the model against observations reported in this area (Ghyoot et al., submitted). Parameters values involved in phototrophic processes are those of the phototrophic prey, i.e., the nanoflagellates, as in the model of constitutive mixotrophy.
Model sensitivity to the parameter values was studied with the method of Haefner (1996) as described above for the model of constitutive mixotrophy (Equation 28).
Results
Constitutive Mixotrophy
In order to explore the qualitative behavior of the CM under different environmental conditions, we ran the model of constitutive mixotrophy under steady-state conditions with various values of DIN (ranging from 0 to 20 mmolN m−3) and prey (bacteria) biomass (ranging from 0 to 20 mmolC m−3). These simulations were run under two contrasting photon flux densities (30 and 200 μmol quanta m−2 s−1). Conditions are such that P never limits the growth and the prey is considered as “inert” (i.e., bacteria growth and metabolism is not described). The two possible regulation mechanisms (photosynthesis “Regphot” vs. grazing “Reggraz”) limiting the mixotrophic growth to its maximum were tested. The performance of the two CMs (“Reggraz” and “Regphot”) is compared with that of the strict phototrophic nanoflagellate when growing under the same growth conditions.
Under high photon flux density (Figure 2), the growth rate of the strict phototroph decreases to zero as DIN decreases to zero because phototrophic growth is prevented by the lack of DIN (Figure 2A). By contrast, when prey concentration is higher than 4 mmolC m−3, the growth rate of the two CM configurations (“Reggraz” and “Regphot”) does not vary as a function of DIN because the lack of DIN is offset by bacteria ingestion (Figures 2F,K). De facto, the model captures correctly the competitive advantage of the mixotrophs at low inorganic nutrient concentration and high prey concentration. The grazing rate of the two CMs varies in function of the external conditions: it increases when prey concentration increases and when DIN decreases (Figures 2H,M). Thanks to their grazing activity, at low DIN, the photosynthesis rate of the two CMs decreases less than the photosynthesis rate of the strict phototroph (Figures 2B,G,L). When mixotrophs ingest prey under high photon flux density, the entire part of the regenerated DIN is retained inside the cell to sustain phototrophic activity (Figures 2J,O); there is no NH4 excretion (Figures 2I,N). Under this photon flux density, there is no noticeable difference between the two mixotrophic configurations (CM “Reggraz” vs. CM “Regphot”).
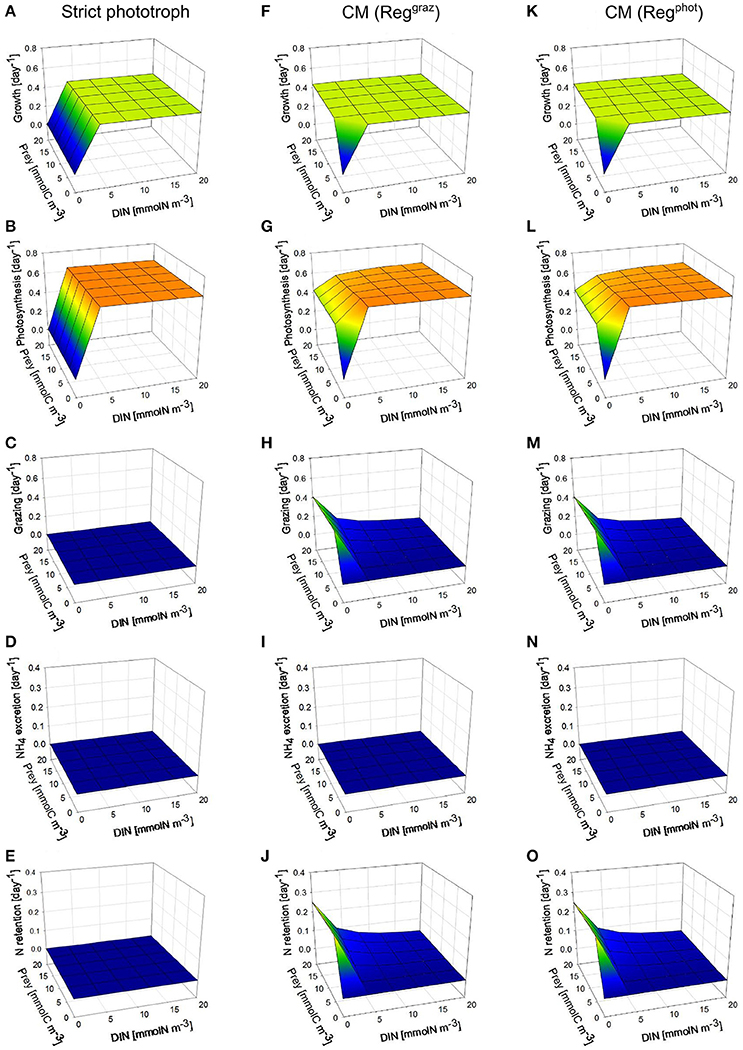
Figure 2. Comparison between steady-state behaviors of two different types of constitutive mixotrophs (CMs; middle and right column) and a strict phototroph (left column, A–E), under constant high photon flux density (200 μmol quanta m−2 s−1) and under different DIN and prey biomass. The two CMs differ by their propensity to use either phototrophy or heterotrophy to grow: CM “Reggraz” (middle column, F–J) tends to down-regulate its grazing rate while CM “Regphot” (right column, K–O) tends to down-regulate its photosynthesis. With the physiological parameters used, the model describes a phototrophic nanoflagellate and mixotrophic nanoflagellates grazing on bacteria. Growth, photosynthesis and grazing rates are expressed in C C−1 day−1 while NH4 excretion and N retention rates are expressed in N N−1 day−1.
Under low photon flux density (Figure 3), the strict phototroph cannot grow in any nutrient conditions because the carbon monomers (SC) limitation (which is controlled by the light limitation) is too high to allow steady-state growth rates above zero (Figure 3A). In function of its configuration, the CM behaves differently: the CM “Reggraz” is able to grow under specific DIN and prey conditions (Figure 3F) while the CM “Regphot” has a zero steady-state growth in all conditions (Figure 3K). This different behavior is explained by the initial hypothesis used to construct the model, i.e., a minimum level of phototrophic growth (involving inorganic nutrient assimilation) is needed to allow prey ingestion. When the “Regphot” configuration is used, the CM down-regulates its photosynthesis when the maximum mixotrophic growth is attained, instead of its grazing. Therefore, phototrophy is more constrained in this “Regphot” configuration and the minimum level of phototrophic growth required to allow prey ingestion is not attained. The hypothesis of a minimum level of phototrophy also explains that the CM “Reggraz” cannot take advantage of its ability to ingest prey at low DIN, as phototrophy involves inorganic nutrient assimilation (Figure 3F). By comparison with the high photon flux density conditions, the regenerated DIN related to phagotrophic activity is not entirely retained inside the cell; a significant part is excreted outside the cell (Figure 3I) because the demand is lower due to the low photosynthesis rate (Figure 3G). Without the hypothesis of a minimum level of phototrophic growth, the behavior of the two CMs is similar a steady-state growth rate is reached around 0.3 day−1 when prey is available (not shown).
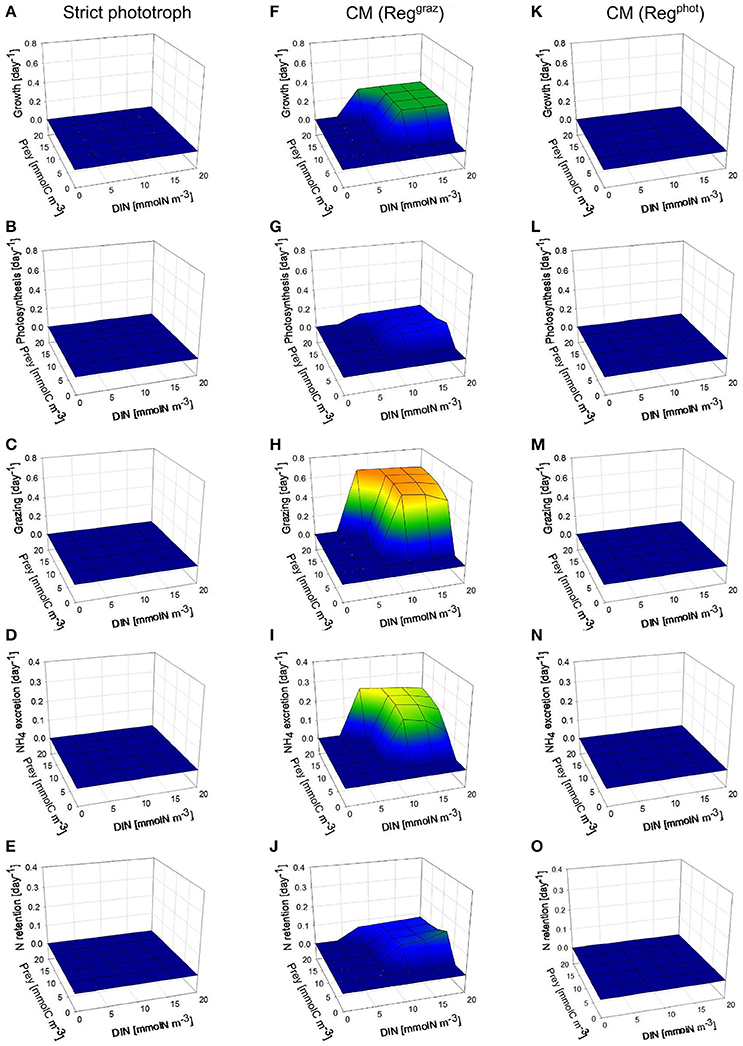
Figure 3. As Figure 2 except under constant low photon flux density (30 μmol quanta m−2 s−1).
The sensitivity analysis conducted on the physiological parameters involved in the model of constitutive mixotrophy shows that parameter rankings constructed on the basis of the sensitivity index (SI; Equation 28) differ according to the model configuration selected, i.e., “Reggraz” or “Regphot” (Figures 4A,B). Because grazing is the process that is regulated when the configuration “Reggraz” is selected, the parameters related to phago-heterotrophy have proportionally a higher impact on the model response (as shown on the left part of the ranking; Figure 4A). By contrast, if the configuration “Regphot” is selected, the parameters related to phago-heterotrophy are located on the right part of the ranking, indicating that they have a lower impact than parameters related to phototrophic processes (Figure 4B). Despite the difference of parameter appearance in the ranking, the two model configurations are generally low-sensitive to most of parameters in the range of the tested values; 17 out of 22 parameters have a SI < 0.4 for “Reggraz” and 15 out of 22 parameters have a SI < 0.4 for “Regphot”, meaning that a 25% change of their reference value induces <10% change of the mixotroph biomass reached at steady-state.
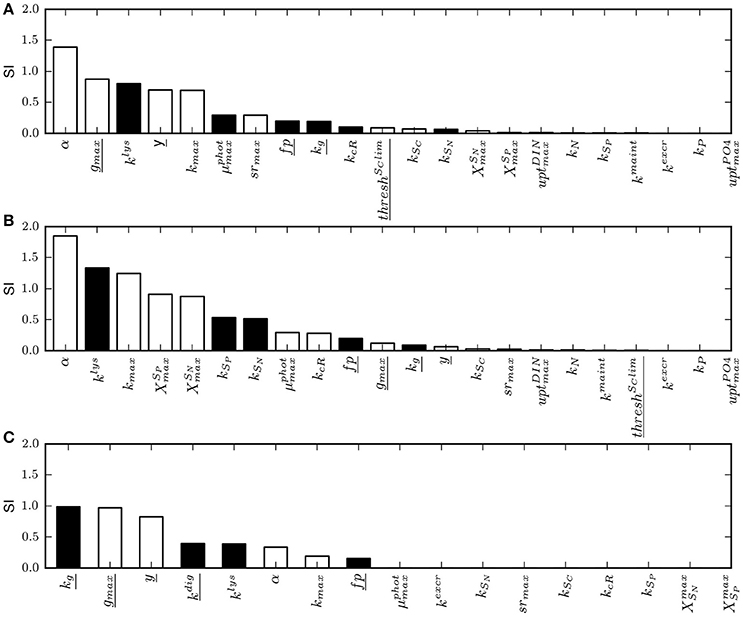
Figure 4. Ranking of model parameters based on their normalized sensitivity index (SI) calculated as in Equation (28) for a 25% change of the parameter value. White bars are parameters for which the model response (the mixotroph biomass) is positive when the parameter value is increased. Inversely, black bars are parameters for which the model response is negative when the parameter value is increased. (A) SI obtained with the model of constitutive mixotrophy for the configuration “Reggraz”, (B) SI obtained with the model of constitutive mixotrophy for the configuration “Regphot,” (C) SI obtained with the model of non-constitutive mixotrophy. Underlined parameters are those related to heterotrophic processes. See Table 4 for full description of parameters.
Non-constitutive Mixotrophy
To study the behavior of the NCM, we ran the model under steady-state conditions for various prey (a phototrophic nanoflagellate) biomass (ranging from 0 to 20 mmolC m−3) and for various DIN-values (ranging from 0 to 20 mmolN m−3). These simulations were run under two contrasting photon flux densities (30 and 200 μmol quanta m−2 s−1). As for the model of constitutive mixotrophy, we considered the prey as inert, meaning that the metabolism of the phototrophic prey is not active. The behavior of the NCM is compared with that of a strict heterotrophic microzooplankton under the same growth conditions.
Under high photon flux density (Figure 5), the NCM can grow at lower prey concentrations than the strict heterotroph (Figures 5A,F) because the NCM takes advantage of the photosynthetic capacity of the prey retained in the food vacuole for C supply (Figures 5B,G) and of inorganic nutrient retention from heterotrophic regeneration (Figures 5E,J). DIN concentration has no impact on the NCM growth rate because we assumed that the NCM is not able to take up inorganic nutrients; the inorganic nutrients required for phototrophic growth are only provided by nutrient recycling from prey digestion. As photosynthesis in the NCM relies exclusively on the acquired prey chloroplasts, when prey concentration is lower than 5 mmolC m−3, the NCM cannot grow so well because the grazing is limited by the low prey availability (Figures 5F–H). With the model configuration used, the grazing rate of the NCM is lower than the grazing rate of the strict heterotroph at prey concentration higher than 8 mmolC m−3 (Figures 5C,H). The difference is explained by the phototrophic growth that contributes to the mixotrophic growth by providing photo-assimilated C (Figure 5G) and inorganic nutrient from nutrient retention (Figure 5J). This illustrates the benefit of the close interactions that occur between phototrophy and heterotrophy inside the mixotrophic cell. At high prey concentrations, NH4 excretion is substantially lower for the NCM than for the strict heterotroph (Figures 5D,I). Given the low N retention observed for the NCM (Figure 5J), the difference cannot be only explained by the ability of the NCM to retain a part of the regenerated N for its phototrophic growth. The difference is actually due to a different N regeneration for the strict heterotroph and the NCM (N regeneration being defined here as the sum of NH4 excretion and N retention). As the grazing rate of the NCM is lower than that of the strict heterotroph at high prey concentration, N regeneration is lower for the NCM. In addition, when the NCM photosynthesizes thanks to the chloroplasts acquired from its prey, it can use a part of the N inorganic pool (SN) of the prey to grow phototrophically. This process tends to increase the C/N stoichiometry of the prey so that N regeneration issued from prey digestion is lower (Equation 45). The latter effect is particularly important at high photon flux density because the nutrient demand for phototrophic growth is higher.
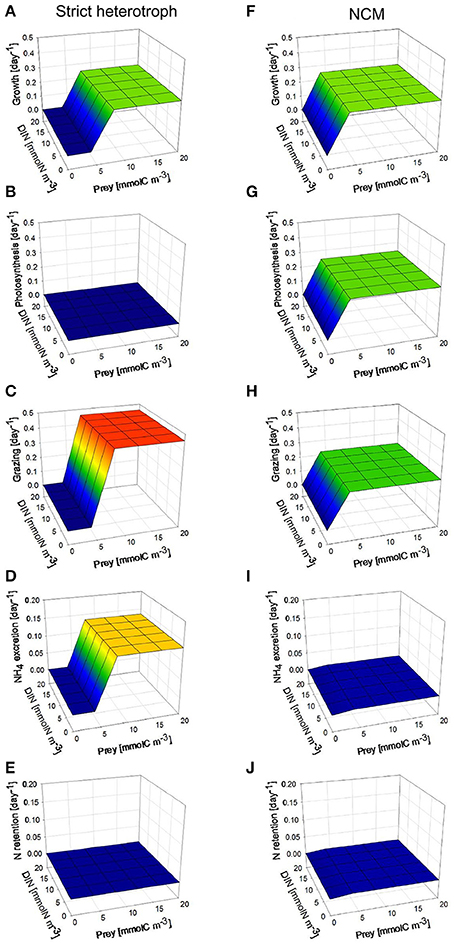
Figure 5. Comparison between steady-state behaviors of a non-constitutive mixotroph (NCM; right column, F–J) and a strict heterotroph (left column, A–E), under constant high photon flux density (200 μmol quanta m−2 s−1) and under different prey biomass. With the physiological parameters used, the model describes a strict phago-heterotrophic microzooplankton (ciliate) and a mixotrophic ciliate that both graze on a phototrophic nanoflagellate. Growth, photosynthesis, and grazing rates are expressed in C C−1 day−1 while NH4 excretion and N retention rates are expressed in N N−1 day−1.
Under low photon flux density (Figure 6), the growth rates of the NCM are the same as those obtained under high photon flux density (Figures 6A,F) because the decrease of photosynthesis rate in the NCM (Figure 6G) associated with the lower photon flux density is offset by an increase of grazing rate (Figure 6H). As we assumed that the NCM was a facultative mixotroph (i.e., does not require some level of photosynthesis to grow), it is not impacted by the low light. Due to its higher grazing rate, NH4 excretion and N retention by the NCM are slightly higher than under high photon flux density (Figures 6I,J).
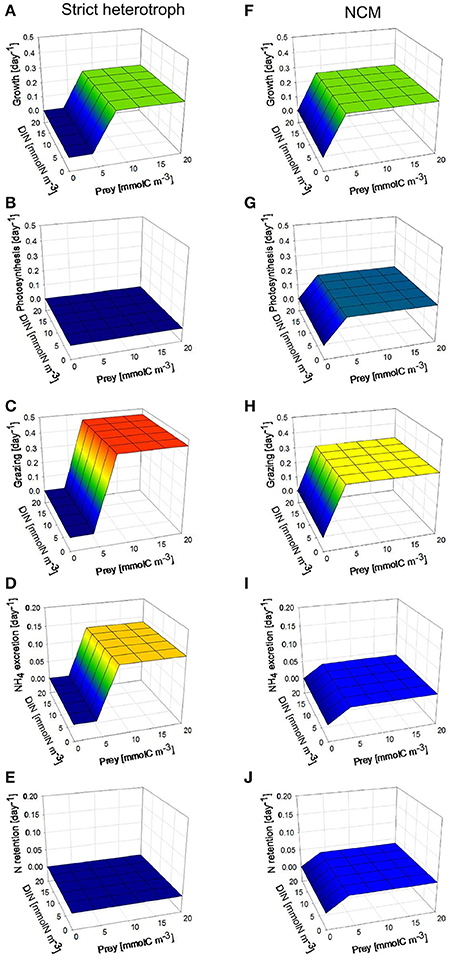
Figure 6. As for Figure 5 but under constant low photon flux density (30 μmol quanta m−2 s−1).
The sensitivity analysis conducted on the physiological parameters involved in the model of non-constitutive mixotrophy (Table 4) shows that the parameters that have the highest impact on the model response (here, in terms of steady-state biomass) are those related to heterotrophic activity (Figure 4C). As the grazing directly controls the heterotrophic growth as well as the phototrophic growth, it is not surprising to observe that the half-saturation constant for grazing (kg) and the maximum grazing rate (gmax) are the two first parameters in the ranking. Among parameters related to heterotrophic activity, the half-saturation constant for prey digestion (kdig) is the most problematic to measure experimentally. Further, it is an important parameter because it directly controls the extent to which the organism is able to use phototrophy, as a low kdig means that the organism maintains the kleptochloroplasts active during a long period while a high kdig means that the organism rapidly digests the kleptochloroplasts and thus, approaches the strict heterotrophic organism. However, the model is rather robust against kdig changes because SI = 0.4, meaning that a 25% change of its reference value only induces a 10% change of the mixotroph biomass reached at steady-state.
Parameters related to phototrophic activity are generally of lower importance as most of them have a SI < 0.003, meaning that a 25% change of the parameter value induces a 0.075% change of the mixotroph biomass reached at steady-state. The parameter of light adaptation (α) and the maximum photosynthesis rate (kmax), i.e., the two parameters directly involved in the photosynthesis (Equation 20), are the only parameters related to phototrophy that have a visible impact on the model response. However, their impact is minor as the SIs are, respectively, 0.33 and 0.19.
Discussion
Many field, experimental and modeling studies have highlighted the potential, if not real significance, of planktonic mixotrophy in aquatic systems (e.g., Bird and Kalff, 1986; Estep et al., 1986; Bockstahler and Coats, 1993; Hall et al., 1993; Nygaard and Tobiesen, 1993; Arenovski et al., 1995; Havskum and Riemann, 1996; Stoecker et al., 1997; Stickney et al., 2000; Carvalho and Granéli, 2010; Hartmann et al., 2012; Mitra et al., 2014). In addition, experimental studies have shown that there is a large diversity among mixotrophs, in terms of (i) planktonic groups in which mixotrophic species have been observed, (ii) prey ingested, (iii) obligation to feed on a specific prey (specialist or generalist mixotroph), (iv) obligation to use the two trophic modes (obligate or facultative mixotrophy), (v) proportion of phototrophy and heterotrophy involved in growth, and (vi) factors inducing the use of the additional trophic mode (carbon limitation or nutrient limitation). However, despite the large diversity, a major distinction can be made among mixotrophs according to the origin of their chloroplasts: either constitutive or acquired from ingested phototrophic prey (Mitra et al., 2016). All mixotrophic protists can, therefore, be divided between being CMs or NCMs. The aim of this work is thus to offer a model able to represent the two contrasting forms of mixotrophy and that can be easily implemented in biogeochemical/ecological models. Specifically, the offering here facilitates the implementation of these groups into the AQUAPHY model that deploys the Shuter (1979) concept. The aim was not to develop descriptions for specific organisms, but rather to provide flexible constructs in which key parameters could be safely varied (as demonstrated by sensitivity analyses, Figure 4) to enable applications as appropriate for different ecosystem scenarios.
We adopted a model structure in which the organism biomass is divided into different components (on the basis of their function in the cell, i.e., structure, synthesis, or reserve) that interact and explain the main features related to microalgae metabolism (as in Shuter, 1979). This kind of model structure offers the advantage to be particularly appropriate to represent the main interactions that occur between phototrophic and heterotrophic activities in a mixotroph. Mitra and Flynn (2010) have indeed shown that descriptions integrating physiological processes, with some degree of feedback to modulate the processes of phototrophy and heterotrophy, are needed to properly represent the qualitative behavior of mixotrophs. Among existing mixotrophic models, only those of Stickney et al. (2000) and the “perfect beast” of Flynn and Mitra (2009) take the interactions between the two trophic modes into account; the others rely on additive descriptions of phototrophy and heterotrophy (Thingstad et al., 1996; Baretta-Bekker et al., 1998; Jost et al., 2004; Hammer and Pitchford, 2005; Crane and Grover, 2010; Ward et al., 2011; Våge et al., 2013).
In this work we presented descriptions of the two mixotroph forms: the CMs and NCMs. The two versions, describing fundamentally different mixotroph functional types, differ in the models by the processes linking the different components (i.e., the state variables) though they do share a common structure, with similar components in most respects. In the tested conditions, the model of constitutive mixotrophy was able to reproduce the expected observed behaviors of CMs: under light limitation or nutrient limitation (here, DIN), the CM has a growth rate substantially higher than its equivalent strictly autotroph (Figures 2, 3). This is consistent with field and experimental observations showing that mixotrophs are generally dominants under these conditions (Nygaard and Tobiesen, 1993; McKie-Krisberg et al., 2015). Regarding the model of non-constitutive mixotrophy, it properly captures the competitive advantage of NCMs over the strict heterotrophs under light conditions, when prey are limiting (Figure 5), in accordance with the observations (Skovgaard, 1998).
In this work, we configured the CM as a nanoflagellate able to feed on bacteria while the NCM was illustrated by a microzooplankton (ciliate) that feeds on autotrophic nanoflagellates. However, parameters values can easily be adapted to describe other planktonic group or other prey. To consider another prey, the only parameter that has to be changed in the CM model is the prey C:N:P ratio (if assumed fixed). In the NCM model, all parameters values related to phototrophy have to be changed in order to be the same as those of the prey. The type of prey will have an impact on the amount of inorganic nutrients that is retained inside the cell or excreted outside the cell (for the CM and the NCM), and also impacts on the phototrophic capacity for the NCM. We did not consider the fact that some specialists NCMs (i.e., acquiring photosynthetic capabilities from a specific prey) are capable of replicating their acquired photosystems (Hansen et al., 2013). It has been reported, for instance, that Mesodinium rubrum had the potential to synthesize and replicate new chloroplasts at least 3–5 times when starved of prey (Hansen et al., 2013). To take this specificity into account, the constant degradation rate of ingested prey (kdig) can be lowered to maintain the kleptochloroplasts for a longer period.
By imposing a minimum level of phototrophy to mixotrophic growth, we assumed that the CM is an obligate phototroph, but a facultative mixotroph. The fact that our CM cannot maintain a positive growth rate when both light and DIN are limiting, despite the high prey concentration, stems directly from the assigned 10% minimum level of phototrophic growth in the mixotrophic growth. However, to describe an obligate mixotroph, the only thing to do is imposing a minimum level of heterotrophy in the mixotrophic growth, in addition to the minimum level of phototrophy. A similar approach was enacted by Flynn and Mitra (2009). In the NCM configuration, we also assumed that mixotrophy is facultative but we assumed that phototrophy is facultative too (in contrast to the CM configuration). The NCM configuration could, however, be modified to match that of the CM in respect of the minimum level phototrophic growth required in the mixotrophic growth.
To take account that the proportion of phototrophy and heterotrophy involved in mixotrophic growth is not the same for all mixotrophs, we distinguished two model configurations for the model of constitutive mixotrophy: one that describes CMs using phototrophy as a priority (e.g., C. ovata; Tranvik et al., 1989) and another that describes CMs using heterotrophy as a priority (e.g., P. malhamensis; Sanders, 1991). The appropriate configuration can therefore be selected as appropriate for the application. When comparing the two CM model configurations (i.e., “Reggraz” vs. “Regphot”) results show that they behave similarly under high photon flux density. The different behaviors under low photon flux density are more explained by a combination of the model configuration and the hypothesis of a minimum level of phototrophy, than by the configuration controlling the dominance of heterotrophy vs. phototrophy itself.
When constructing the model of constitutive mixotrophy, we assumed that both carbon and nutrient limitations could induce phagotrophy. If only one of these factors was to be considered, the formulation of (Table 3, Equations 18–19) can be changed to take only account of the factor inducing phagotrophy. For instance, if only nutrient limitation is assumed to induce phagotrophy, the formulation of would be restricted to Equation (19).
In conclusion, the model structure presented in this work is able to take account of the main features and interactions between phototrophy and phago-heterotrophy in mixotrophs, and has enough flexibility to represent the observed diversity among mixotrophs. The mechanistic model of mixotrophy developed by Flynn and Mitra (2009)—the “perfect beast”—has these two characteristics as well. The main difference between the two models lies in the model structure; the “perfect beast” of Flynn and Mitra (2009) is based on cell quotas and results from the merging between C:N:P zooplankton and photoacclimative models, while the models presented here are based on the Shuter approach of a division of the biomass between components chosen on the basis of their function in the cell. The type of biogeochemical/ecological model in which mixotrophy will be implemented could guide the choice between either of these model structures; the models presented in this work are particularly adapted to be implemented in those biogeochemical models that use the “Shuter” mechanistic approach to describe the phytoplankton compartment but that do not take mixotrophy into account yet.
Author Contributions
All five authors contributed to the model conception and test design. CG conducted the model analyses and prepared the manuscript while AM, CL, KF, and NG revised it.
Funding
CG was supported by a Ph.D. scholarship funded through the Fonds de la Recherche Scientifique (F.R.S.-FNRS, Belgium). This work was partly enabled by support for an International Network grant from the Leverhulme Trust (UK) to KF and AM.
Conflict of Interest Statement
The authors declare that the research was conducted in the absence of any commercial or financial relationships that could be construed as a potential conflict of interest.
References
Arenovski, A. L., Lim, E. L., and Caron, D. A. (1995). Mixotrophic nanoplankton in oligotrophic surface waters of the Sargasso Sea may employ phagotrophy to obtain major nutrients. J. Plankton Res. 17, 801–820. doi: 10.1093/plankt/17.4.801
Baretta-Bekker, J. G., Baretta, J. W., Hansen, A. S., and Riemann, B. (1998). An improved model of carbon and nutrient dynamics in the microbial food web in marine enclosures. Aquat. Microb. Ecol. 14, 91–108. doi: 10.3354/ame014091
Bernard, C., and Rassoulzadegan, F. (1994). Seasonal variations of mixotrophic ciliates in the northwest mediterranean sea. Mar. Ecol. Prog. Ser. 108, 295–301. doi: 10.3354/meps108295
Billen, G., Garnier, J., and Hanset, P. (1994). Modelling phytoplankton development in whole drainage networks: the RIVERSTRAHLER model applied to the Seine river system. Hydrobiologia 289, 119–137. doi: 10.1007/BF00007414
Bird, D. F., and Kalff, J. (1986). Bacterial grazing by planktonic lake algae. Science 231, 493–495. doi: 10.1126/science.231.4737.493
Bockstahler, K. R., and Coats, D. W. (1993). Grazing of the mixotrophic dinoflagellate Gymnodinium sanguineum on ciliate populations of Chesapeake Bay. Mar. Biol. 116, 477–487. doi: 10.1007/BF00350065
Brutemark, A., and Granéli, E. (2011). Role of mixotrophy and light for growth and survival of the toxic haptophyte Prymnesium parvum. Harm. Algae 10, 388–394. doi: 10.1016/j.hal.2011.01.005
Burkholder, J. M., Glibert, P. M., and Skelton, H. M. (2008). Mixotrophy, a major mode of nutrition for harmful algal species in eutrophic waters. Harm. Algae 8, 77–93. doi: 10.1016/j.hal.2008.08.010
Caron, D. A., Sanders, R. W., Lim, E. L., Marrasé, C., Amaral, L. A., Whitney, S., et al. (1993). Light-dependent phagotrophy in the freshwater mixotrophic chrysophyte Dinobryon cylindricum. Microb. Ecol. 25, 93–111. doi: 10.1007/BF00182132
Carvalho, W. F., and Granéli, E. (2010). Contribution of phagotrophy versus autotrophy to Prymnesium parvum growth under nitrogen and phosphorus sufficiency and deficiency. Harm. Algae 9, 105–115. doi: 10.1016/j.hal.2009.08.007
Crane, K. W., and Grover, J. P. (2010). Coexistence of mixotrophs, autotrophs, and heterotrophs in planktonic microbial communities. J. Theor. Biol. 262, 517–527. doi: 10.1016/j.jtbi.2009.10.027
Dolan, J. R., and Pérez, M. T. (2000). Costs, benefits and characteristics of mixotrophy in marine oligotrichs. Freshwater Biol. 45, 227–238. doi: 10.1046/j.1365-2427.2000.00659.x
Estep, K. W., Davis, P. G., Keller, M. D., Sieburth, J., and Mc, N. (1986). How important are oceanic algal nanoflagellates in bacterivory? Limnol. Oceanogr. 31, 646–650. doi: 10.4319/lo.1986.31.3.0646
Flynn, K. J., and Hansen, P. J. (2013). Cutting the canopy to defeat the “selfish gene”; conflicting selection pressures for the integration of phototrophy in mixotrophic protists. Protist 164, 811–823. doi: 10.1016/j.protis.2013.09.002
Flynn, K. J., and Mitra, A. (2009). Building the “perfect beast”: modelling mixotrophic plankton. J. Plankton Res. 31, 965–992. doi: 10.1093/plankt/fbp044
Flynn, K. J., Stoecker, D. K., Mitra, A., Raven, J. A., Glibert, P. M., Hansen, P. J., et al. (2013). Misuse of the phytoplankton – zooplankton dichotomy: the need to assign organisms as mixotrophs within plankton functional types. J. Plankton Res. 35, 3–11. doi: 10.1093/plankt/fbs062
Geider, R., and Laroche, J. (2002). Redfield revisited: variability of C:N:P in marine microalgae and its biochemical basis. Eur. J. Phycol. 37, 1–17. doi: 10.1017/s0967026201003456
Ghyoot, C., Gypens, N., Flynn, K. J., and Lancelot, C. (2015). Modelling alkaline phosphatase activity in microalgae under orthophosphate limitation: the case of Phaeocystis globosa. J. Plankton Res. 37, 869–885. doi: 10.1093/plankt/fbv062
Haefner, J. W. (1996). Modelling Biological Systems: Principles and Applications. New York, NY: Chapman & Hall. doi: 10.1007/978-1-4615-4119-6
Hall, J. A., Barrett, D. P., and James, M. R. (1993). The importance of phytoflagellate, heterotrophic flagellate and ciliate grazing on bacteria and picophytoplankton sized prey in a coastal marine environment. J. Plankton Res. 15, 1075–1086. doi: 10.1093/plankt/15.9.1075
Hammer, A. C., and Pitchford, J. W. (2005). The role of mixotrophy in plankton bloom dynamics, and the consequences for productivity. ICES J. Mar. Sci. 62, 833–840. doi: 10.1016/j.icesjms.2005.03.001
Hansen, P. J., Nielsen, L. T., Johnson, M., Berge, T., and Flynn, K. J. (2013). Acquired phototrophy in Mesodinium and Dinophysis – a review of cellular organization, prey selectivity, nutrient uptake and bioenergetics. Harm. Algae 28, 126–139. doi: 10.1016/j.hal.2013.06.004
Hartmann, M., Grob, C., Tarran, G. A., Martin, A. P., Burkill, P. H., Scanlan, D. J., et al. (2012). Mixotrophic basis of Atlantic oligotrophic ecosystems. Proc. Natl. Acad. Sci. U.S.A. 109, 5756–5760. doi: 10.1073/pnas.1118179109
Havskum, H., and Riemann, B. (1996). Ecological importance of bacterivorous, pigmented flagellates (mixotrophs) in the Bay of Aarhus, Denmark. Mar. Ecol. Prog. Ser. 137, 251–263. doi: 10.3354/meps137251
Hood, R. R., Zhang, X., Glibert, P. M., Roman, M. R., and Stoecker, D. K. (2006). Modeling the influence of nutrients, turbulence and grazing on Pfiesteria population dynamics. Harm. Algae 5, 459–479. doi: 10.1016/j.hal.2006.04.014
Jeong, H. J., Yoo, Y. D., Kim, J. S., Seong, K. A., Kang, N. S., and Kim, T. H. (2010). Growth, feeding and ecological roles of the mixotrophic and heterotrophic dinoflagellates in marine planktonic food webs. Ocean Sci. J. 45, 65–91. doi: 10.1007/s12601-010-0007-2
Jones, H., Cockell, C. S., Goodson, C., Price, N., Simpson, A., and Thomas, B. (2009). Experiments on mixotrophic protists and catastrophic darkness. Astrobiology 9, 563–571. doi: 10.1089/ast.2008.0283
Jones, H., Durjun, P., Leadbeater, B. S. C., and Green, J. C. (1995). The relationship between photoacclimation and phagotrophy with respect to chlorophyll a, carbon and nitrogen content, and cell size of Chrysochromulina brevifilum (Prymnesiophyceae). Phycologia 34, 128–134. doi: 10.2216/i0031-8884-34-2-128.1
Jost, C., Lawrence, C. A., Campolongo, F., van de Bund, W., Hill, S., and DeAngelis, D. L. (2004). The effects of mixotrophy on the stability and dynamics of a simple planktonic food web model. Theor. Popul. Biol. 66, 37–51. doi: 10.1016/j.tpb.2004.02.001
Kimura, B., and Ishida, Y. (1989). Phospholipid as a growth factor of Uroglena americana, a red tide Chrysophyceae in lake Biwa. Nippon Suisan Gakkaishi 55, 799–804. doi: 10.2331/suisan.55.799
Lancelot, C., Hannon, E., Becquevort, S., Veth, C., and De Baar, H. J. W. (2000). Modeling phytoplankton blooms and carbon export production in the Southern Ocean: dominant controls by light and iron in the Atlantic sector in Austral spring 1992. Deep-Sea Res. 47(Pt I), 1621–1662. doi: 10.1016/S0967-0637(00)00005-4
Lancelot, C., Spitz, Y., Gypens, N., Ruddick, K., Becquevort, S., Rousseau, V., et al. (2005). Modelling diatom and Phaeocystis blooms and nutrient cycles in the Southern bight of the North Sea: the MIRO model. Mar. Ecol. Prog. Ser. 289, 63–78. doi: 10.3354/meps289063
Lancelot, C., Veth, C., and Mathot, S. (1991). Modelling ice-edge phytoplankton bloom in the Scotia-Weddell sea sector of the Southern Ocean during spring 1988. J. Mar. Syst. 2, 333–346. doi: 10.1016/0924-7963(91)90040-2
McKie-Krisberg, Z. M., Gast, R. J., and Sanders, R. W. (2015). Physiological responses of three species of Antarctic mixotrophic phytoflagellates to changes in light and dissolved nutrients. Microb. Ecol. 70, 21–29. doi: 10.1007/s00248-014-0543-x
Mitra, A., and Flynn, K. J. (2010). Modelling mixotrophy in harmful algal blooms: more or less the sum of the parts? J. Mar. Syst. 83, 158–169. doi: 10.1016/j.jmarsys.2010.04.006
Mitra, A., Flynn, K. J., Burkholder, J. M., Berge, T., Calbet, A., Raven, J. A., et al. (2014). The role of mixotrophic protists in the biological carbon pump. Biogeosciences 11, 1–11. doi: 10.5194/bg-11-995-2014
Mitra, A., Flynn, K. J., Tillmann, U., Raven, J. A., Caron, D., Stoecker, D. K., et al. (2016). Defining planktonic protist functional groups on mechanisms for energy and nutrient acquisition: incorporation of diverse mixotrophic strategies. Protists 167, 106–120. doi: 10.1016/j.protis.2016.01.003
Nygaard, K., and Tobiesen, A. (1993). Bacterivory in algae: a survival strategy during nutrient limitation. Limnol. Oceanogr. 38, 273–279. doi: 10.4319/lo.1993.38.2.0273
Park, M. G., Kim, M., and Kim, S. (2015). Phased cell division and facultative mixotrophy of the marine dinoflagellate Fragilidium duplocampanaeforme and its trophic interactions with the dinoflagellates Dinophysis spp. and a ciliate Mesodinium rubrum. Harm. Algae 43, 20–30. doi: 10.1016/j.hal.2015.02.001
Roberts, E. C., and Laybourn-Parry, J. (1999). Mixotrophic cryptophytes and their predators in the dry valley lakes of Antarctica. Freshwater Biol. 41, 737–746. doi: 10.1046/j.1365-2427.1999.00401.x
Sanders, R. W. (1991). Mixotrophic protists in marine and freshwater ecosystems. J. Protozool. 38, 76–81. doi: 10.1111/j.1550-7408.1991.tb04805.x
Sanders, R. W., and Gast, R. J. (2012). Bacterivory by phototrophic picoplankton and nanoplankton in Arctic waters. FEMS Microbiol. Ecol. 82, 242–253. doi: 10.1111/j.1574-6941.2011.01253.x
Sanders, R. W., and Porter, K. G. (1988). “Phagotrophic phytoflagellates,” in Advances in Microbial Ecology, Vol. 10, ed K. C. Marshall (Boston, MA: Springer), 167–192.
Shuter, B. (1979). A model of physiological adaptation in unicellular algae. J. Theor. Biol. 78, 519–552.
Skovgaard, A. (1998). Role of chloroplast retention in a marine dinoflagellate. Aquat. Microb. Ecol. 15, 293–301.
Stickney, H. L., Hood, R. R., and Stoecker, D. K. (2000). The impact of mixotrophy on planktonic marine ecosystems. Ecol. Model. 125, 203–230. doi: 10.1016/S0304-3800(99)00181-7
Stoecker, D. K. (1998). Conceptual models of mixotrophy in planktonic protists and some ecological and evolutionary implications. Eur. J. Protistol. 34, 281–290.
Stoecker, D. K., Johnson, M. D., de Vargas, C., and Not, F. (2009). Acquired phototrophy in aquatic protists. Aquat. Microb. Ecol. 57, 279–310. doi: 10.1016/S0304-3800(99)00181-7
Stoecker, D. K., Li, A., Coats, D. W., Gustafson, D. E., and Nannen, M. K. (1997). Mixotrophy in the dinoflagellate Prorocentrum minimum. Mar. Ecol. Prog. Ser. 152, 1–12.
Stoecker, D. K., Michaels, A. E., and Davis, L. H. (1987). Large proportion of marine planktonic ciliates found to contain functional chloroplasts. Nature 326, 790–792. doi: 10.1038/326790a0
Stoecker, D. K., Silver, M. W., Michaels, A. E., and Davis, L. H. (1988). Obligate mixotrophy in Laboea strobila, a ciliate which retains chloroplasts. Mar. Biol. 99, 415–423.
Stoecker, D., Tillmann, U., and Granéli, E. (2006). “Phagotrophy in harmful algae,” in Ecology of Harmful Algae, Vol. 189, eds G. Granéli and J. T. Turner (Berlin; Heidelberg: Springer), 177–187.
Thingstad, T. F., Havskum, H., Garde, K., and Riemann, B. (1996). On the strategy of “eating your competitor”: a mathematical analysis of algal mixotrophy. Ecology 77, 2108–2118.
Tranvik, L. J., Porter, K. G., Sieburth, J., and Mc, N. (1989). Occurrence of bacterivory in Cryptomonas, a common freshwater phytoplankter. Oecologia 78, 473–476.
Våge, S., Castellani, M., Giske, J., and Thingstad, T. F. (2013). Successful strategies in size structured mixotrophic food webs. Aquat. Ecol. 47, 329–347. doi: 10.1007/s10452-013-9447-y
Ward, B. A., Dutkiewicz, S., Barton, A. D., and Follows, M. J. (2011). Biophysical aspects of resource acquisition and competition in algal mixotrophs. Am. Nat. 178, 98–112. doi: 10.1086/660284
Keywords: constitutive mixotroph (CM), non-constitutive mixotroph (NCM), modeling, phytoplankton, zooplankton
Citation: Ghyoot C, Flynn KJ, Mitra A, Lancelot C and Gypens N (2017) Modeling Plankton Mixotrophy: A Mechanistic Model Consistent with the Shuter-Type Biochemical Approach. Front. Ecol. Evol. 5:78. doi: 10.3389/fevo.2017.00078
Received: 21 June 2016; Accepted: 30 June 2017;
Published: 18 July 2017.
Edited by:
Michael Arthur St. John, Institute for Aquatic Resources, Danish Technical University, DenmarkReviewed by:
Peter Allan Thompson, Commonwealth Scientific Industrial Research Organisation, AustraliaAlberto Basset, University of Salento, Italy
Copyright © 2017 Ghyoot, Flynn, Mitra, Lancelot and Gypens. This is an open-access article distributed under the terms of the Creative Commons Attribution License (CC BY). The use, distribution or reproduction in other forums is permitted, provided the original author(s) or licensor are credited and that the original publication in this journal is cited, in accordance with accepted academic practice. No use, distribution or reproduction is permitted which does not comply with these terms.
*Correspondence: Caroline Ghyoot, cghyoot@ulb.ac.be