Large Extent Volunteer Roadkill and Wildlife Observation Systems as Sources of Reliable Data
 David P. Waetjen
  Fraser M. Shilling*
- Road Ecology Center, Department of Environmental Science and Policy, University of California, Davis, Davis, CA, United States
Large-extent wildlife-reporting systems have sets of goals and methods to facilitate standardized data collection, statistical analysis, informative visualizations, and use in decision-making within the system area. Many systems employ “crowds” of volunteers to collect these data at large spatial extents (e.g., US state or small country scale), especially along roadways. This raises the important question of how these systems could be standardized and the data made broadly useful in ecological and transportation studies, i.e., beyond the system area or goals. We describe two of the first and longest-running systems for volunteer observation of road-associated wildlife (live and dead) at the US state scale. The California Roadkill Observation System (CROS, http://wildlifecrossing.net/california) uses a form-based data entry system to report carcasses resulting from wildlife-vehicle collisions (WVC). Operating since 2009, it currently (June, 2017) contains 1,338 users and >54,000 observations of 424 species of ground-dwelling vertebrates and birds, making it one of the most successful examples of crowd-sourced, roadkill and wildlife reporting. Its sister system, the Maine Audubon Wildlife Road Watch (http://wildlifecrossing.net/maine) has a similar structure, and can accept data from transect surveys, animal tracks and scat observations, and reports of “no animal observed.” Both systems can operate as web-applications on a smart-phone (using a web browser), providing the ability to enter observations in the field. Locational accuracy for California observations was estimated to be ±14 m (n = 552 records). Species identification accuracy rate for observations with photographs was 97% (n = 3,700 records). We propose that large extent, volunteer systems can be used to monitor wildlife occurrences along or away from roads and that these observations can be used to inform ecological studies and transportation mitigation planning.
Introduction
Monitoring biodiversity and investigating causes of changes in biodiversity allows society to make decisions about conservation (Wilson, 1999; Devictor et al., 2010; Bang and Faeth, 2011; Corona et al., 2011) and improve management of human-wildlife conflict. Involving society directly in scientific investigation can transform science from an exclusive process, remote from peoples' day-to-day experience, to one that includes millions of new environmental data collectors (Goodchild, 2007) and is participatory and has immediate relevance and value (Ceccaroni et al., 2016). Projects involving citizen/volunteer scientists have grown considerably in recent years (Silvertown, 2009; Conrad and Hilchey, 2010; Roy et al., 2012), providing data collection at large geographic scales (Devictor et al., 2010), that are often of high-quality (e.g., Ratnieks et al., 2016), have been found to be useful for species-distribution modeling (e.g., Mair et al., 2016), and help connect people to nature and conservation problems (Cooper et al., 2007; Devictor et al., 2010). Sub-national and national governments including transportation organizations (e.g., Harris et al., 2016), increasingly are recognizing the importance of volunteer-collected information (e.g., Bowser and Shanley, 2013 and the Federal Crowdsourcing and Citizen Science Toolkit, https://crowdsourcing-toolkit.sites.usa.gov/).
Volunteer scientists play an important role in understanding the changing distributions of biodiversity (Mair et al., 2016). Their role as sensors can multiply the geographic extent of observations many-fold compared to academic or governmental scientific investigations, while providing data of comparable quality (Ryder et al., 2010; Haklay, 2013). While operating across large geographies (US states), volunteers can maintain observations across broad taxonomies and large spatial extents. In addition, they form both an immediate constituency for science and conservation as well as a face on science that other members of the public may relate to more easily (see Ceccaroni et al., 2016). However, although this position in conservation may be typical (Ceccaroni et al., 2016), the authors are not aware of a demonstration of the effectiveness of volunteer science in changing how natural systems are managed. In particular, transportation organizations have not embraced volunteer-collected data, possibly because of a lack of published evidence of their potential quality.
Informatics is a discipline that provides tools useful to collect, manage, and use diverse types of data to support research and management. The field of web-based environmental informatics has recently evolved in order to assist with large scale environmental analyses, data management, data contributions from disparate sources, and decision-support (Reichman et al., 2011). Volunteer science oriented informatics is an emerging area of practice that could support ecological research, provided broadly-accepted rules are used for developing and sharing controlled vocabularies, data storage models, and metadata. At the same time, emerging social-network, and data-mining methods are greatly increasing our abilities to classify data, estimate trustworthiness, statistically model geographic distribution from point observations, and to provide data directly to rapid response and long-range policy-making. When combined with successful recruitment of volunteer scientists, informatics is critical in providing a transparent, extensive, scalable, and accurate observation system to capture earth processes.
According to Silvertown (2009), there are three factors that have caused the explosion of projects which involve participation of volunteer scientists. The first is the availability of technical tools, including the web, and mobile devices. The second factor is the free labor and the ability to partner with conservation groups. The third factor has to do with public accountability and how these studies provide an opportunity for tax-payers to participate in activities for which their taxes are being used. It is an investment of time toward the advancement of human knowledge and promotes public education of the project's subject matter. As volunteer science projects grow in scope and participation, the need for innovative tools will become greater (Bonney et al., 2009); for example, “eBird” (http://ebird.org) provides multiple tools, including online observation reporting, for volunteer ornithologists (Sullivan et al., 2009). An important aspect of some of these systems is that a social network (connected group of people) may be intentionally or accidentally formed, which may reinforce the collection, and use of the environmental data. Despite the advances these systems have made, there are no broadly-accepted standards and rules for large-extent observation systems focused on terrestrial vertebrates. One purpose of this study was to create and test a rule-based system at large spatial extents.
As with any new technical field, there are challenges associated with building environmental informatics systems to support volunteer-based wildlife observations. A principal informatics challenge is that, although there are many, varied, online systems for volunteer scientists, there is no commonly-used set of rules for data collection, data management, and data visualization. New online systems for recording volunteer observations seem to be built upon a novel set of guidelines, making integration of data from the systems challenging. Although taxonomically-broad systems exist that provide the general public with a place to report nature observations, the rate of reporting is often low for local geographic areas or project and the institutional sponsors may not transform the observations to better societal understanding of the subject matter. This is in contrast to systems built around long-standing social networks of taxonomically-focused naturalists (e.g., http://ebird.org) or for narrow geographic ranges (e.g., http://i90wildlifewatch.org).
Since the projects described here started in 2009 and 2010, there have been several large systems created around the globe to report wildlife on or near roadways (Shilling et al., 2015; see http://globalroadkill.net for examples). In the US, there is only one other state besides CA and ME that accepts volunteer observations of roadkill (Idaho Fish Wildlife Information System, https://idfg.idaho.gov/species/roadkill). This system contains 35,290 reports of 111 species from 658 observers (data accessed February 14, 2017), including the state Departments of Transportation and Fish & Game, for the whole state (216,632 km2). Around the world, the largest systems are: the Natuurpunt program “Animals under Wheels” (http://waarnemingen.be), which contains 81,974 records (as of February 15, 2017) for Belgium (30,500 km2) and the Taiwan Roadkill Observation Network (https://roadkill.tw), which contains 37,415 records from 2,777 contributors (as of February 27, 2017) for Taiwan (35,980 km). In many cases, volunteer-collected observations are used to inform mitigation planning on roadways. For example, the Czech Republic's “Animal-Vehicle Collisions” system (http://srazenazver.cz/en/) uses volunteer observations in automated estimations of statistically-significant clusters of carcasses.
We describe an informatics approach that has successfully included observers across two US states in an observational network for live and dead wildlife occurrences on roadways. We focused on wildlife observed on or near roads because for many people they are most likely to observe wildlife while traveling. In addition, the death of animals on roadways is a direct environmental impact that people experience more intimately and thus they may be more motivated to collect observations about animals that have been killed or that may be killed on roads. Finally, roads and traffic provide a near-constant supply of wildlife “samples” which, although spatially-biased at a local scale, provide data about current and changing wildlife occupancy, and movement in landscapes. The system followed a reproducible approach that allowed verification of observation accuracy and easy access to the data collected for analysis using other available tools. The primary goal of this study was to find out whether or not large extent (i.e., US state scale) systems for collecting volunteer observations of road-associated wildlife are viable and can provide reliable data. The purpose of the data collection was to inform both specific improvements to the transportation system to reduce impacts on wildlife and to provide data for further studies of individual species and communities of wildlife over time across a large area. We propose that systems like these could be used to augment the efforts of state and national wildlife agencies, and in the case of transportation agencies, form the basis of mitigation actions.
Materials and Methods
Study Area
Two states were chosen for their geographic separation and available social infrastructure to support enrollment of participants. The California Roadkill Observation System (CROS, http://www.wildlifecrossing.net/california) was launched in August 2009 for volunteer recording of carcass observations on California roads and highways. California has a population of more than 37 million people and >499,000 km of unpaved and paved roadways networked across 411,000 km2 of varied land cover types, including urban, agriculture, forests, grasslands, and desert. Of these roadways, 225,910 km are major urban and rural roads, and 24,398 km are highways. A similar system was developed in early 2010 for Maine, the Maine Audubon Wildlife Road Watch (MAWRW, http://www.wildlifecrossing.net/maine), to allow collection of both live and dead animal observations on and adjacent to Maine's roads and highways. The system also accepts observations of tracks and spoor, as well as “no animal” observations when monitoring a transect (whether no observations were seen on that day). Maine has a population of 1,328,000 people and >60,600 km of roads, including 10,900 km of highways, across its 84,000 km2 of forests, wetlands, agricultural areas and townships. Currently (June, 2017), both systems are being actively used.
Volunteer and Institutional Observers
The foundation for the observation network is the individual observer, who contributes records to the system. Two models for participant enrollment were used: (1) email communication with a large cadre of potentially-interested observers using list-serves (California) and (2) personal communication with agency partners, members of conservation organizations, and communication with the general public via newsletters (Maine). In both states, we used existing partnerships with wildlife and transportation agencies to advise us on development of the systems. Observers may also have become aware of the sites through regional and national press coverage beginning in September, 2010 and continuing through 2016. New and continuing participation was encouraged by communicating directly, via email, and indirectly, via posting relevant research, news, and project updates on the project websites, syndicated through Rich Site Summary (RSS) feeds of information as it is updated.
Observers voluntarily enrolled in the system through registration, establishing a relationship between the user, and the various roles and privileges they can hold (Figure 1). The possible roles within the observation system were anonymous user, authenticated/registered user, content manager, data manager, and transect observer. Patterns of observer participation (e.g., date of joining, organizational affiliation) were tracked using the information provided at enrollment and subsequent activity on the websites. Professional affiliation was assessed for all observers based upon self-reporting. We calculated active participation rates of volunteers based on the time the user enrolled in the system to their last observation entry. This is one of several ways to calculate the length of time the system is used by a user.
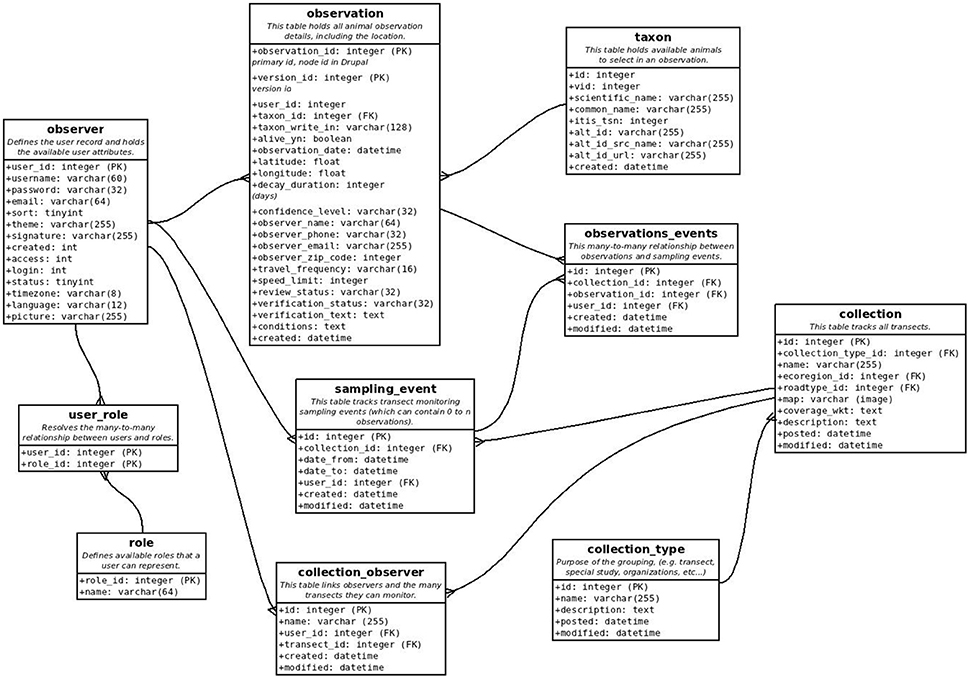
Figure 1. Data model showing relationships among elements in the databases. Lines represent one-to-many relationships. Terms within each box describe the rules and information requirements for each element. Roles and permissions for observers are defined by the site administrators (authors) and are mutable. Controlled vocabularies and standardized ontologies for species are used for all records.
Because institutions increasingly use our system to manage their wildlife observation and carcass data (e.g., National Park Service), we created special interaction modes for them. For example, we automated data exports to institutional users that corresponded to geographic areas or animal species. We also fulfilled ad-hoc data requests on an approximately monthly basis to transportation, land management, consultant and academic staff, and scientists. These activities generated a feedback loop where more interest was generated as more information was shared.
Informatics
A physical instance of the informatics model was constructed using Drupal (an open source PHP-based web framework), with a MySQL/MariaDB back-end relational database. The web-system was designed to be usable on a wide variety of devices, including smartphones, and tablets (through a browser). The informatics model's primary elements, or concepts, were implemented as “content types.” These user-defined objects hold the data associated with the model's concepts, such as observer, observation, and animal taxon, and have various relationships to each other (Figure 1). Each object was designed to be generic so that it could be used in other geographic areas, or for other environmental informatics purposes. The informatics model was abstracted to a set of attributes which become the basis for data sharing and conducive for analysis.
The observation record included several key fields that “identify” the record, and provide enough metadata to support export to other standard-based frameworks, including Dublin Core and (a subset of) Darwin Core (Wieczorek et al., 2012). Being able to identify a data record and show its (potential) provenance is important detail when using data for scientific analysis, and CROS has been able to preserve any record modifications since the site's inception. This includes capturing the attributes of “who,” “what,” “where,” “when,” and “how” for an observation and ensuring these attributes are available when these data are shared (Kelling et al., 2009). These additional fields help provide the context the observation was made, including fields directly related to biology and transportation (Figure 1). The preset lists which populate dropdown boxes are called controlled vocabularies. Controlled vocabularies used in our model include: species (scientific and common names), species category, road type, habitat type, quality assurance descriptors (e.g., observer confidence), and other customizable attributes. The species records were linked to ITIS (http://www.itis.gov) through a taxonomic serial number (TSN). Depending on the needs of the users, record fields could be required or optional.
All wildlife observations have a spatial context. Geo-location is designated by both latitude-longitude and free-text descriptors for associated roadways and other spatial features, including proximity to structures, or post miles (measured markers along roadways). Data entry for location was usually made through an interactive map interface on the website, or by directly entering the latitude and longitude. For some smartphone users, coordinates were indirectly entered using the GPS capabilities of the phones themselves and the coordinates associated with images. The mapping module used the Google API to control the map features such as the zoom bar, the scale bar, the default Google base layers (street, terrain, and satellite view), and the representation of points on the map. The current version of the database does not record estimates of spatial accuracy and precision, though in some cases they can be estimated indirectly.
In the current data model, a single observation permitted only one animal species to be associated with each record. This is useful for later analyses where individual species may be of interest (e.g., mule deer). Surrounding habitat type is an example where multiple vocabulary terms could be used to describe a single observation—an observation could be simultaneously next to an agricultural field, a riparian corridor, and a roadway. The system also provided a facility where observations could be managed based on the species observed and conservation status, stipulated by the IUCN (International Union for Conservation of Nature). For example, observations of two endangered turtle species (ME: Blanding's turtle, Emydoidea blandingii, and box turtles, Terrapene spp.) and two vulnerable species (ME: spotted turtle, Clemmys guttata, and Wood turtle, Glyptemys insculpta) were automatically hidden from public view to protect turtle populations from illegal collecting.
Observation Accuracy
Observation confidence was described by a variable where the observer could self-report their confidence in the species identification for their own observation. There were three terms to choose from: 100% Certain, Somewhat Confident, and Best Guess. Since registered observers also entered information about their expertise, such as job title, organization, and experience, data users can compare the observer's expertise with the measure of confidence of an observation, and then make their own assessment of likely data quality. After the observation was entered, a data reviewer could modify the record, and assign reviewer-specific vocabulary terms, which included the options of reviewed, not reviewed, and rejected. Data reviewers included the authors and student interns, who were not responsible for species identification. Species-level accuracy was verified for records with photographs by comparing the photograph with standard pictures of individual species. Species identification was conducted by co-author Shilling and the former natural history curator of the Oakland Museum of California (Dr. Douglas Long), with consultation with other professional biologists as needed. A critical concern for datasets collected by volunteer scientists is about accuracy of the location of the observation or event. We estimated the locational accuracy of a subset of records by measuring the perpendicular distance between coordinates entered by the user during creation of the record (usually by placing a point on a map) and coordinates contained within the Exif data associated with images captured using smartphones with GPS enabled.
Results
Data Collection and Sharing
Observations were collected on all except two of California's 244 numbered highways and across the majority of the state (Figure 2A). For Maine, there was a greater concentration of observations in the southern half of the state (Figure 2B), reflecting population density. Between August, 2015 and June, 2017, we met 18 requests for observation data for the CA system from individuals, academia, consultants, and Caltrans. These ranged in type from all data for a specific state highway, to all data for a single group (e.g., herpetofauna) or species. For eight partner organizations focused on a single species, we created queries on the web-system, which when clicked resulted in an up-to-date, downloadable data object for the partner.
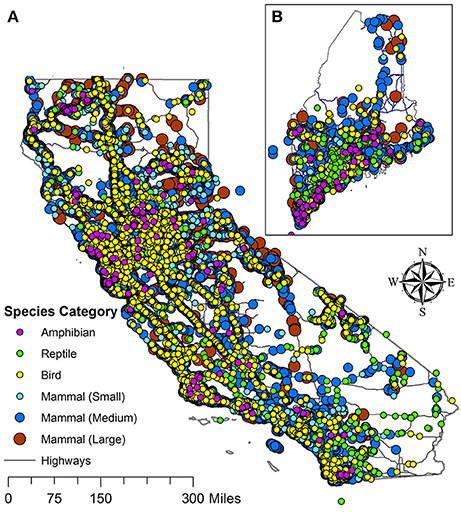
Figure 2. Distribution of all wildlife observations (circles) in California (A) and Maine (B).
Volunteer Scientists
Rates of participation and cumulative enrollment varied in response to periodic email contact from system administrators (the authors) and media attention for the project. Rates of new member enrollment in California (CA) were greatest immediately after the authors contacted individuals and organizations throughout the state in September, 2009 and following a New York Times article and National Public Radio stories about the observation systems in early September, 2010 (Figures 3A,B). Rates were similarly high after Maine Audubon contacted organizations in Maine (ME) in March, 2010 (data not shown). Following initiation of the system and a large media event, new enrollment rapidly and temporarily increased to ~150 (CA) and ~40 (ME) new members/month. The number of observations per year declined through the 7 year period (P < 0.05, t-test of slope significance). At the same time, both the number of observations/observer and the number of observations/observer-month significantly increased (P < 0.05, t-test of slope significance). Besides observed spikes in new CA members in September of 2 years, there was no effect of month of the year on rate of new member participation (Figure 3B), as was also the case in ME (data not shown). When media as a method of contact could not be deployed, rate of new enrollment in CA was 5–10 per month through February, 2017 (Figure 3A). Spikes in observations in Spring and Fall (Figure 3B) may correlate with increases in emergence of wildlife young and seasonal migrations at these times of year.
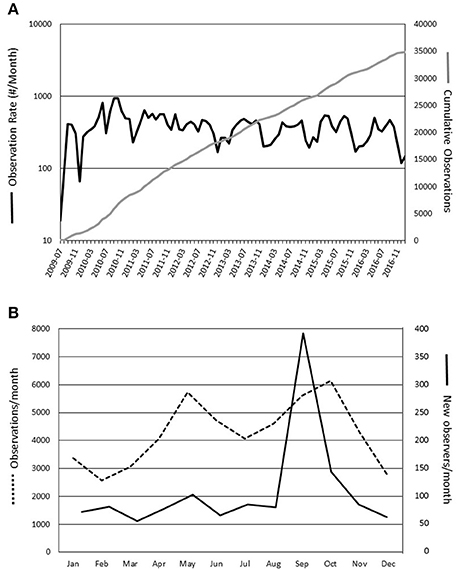
Figure 3. (A) Monthly participation rate (dark line) and cumulative participation (gray line) for the California system between 9/2009 (initiation) and 1/2017 (present). (B) Rates of observation per month (dashed line) and new observers per month (black line) for the California system (9/2009–1/2017). Only observations since the start date of each state-system are shown; there were records entered in each system by observers who had made observations of wildlife prior to the beginning of the system.
Between September, 2009 and June, 2017 (CA) and between March, 2010 and June, 2017 (ME), 1,338 and 622, respectively, observers enrolled in the state systems. The average active participation time (±95th % confidence interval) of observers was calculated as the time between registration and most recent contributed observation and was 446 (±62) out of a possible 1,798 (±74) days (CA) and 353 (±68) out of a possible 1,411 (±72) days (ME). Many of these observers were professional biologists (agency, consultant, or academic or natural historians). Thirty six percent of CA observers self-identified as professional scientists affiliated with agency, academic, and private organizations. The remainder was composed of professionals associated with conservation NGOs (9%), or schools, local government, and un-affiliated individuals (5%). Six percent of ME observers self-identified as affiliated with public or private scientific organizations, 23% were affiliated with natural history organizations (primarily Maine Audubon), and non-university schools, and the remainder provided no affiliation information. In CA, the top 248 contributing observers (excluding the CA Department of Transportation) have contributed >90% of the total observations to date, suggesting that an enthusiastic core group may have developed.
Observation Characteristics
By February, 2017, observers in California had contributed 39,576 observations of roadkilled animals, 2,198 of which were observations that had been recorded before the advent of the system. An additional 14,456 observations came from one organizational contributor—the CA Department of Transportation. Observers in Maine had contributed 4,162 observations of dead animals, 1,968 observations of live animals, 172 observations of “wildlife tracks and signs” and 288 “No animal” observations. The largest group of animals observed by volunteers in both states was medium-sized mammals (CA: 42%, ME: 37%), followed by small mammals (CA: 24%, ME: 30%), birds (CA: 16%, ME: 16%), then small but relatively equal numbers of large mammals (CA: 9%, ME: 5%), reptiles (CA: 6%, ME: 7%), and amphibians (CA: 3%, ME: 3%). In CA and ME, respectively most observations were associated with county paved roads (22, 36%) and state highways (55, 35%), with speed limits of 55 or 65 mph, and on roads where observers drive several times per week (48, 72%) or weekly (18, 12%). Observations were somewhat evenly distributed across seasons, with the highest rate of recording tending to be in the Fall and the lowest in the Winter, with this pattern being more pronounced in ME than in CA (Figure 3B). Observations were also unevenly distributed throughout the states, with gaps in certain regions and highways and highest concentrations of observations near urban areas (Figure 2).
Observation Accuracy
Observers characterized their confidence in their own animal identification accuracy using three ratings for high (100% Certain), medium (Somewhat Confident) and low (Best Guess) confidence. In CA, 99.5% of records included a self-assessment (by the observer) of confidence in their species identification. Of these, 84% of volunteer observations were assessed as high confidence, 12% as medium confidence, and 4% as low confidence. Similarly in ME, 78% of the observations were characterized as high confidence, 17% as medium confidence, and 6% as low confidence.
Approximately 13% (CA) and 3% (ME) of observation records contained photographs of the dead animal. Because of the low rate of photograph uploads in ME, accuracy was not assessed. Each photograph in CA was examined and compared to online natural history resources appropriate for each animal species. Animals in 11% (CA) of photographs were not identifiable by the authors, but species had been recorded by the observers. We found an additional 6% of records where species of animal had not been identified by the observer to actually be identifiable to the species level. A subset of photographs (n = 3,700) with identifiable animals was analyzed for species identification accuracy. We found 97% were correctly identified by the observers. Incorrect species (n = 111) identities came from 13 observers, of which ~50% (n = 52) were by one observer, who had contributed >1,800 observations. The incorrectly-identified animals included 33 species, with the most commonly misidentified species being Western Gray Squirrel (n = 12) and the most commonly misidentified groups being birds (n = 30) and small mammals (n = 28).
Locational accuracy was measured for a subset of observations (n = 552) with images with embedded location information contained in Exif metadata (e.g., from an iPhone with GPS enabled). Perpendicular distance was measured between the automated location from the smartphone image and the location identified by the same observer placing an observation point upon a map. The median distance from the image-based location and the form-based location was 13.6 m, with 20% of differences being <1 m and 6% >1 km. The rate of large errors (>1 km difference) dropped from 9% of images in 2011 to 0% in 2016. We were not able to determine if the source of the difference between location mapped by the user in the online system and the location obtained from image Exif data was due to observer error, or failure of the user-activated phone to locate itself accurately using GPS or cell-tower triangulation.
Discussion
We demonstrate that formal and accurate reporting of occurrences of wildlife across a broad taxonomic range can occur at the scale of US states, using standardized informatics methods, and validation protocols. The almost perfect species-identification accuracy (97%) may be high enough for most or all management and analytical purposes. This accuracy rate is certainly at the high end of the range for volunteer scientists and trained observers with broad taxonomic target sets (Delaney et al., 2008; Somaweera et al., 2010; Gardiner et al., 2012; Tillett et al., 2012; Ratnieks et al., 2016). Within each state (CA and ME), the systems described here represent the most extensive and taxonomically-broad terrestrial vertebrate monitoring effort, providing information about herpetofauna, birds, and mammals. An important quality of our systems is that even with a rather restricted data domain (road-associated wildlife observations) and very limited budget, we not only were able to attract enough people to create a useful dataset, but also received a high proportion of apparently correct entries from a population with a moderate proportion of professional qualification. Opportunistic wildlife observations in our systems may provide the raw data for presence-only wildlife distribution modeling, statistical analyses of proximate contributors to wildlife-vehicle collisions, minimizing road impacts on wildlife movement, potentially extensive validation of wildlife-distribution models, and estimation of contemporary effects of climate change. Directed censusing of wildlife at index sites using consistent methods and levels of effort (e.g., as conducted by Maine Audubon using our ME system) could provide a mechanism for measuring changes in presence/absence over time (years) and, in the case of wildlife-vehicle collisions, could also provide a way to calculate minimum estimates of the impact of this cause of animal mortality.
Volunteer Scientists
We demonstrate here that a network of volunteer observers can be established at the US state-scale and provide wildlife occurrence information which is useful in understanding impacts of transportation and carrying out certain ecological studies. We found that the availability of a web-system encouraged a large and diverse population of volunteers to report observations and to stay retained as observers. In CA we observed a gradual downward trend in rates of observation, which could be related to a persistent drought in California (i.e., causing declines in wildlife) or the level of engagement with volunteers, such as with face-to-face interactions, which are important for volunteer engagement (Cappa et al., 2016). We also found that the rates of identification-accuracy were high at the species level, which may be related to the high rate of involvement of professional scientists in our systems. It will be worth re-examining these findings periodically to see if the systems are sustainable and contribute valuable scientific information.
Environmental Informatics
We demonstrated that rule-based environmental informatics could be combined with state-scale volunteer observer networks to provide important data about biodiversity and impacts from traffic. Volunteer science-based informatics tools provide repositories for collective knowledge and databases that may be useful in understanding environmental issues across large geographies. For environmental informatics systems, there is a general need for more standardized data access, so that other data-intensive research programs can utilize these data, either through a graphical user interface (for humans), or a machine accessible format for automated processes (Horsburgh et al., 2009). Using observation systems such as the ones we have developed and described at continental scales and broad taxonomic sets will permit exploration of spatial distributions and interactions across scales heretofore unavailable to ecological and biogeographic research (Dickinson et al., 2010). This is recognizing that spatial distributions and activities of volunteers may inject spatial bias in observation richness, which would need to be controlled for Geldmann et al. (2016). A critical need is for academic and agency data-users to encourage and support this type of approach, which will radically expand the data available for wildlife management and conservation.
Observation Accuracy
One possible concern about volunteer science observations is that they will tend to be biased and inaccurate. In limited studies, volunteer scientists have been shown to provide observations that are of verifiable and comparable quality to institutional scientists (Fore et al., 2001; Davis and Howard, 2005; Ryder et al., 2010; Kremen et al., 2011; Ratnieks et al., 2016). For example, for bird nest survival rates in Washington D.C., models that incorporated observer effect showed no significant difference in monitoring nests between Smithsonian biologists and volunteer scientists (Ryder et al., 2010). In the present study, observers self-reported high levels of certainty (84% high confidence) in their own observations and for the most part were correct in that assessment, with accuracy of identification to the species level of 97% for records with associated photographs. That being said, the potential exists that observations with photographs are somehow different from those without and accuracy rates could be different between observations with and without photographs. The rate of accuracy reported here is comparable to the highest reported in the literature, which are usually for trained volunteers (e.g., Ratnieks et al., 2016).
Locational accuracy is very important for wildlife observations, especially of roadkilled animals (Gunson et al., 2009) where accuracy rates of <1 km are important in developing models of causes of roadkill (Kinley and Newhouse, 2009). We did not field-verify location accuracy of live or dead wildlife observations; however, we did find that observers who took pictures of carcasses accurately placed observations on a dynamic map, relative to the position obtained from smartphone GPS. Although this indicator of spatial accuracy of roadkill observations is only a surrogate for field-verification, the high median locational accuracy (±14m) suggests care in recording spatial location of the observation. A caveat to the comparison of the two methods for determining observation location is that the GPS on smartphones have a limited antenna, and in complicated settings (e.g., urban, forest, valleys) may require several minutes to communicate with enough satellites to accurately estimate position (Pesyna et al., 2014) which still may be off by 10–20 m (Zandbergen, 2009). The best approach for wildlife observation recording may be a combination of GPS-enabled smartphones and confirmation using online maps.
Participatory Ecological Modeling
Data from the statewide wildlife observation systems described here belong to the community of users who pool their resources into creating a rich observation database and can download the data for their own research. It will be important to plan for maintenance of the large-scale volunteer networks and informatics systems that provide these wildlife observations. It will also be important to encourage integration and compatibility among taxonomically and/or geographically overlapping systems in order to encourage the formation of a “wildlife observation network” that provides scientists, managers, and the public with information about wildlife. These federated, standardized systems of wildlife observations will be instrumental in understanding and monitoring large-scale ecological characteristics and processes, such as extensive, taxonomically-focused monitoring (e.g., Gardiner et al., 2012), conservation success (Homayoun and Blair, 2016; Miller et al., 2017), changes in species distributions (Mair et al., 2016), mammalian invasions (Maistrello et al., 2016; Courchamp et al., 2017), and changes in species occurrence and abundance in response to climate change.
Governing Systems Decision-Support
Wildlife monitoring across broad taxonomies is seldom carried out at the US state scale. Doing this requires a standard data collection and management protocol and a group of people funded or willing to do it. We propose a volunteer science and informatics-based approach, as described here, to augment often-underfunded state and federal agency efforts. The system should support expanded and continued volunteer enrollment, to allow for turn-over, and include verification approaches to ensure data quality. The resulting data could be of high enough quality to become an important part of each state's corporate database for wildlife distributions. In the case of live and dead wildlife observations along roadways, this would aid in developing mitigation strategies for potential and actual wildlife-vehicle collision hotspots (Shilling and Waetjen, 2016). An added advantage of instituting crowd-sourced data collection associated with transportation is to introduce democratic process to what is a traditionally closed decision-loop. This democratization is likely to increase sustainability and public inclusion (Irwin, 1995; Bäckstrand, 2003), a stated goal of most transportation organizations and other government agencies.
While this study addresses assessing and mapping wildlife observations along roads, the informatics approach is broadly applicable to detecting anthropogenic changes in other natural systems. In many cases, such as new infestations of invasive species or communicable diseases, rapid response is needed, but early detection is unlikely without a network of observers much wider than the professional communities (Peterson and Vieglais, 2001 tell this story for the Asian Longhorn Beetle). The common features include geographically-widespread systems and attributes, who-where-what-when-how components of observations, sudden events, and amateur enthusiasts.
Guidelines for Similar Systems
The following are guidelines for the development and implementation of wildlife-observation systems relying on volunteer contributions. They are based on our experience over the last 8 years with the systems and volunteers described here.
(1) Start with an idea of possible uses of the data being collected. In our case, we wanted to inform both specific improvements to the transportation system to reduce impacts on wildlife and to provide data for long-term studies of individual species and communities of wildlife across a large area.
(2) Use standard data formats, types, and informatics model and keep data entry forms as simple as possible. We provide a data model here based on the common need for “where,” “what,” “when,” “why,” and “who” types of information about observations. We suggest anyone designing a new system use existing systems such as ours to organize data and develop aspects such as controlled vocabularies for completing observation forms.
(3) Begin with and continue with a plan to communicate with and include volunteers. Recruitment and retention of volunteers is the cornerstone for successful observation projects and is most easily done by showing the use of data in management (see below), and mention of the system in news media.
(4) Periodically demonstrate utility of the observation data to meet project goals. Volunteers are often involved in order to contribute to wildlife conservation and will stay interested if their data are being used and they understand the need for their contributions. In addition, for ecologists, engineers, and others to trust and use the data, the accuracy and reliability of the data should be demonstrated.
In addition to these steps, to construct a service similar to those described here, one needs: identification materials for the target system (here, wildlife species), an interactive mapping service, a set of menu choices for the attributes that will be most useful in interpreting and filtering observations, capabilities for uploading, and managing photographs, and methods for providing satisfaction, data-sharing, and visualizations for volunteer observers. With these features such a system is scalable, relatively interoperable with global datasets such as the Global Biodiversity Information Facility and readily combined with other mapped systems to estimate risks and benefits of alternate management and policy approaches over large landscapes.
Author Contributions
Both authors contributed to the conception and design of the work described, shared in drafting and revising the manuscript, approved of the final version, and are equally accountable for all aspects of the work.
Funding
Partial support from Maine Audubon and Together Green for development of the Maine web-site. Remainder volunteer effort by authors.
Conflict of Interest Statement
The authors declare that the research was conducted in the absence of any commercial or financial relationships that could be construed as a potential conflict of interest.
Acknowledgments
The authors give a very special thanks to Dr. Doug Long, formerly of the Oakland Museum of California for his many roadkill observations and his help with species identity verification. The authors would also like to thank Barbara Charry, formerly of Maine Audubon for her suggestions and contributions to the Maine observation site and to Maine Audubon and Together Green for partial funding for development of the Maine web-site. The remaining effort was contributed by the authors as volunteers. The authors would also like to thank the volunteer observers who have contributed observations to the project. The authors also appreciate the careful comments of two reviewers and the editor.
References
Bäckstrand, K. (2003). Civic science for sustainability: reframing the role of experts, policy-makers and citizens in environmental governance. Glob. Environ. Pol. 3, 24–41. doi: 10.1162/152638003322757916
Bang, C., and Faeth, S. H. (2011). Variation in arthropod communities in response to urbanization: seven years of arthropod monitoring in a desert city. Land. Urb. Plan. 103, 383–399. doi: 10.1016/j.landurbplan.2011.08.013
Bonney, R., Cooper, C. B., Dickinson, J., Kelling, S., Phillips, T., Rosenberg, K. V., et al. (2009). Citizen science: a developing tool for expanding science knowledge and scientific literacy. BioScience 59, 977–984. doi: 10.1525/bio.2009.59.11.9
Bowser, A., and Shanley, L. (2013). New Visions in Citizen Science. Washington, DC: Woodrow Wilson International Center for Scholars.
Cappa, F., Laut, J., Nov, O., Giustiniano, L., and Porfiri, M. (2016). Activating social strategies: face-to-face interaction in technology-mediated citizen science. J. Environ. Manage. 182, 374–384. doi: 10.1016/j.jenvman.2016.07.092
Ceccaroni, L., Bowser, A., and Brenton, P. (2016). “Civic education and citizen science: definitions, categories, knowledge representation,” in Analyzing the Role of Citizen Science in Modern Research, eds L. Ceccaroni and J. Piera (Hershey, PA: IGI Global), 1–23.
Conrad, C. C., and Hilchey, K. G. (2010). A review of citizen science and community-based environmental monitoring: issues and opportunities. Environ. Mon. Assess. 176, 273–291. doi: 10.1007/s10661-010-1582-5
Cooper, C. B., Dickinson, J., Philips, T., and Bonney, R. (2007). Citizen science as a tool for conservation in residential ecosystems. Ecol. Soc. 12:11. doi: 10.5751/ES-02197-120211
Corona, P., Chirici, G., McRoberts, R. E., Winter, S., and Barbarti, A. (2011). Contribution of large-scale forest inventories to biodiversity assessment and monitoring. For. Ecol. Manage. 262, 2061–2069. doi: 10.1016/j.foreco.2011.08.044
Courchamp, F., Fournier, A., Bellard, C., Bertelsmeier, C., Bonnaud, E., Jeschke, J. M., et al. (2017). Invasion biology: specific problems and possible solutions. Trends Ecol. Evol. 32, 13–22. doi: 10.1016/j.tree.2016.11.001
Davis, A. K., and Howard, E. (2005). Spring recolonization rate of monarch butterflies in eastern North America: new estimates from citizen-science data. J. Lep. Soc. 59, 1–5.
Delaney, D. G., Sperling, C. D., Adams, C. S., and Leung, B. (2008). Marine invasive species: validation of citizen science and implications for national monitoring networks. Biol. Invasions 10, 117–128. doi: 10.1007/s10530-007-9114-0
Devictor, V., Whittaker, R. J., and Beltrame, C. (2010). Beyond scarcity: citizen science programmes as useful tools for conservation biogeography. Div. Dist. 16, 354–362. doi: 10.1111/j.1472-4642.2009.00615.x
Dickinson, J. L., Zuckerberg, B., and Bonter, D. N. (2010). Citizen science as an ecological research tool: challenges and benefits. Ann. Rev. Ecol. Evol. Syst. 41, 149–172. doi: 10.1146/annurev-ecolsys-102209-144636
Fore, L. S., Paulsen, K., and O'Laughlin, K. (2001). Assessing the performance of volunteers in monitoring streams. Freshwater Biol. 46, 109–123. doi: 10.1111/j.1365-2427.2001.00640.x
Gardiner, M. M., Allee, L. L., Brown, P. M. J., Losey, J. E., Roy, H. E., and Smyth, R. R. (2012). Lessons from lady beetles: accuracy of monitoring data from US and UK citizen-science programs. Front. Ecol. Environ. 10, 471–476. doi: 10.1890/110185
Geldmann, J., Heilmann-Clausen, J., Holm, T. E., Levinsky, I., Markussen, B., Olsen, K., et al. (2016). What determines spatial bias in citizen science? Exploring four recording schemes with different proficiency requirements. Diversity Distrib. 22, 1139–1149. doi: 10.1111/ddi.12477
Goodchild, M. F. (2007). Citizens as sensors: the world of volunteered geography. GeoJ 69, 211–221. doi: 10.1007/s10708-007-9111-y
Gunson, K. E., Clevenger, A. P., Ford, A. T., Bissonette, J. A., and Hardy, A. (2009). A comparison of data sets varying in spatial accuracy used to predict the occurrence of wildlife-vehicle collisions. Environ. Manage. 44, 268–277. doi: 10.1007/s00267-009-9303-y
Haklay, M. (2013). “Citizen Science and Volunteered Geographic Information—overview and typology of participation,” in Crowdsourcing Geographic Knowledge: Volunteered Geographic Information (VGI) in Theory and Practice, eds D. Z. Sui, S. Elwood, and M. F. Goodchild (Berlin: Springer), 105–122.
Harris, D., Smith, D., O'Neil, C., and Severinsen, J. (2016). The Role of Real-Time Crowdsourced Information and Technology in Supporting Traveller Information and Network Efficiency. NZ Transport Agency research report 593, 116
Homayoun, T. Z., and Blair, R. B. (2016). Value of park reserves to migrating and breeding landbirds in an urban important bird area. Urban Ecosy. 19, 1579–1596. doi: 10.1007/s11252-015-0437-9
Horsburgh, J. S., Tarboton, D. G., Piasecki, M., Maidment, D. R., Zaslavsky, I., Valentine, D., et al. (2009). An integrated system for publishing environmental observations data. Environ. Mod. Soft. 24, 879–888. doi: 10.1016/j.envsoft.2009.01.002
Irwin, A. (1995). Citizen Science: A Study of People, Expertise and Sustainable Development. London: Routledge.
Kelling, S., Hochachka, W. M., Fink, D., Riedewald, M., Caruana, R., Ballard, G., et al. (2009). Data-intensive science: a new paradigm for biodiversity studies. BioScience 59, 613–620. doi: 10.1525/bio.2009.59.7.12
Kinley, T. A., and Newhouse, N. J. (2009). Badger roadkill risk in relation to the presence of culverts and jersey barriers. Northwest. Sci. 83, 148–153. doi: 10.3955/046.083.0206
Kremen, C., Ullmann, K. S., and Thorp, R. W. (2011). Evaluating the quality of citizen-scientist data on pollinator communities. Conserv. Biol. 25, 607–617. doi: 10.1111/j.1523-1739.2011.01657.x
Mair, L., Harrison, P. J., Jonsson, M., Lobel, S., Norden, J., Siitonen, J., et al. (2016). Evaluating citizen science data for forecasting species responses to national forest management. Ecol. Evol. 7, 368–378. doi: 10.1002/ece3.2601
Maistrello, L., Dioli, P., Bariselli, M., Mazzoli, G. L., and Giacalone-Forini, I. (2016). Citizen science and early detection of invasive species: phenology of first occurrences of Halyomorpha halys in Southern Europe. Biol. Invasions 18, 3109–3116. doi: 10.1007/s10530-016-1217-z
Miller, M. W., Leech, D. I., Pearce-Higgins, J. W., and Robinson, R. A. (2017). Multi-state, multi-stage modeling of nest-success suggests interaction between weather and land-use. Ecology 98, 175–186. doi: 10.1002/ecy.1629
Pesyna, K. M. Jr., Heath R. W. Jr., and Humphreys, T. E. (2014). “Centimeter positioning with a smartphone-Quality GNSS antenna,” in Proceedings of the 27th International Technical Meeting of the Satellite Division of the Institute of Navigation, ION GNSS 2014, (Tampa) 2, 1568–1577.
Peterson, A. T., and Vieglais, D. A. (2001). Predicting species invasions using ecological niche modeling: new approaches from bioinformatics attack a pressing problem. BioScience 51, 363–701. doi: 10.1641/0006-3568(2001)051[0363:PSIUEN]2.0.CO;2
Ratnieks, F. L. W., Schrell, F., Rebecca, C., Sheppard, E. B., Bristow, O. E., and Garbuzov, M. (2016). Data reliability in citizen science: learning curve and the effects of training method, volunteer background and experience on identification accuracy of insects visiting ivy flowers. Methods Ecol. Evol. 7, 1226–1235. doi: 10.1111/2041-210X.12581
Reichman, O. J., Jones, M. B., and Schildhauer, M. P. (2011). Challenges and opportunities of open data in ecology. Science 331, 703–705. doi: 10.1126/science.1197962
Roy, H. E., Pocock, M. J. O., Preston, C. D., Roy, D. B., Savage, J., Tweddle, J. C., et al. (2012). Understanding Citizen Science and Environmental Monitoring. Final Report on behalf of UK Environmental Observation Framework. UK Environmental Observation Framework. Available online at: https://www.ceh.ac.uk/sites/default/files/citizensciencereview.pdf
Ryder, T. B., Reitsma, R., Evans, B., and Marra, P. P. (2010). Quantifying avian nest survival along an urbanization gradient using citizen- and scientist-generated data. Ecol. Appl. 20, 419–426. doi: 10.1890/09-0040.1
Shilling, F. M., and Waetjen, D. P. (2016). Impact of Wildlife-Vehicle Conflict on Drivers and Animals. Special Report of the Road Ecology Center. Available online at: http://www.wildlifecrossing.net/california/files/xing/CA_WVC_Hotspots_2016.pdf
Shilling, F. M., Perkins, S., and Collinson, W. (2015). “Wildlife/roadkill observation and reporting systems,” in Handbook of Road Ecology, eds R. van der Ree, D. J. Smith, and C. Grilo (Oxford: John Wiley & Sons), 552.
Silvertown, J. (2009). A new dawn for citizen science. Trend Ecol. Evol. 24, 467–471. doi: 10.1016/j.tree.2009.03.017
Somaweera, R., Somaweera, N., and Shine, R. (2010). Frogs under friendly fire: how accurately can the general public recognize invasive species. Biol. Conserv. 143, 1477–1484. doi: 10.1016/j.biocon.2010.03.027
Sullivan, B. L., Wood, C. L., Iliff, M. J., Bonney, R. E., Fink, D., and Kelling, S. (2009). eBird: a citizen-based bird observation network in the biological sciences. Biol. Conserv. 142, 2282–2292. doi: 10.1016/j.biocon.2009.05.006
Tillett, B. J., Field, I. C., Bradshaw, C. J. A., Johnson, G., Buckworth, R. C., Meekan, M. G., et al. (2012). Accuracy rates of species identification by fisheries observers in a north Australian shark fishery. Fish. Res. 127–128, 109–115. doi: 10.1016/j.fishres.2012.04.007
Wieczorek, J., Bloom, D., Guralnick, R., Blum, S., Döring, M., Giovanni, R., et al. (2012). Darwin core: an evolving community-developed biodiversity data standard. PLoS ONE 7:e29715. doi: 10.1371/journal.pone.0029715
Keywords: volunteer science, roadkill, wildlife-vehicle-collision, informatics, crowdsource
Citation: Waetjen DP and Shilling FM (2017) Large Extent Volunteer Roadkill and Wildlife Observation Systems as Sources of Reliable Data. Front. Ecol. Evol. 5:89. doi: 10.3389/fevo.2017.00089
Received: 01 March 2017; Accepted: 18 July 2017;
Published: 07 August 2017.
Edited by:
Eric Guinard, Centre d'Etudes et d'Expertise sur les Risques, l'Environnement, la Mobilité et l'Aménagement, FranceReviewed by:
Iryna Dronova, University of California, Berkeley, United StatesAdam James Bates, Nottingham Trent University, United Kingdom
Copyright © 2017 Waetjen and Shilling. This is an open-access article distributed under the terms of the Creative Commons Attribution License (CC BY). The use, distribution or reproduction in other forums is permitted, provided the original author(s) or licensor are credited and that the original publication in this journal is cited, in accordance with accepted academic practice. No use, distribution or reproduction is permitted which does not comply with these terms.
*Correspondence: Fraser M. Shilling, fmshilling@ucdavis.edu